

The DOI matches its Crossref record; 50 of the 51 references it cites were found in a registry or an index.
A Wide Diversity of Cortical GABAergic Interneurons Derives from the Embryonic Preoptic Area
Open accessAbstract
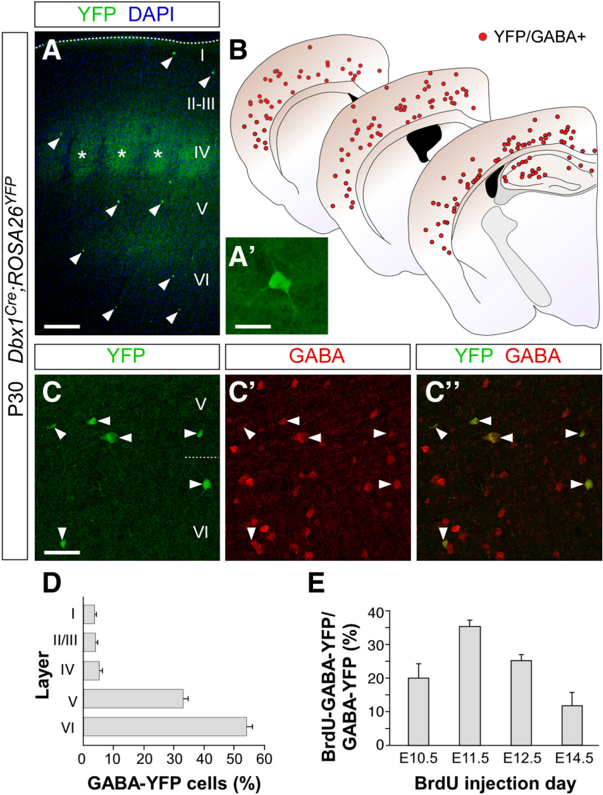
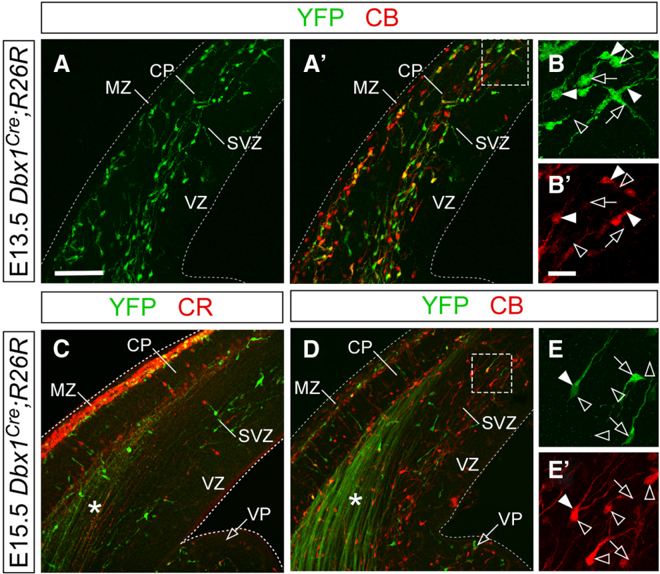
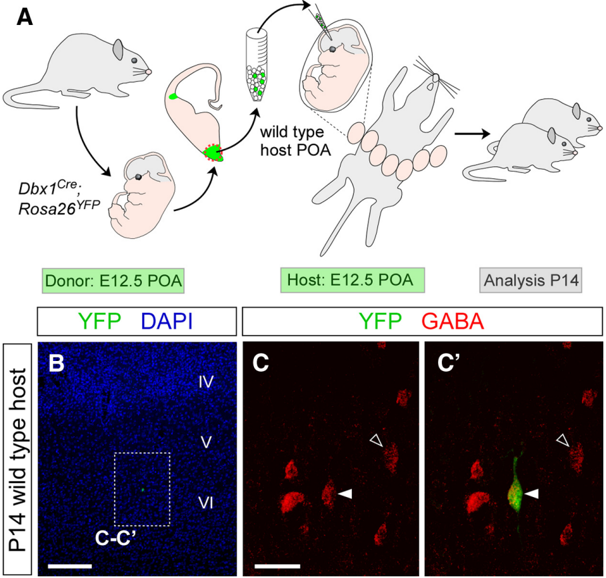
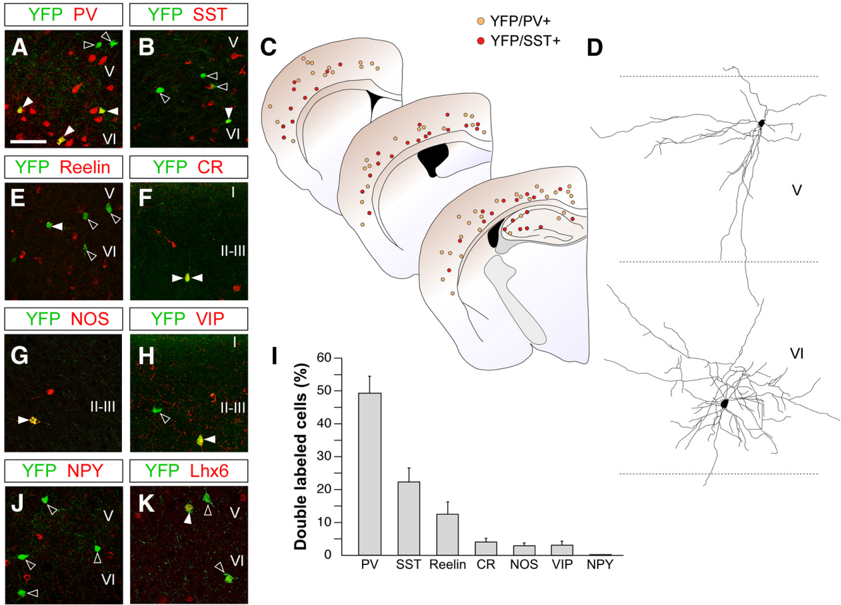
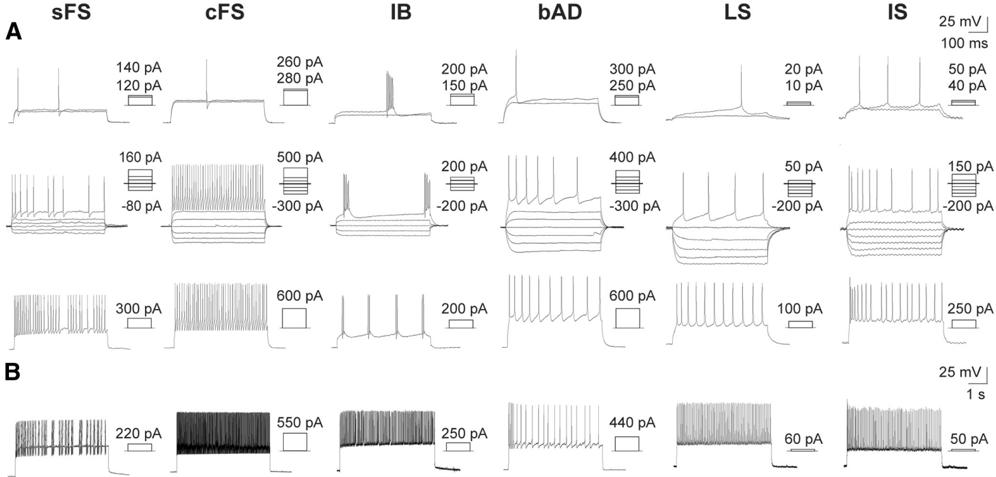
GABA-containing (GABAergic) interneurons comprise a very heterogeneous group of cells that are crucial for cortical function. Different classes of interneurons specialize in targeting specific subcellular domains of excitatory pyramidal cells or other interneurons, which provides cortical circuits with an enormous capability for information processing. As in other regions of the CNS, cortical interneuron diversity is thought to emerge from the genetic specification of different groups of progenitor cells within the subpallium. Most cortical interneurons originate from two main regions, the medial and the caudal ganglionic eminences (MGE and CGE, respectively). In addition, it has been shown that progenitors in the embryonic preoptic area (POA) also produce a small population of cortical GABAergic interneurons. Here, we show that the contribution of the POA to the complement of cortical GABAergic interneurons is larger than previously believed. Using genetic fate mapping and in utero transplantation experiments, we demonstrate that Dbx1-expressing progenitor cells in the POA give rise to a small but highly diverse cohort of cortical interneurons, with some neurochemical and electrophysiological characteristics that were previously attributed to MGE- or CGE-derived interneurons. There are, however, some features that seem to distinguish POA-derived interneurons from MGE- or CGE-derived cells, such as their preferential laminar location. These results indicate that the mechanisms controlling the specification of different classes of cortical interneurons might be more complex than previously expected. Together with earlier findings, our results also suggest that the POA generates nearly 10% of the GABAergic interneurons in the cerebral cortex of the mouse.
Overview
The claims and statistics of this paper haven’t been checked yet.
Run the check — free, no account needed. It reads the open-access text and checks the sources it cites.
Integrity signals
Registry
Cites
Statistics
Figures
Verification
Claims the paper makes
The claims and statistics of this paper haven’t been checked yet.
Run the check — free, no account needed. It reads the open-access text and checks the sources it cites.
Claims other papers make about this one
Each is checked against this paper’s own text: does it say what the citing paper says it does?
The source backs part of the claim, not all of it — or backs it for a different population, condition or comparison.
In the citing paper
“The POA is estimated to produce ~10% of neocortical and hippocampal interneurons”
From Hippocampal GABAergic Inhibitory Interneurons (2017) · cites this paper as [389]
Experimental — accuracy not yet measuredIn the citing paper
“The MGE and adjacent POA generate virtually all interneurons in the SST+ and PV+ classes”
From Development and Functional Diversification of Cortical Interneurons (2018) · cites this paper as Gelman et al., 2011
In the citing paper
“Mature cortical interneurons derived from the POA are highly diverse consisting of small fractions of PV-, SST-, NPY-, and reelin-expressing interneurons”
From Hippocampal GABAergic Inhibitory Interneurons (2017) · cites this paper as [389]
In the citing paper
“GIFM studies using Dbx1-Cre mice revealed that the ventral POA region generates minor populations of deep PV- and SST-expressing interneurons”
From Hippocampal GABAergic Inhibitory Interneurons (2017) · cites this paper as [389]
In the citing paper
“most interneuron precursors emerging from the POA do not rely on downstream activation of Lhx6 to specify PV and SST interneurons”
From Hippocampal GABAergic Inhibitory Interneurons (2017) · cites this paper as [389]
In the citing paper
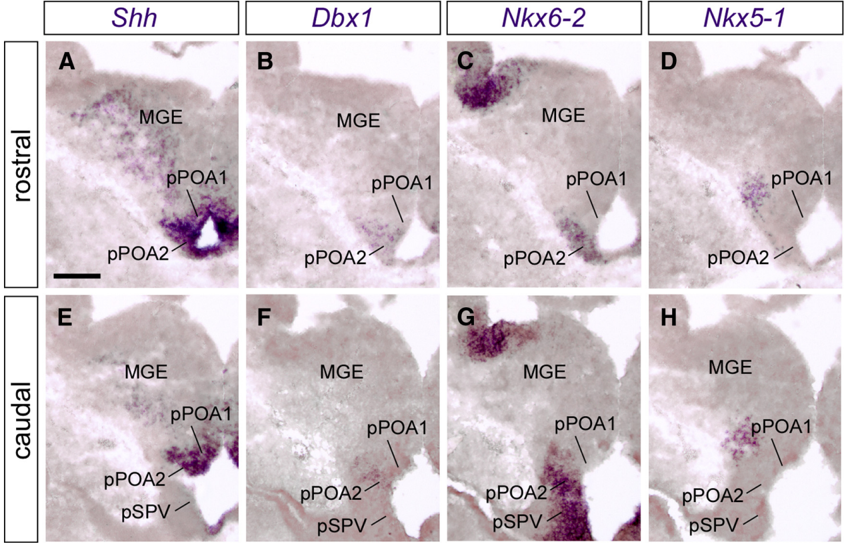
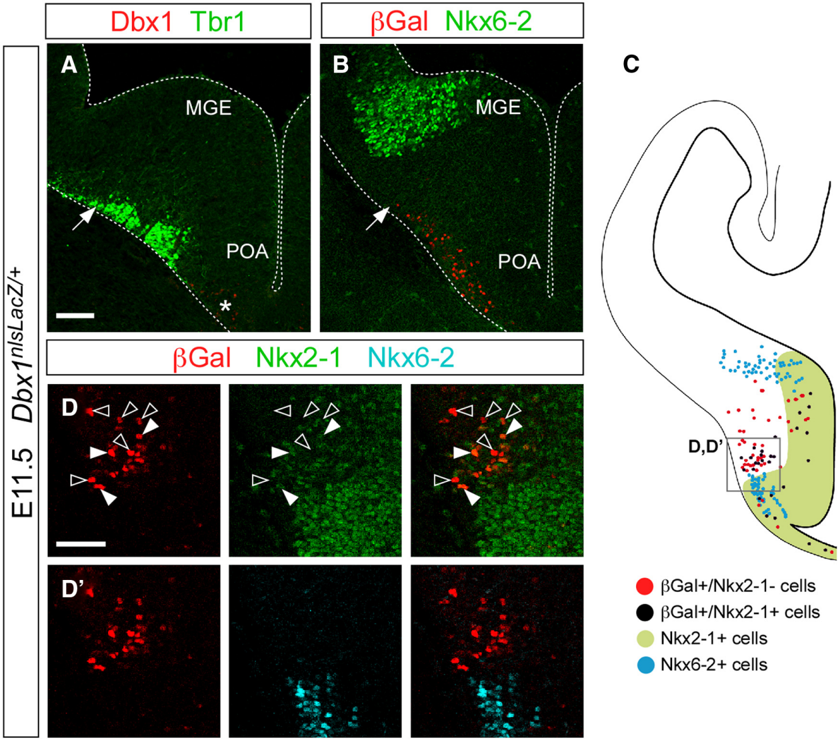
“Two subdomains are found in the POA based on nonoverlapping expression profiles for Dbx1 and Nkx5.1”
From Hippocampal GABAergic Inhibitory Interneurons (2017) · cites this paper as [389]
Self-check
Percentages, sums and reported differences re-computed from the paper’s own numbers.
The self-check needs the paper’s full text.
Citations
Cites
Interneurons of the hippocampus
Freund, T. F., & Buzsáki, G. (1998) · Hippocampus · doi:10.1002/(sici)1098-1063(1996)6:4 · Cited by 3,478
Cre reporter strains produced by targeted insertion of EYFP and ECFP into the ROSA26 locus
Srinivas, S., Watanabe, T., Lin, C.-S., William, C. M., Tanabe, Y., Jessell, T. M., & Costantini, F. (2001) · BMC Developmental Biology · doi:10.1186/1471-213x-1-4 · Cited by 3,121
Interneurons of the neocortical inhibitory system
Markram, H., Toledo-Rodriguez, M., Wang, Y., Gupta, A., Silberberg, G., & Wu, C. (2004) · Nature Reviews Neuroscience · doi:10.1038/nrn1519 · Cited by 2,954
Neuronal specification in the spinal cord: inductive signals and transcriptional codes
Jessell, T. M. (2000) · Nature Reviews Genetics · doi:10.1038/35049541 · Cited by 2,089
Neuronal Diversity and Temporal Dynamics: The Unity of Hippocampal Circuit Operations
Klausberger, T., & Somogyi, P. (2008) · Science · doi:10.1126/science.1149381 · Cited by 2,050
Petilla terminology: nomenclature of features of GABAergic interneurons of the cerebral cortex
The Petilla Interneuron Nomenclature Group (PING) (2008) · Nature Reviews Neuroscience · doi:10.1038/nrn2402 · Cited by 1,491
Interneuron Migration from Basal Forebrain to Neocortex: Dependence on Dlx Genes
Anderson, S. A., Eisenstat, D. D., Shi, L., & Rubenstein, J. L. R. (1997) · Science · doi:10.1126/science.278.5337.474 · Cited by 1,462
Briscoe, J., Pierani, A., Jessell, T. M., & Ericson, J. (2000) · Cell · doi:10.1016/s0092-8674(00)80853-3 · Cited by 1,111
Self-citationA long, remarkable journey: Tangential migration in the telencephalon
Marín, Ó., & Rubenstein, J. L. R. (2001) · Nature reviews. Neuroscience · doi:10.1038/35097509 · Cited by 1,077
The origin and specification of cortical interneurons
Wonders, C. P., & Anderson, S. A. (2006) · Nature Reviews Neuroscience · doi:10.1038/nrn1954 · Cited by 980 · cited 8×
“Collectively, the MGE and the CGE are the origin of 90% of the GABAergic interneurons in the cerebral cortex (Wonders and Anderson, 2006; Batista-Brito and Fishell, 2009; Rubin et al., 2010).”
BackgroundInfluentialDefined types of cortical interneurone structure space and spike timing in the hippocampus
Somogyi, P., & Klausberger, T. (2005) · The Journal of Physiology · doi:10.1113/jphysiol.2004.078915 · Cited by 927
Sussel, L., Marin, O., Kimura, S., & Rubenstein, J. L. R. (1999) · Development · doi:10.1242/dev.126.15.3359 · Cited by 873
Lavdas, A. A., Grigoriou, M., Pachnis, V., & Parnavelas, J. G. (1999) · The Journal of Neuroscience · doi:10.1523/jneurosci.19-18-07881.1999 · Cited by 765
Dessaud, É., McMahon, A. P., & Briscoe, J. (2008) · Development · doi:10.1242/dev.009324 · Cited by 759
Wichterle, H., Turnbull, D. H., Nery, S., Fishell, G., & Alvarez-Buylla, A. (2001) · Development · doi:10.1242/dev.128.19.3759 · Cited by 722
Origins of Cortical Interneuron Subtypes
Xu, Q., Cobos, I., De La Cruz, E., Rubenstein, J. L., & Anderson, S. A. (2004) · The Journal of Neuroscience · doi:10.1523/jneurosci.5667-03.2004 · Cited by 639
Lee, S., Hjerling-Leffler, J., Zagha, E., Fishell, G., & Rudy, B. (2010) · The Journal of Neuroscience · doi:10.1523/jneurosci.1869-10.2010 · Cited by 600
The temporal and spatial origins of cortical interneurons predict their physiological subtype
Butt, S. J. B., Fuccillo, M., Nery, S., Noctor, S., Kriegstein, A., Corbin, J. G., & Fishell, G. (2005) · Neuron · doi:10.1016/j.neuron.2005.09.034 · Cited by 587
Flames, N., Pla, R., Gelman, D. M., Rubenstein, J. L. R., Puelles, L., & Marín, O. (2007) · The Journal of Neuroscience · doi:10.1523/jneurosci.2750-07.2007 · Cited by 560
Self-citationMiyoshi, G., Hjerling-Leffler, J., Karayannis, T., Sousa, V. H., Butt, S. J. B., Battiste, J., Johnson, J. E., Machold, R. P., & Fishell, G. (2010) · The Journal of Neuroscience · doi:10.1523/jneurosci.4515-09.2010 · Cited by 559
The caudal ganglionic eminence is a source of distinct cortical and subcortical cell populations
Nery, S., Fishell, G., & Corbin, J. G. (2002) · Nature Neuroscience · doi:10.1038/nn971 · Cited by 558
DeFelipe, J. (1997) · Journal of Chemical Neuroanatomy · doi:10.1016/s0891-0618(97)10013-8 · Cited by 550
Young neurons from medial ganglionic eminence disperse in adult and embryonic brain
Wichterle, H., Garcia-Verdugo, J. M., Herrera, D. G., & Alvarez-Buylla, A. (1999) · Nature Neuroscience · doi:10.1038/8131 · Cited by 506
Multiple origins of Cajal-Retzius cells at the borders of the developing pallium
Bielle, F., Griveau, A., Narboux‐Nême, N., Vigneau, S., Sigrist, M., Arber, S., Wassef, M., & Pierani, A. (2005) · Nature Neuroscience · doi:10.1038/nn1511 · Cited by 478
Self-citationGsh2 and Pax6 play complementary roles in dorsoventral patterning of the mammalian telencephalon
Yun, K., Potter, S., & Rubenstein, J. L. R. (2001) · Development · doi:10.1242/dev.128.2.193 · Cited by 449
Fogarty, M., Grist, M., Gelman, D., Marín, O., Pachnis, V., & Kessaris, N. (2007) · The Journal of Neuroscience · doi:10.1523/jneurosci.1629-07.2007 · Cited by 412
Self-citationMiyoshi, G., Butt, S. J. B., Takebayashi, H., & Fishell, G. (2007) · The Journal of Neuroscience · doi:10.1523/jneurosci.1807-07.2007 · Cited by 400
Kawaguchi, Y., & Kondo, S. (2002) · Journal of Neurocytology · doi:10.1023/a:1024126110356 · Cited by 395
Control of Interneuron Fate in the Developing Spinal Cord by the Progenitor Homeodomain Protein Dbx1
Pierani, A., Moran-Rivard, L., Sunshine, M. J., Littman, D. R., Goulding, M., & Jessell, T. M. (2001) · Neuron · doi:10.1016/s0896-6273(01)00212-4 · Cited by 388
Self-citationLiodis, P., Denaxa, M., Grigoriou, M., Akufo-Addo, C., Yanagawa, Y., & Pachnis, V. (2007) · The Journal of Neuroscience · doi:10.1523/jneurosci.3055-06.2007 · Cited by 377
Telencephalic cells take a tangent: non-radial migration in the mammalian forebrain
Corbin, J. G., Nery, S. V., & Fishell, G. (2001) · Nature Neuroscience · doi:10.1038/nn749 · Cited by 304
Transcriptional networks regulating neuronal identity in the developing spinal cord
Lee, S., & Pfaff, S. L. (2001) · Nature Neuroscience · doi:10.1038/nn750 · Cited by 290
Preferential Origin and Layer Destination of GAD65-GFP Cortical Interneurons
López‐Bendito, G. (2004) · Cerebral Cortex · doi:10.1093/cercor/bhh072 · Cited by 288
The embryonic preoptic area is a novel source of cortical GABAergic interneurons
Gelman, D. M., Martini, F. J., Nóbrega-Pereira, S., Pierani, A., Kessaris, N., & Marín, O. (2009) · The Journal of Neuroscience · doi:10.1523/jneurosci.0604-09.2009 · Cited by 280
Self-citationNóbrega-Pereira, S., Kessaris, N., Du, T., Kimura, S., Anderson, S. A., & Marín, O. (2008) · Neuron · doi:10.1016/j.neuron.2008.07.024 · Cited by 256
Medina, L. M., Legáz, I., González, G. G., Castro, F. D., Rubenstein, J. L. R., & Puelles, L. (2004) · The Journal of Comparative Neurology · doi:10.1002/cne.20141 · Cited by 244
A spatial bias for the origins of interneuron subgroups within the medial ganglionic eminence
Wonders, C. P., Taylor, L. A., Welagen, J., Mbata, I. C., Xiang, J., & Anderson, S. A. (2007) · Developmental Biology · doi:10.1016/j.ydbio.2007.11.018 · Cited by 224
Chapter 3 The Developmental Integration of Cortical Interneurons into a Functional Network
Batista‐Brito, R., & Fishell, G. (2009) · Current Topics in Developmental Biology · doi:10.1016/s0070-2153(09)01203-4 · Cited by 223
Zhao, Y., Flandin, P., Long, J. E., Cuesta, M. D., Westphal, H., & Rubenstein, J. L. R. (2008) · Journal of Comparative Neurology · doi:10.1002/cne.21772 · Cited by 207
Generation of interneuron diversity in the mouse cerebral cortex
Gelman, D. M., & Marín, O. (2010) · European Journal of Neuroscience · doi:10.1111/j.1460-9568.2010.07267.x · Cited by 188
Self-citationFlandin, P., Kimura, S., & Rubenstein, J. L. R. (2010) · The Journal of Neuroscience · doi:10.1523/jneurosci.4228-09.2010 · Cited by 176
Layer acquisition by cortical GABAergic interneurons is independent of Reelin signaling
Pla, R., Borrell, V., Flames, N., & Marín, O. (2006) · The Journal of Neuroscience · doi:10.1523/jneurosci.0245-06.2006 · Cited by 151
Self-citationIdentification of distinct telencephalic progenitor pools for neuronal diversity in the amygdala
Hirata, T., Li, P., Lanuza, G. M., Cocas, L. A., Huntsman, M. M., & Corbin, J. G. (2009) · Nature Neuroscience · doi:10.1038/nn.2241 · Cited by 151
Vucurovic, K., Gallopin, T., Ferezou, I., Rancillac, A., Chameau, P., van Hooft, J. A., Geoffroy, H., Monyer, H., Rossier, J., & Vitalis, T. (2010) · Cerebral Cortex · doi:10.1093/cercor/bhp310 · Cited by 139
Griveau, A., Borello, U., Causeret, F., Tissir, F., Boggetto, N., Karaz, S., & Pierani, A. (2010) · PLoS Biology · doi:10.1371/journal.pbio.1000440 · Cited by 133
Self-citationThree classes of GABAergic interneurons in neocortex and neostriatum.
Kubota, Y., & Kawaguchi, Y. (1994) · PubMed · Cited by 89
Rubin, A. N., Alfonsi, F., Humphreys, M. P., Choi, C. K. P., Rocha, S. F., & Kessaris, N. (2010) · The Journal of Neuroscience · doi:10.1523/jneurosci.6178-09.2010 · Cited by 87
Teissier, A., Griveau, A., Vigier, L., Piolot, T., Borello, U., & Pierani, A. (2010) · Journal of Neuroscience · doi:10.1523/jneurosci.0776-10.2010 · Cited by 77
Self-citationTeissier, A., Waclaw, R. R., Griveau, A., Campbell, K., & Pierani, A. (2011) · Cerebral Cortex · doi:10.1093/cercor/bhr122 · Cited by 42
Self-citationSoriano, E., del Rı́o, J. A., Ferrer, I., Auladell, C., de Lecea, L., & Alcántara, S. (1992) · Neuroscience Letters · doi:10.1016/0304-3940(92)90360-j · Cited by 37
Cited by
Sorted by citations
Interneuron cell types are fit to function
Kepecs, A., & Fishell, G. (2014) · Nature · doi:10.1038/nature12983 · Cited by 1,110
Hippocampal GABAergic Inhibitory Interneurons
Pelkey, K. A., Chittajallu, R., Craig, M. T., Tricoire, L., Wester, J. C., & McBain, C. J. (2017) · Physiological Reviews · doi:10.1152/physrev.00007.2017 · Cited by 889
Development and Functional Diversification of Cortical Interneurons
Lim, L., Mi, D., Llorca, A., & Marín, O. (2018) · Neuron · doi:10.1016/j.neuron.2018.10.009 · Cited by 714
“…Nr2f1 and Nr2f2 influence neuronal specification by regulating cell-cycle dynamics (Naka et al., 2008), which may explain why factors involved in the regulation of the cell cycle have also been involved in the regulation of interneuron diversity (Glickstein et al., 2007; Petros et al., 2015).”
Generating Neuronal Diversity in the Mammalian Cerebral Cortex
Lodato, S., & Arlotta, P. (2015) · Annual Review of Cell and Developmental Biology · doi:10.1146/annurev-cellbio-100814-125353 · Cited by 389
Non-epithelial stem cells and cortical interneuron production in the human ganglionic eminences
Hansen, D. V., Lui, J. H., Flandin, P., Yoshikawa, K., Rubenstein, J. L., Alvarez-Buylla, A., & Kriegstein, A. R. (2013) · Nature Neuroscience · doi:10.1038/nn.3541 · Cited by 328
Metadata
- Authors
- Gelman, D., Griveau, A., Dehorter, N., Teissier, A., Varela, C., Pla, R., Pierani, A., & Marín, O.
- Affiliations
- Consejo Superior de Investigaciones Científicas (ES)
- Centre National de la Recherche Scientifique (FR)
- Venue
- The Journal of Neuroscience
- Publisher
- Society for Neuroscience
- Published
- 2011-11-16
- Volume
- 31
- Issue
- 46
- Pages
- 16570-16580
- ISSN
- 0270-6474 (ISSN-L)
- 1529-2401
- PMC
- PMC6633309
- OpenAlex
- W1994924452
- Cited by
- 179
- References
- 51
- Citations by year
- 2026: 3 · 2025: 5 · 2024: 10 · 2023: 14 · 2022: 11 · 2021: 16 · 2020: 23 · 2019: 12 · 2018: 13 · 2017: 18 · 2016: 10 · 2015: 13 · 2014: 8 · 2013: 14 · 2012: 9
- FWCI
- 3.26
- Type
- journal article
- Language
- en
- Open access
- hybrid
- doi.org
- Licence
- Locations
- Journal of Neuroscience (publishedVersion, cc-by-nc-sa)
- PubMed Central (publishedVersion)
- PubMed (publishedVersion)
- Americanae (AECID Library) (publishedVersion, other-oa)
- HAL (submittedVersion)
- DIGITAL.CSIC (Spanish National Research Council (CSIC)) (submittedVersion)
- ANU Open Research (Australian National University) (submittedVersion)
- LA Referencia (Red Federada de Repositorios Institucionales de Publicaciones Científicas) (submittedVersion, cc-by-nc-sa)
- Funders
- Association pour la Recherche sur le Cancer
- European Commission (005139)
- Centre National de la Recherche Scientifique
- Ministerio de Ciencia e Innovación (CSD2007-00023)
- Topics
- Life Sciences › Neuroscience › Developmental Neuroscience › Neurogenesis and neuroplasticity mechanisms
- Life Sciences › Biochemistry, Genetics and Molecular Biology › Molecular Biology › Developmental Biology and Gene Regulation
- Life Sciences › Neuroscience › Cellular and Molecular Neuroscience › Neuroscience and Neuropharmacology Research
- Keywords
- GABAergic interneurons, medial ganglionic eminence, caudal ganglionic eminence, interneuron specification, laminar distribution, mouse cortex, fate mapping, in utero transplantation
- MeSH terms
- Animals, Animals, Newborn, Bacterial Proteins, Bromodeoxyuridine, Cell Movement, Electric Stimulation, Embryo, Mammalian, gamma-Aminobutyric Acid, Indoles, Interneurons, Luminescent Proteins, Membrane Potentials, Mice, Transgenic, Nerve Tissue Proteins, Preoptic Area, Proteins, Somatosensory Cortex, Homeodomain Proteins, Patch-Clamp Techniques, Gene Expression Regulation, Developmental, RNA, Untranslated, Green Fluorescent Proteins, Mice, Neural Stem Cells, In Vitro Techniques
About these checks
Registry, retraction, Cites and statistics results are computed, not judged, with one exception: a printed reference that no index lists is read once by a model before it counts as a citation error. Claims are extracted by a model and kept only when their quote appears verbatim in the text; each cited source is then checked, with a model’s help, for whether it says what the claim relies on. Those verdicts can be wrong — read the claim’s quote and the cited source before relying on one.
Statistics and arithmetic are recomputed, not judged.
Confidence bands are shown only for fields calibrated on our annotated test set. None is calibrated yet, so no band is shown.
What counts as a claim ›How we measure confidence ›How we check this ›
Are you an author, or do you see a problem with this page? Request a review
