

The DOI matches its Crossref record; 128 of the 131 references it cites were found in a registry or an index.
Effectiveness of regional DTI measures in distinguishing Alzheimer’s disease, MCI, and normal aging
Open accessAbstract
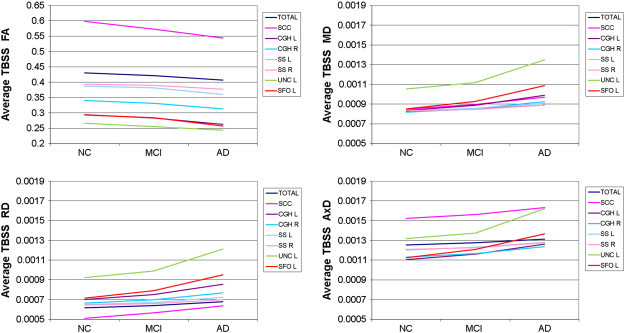
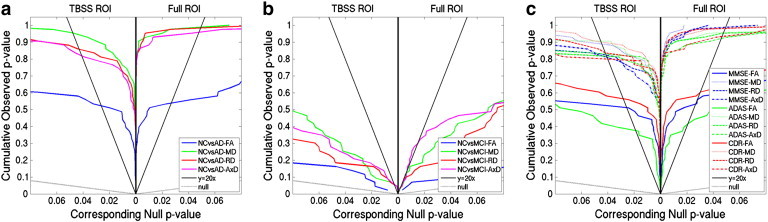
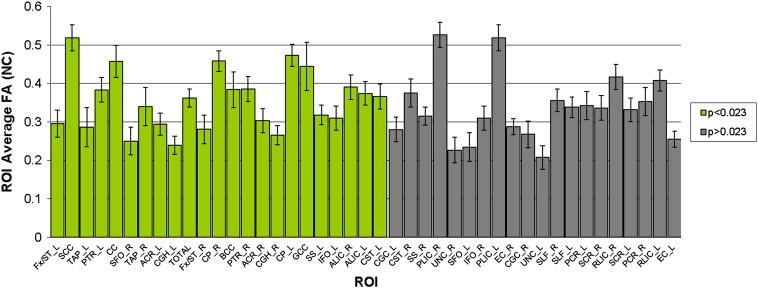
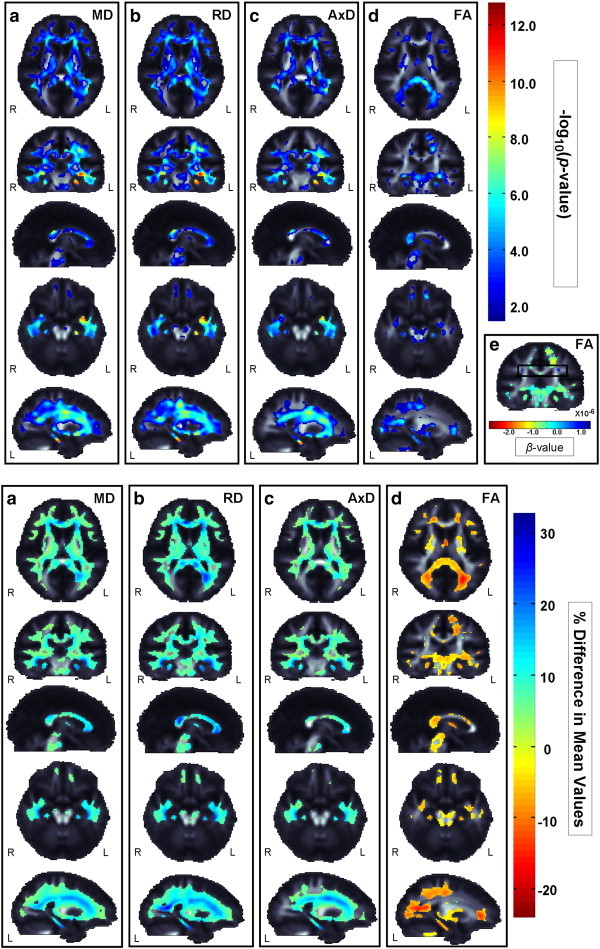
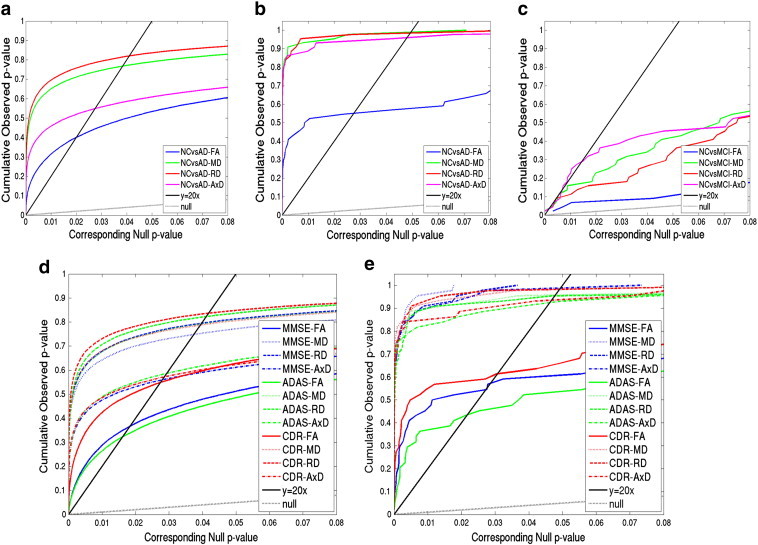
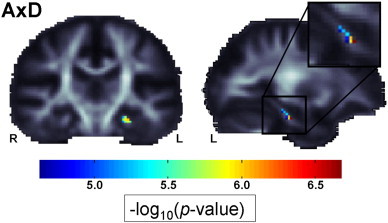
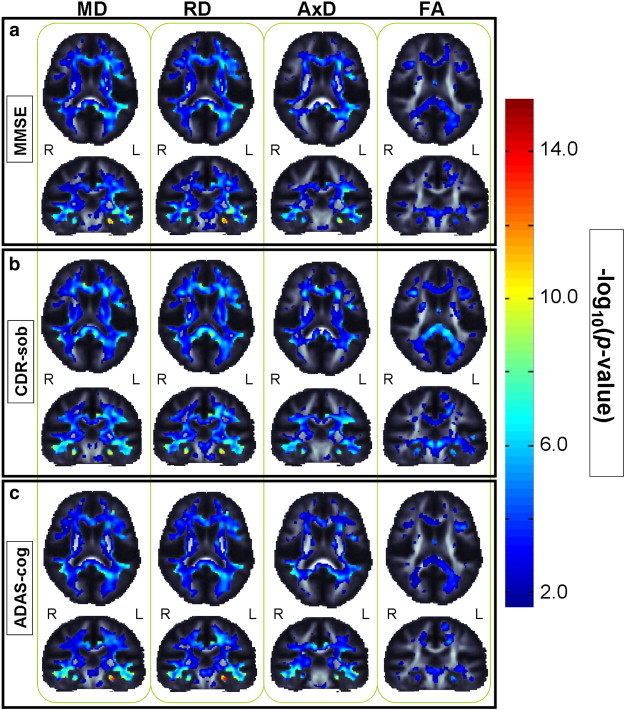
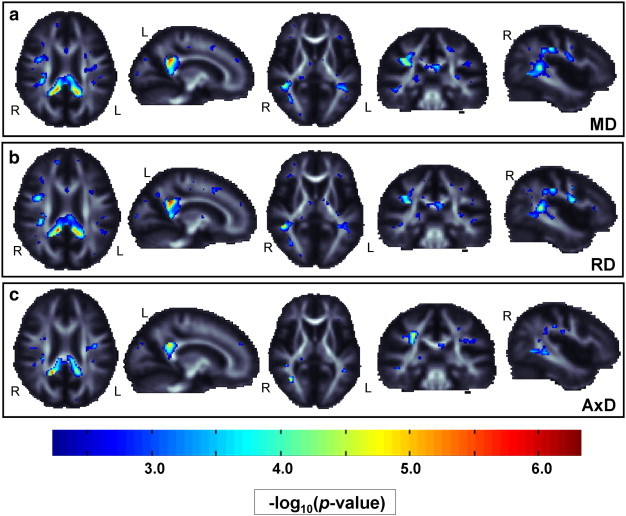
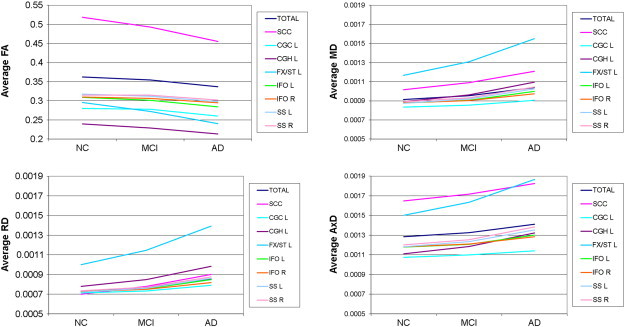
The Alzheimer's Disease Neuroimaging Initiative (ADNI) recently added diffusion tensor imaging (DTI), among several other new imaging modalities, in an effort to identify sensitive biomarkers of Alzheimer's disease (AD). While anatomical MRI is the main structural neuroimaging method used in most AD studies and clinical trials, DTI is sensitive to microscopic white matter (WM) changes not detectable with standard MRI, offering additional markers of neurodegeneration. Prior DTI studies of AD report lower fractional anisotropy (FA), and increased mean, axial, and radial diffusivity (MD, AxD, RD) throughout WM. Here we assessed which DTI measures may best identify differences among AD, mild cognitive impairment (MCI), and cognitively healthy elderly control (NC) groups, in region of interest (ROI) and voxel-based analyses of 155 ADNI participants (mean age: 73.5 ± 7.4; 90 M/65 F; 44 NC, 88 MCI, 23 AD). Both VBA and ROI analyses revealed widespread group differences in FA and all diffusivity measures. DTI maps were strongly correlated with widely-used clinical ratings (MMSE, CDR-sob, and ADAS-cog). When effect sizes were ranked, FA analyses were least sensitive for picking up group differences. Diffusivity measures could detect more subtle MCI differences, where FA could not. ROIs showing strongest group differentiation (lowest p-values) included tracts that pass through the temporal lobe, and posterior brain regions. The left hippocampal component of the cingulum showed consistently high effect sizes for distinguishing groups, across all diffusivity and anisotropy measures, and in correlations with cognitive scores.
Overview
The claims and statistics of this paper haven’t been checked yet.
Run the check — free, no account needed. It reads the open-access text and checks the sources it cites.
Integrity signals
Registry
Cites
Statistics
Figures
Verification
Claims the paper makes
The claims and statistics of this paper haven’t been checked yet.
Run the check — free, no account needed. It reads the open-access text and checks the sources it cites.
Claims other papers make about this one
Each is checked against this paper’s own text: does it say what the citing paper says it does?
The source backs part of the claim, not all of it — or backs it for a different population, condition or comparison.
In the citing paper
“Among the three cognitive assessments, CDR-sob showed the strongest correlations with dMRI indices, in line with prior ADNI brain imaging studies (Hua et al., 2009; Nir et al., 2013).”
From Diffusion MRI Indices and Their Relation to Cognitive Impairment in Brain Aging: The Updated Multi-protocol Approach in ADNI3 (2019) · cites this paper as Nir et al., 2013
Experimental — accuracy not yet measuredThe source backs part of the claim, not all of it — or backs it for a different population, condition or comparison.
In the citing paper
“Similarly, in ADNI2, AxDDTI was the most sensitive to differences between CN and MCI diagnosis (Nir et al., 2013).”
From Diffusion MRI Indices and Their Relation to Cognitive Impairment in Brain Aging: The Updated Multi-protocol Approach in ADNI3 (2019) · cites this paper as Nir et al., 2013
Experimental — accuracy not yet measuredThe cited source says what the claim attributes to it.
In the citing paper
“As in our prior analysis of ADNI2 (Nir et al., 2013), FADTI was the least sensitive DTI measure.”
From Diffusion MRI Indices and Their Relation to Cognitive Impairment in Brain Aging: The Updated Multi-protocol Approach in ADNI3 (2019) · cites this paper as Nir et al., 2013
The cited source says what the claim attributes to it.
In the citing paper
“dMRI has since been used in numerous studies to understand the effects of AD on white matter (WM) microstructure and brain connectivity (Daianu et al., 2013a,b; Nir et al., 2013; Prasad et al., 2013).”
From Diffusion MRI Indices and Their Relation to Cognitive Impairment in Brain Aging: The Updated Multi-protocol Approach in ADNI3 (2019) · cites this paper as Nir et al., 2013
The cited source says what the claim attributes to it.
In the citing paper
“Lower FADTI and higher MDDTI are most frequently reported in studies of AD (Kavcic et al., 2008; Clerx et al., 2012; Nir et al., 2013; Maggipinto et al., 2017; Mayo et al., 2017)”
From Diffusion MRI Indices and Their Relation to Cognitive Impairment in Brain Aging: The Updated Multi-protocol Approach in ADNI3 (2019) · cites this paper as Nir et al., 2013
The cited source says what the claim attributes to it.
In the citing paper
“These are all regions that show early degenerative changes in MCI and AD (Mielke et al., 2009; Nir et al., 2013; Maggipinto et al., 2017; Powell et al., 2018).”
From Diffusion MRI Indices and Their Relation to Cognitive Impairment in Brain Aging: The Updated Multi-protocol Approach in ADNI3 (2019) · cites this paper as Nir et al., 2013
Self-check
Percentages, sums and reported differences re-computed from the paper’s own numbers.
The self-check needs the paper’s full text.
Citations
Cites
Controlling the False Discovery Rate: A Practical and Powerful Approach to Multiple Testing
Benjamini, Y., & Hochberg, Y. (1995) · Journal of the Royal Statistical Society Series B: Statistical Methodology · doi:10.1111/j.2517-6161.1995.tb02031.x · Cited by 109,482
Folstein, M. F., Folstein, S. E., & McHugh, P. R. (1975) · Journal of Psychiatric Research · doi:10.1016/0022-3956(75)90026-6 · Cited by 88,282
Hirono, N., Mori, E., Ikejiri, Y., Imamura, T., Shimomura, T., Hashimoto, M., Yamashita, H., & Ikeda, M. (1997) · PubMed · Cited by 21,012
Kok, J. S., Berg, I. J., & Scherder, E. J. A. (2013) · Dementia and Geriatric Cognitive Disorders Extra · doi:10.1159/000353441 · Cited by 20,589
Older Adults' Reasons for Using Technology while Aging in Place
Peek, S. T. M., Luijkx, K. G., Rijnaard, M. D., Nieboer, M. E., van der Voort, C. S., Aarts, S., van Hoof, J., Vrijhoef, H. J., & Wouters, E. (2015) · Gerontology · doi:10.1159/000430949 · Cited by 19,852
Sensitivity and False Alarm Rate of a Fall Sensor in Long-Term Fall Detection in the Elderly
Kangas, M., Korpelainen, R., Vikman, I., Nyberg, L., & Jämsä, T. J. (2014) · Gerontology · doi:10.1159/000362720 · Cited by 19,007
Neuropathological stageing of Alzheimer-related changes.
Braak, H., & Braak, E. (1991) · Acta Neuropathologica · doi:10.1007/bf00308809 · Cited by 16,123 · cited 3×
“…et al., 2004; Medina et al., 2006; Rose et al., 2006; Xie et al., 2006; Zhang et al., 2007; Kavcic et al., 2008; Stebbins and Murphy, 2009), consistent with regions showing earliest pathological changes (Braak and Braak, 1991; Braak and Braak, 1995; Thompson et al., 2007) and our results.”
Jenkinson, M., Bannister, P., Brady, M., & Smith, S. (2002) · NeuroImage · doi:10.1006/nimg.2002.1132 · Cited by 11,888
Fast robust automated brain extraction
Smith, S. M. (2002) · Human Brain Mapping · doi:10.1002/hbm.10062 · Cited by 10,496
Tract-based spatial statistics: Voxelwise analysis of multi-subject diffusion data
Smith, S. M., Jenkinson, M., Johansen‐Berg, H., Rueckert, D., Nichols, T. E., Mackay, C. E., Watkins, K. E., Ciccarelli, O., Cader, M. Z., Matthews, P. M., et al. (2006) · NeuroImage · doi:10.1016/j.neuroimage.2006.02.024 · Cited by 6,598
MR diffusion tensor spectroscopy and imaging
Basser, P. J., Mattiello, J., & LeBihan, D. (1994) · Biophysical Journal · doi:10.1016/s0006-3495(94)80775-1 · Cited by 5,970
Current concepts in mild cognitive impairment
Petersen, R. C., Doody, R., Kurz, A., Mohs, R. C., Morris, J. C., Rabins, P. V., Ritchie, K., Rossor, M., Thal, L., & Winblad, B. (2001) · Archives of Neurology · doi:10.1001/archneur.58.12.1985 · Cited by 4,781
Automatically Parcellating the Human Cerebral Cortex
Fischl, B. R. (2003) · Cerebral Cortex · doi:10.1093/cercor/bhg087 · Cited by 4,208
A new rating scale for Alzheimer's disease
(1984) · American Journal of Psychiatry · doi:10.1176/ajp.141.11.1356 · Cited by 4,175
Staging of alzheimer's disease-related neurofibrillary changes
Braak, H., & Braak, E. (1995) · Neurobiology of Aging · doi:10.1016/0197-4580(95)00021-6 · Cited by 2,357
Alzheimer Disease in the US Population: Prevalence Estimates Using the 2000 Census
Hebert, L. E., Scherr, P. A., Bienias, J. L., Bennett, D. A., & Evans, D. A. (2003) · Archives of Neurology · doi:10.1001/archneur.60.8.1119 · Cited by 2,168
Stereotaxic white matter atlas based on diffusion tensor imaging in an ICBM template
Mori, S., Oishi, K., Jiang, H., Jiang, L., Li, X., Akhter, K., Hua, K., Faria, A. V., Mahmood, A., Woods, R. P., et al. (2008) · NeuroImage · doi:10.1016/j.neuroimage.2007.12.035 · Cited by 1,832
Self-citationSong, S.-K., Sun, S.-W., Ju, W.-K., Lin, S.-J., Cross, A. H., & Neufeld, A. H. (2003) · NeuroImage · doi:10.1016/j.neuroimage.2003.07.005 · Cited by 1,738
Demyelination increases radial diffusivity in corpus callosum of mouse brain
Song, S.-K., Yoshino, J., Le, T. Q., Lin, S.-J., Sun, S.-W., Cross, A. H., & Armstrong, R. C. (2005) · NeuroImage · doi:10.1016/j.neuroimage.2005.01.028 · Cited by 1,658
Enhancement of MR Images Using Registration for Signal Averaging
Holmes, C. J., Hoge, R. D., Collins, D. L., Woods, R. P., Toga, A. W., & Evans, A. C. (1998) · Journal of Computer Assisted Tomography · doi:10.1097/00004728-199803000-00032 · Cited by 1,422
Self-citationDynamics of Gray Matter Loss in Alzheimer's Disease
Thompson, P. M., Hayashi, K. M., de Zubicaray, G., Janke, A. L., Rose, S. E., Semple, J., Herman, D., Hong, M. S., Dittmer, S. S., Doddrell, D. M., et al. (2003) · The Journal of Neuroscience · doi:10.1523/jneurosci.23-03-00994.2003 · Cited by 1,132
Self-citationThe Alzheimer's Disease Neuroimaging Initiative: A review of papers published since its inception
Weiner, M. W., Veitch, D. P., Aisen, P. S. S., Beckett, L. A., Cairns, N. J., Green, R. C., Harvey, D. J., Jack, C. R., Jagust, W. J., Liu, E., et al. (2013) · Alzheimer s & Dementia · doi:10.1016/j.jalz.2013.05.1769 · Cited by 1,033
Self-citationA white matter disorder in dementia of the Alzheimer type: A pathoanatomical study
Brun, A., & Englund, E. (1986) · Annals of Neurology · doi:10.1002/ana.410190306 · Cited by 1,014
2012 Alzheimer's disease facts and figures Alzheimer's Association ∗
Thies, W. H., & Bleiler, L. (2012) · Alzheimer s & Dementia · doi:10.1016/j.jalz.2012.02.001 · Cited by 1,014
Scahill, R. I., Schott, J. M., Stevens, J., Rossor, M. N., & Fox, N. C. (2002) · Proceedings of the National Academy of Sciences · doi:10.1073/pnas.052587399 · Cited by 773
Clinical Dementia Rating (CDR)
Gauthier, S. G. (2001) · CRC Press eBooks · doi:10.3109/9780203213896-34 · Cited by 696
Trajectories of cholinergic pathways within the cerebral hemispheres of the human brain
Selden, N. (1998) · Brain · doi:10.1093/brain/121.12.2249 · Cited by 657
Presymptomatic hippocampal atrophy in Alzheimer's disease: A longitudinal MRI study
Fox, N. C., Warrington, E. K., Freeborough, P. A., Hartikainen, P., Kennedy, A. M., Stevens, J. M., & Rossor, M. N. (1996) · Brain · doi:10.1093/brain/119.6.2001 · Cited by 656
Head, D. (2004) · Cerebral Cortex · doi:10.1093/cercor/bhh003 · Cited by 645
Initiative, A. D. N., Crane, P. K., Carle, A. C., Gibbons, L. E., Insel, P. S., Mackin, R. S., Gross, A. L., Jones, R. N., Mukherjee, S., Curtis, S. M., et al. (2012) · Brain Imaging and Behavior · doi:10.1007/s11682-012-9186-z · Cited by 634
Self-citationRobust Brain Extraction Across Datasets and Comparison With Publicly Available Methods
Iglesias, J. E., Liu, C., Thompson, P. M., & Tu, Z. (2011) · IEEE Transactions on Medical Imaging · doi:10.1109/tmi.2011.2138152 · Cited by 580
Self-citationOishi, K., Faria, A. V., Jiang, H., Li, X., Akhter, K., Zhang, J., Hsu, J. T., Miller, M. I., van Zijl, P. C. M., Albert, M., et al. (2009) · NeuroImage · doi:10.1016/j.neuroimage.2009.01.002 · Cited by 574
Self-citationIs MCI really just early dementia? A systematic review of conversion studies
Bruscoli, M., & Lovestone, S. (2004) · International Psychogeriatrics · doi:10.1017/s1041610204000092 · Cited by 569
Bozzali, M. (2002) · Journal of Neurology, Neurosurgery & Psychiatry · doi:10.1136/jnnp.72.6.742 · Cited by 568
Alzheimer's disease as homeostatic responses to age-related myelin breakdown
Bartzokis, G. (2011) · Neurobiology of Aging · doi:10.1016/j.neurobiolaging.2009.08.007 · Cited by 546
Baseline MRI predictors of conversion from MCI to probable AD in the ADNI cohort
Risacher, S., Saykin, A., Wes, J., Shen, L., Firpi, H., & McDonald, B. (2009) · Current Alzheimer Research · doi:10.2174/156720509788929273 · Cited by 538
Douaud, G., Jbabdi, S., Behrens, T. E. J., Menke, R. A., Gass, A., Monsch, A. U., Rao, A., Whitcher, B., Kindlmann, G., Matthews, P. M., et al. (2011) · NeuroImage · doi:10.1016/j.neuroimage.2010.12.008 · Cited by 514 · cited 2×
“For example, in AD we might expect FA deficits throughout the brain, but FA may appear to be artificially increased where crossing fibers deteriorate (Douaud et al., 2011).”
Diffusion tensor imaging of cingulum fibers in mild cognitive impairment and Alzheimer disease
Zhang, Y., Schuff, N. W., Jahng, G., Bayne, W., Mori, S., Schad, L. R., Mueller, S. G., Du, A., Kramer, J. H., Yaffe, K. S., et al. (2007) · Neurology · doi:10.1212/01.wnl.0000250326.77323.01 · Cited by 513
Self-citationInitiative, A. D. N., Gibbons, L. E., Carle, A. C., Mackin, R. S., Harvey, D. J., Mukherjee, S., Insel, P. S., Curtis, S. M., Mungas, D., & Crane, P. K. (2012) · Brain Imaging and Behavior · doi:10.1007/s11682-012-9176-1 · Cited by 511
The Alzheimer's Disease Neuroimaging Initiative: A review of papers published since its inception
Weiner, M. W., Veitch, D. P., Aisen, P. S. S., Beckett, L. A., Cairns, N. J., Green, R. C., Harvey, D. J., Jack, C. R., Jagust, W. J., Liu, E., et al. (2011) · Alzheimer s & Dementia · doi:10.1016/j.jalz.2011.09.172 · Cited by 497
Self-citationWhite matter changes in mild cognitive impairment and AD: a diffusion tensor imaging study
Medina, D., deToledo-Morrell, L., Urresta, F., Gabrieli, J. D. E., Moseley, M., Fleischman, D., Bennett, D. A., Leurgans, S., Turner, D. A., & Stebbins, G. T. (2006) · Neurobiology of Aging · doi:10.1016/j.neurobiolaging.2005.03.026 · Cited by 492
Rose, S. (2000) · Journal of Neurology Neurosurgery & Psychiatry · doi:10.1136/jnnp.69.4.528 · Cited by 465
Sun, S., Liang, H., Trinkaus, K., Cross, A. H., Armstrong, R. C., & Song, S. (2006) · Magnetic Resonance in Medicine · doi:10.1002/mrm.20774 · Cited by 461
Early diagnosis of alzheimer’s disease: contribution of structural neuroimaging
Chételat, G., & Baron, J. (2003) · NeuroImage · doi:10.1016/s1053-8119(02)00026-5 · Cited by 455
Cortical Change in Alzheimer's Disease Detected with a Disease-specific Population-based Brain Atlas
Thompson, P. M., Mega, M. S., Woods, R. P., Zoumalan, C. I., Lindshield, C., Blanton, R. E., Moussai, J., Holmes, C. J., Cummings, J. L., & Toga, A. W. (2001) · Cerebral Cortex · doi:10.1093/cercor/11.1.1 · Cited by 447
Self-citationThe Alzheimer's disease assessment scale: an instrument for assessing treatment efficacy.
Mohs, R. C., Rosen, W. G., & Davis, K. L. (1983) · PubMed · Cited by 420
Braak, H., & Braak, E. (1996) · Acta Neuropathologica · doi:10.1007/s004010050508 · Cited by 406
Jahanshad, N., Kochunov, P. V., Sprooten, E., Mandl, R. C., Nichols, T. E., Almasy, L., Blangero, J., Brouwer, R. M., Curran, J. E., de Zubicaray, G. I., et al. (2013) · NeuroImage · doi:10.1016/j.neuroimage.2013.04.061 · Cited by 393
Self-citationAbsolute diffusivities define the landscape of white matter degeneration in Alzheimer’s disease
Acosta-Cabronero, J., Williams, G. B., Pengas, G., & Nestor, P. J. (2010) · Brain · doi:10.1093/brain/awp257 · Cited by 393
Update on the Magnetic Resonance Imaging core of the Alzheimer's Disease Neuroimaging Initiative
Jack, C. R., Bernstein, M. A., Borowski, B., Gunter, J. L., Fox, N. C., Thompson, P. M., Schuff, N. W., Krüger, G., Killiany, R., DeCarli, C. S., et al. (2010) · Alzheimer s & Dementia · doi:10.1016/j.jalz.2010.03.004 · Cited by 379
Self-citationSattler, C., Toro, P., Schönknecht, P., & Schröder, J. (2012) · Psychiatry Research · doi:10.1016/j.psychres.2011.11.012 · Cited by 352
Sullivan, E. V., Rohlfing, T., & Pfefferbaum, A. (2010) · Neurobiology of Aging · doi:10.1016/j.neurobiolaging.2008.04.007 · Cited by 346
Subregional hippocampal atrophy predicts Alzheimer's dementia in the cognitively normal
Apostolova, L. G., Mosconi, L., Thompson, P. M., Green, A. E., Hwang, K., Ramírez, A., Mistur, R. L., Tsui, W. H., & de Leon, M. J. (2008) · Neurobiology of Aging · doi:10.1016/j.neurobiolaging.2008.08.008 · Cited by 327
Self-citationThe cortical signature of prodromal AD
Bakkour, A., Morris, J. C., & Dickerson, B. C. (2008) · Neurology · doi:10.1212/01.wnl.0000340981.97664.2f · Cited by 321
Stricker, N. H., Schweinsburg, B. C., Delano‐Wood, L., Wierenga, C. E., Bangen, K. J., Haaland, K. Y., Frank, L. R., Salmon, D. P., & Bondi, M. W. (2008) · NeuroImage · doi:10.1016/j.neuroimage.2008.11.027 · Cited by 318
The Effects of Aging upon the Hemodynamic Response Measured by Functional MRI
Huettel, S. A., Singerman, J. D., & McCarthy, G. (2001) · NeuroImage · doi:10.1006/nimg.2000.0675 · Cited by 308
Mild cognitive impairment and Alzheimer disease: regional diffusivity of water
Kantarci, K., Jack, C. R., Xu, Y. C., Campeau, N. G., O’Brien, P. C., Smith, G. E., Ivnik, R. J., Boeve, B. F., Kokmen, E., Tangalos, E. G., et al. (2001) · Radiology · doi:10.1148/radiology.219.1.r01ap14101 · Cited by 300
Self-citationFellgiebel, A., Wille, P., Müller, M. J., Winterer, G., Scheurich, A., Vucurevic, G., Schmidt, L. G., & Stoeter, P. (2004) · Dementia and Geriatric Cognitive Disorders · doi:10.1159/000077817 · Cited by 298
P1‐071: Intensity of dementia through latent variable modelling (I‐DeLV) in the AIBL cohort
Burnham, S. C., Graham, P. L., Wilson, B., Ames, D. J., Macaulay, L. S., Martins, R. N., Masters, C. L., Maruff, P. T., Rowe, C. C., Szoeke, C. E. I., et al. (2012) · Alzheimer s & Dementia · doi:10.1016/j.jalz.2012.05.347 · Cited by 292
White matter damage in Alzheimer disease and its relationship to gray matter atrophy
Agosta, F., Pievani, M., Sala, S., Geroldi, C., Galluzzi, S., Frisoni, G. B., & Filippi, M. (2011) · Radiology · doi:10.1148/radiol.10101284 · Cited by 288
Diffusion tensor imaging in mild cognitive impairment and Alzheimerʼs disease: a review
Chua, T. C., Wen, W., Slavin, M. J., & Sachdev, P. S. (2008) · Current Opinion in Neurology · doi:10.1097/wco.0b013e3282f4594b · Cited by 273
MRI atlas of human white matter
Oishi, K., & Crain, B. J. (2010) · Cited by 272
Fellgiebel, A., Müller, M. J., Wille, P. R., Dellani, P. R., Scheurich, A., Schmidt, L., & Stoeter, P. (2005) · Neurobiology of Aging · doi:10.1016/j.neurobiolaging.2004.11.006 · Cited by 266
Thompson, P. M., Hayashi, K. M., Dutton, R. A., Chiang, M., Leow, A., Sowell, E. R., de Zubicaray, G. I., Becker, J. T., López, O. L., Aizenstein, H. J., et al. (2007) · Annals of the New York Academy of Sciences · doi:10.1196/annals.1379.017 · Cited by 259
Self-citationTHE CHOLINERGIC SYSTEM IN OLD AGE AND ALZHEIMER'S DISEASE
Perry, E. K. (1980) · Age and Ageing · doi:10.1093/ageing/9.1.1 · Cited by 248
Diffusion tensor imaging in Alzheimer’s disease and mild cognitive impairment.
Stebbins, G. T., & Murphy, C. M. (2009) · Behavioural Neurology · doi:10.1155/2009/915041 · Cited by 245
Liu, Y., Spulber, G., Lehtimäki, K. K., Könönen, M., Hallikainen, I., Gröhn, H., Kivipelto, M., Hallikainen, M., Vanninen, R., & Soininen, H. (2011) · Neurobiology of Aging · doi:10.1016/j.neurobiolaging.2009.10.006 · Cited by 236
Takahashi, S., Yonezawa, H., Takahashi, J., Kudo, M., Inoue, T., & Tohgi, H. (2002) · Neuroscience Letters · doi:10.1016/s0304-3940(02)00914-x · Cited by 225
Regionally-specific diffusion tensor imaging in mild cognitive impairment and Alzheimer’s disease.
Mielke, M. M., Kozauer, N. A., Chan, K. C. G., George, M., Toroney, J., Zerrate, M., Bandeen-Roche, K., Wang, M.-C., vanZijl, P., & Pekar, J. J. (2009) · NeuroImage · doi:10.1016/j.neuroimage.2009.01.054 · Cited by 225
Stahl, R., Dietrich, O., Teipel, S. J., Hampel, H. J., Reiser, M. F., & Schoenberg, S. O. (2007) · Radiology · doi:10.1148/radiol.2432051714 · Cited by 215
Functional implications of hippocampal volume and diffusivity in mild cognitive impairment
Müller, M. J., Greverus, D., Dellani, P. R., Weibrich, C., Wille, P. R., Scheurich, A., Stoeter, P., & Fellgiebel, A. (2005) · NeuroImage · doi:10.1016/j.neuroimage.2005.06.029 · Cited by 210
Leow, A., Yanovsky, I., Chiang, M.-C., Lee, A. D., Klunder, A. D., Lu, A. P., Becker, J. T., Davis, S. W., Toga, A. W., & Thompson, P. M. (2007) · IEEE Transactions on Medical Imaging · doi:10.1109/tmi.2007.892646 · Cited by 209
Self-citationVoxel-based detection of white matter abnormalities in mild Alzheimer disease
Xie, S., Xiao, J., Gong, G., Zang, Y., Wang, Y., Wu, H., & Jiang, X. X. (2006) · Neurology · doi:10.1212/01.wnl.0000219625.77625.aa · Cited by 208
Rose, S. (2006) · Journal of Neurology Neurosurgery & Psychiatry · doi:10.1136/jnnp.2005.074336 · Cited by 189
Diffusion tensor imaging and cognitive function in older adults with no dementia
Kantarci, K., Senjem, M. L., Avula, R., Zhang, B., Samikoglu, A. R., Weigand, S. D., Przybelski, S. A., Edmonson, H. A., Vemuri, P., Knopman, D. S., et al. (2011) · Neurology · doi:10.1212/wnl.0b013e31822313dc · Cited by 182
Self-citationBraskie, M. N., Jahanshad, N., Stein, J. L., Marina Barysheva, A., McMahon, K. L., de Zubicaray, G. I., Martin, N. G., Wright, M. J., Ringman, J. M., Toga, A. W., et al. (2011) · Journal of Neuroscience · doi:10.1523/jneurosci.5794-10.2011 · Cited by 175
Self-citationHua, X., Leow, A., Lee, S., Klunder, A. D., Toga, A. W., Leporé, N., Chou, Y.-Y., Brun, C., Chiang, M. Y.-H., & Marina Barysheva, A. (2008) · NeuroImage · doi:10.1016/j.neuroimage.2008.02.010 · Cited by 175
Self-citationDaianu, M., Jahanshad, N., Nir, T. M., Toga, A. W., Jack, C. R., Weiner, M. W., & Thompson, F. T. A. D. (2013) · Brain Connectivity · doi:10.1089/brain.2012.0137 · Cited by 173
Self-citationCerebral atrophy in mild cognitive impairment and Alzheimer disease
Leung, K. K., Bartlett, J. W., Barnes, J., Manning, E. N., Sebastien Ourselin, A., Fox, N. C., & Initiative, A. D. N. (2013) · Neurology · doi:10.1212/wnl.0b013e318281ccd3 · Cited by 171
Relating imaging indices of white matter integrity and volume in healthy older adults
Hugenschmidt, C. E., Peiffer, A. M., Kraft, R. A., Casanova, R., Deibler, A. R., Burdette, J. H., Maldjian, J. A., & Laurienti, P. J. (2008) · Cerebral Cortex · doi:10.1093/cercor/bhm080 · Cited by 166
Capizzano, A. A. (2004) · Journal of Neurology Neurosurgery & Psychiatry · doi:10.1136/jnnp.2003.019273 · Cited by 160
White matter correlates of cognitive domains in normal aging with diffusion tensor imaging
Sasson, E., Doniger, G. M., Pasternak, O., Tarrasch, R., & Assaf, Y. (2013) · Frontiers in Neuroscience · doi:10.3389/fnins.2013.00032 · Cited by 159
Apostolova, L. G., & Thompson, P. M. (2008) · Neuropsychologia · doi:10.1016/j.neuropsychologia.2007.10.026 · Cited by 149
Self-citationHua, X., Lee, S., Yanovsky, I., Leow, A. D., Chou, Y.-Y., Ho, A. J., Gutman, B., Toga, A. W., Jack, C. R., Bernstein, M. A., et al. (2009) · NeuroImage · doi:10.1016/j.neuroimage.2009.07.011 · Cited by 145
Self-citationGenetic influences on brain asymmetry: A DTI study of 374 twins and siblings
Jahanshad, N., Lee, A. D., Marina Barysheva, A., McMahon, K. L., de Zubicaray, G. I., Martin, N. G., Wright, M. J., Toga, A. W., & Thompson, P. M. (2010) · NeuroImage · doi:10.1016/j.neuroimage.2010.04.236 · Cited by 133
Self-citationDiffusion Tensor Metrics as Biomarkers in Alzheimer's Disease
Acosta‐Cabronero, J., Alley, S., Williams, G. B., Pengas, G., & Nestor, P. J. (2012) · PLoS ONE · doi:10.1371/journal.pone.0049072 · Cited by 132
Clerx, L., Visser, P. J., Verhey, F., & Aalten, P. (2012) · Journal of Alzheimer s Disease · doi:10.3233/jad-2011-110797 · Cited by 132
White matter lesions and hippocampal atrophy in Alzheimer’s disease
de Leeuw, F., Barkhof, F., & Scheltens, P. (2004) · Neurology · doi:10.1212/01.wnl.0000103289.03648.ad · Cited by 122
O'Dwyer, L., Lamberton, F., Bokde, A. L. W., Ewers, M., Faluyi, Y. O., Tanner, C., Mazoyer, B., O'Neill, D., Bartley, M., Collins, D. R., et al. (2011) · PLoS ONE · doi:10.1371/journal.pone.0021745 · Cited by 119
Duan, J., Wang, H., Xu, J., Lin, X. Z., Chen, S., Kang, Z., & Yao, Z. (2006) · Surgical and Radiologic Anatomy · doi:10.1007/s00276-006-0111-2 · Cited by 115
Hua, X., Hibar, D. P., Ching, C. R. K., Boyle, C. P., Rajagopalan, P., Gutman, B. A., Leow, A., Toga, A. W., Jack, C. R., Harvey, D. J., et al. (2012) · NeuroImage · doi:10.1016/j.neuroimage.2012.10.086 · Cited by 114
Self-citationAutomated MRI measures predict progression to Alzheimer's disease
Desikan, R. S., Cabral, H., Settecase, F., Hess, C. P., Dillon, W. P., Glastonbury, C. M., Weiner, M. W., Schmansky, N. J., Salat, D. H., & Fischl, B. R. (2010) · Neurobiology of Aging · doi:10.1016/j.neurobiolaging.2010.04.023 · Cited by 112
Self-citationYoshiura, T., Mihara, F., Ogomori, K., Tanaka, A., Kaneko, K., & Masuda, K. (2002) · Neuroreport · doi:10.1097/00001756-200212030-00026 · Cited by 111
A study of diffusion tensor imaging by tissue-specific, smoothing-compensated voxel-based analysis
Lee, J. E., Chung, M. K., Lazar, M., DuBray, M. B., Kim, J., Bigler, E. D., Lainhart, J. E., & Alexander, A. L. (2008) · NeuroImage · doi:10.1016/j.neuroimage.2008.09.041 · Cited by 109
Structural Magnetic Resonance Imaging in Established and Prodromal Alzheimer Disease: A Review
Atiya, M., Hyman, B. T., Albert, M., & Killiany, R. (2003) · Alzheimer Disease & Associated Disorders · doi:10.1097/00002093-200307000-00010 · Cited by 101
The tensor distribution function
Leow, A. D., Zhu, S., Zhan, L., McMahon, K., de Zubicaray, G. I., Meredith, M., Wright, M. J., Toga, A. W., & Thompson, P. M. (2009) · Magnetic Resonance in Medicine · doi:10.1002/mrm.21852 · Cited by 101
Self-citationCanu, E., McLaren, D. G., Fitzgerald, M. E., Bendlin, B. B., Zoccatelli, G., Alessandrini, F., Pizzini, F. B., Ricciardi, G. K., Beltramello, A., Johnson, S. C., et al. (2010) · Journal of Alzheimer s Disease · doi:10.3233/jad-2010-1295 · Cited by 96
Sjöbeck, M., Haglund, M., & Englund, E. M. (2005) · International Journal of Geriatric Psychiatry · doi:10.1002/gps.1384 · Cited by 95
Hua, X., Lee, S., Hibar, D. P., Yanovsky, I., Leow, A., Toga, A. W., Jack, C. R., Bernstein, M. A., Reiman, E. M., Harvey, D. J., et al. (2010) · NeuroImage · doi:10.1016/j.neuroimage.2010.01.104 · Cited by 84
Self-citationWhite matter atrophy in Alzheimer's disease variants
Migliaccio, R., Agosta, F., Possin, K. L., Rabinovici, G. D., Miller, B. L., & Gorno‐Tempini, M. L. (2012) · Alzheimer s & Dementia · doi:10.1016/j.jalz.2012.04.010 · Cited by 83
Selective Disruption of the Cerebral Neocortex in Alzheimer's Disease
Desikan, R. S., Sabuncu, M. R., Schmansky, N. J., Reuter, M., Cabral, H., Hess, C. P., Weiner, M. W., Biffi, A., Anderson, C. D., Rosand, J. M., et al. (2010) · PLoS ONE · doi:10.1371/journal.pone.0012853 · Cited by 83
Self-citationUkmar, M., Makuc, E., Onor, M. L., Garbin, G., Trevisiol, M., & Cova, M. A. (2008) · La radiologia medica · doi:10.1007/s11547-008-0286-1 · Cited by 79
How does angular resolution affect diffusion imaging measures?
Zhan, L., Leow, A. D., Jahanshad, N., Chiang, M.-C., Barysheva, M., Lee, A. D., Toga, A. W., McMahon, K. L., de Zubicaray, G. I., Wright, M. J., et al. (2010) · NeuroImage · doi:10.1016/j.neuroimage.2009.09.057 · Cited by 79
Self-citationGuzman, V. A., Carmichael, O. T., Schwarz, C. G., Tosto, G., Zimmerman, M. E., Brickman, A. M., & Initiative, A. D. N. (2013) · Alzheimer s & Dementia · doi:10.1016/j.jalz.2012.11.009 · Cited by 77
Gutman, B. A., Hua, X., Rajagopalan, P., Chou, Y., Wang, Y., Yanovsky, I., Toga, A. W., Jack, C. R., Weiner, M. W., & Thompson, P. M. (2013) · NeuroImage · doi:10.1016/j.neuroimage.2012.12.052 · Cited by 66
Self-citationMean Template for Tensor-Based Morphometry Using Deformation Tensors
Leporé, N., Brun, C., Pennec, X., Chou, Y., López, O. L., Aizenstein, H. J., Becker, J. T., Toga, A. W., & Thompson, P. M. (2007) · Lecture notes in computer science · doi:10.1007/978-3-540-75759-7_100 · Cited by 65
Self-citationWhite matter integrity linked to functional impairments in aging and early Alzheimer’s disease
Kavcic, V., Ni, H., Zhu, T., Zhong, J., & Duffy, C. J. (2008) · Alzheimer's & Dementia · doi:10.1016/j.jalz.2008.07.001 · Cited by 65
Angular versus spatial resolution trade-offs for diffusion imaging under time constraints
Zhan, L., Jahanshad, N., Ennis, D. B., Jin, Y., Bernstein, M. A., Borowski, B. J., Jack, C. R., Toga, A. W., Leow, A. D., & Thompson, P. M. (2013) · Human Brain Mapping · doi:10.1002/hbm.22094 · Cited by 52
Self-citationTopology Preserving Log-Unbiased Nonlinear Image Registration: Theory and Implementation
Yanovsky, I., Thompson, P. M., Osher, S., & Leow, A. (2007) · IEEE Computer Society Conference on Computer Vision and Pattern Recognition/Proceedings - IEEE Computer Society Conference on Computer Vision and Pattern Recognition/Proceedings · doi:10.1109/cvpr.2007.383144 · Cited by 51
Self-citationAlzheimer's disease disrupts rich club organization in brain connectivity networks
Daianu, M., Dennis, E. L., Jahanshad, N., Nir, T. M., Toga, A. W., Jack, C. R., Weiner, M. W., & Thompson, P. M. (2013) · IEEE International Symposium on Biomedical Imaging (ISBI) · doi:10.1109/isbi.2013.6556463 · Cited by 50
Self-citationMedina, D. (2008) · Neuropsychiatric Disease and Treatment · doi:10.2147/ndt.s3381 · Cited by 48
Chiang, G. C.-Y., Insel, P. S., Tosun, D., Schuff, N. W., Truran‐Sacrey, D., Raptentsetsang, S. T., Jack, C. R., Weiner, M. W., & Initiative, A. D. N. (2011) · Radiology · doi:10.1148/radiol.11101637 · Cited by 44
Self-citationWijtenburg, S. A., McGuire, S., Rowland, L. M., Sherman, P. M., Lancaster, J. L., Tate, D. F., Hardies, L. J., Patel, B., Glahn, D. C., Hong, L. E., et al. (2012) · NeuroImage · doi:10.1016/j.neuroimage.2012.10.014 · Cited by 42
Blood pressure and cerebral white matter share common genetic factors in Mexican Americans
Kochunov, P., Glahn, D. C., Lancaster, J., Winkler, A., Karlsgodt, K., Olvera, R. L., Curran, J. E., Carless, M. A., Dyer, T. D., Almasy, L., et al. (2011) · Hypertension · doi:10.1161/hypertensionaha.110.162206 · Cited by 38
Hofling, A. A., Kim, J. H., Fantz, C. R., Sands, M. S., & Song, S. (2009) · NMR in Biomedicine · doi:10.1002/nbm.1420 · Cited by 37
Magnetic Resonance Approaches to Brain Aging and Alzheimer Disease-associated Neuropathology
Anderson, V. C., Litvack, Z., & Kaye, J. A. (2005) · Topics in Magnetic Resonance Imaging · doi:10.1097/01.rmr.0000245458.05654.d0 · Cited by 36
Tractography density and network measures in Alzheimer’s disease
Prasad, G., Nir, T. M., Toga, A. W., & Thompson, P. M. (2013) · 2013 IEEE 10th International Symposium on Biomedical Imaging · doi:10.1109/isbi.2013.6556569 · Cited by 35
Self-citationIncorrect ICBM-DTI-81 atlas orientation and white matter labels
Torsten Rohlfing, B. (2013) · Frontiers in Neuroscience · doi:10.3389/fnins.2013.00004 · Cited by 32
Wakana, S., Nagae-Poetscher, L., Jiang, H., van Zijl, P., Golay, X., & Mori, S. (2005) · Magnetic Resonance in Medicine · doi:10.1002/mrm.20386 · Cited by 28
Jahanshad, N., Zhan, L., Bernstein, M. A., Borowski, B., Jack, C. R., Toga, A. W., & Thompson, P. M. (2010) · IEEE International Symposium on Biomedical Imaging (ISBI) · doi:10.1109/isbi.2010.5490200 · Cited by 27
Self-citationVisualization Tools for High Angular Resolution Diffusion Imaging
Shattuck, D. W., Chiang, M.-C., Marina Barysheva, A., McMahon, K. L., de Zubicaray, G. I., Meredith, M., Wright, M. J., Toga, A. W., & Thompson, P. M. (2008) · Lecture notes in computer science · doi:10.1007/978-3-540-85990-1_36 · Cited by 25
Self-citationConnectomics Sheds New Light on Alzheimer’s Disease
Toga, A. W., & Thompson, P. M. (2013) · Biological Psychiatry · doi:10.1016/j.biopsych.2013.01.004 · Cited by 25
Self-citationZhan, L., Leow, A., Aganj, I., Lenglet, C., Sapiro, G., Yacoub, E. S., Harel, N., Toga, A. W., & Thompson, P. M. (2011) · IEEE International Symposium on Biomedical Imaging (ISBI) · doi:10.1109/isbi.2011.5872411 · Cited by 23
Self-citationHow do spatial and angular resolution affect brain connectivity maps from diffusion MRI?
Zhan, L., Franc, D. T., Patel, V. N., Jahanshad, N., Jin, Y., Mueller, B. A., Bernstein, M. A., Borowski, B., Jack, C. R., Toga, A. W., et al. (2012) · IEEE International Symposium on Biomedical Imaging (ISBI) · doi:10.1109/isbi.2012.6235469 · Cited by 22
Self-citationLi, W.-B., Zhang, Y.-Z., Chang, C., Wei, X., & Fu, J. (2011) · Neurology India · doi:10.4103/0028-3886.79129 · Cited by 22
A Novel Measure of Fractional Anisotropy Based on the Tensor Distribution Function
Zhan, L., Leow, A., Zhu, S., Marina Barysheva, A., Toga, A. W., McMahon, K. L., de Zubicaray, G. I., Wright, M. J., & Thompson, P. M. (2009) · Lecture notes in computer science · doi:10.1007/978-3-642-04268-3_104 · Cited by 20
Self-citationHow Many Gradients are Sufficient in High-Angular Resolution Diffusion Imaging (HARDI)?
Zhan, L., Chan, T. F.-C., Leo, A. D., Zhu, S., Marina Barysheva, A., Toga, A. W., McMahon, K. L., de Zubicaray, G. I., Meredith, M., Wright, M. J., et al. (2008) · Cited by 12
Self-citationNir, T. M., Jahanshad, N., Toga, A. W., Jack, C. R., Weiner, M. W., & Thompson, P. M. (2012) · Lecture notes in computer science · doi:10.1007/978-3-642-33530-3_4 · Cited by 6
Self-citation
Research works printed but not linked: 2
- Daianu, 2012, Analyzing the structural k-core of brain connectivity networks in normal aging and Alzheimer's disease, MICCAI NIBAD, 52
- Gutman, 2012, Creating unbiased minimal deformation templates for brain volume registration, Proceedings of the Organization for Human Brain Mapping Annual Conference
Cited by
Sorted by citations
Cerebral blood flow regulation and neurovascular dysfunction in Alzheimer disease
Kisler, K., Nelson, A. R., Montagne, A., & Zlokovic, B. V. (2017) · Nature Reviews Neuroscience · doi:10.1038/nrn.2017.48 · Cited by 1,243
Brain atrophy in Alzheimer’s Disease and aging
Pini, L., Pievani, M., Bocchetta, M., Altomare, D., Bosco, P., Cavedo, E., Galluzzi, S., Marizzoni, M., & Frisoni, G. B. (2016) · Ageing Research Reviews · doi:10.1016/j.arr.2016.01.002 · Cited by 836
Functional brain connectivity using fMRI in aging and Alzheimer’s disease
Dennis, E. L., & Thompson, P. M. (2014) · Neuropsychology Review · doi:10.1007/s11065-014-9249-6 · Cited by 583
Self-citationWeiner, M. W., Veitch, D. P., Aisen, P. S., Beckett, L. A., Cairns, N. J., Cedarbaum, J., Green, R. C., Harvey, D., Jack, C. R., Jagust, W., et al. (2015) · Alzheimer's & Dementia · doi:10.1016/j.jalz.2014.11.001 · Cited by 348
Self-citationImpact of the Alzheimer's Disease Neuroimaging Initiative, 2004 to 2014
Weiner, M. W., Veitch, D. P., Aisen, P. S. S., Beckett, L. A., Cairns, N. J., Cedarbaum, J. M., Donohue, M., Green, R. C., Harvey, D. J., Jack, C. R., et al. (2015) · Alzheimer s & Dementia · doi:10.1016/j.jalz.2015.04.005 · Cited by 249
Self-citation
Metadata
- Authors
- Nir, T. M., Jahanshad, N., Villalon-Reina, J. E., Toga, A. W., Jack, C. R., Weiner, M. W., & Thompson, P. M.
- Affiliations
- University of California, Los Angeles (US)
- Mayo Clinic (US)
- University of California, San Francisco (US)
- Corresponding author
- Thompson, Paul M.
- ORCID
- Venue
- NeuroImage: Clinical
- Publisher
- Elsevier BV
- Published
- 2013
- Volume
- 3
- Pages
- 180-195
- ISSN
- 2213-1582 (ISSN-L)
- PMC
- PMC3792746
- OpenAlex
- W2028748733
- Cited by
- 348
- References
- 131
- Citations by year
- 2026: 14 · 2025: 37 · 2024: 28 · 2023: 33 · 2022: 29 · 2021: 31 · 2020: 23 · 2019: 32 · 2018: 22 · 2017: 21 · 2016: 27 · 2015: 30 · 2014: 21
- FWCI
- 18.49
- Type
- journal article
- Language
- en
- Open access
- gold
- doi.org
- Licence
- Locations
- NeuroImage Clinical (publishedVersion, cc-by-nc-nd)
- Europe PMC (PubMed Central) (publishedVersion, cc-by-nc-nd)
- PubMed Central (publishedVersion, cc-by-nc-nd)
- PubMed (publishedVersion)
- eScholarship (California Digital Library) (submittedVersion, cc-by-nc-nd)
- Funders
- ADNI (U01 AG024904)
- National Institute on Aging
- National Institute of Biomedical Imaging and Bioengineering
- Abbott
- Alzheimer's Association
- Alzheimer's Drug Discovery Foundation
- Amorfix Life Sciences Ltd.
- AstraZeneca
- Bayer HealthCare
- BioClinica, Inc.
- Biogen Idec Inc.
- Bristol-Myers Squibb Company
- Eisai Inc.
- Elan Pharmaceuticals Inc.
- Eli Lilly and Company
- F. Hoffmann-La Roche Ltd.
- Genentech, Inc.
- GE Healthcare
- Innogenetics, N.V.
- IXICO Ltd.
- Janssen Alzheimer Immunotherapy Research & Development, LLC.
- Johnson & Johnson Pharmaceutical Research & Development LLC.
- Medpace, Inc.
- Merck & Co., Inc.
- Meso Scale Diagnostics, LLC.
- Novartis Pharmaceuticals Corporation
- Pfizer Inc.
- Servier
- Synarc Inc.
- Takeda Pharmaceutical Company
- Canadian Institutes of Health Research
- NIH (P30 AG010129, K01 AG030514)
- NIA
- NIBIB
- National Library of Medicine
- National Center for Research Resources (AG016570, EB01651, LM05639, RR019771)
- Topics
- Health Sciences › Medicine › Psychiatry and Mental health › Dementia and Cognitive Impairment Research
- Health Sciences › Medicine › Radiology, Nuclear Medicine and Imaging › Advanced Neuroimaging Techniques and Applications
- Life Sciences › Neuroscience › Cellular and Molecular Neuroscience › Alzheimer's disease research and treatments
- Keywords
- Alzheimer's disease, mild cognitive impairment, normal aging, diffusion tensor imaging, fractional anisotropy, white matter diffusivity, white matter microstructure, temporal lobe, neurodegeneration biomarkers, cognitive impairment detection, voxel-based analysis, region of interest analysis
About these checks
Registry, retraction, Cites and statistics results are computed, not judged, with one exception: a printed reference that no index lists is read once by a model before it counts as a citation error. Claims are extracted by a model and kept only when their quote appears verbatim in the text; each cited source is then checked, with a model’s help, for whether it says what the claim relies on. Those verdicts can be wrong — read the claim’s quote and the cited source before relying on one.
Statistics and arithmetic are recomputed, not judged.
Confidence bands are shown only for fields calibrated on our annotated test set. None is calibrated yet, so no band is shown.
What counts as a claim ›How we measure confidence ›How we check this ›
Are you an author, or do you see a problem with this page? Request a review
