

MoleculeNet: a benchmark for molecular machine learning
Open accessThe DOI matches its Crossref record; 82 of the 82 references it cites were found in a registry or an index.
Abstract
A large scale benchmark for molecular machine learning consisting of multiple public datasets, metrics, featurizations and learning algorithms.
Overview
The claims and statistics of this paper haven’t been checked yet.
Free: it reads the open-access text and checks the first 5 claims that cite a source we can check. Create a free account to check every claim.
Integrity signals
Registry
Cites
Statistics
Figures






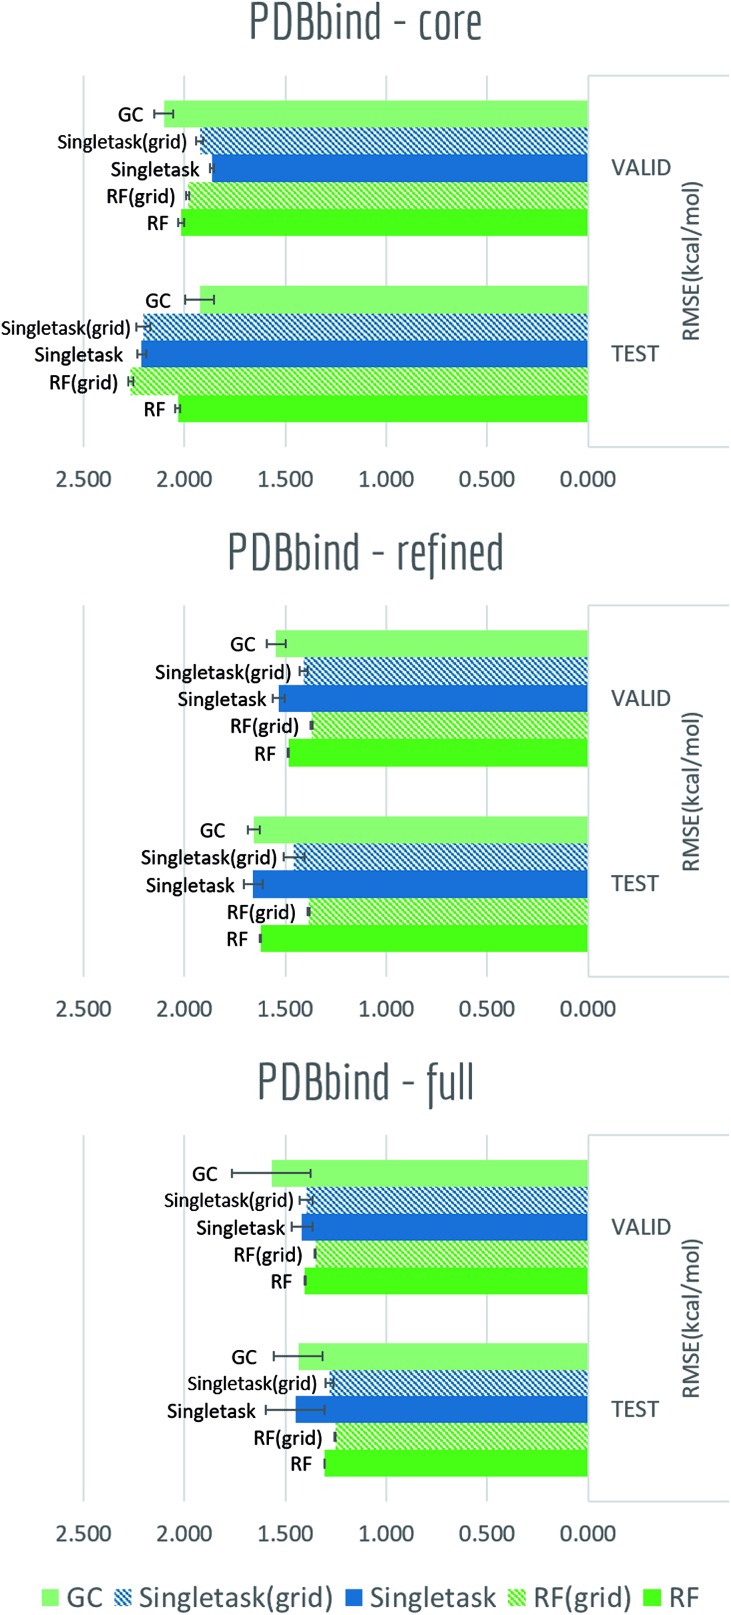

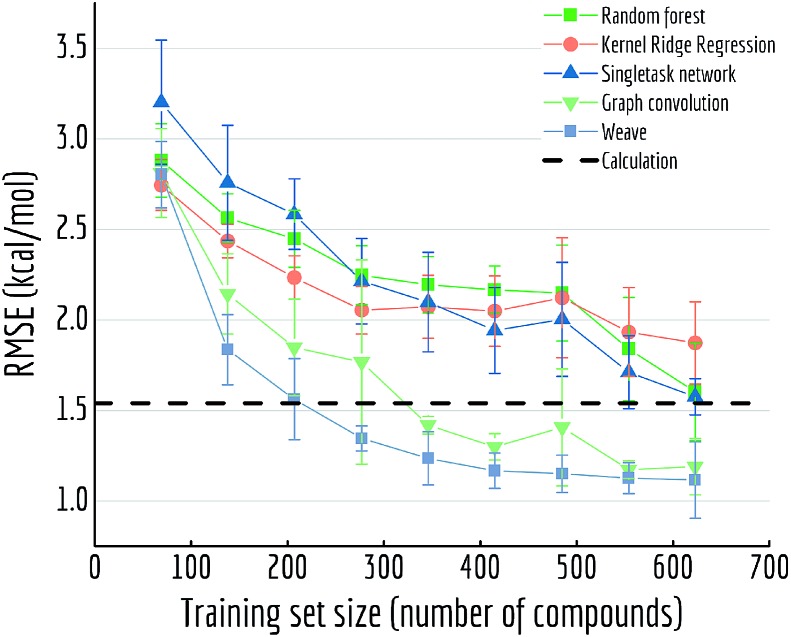
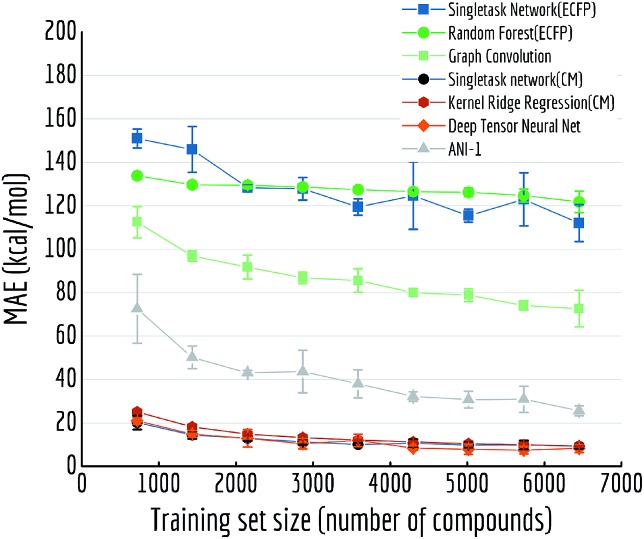
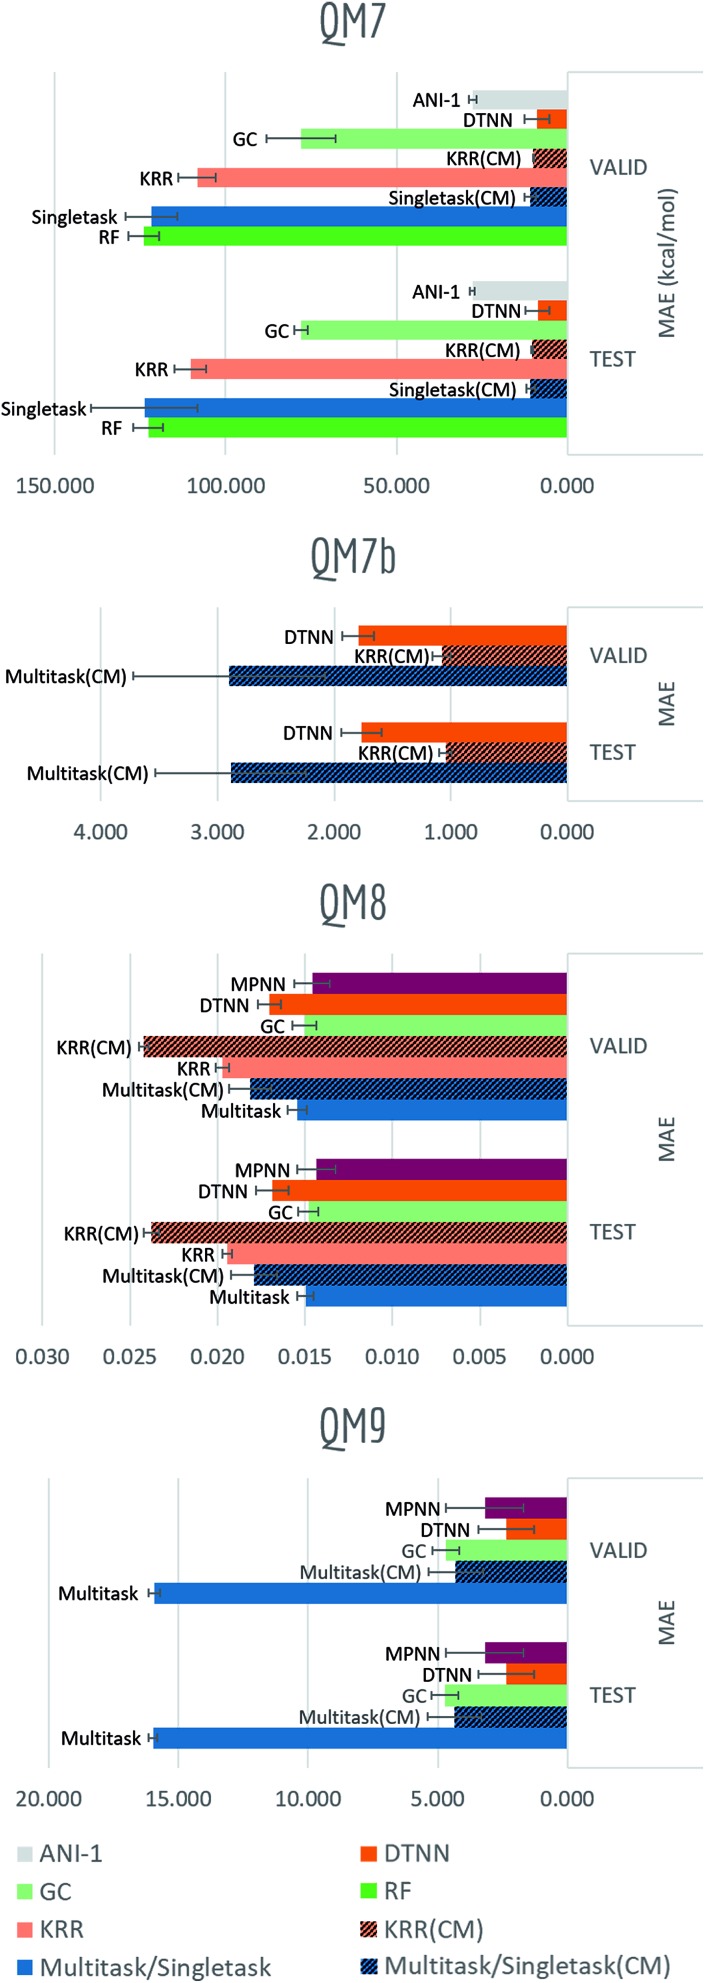
Verification
Claims the paper makes
The claims and statistics of this paper haven’t been checked yet.
Free: it reads the open-access text and checks the first 5 claims that cite a source we can check. Create a free account to check every claim.
Claims other papers make about this one
Each is checked against this paper’s own text: does it say what the citing paper says it does?
The source backs part of the claim, not all of it — or backs it for a different population, condition or comparison.
In the citing paper
“the availability of larger data sets (9) and easy-to-use tools (10,11) has particularly transformed this landscape.”
From Machine Learning for the Discovery, Design, and Engineering of Materials. (2022) · cites this paper as [10]
Experimental — accuracy not yet measuredThe cited source says what the claim attributes to it.
In the citing paper
“Another platform called MoleculeNet is also used to translate two-dimensional molecular structures into novel features/descriptors, which can then be used in predicting toxicity of the given molecule. The MoleculeNet platform is built on data from various public databases and more than 700,000 compounds have already been tested for toxicity or other properties [20].”
From The rise of artificial intelligence in healthcare applications (2020) · cites this paper as [20]
The cited source says what the claim attributes to it.
In the citing paper
“Initiatives like the DREAM Challenges,284 MoleculeNet,110 and Therapeutic Data Commons285 offer benchmark data sets across a wide spectrum of prediction tasks for pharmacology.”
From Advancing Targeted Protein Degradation via Multiomics Profiling and Artificial Intelligence (2023) · cites this paper as [110]
The check wasn’t confident either way, so it gives no verdict — never disputed.
In the citing paper
“However, ChemBERTa was found to perform better than Chemprop on a number of other MoleculeNet benchmark tasks51”
From OnSIDES database: Extracting adverse drug events from drug labels using natural language processing models (2025) · cites this paper as [51]
Experimental — accuracy not yet measured
Self-check
Percentages, sums and reported differences re-computed from the paper’s own numbers.
The self-check needs the paper’s full text.
Citations
Cites
Breiman, L. (2001) · Machine Learning · doi:10.1023/a:1010933404324 · Cited by 133,538
LeCun, Y., Bengio, Y., & Hinton, G. (2015) · Nature · doi:10.1038/nature14539 · Cited by 84,126
Scikit-learn: Machine Learning in Python
Pedregosa, F., Varoquaux, G., Gramfort, A., Michel, V., Thirion, B., Grisel, O., Blondel, M., Müller, A., Nothman, J., Louppe, G., et al. (2012) · arXiv · doi:10.48550/arxiv.1201.0490 · Cited by 71,016
ImageNet: A large-scale hierarchical image database
Deng, J., Dong, W., Socher, R., Li, L.-J., Li, K., & Fei-Fei, L. (2009) · 2009 IEEE Conference on Computer Vision and Pattern Recognition · doi:10.1109/cvpr.2009.5206848 · Cited by 65,333
Cortes, C., & Vapnik, V. (1995) · Machine Learning · doi:10.1007/bf00994018 · Cited by 59,421
Cortes, C., & Vapnik, V. (1995) · Machine-mediated learning · doi:10.1023/a:1022627411411 · Cited by 48,445
ImageNet Large Scale Visual Recognition Challenge
Russakovsky, O., Deng, J., Su, H., Krause, J., Satheesh, S., Ma, S., Huang, Z., Karpathy, A., Khosla, A., Bernstein, M., et al. (2015) · International Journal of Computer Vision · doi:10.1007/s11263-015-0816-y · Cited by 39,380
Greedy function approximation: A gradient boosting machine
Friedman, J. H. (2001) · The Annals of Statistics · doi:10.1214/aos/1013203451 · Cited by 30,731
The Elements of Statistical Learning
Hastie, T., Tibshirani, R., & Friedman, J. (2009) · Springer Series in Statistics · doi:10.1007/978-0-387-84858-7 · Cited by 25,970
Deep learning in neural networks: an overview
Schmidhuber, J. (2015) · Neural Networks · doi:10.1016/j.neunet.2014.09.003 · Cited by 18,570
Research works printed but not linked: 11
- Mitchell, 2014, Wiley Interdiscip. Rev.: Comput. Mol. Sci., 4, 468
- T. Unterthiner , A.Mayr , G.Klambauer , M.Steijaert , J.Wenger , H.Ceulemans and S.Hochreiter , Deep Learning and Representation Learning Workshop (NIPS 2014) , 2014
- Delaney, 2004, J. Chem. Inf. Model., 44, 1000
- J. Deng , W.Dong , R.Socher , L.-J.Li , K.Li and L.Fei-Fei , CVPR09 , 2009
- A. Krizhevsky , I.Sutskever and G. E.Hinton , NIPS Proceedings , 2012
- Pedregosa, 2011, J. Mach. Learn. Res., 12, 2825
- Quantum Machine , http://quantum-machine.org/datasets/ , accessed 2017-09-27
- Medical Dictionary for Regulatory Activities , http://www.meddra.org/ , accessed 2017-09-27
- Artemov, 2016, bioRxiv, Biochem., 095653
- Aggregate Analysis of ClincalTrials.gov (AACT) Database , http://www.ctti-clinicaltrials.org/aact-database , accessed 2017-09-27
- Cortes, 1995, Mach. Learn., 20, 273
Cited by
Automatic Chemical Design Using a Data-Driven Continuous Representation of Molecules
Gómez-Bombarelli, R., Wei, J. N., Duvenaud, D., Hernández-Lobato, J. M., Sánchez-Lengeling, B., Sheberla, D., Aguilera-Iparraguirre, J., Hirzel, T. D., Adams, R. P., & Aspuru-Guzik, A. (2018) · ACS Central Science · doi:10.1021/acscentsci.7b00572 · Cited by 3,106
Applications of machine learning in drug discovery and development
Vamathevan, J., Clark, D., Czodrowski, P., Dunham, I., Ferran, E., Lee, G., Li, B., Madabhushi, A., Shah, P., Spitzer, M., et al. (2019) · Nature Reviews Drug Discovery · doi:10.1038/s41573-019-0024-5 · Cited by 3,228
A Deep Learning Approach to Antibiotic Discovery
Stokes, J. M., Yang, K., Swanson, K., Jin, W., Cubillos-Ruiz, A., Donghia, N. M., MacNair, C. R., French, S., Carfrae, L. A., Bloom-Ackermann, Z., et al. (2020) · Cell · doi:10.1016/j.cell.2020.01.021 · Cited by 2,463
“…antagonized the activity of tetracycline in E. coli , and synergized with kanamycin (Figure 4E), consistent with previous work showing that the uptake of tetracyclines is dependent upon (cid:168) pH (Yamaguchi et al., 1991), whereas aminoglycoside uptake is driven largely by (Taber et al., 1987).”
ResultOpportunities and obstacles for deep learning in biology and medicine
Ching, T., Himmelstein, D. S., Beaulieu-Jones, B. K., Kalinin, A. A., Do, B. T., Way, G. P., Ferrero, E., Agapow, P.-M., Zietz, M., Hoffman, M. M., et al. (2018) · Journal of The Royal Society Interface · doi:10.1098/rsif.2017.0387 · Cited by 2,310
“Broader recent benchmarking has shown that relative merits of these methods depends on the dataset and cross validation strategy [312], though evaluation often uses auROC (area under the receiver operating characteristic curve), which has limited utility due to the large active/inactive class imbalance (see Discussion…”
BackgroundMethodAnalyzing Learned Molecular Representations for Property Prediction
Yang, K., Swanson, K., Jin, W., Coley, C., Eiden, P., Gao, H., Guzman-Perez, A., Hopper, T., Kelley, B., Mathea, M., et al. (2019) · Journal of Chemical Information and Modeling · doi:10.1021/acs.jcim.9b00237 · Cited by 1,923
The rise of deep learning in drug discovery
Chen, H., Engkvist, O., Wang, Y., Olivecrona, M., & Blaschke, T. (2018) · Drug Discovery Today · doi:10.1016/j.drudis.2018.01.039 · Cited by 1,770
“[91] introduced the MoleculeNet dataset by curating Structure generation from recurrent neural networks (RNNs).”
MethodAutomatic Chemical Design Using a Data-Driven Continuous Representation of Molecules.
Gómez‐Bombarelli, R., Wei, J. N., Duvenaud, D., Hernández-Lobato, J. M., Sánchez-Lengeling, B., Sheberla, D., Aguilera‐Iparraguirre, J., Hirzel, T. D., Adams, R. P., & Aspuru‐Guzik, A. (2018) · Cambridge University Engineering Department Publications Database · doi:10.17863/cam.34134 · Cited by 1,703
ProTox 3.0: a webserver for the prediction of toxicity of chemicals
Banerjee, P., Kemmler, E., Dunkel, M., & Preissner, R. (2024) · Nucleic Acids Research · doi:10.1093/nar/gkae303 · Cited by 1,601
“The datasets were obtained from the ClinTox dataset ( 30 ).”
MethodThe rise of artificial intelligence in healthcare applications
Bohr, A., & Memarzadeh, K. (2020) · Artificial Intelligence in Healthcare · doi:10.1016/b978-0-12-818438-7.00002-2 · Cited by 1,636
Weisfeiler and Leman Go Neural: Higher-Order Graph Neural Networks
Morris, C., Ritzert, M., Fey, M., Hamilton, W. L., Lenssen, J. E., Rattan, G., & Grohe, M. (2019) · Proceedings of the AAAI Conference on Artificial Intelligence · doi:10.1609/aaai.v33i01.33014602 · Cited by 1,210
Open Graph Benchmark: Datasets for Machine Learning on Graphs
Hu, W., Fey, M., Žitnik, M., Dong, Y., Ren, H., Liu, B., Catasta, M., & Leskovec, J. (2020) · arXiv (Cornell University) · doi:10.48550/arxiv.2005.00687 · Cited by 470
Recent advances and applications of deep learning methods in materials science
Choudhary, K., DeCost, B., Chen, C., Jain, A., Tavazza, F., Cohn, R., Park, C. W., Choudhary, A., Agrawal, A., Billinge, S. J. L., et al. (2022) · npj Computational Materials · doi:10.1038/s41524-022-00734-6 · Cited by 1,172
“com/deepchem/deepchem [107] dgl-lifesci Prot https://github.”
Matminer: An open source toolkit for materials data mining
Ward, L., Dunn, A., Faghaninia, A., Zimmermann, N. E. R., Bajaj, S., Wang, Q., Montoya, J., Chen, J., Bystrom, K., Dylla, M., et al. (2018) · Computational Materials Science · doi:10.1016/j.commatsci.2018.05.018 · Cited by 1,069
Machine learning in materials science
Wei, J., Chu, X., Sun, X., Xu, K., Deng, H., Chen, J., Wei, Z., & Lei, M. (2019) · InfoMat · doi:10.1002/inf2.12028 · Cited by 1,069
Xiong, Z., Wang, D., Liu, X., Zhong, F., Wan, X., Li, X., Li, Z., Luo, X., Chen, K., Jiang, H., et al. (2020) · Journal of Medicinal Chemistry · doi:10.1021/acs.jmedchem.9b00959 · Cited by 1,053
Drug discovery with explainable artificial intelligence
Jiménez-Luna, J., Grisoni, F., & Schneider, G. (2020) · Nature Machine Intelligence · doi:10.1038/s42256-020-00236-4 · Cited by 1,063
Concepts of Artificial Intelligence for Computer-Assisted Drug Discovery
Yang, X., Wang, Y., Byrne, R., Schneider, G., & Yang, S. (2019) · Chemical Reviews · doi:10.1021/acs.chemrev.8b00728 · Cited by 1,022
Machine Learning for Molecular Simulation
Noé, F., Tkatchenko, A., Müller, K.-R., & Clementi, C. (2020) · Annual Review of Physical Chemistry · doi:10.1146/annurev-physchem-042018-052331 · Cited by 956
“ML is also having a big impact in other areas of Chemistry without involving a physics-based model, for example by directly attempting to make predictions of physicochemical or pharmaceutical properties [38, 39, 40, 41], or to designing materials and molecules with certain desirable properties using generative learnin…”
BackgroundGraph neural networks for materials science and chemistry
Reiser, P., Neubert, M., Eberhard, A., Torresi, L., Zhou, C., Shao, C., Metni, H., van Hoesel, C., Schopmans, H., Sommer, T., et al. (2022) · Communications Materials · doi:10.1038/s43246-022-00315-6 · Cited by 860
Molecular contrastive learning of representations via graph neural networks
Wang, Y., Wang, J., Cao, Z., & Barati Farimani, A. (2022) · Nature Machine Intelligence · doi:10.1038/s42256-022-00447-x · Cited by 851
Molecular Sets (MOSES): A Benchmarking Platform for Molecular Generation Models
Polykovskiy, D., Zhebrak, A., Sanchez-Lengeling, B., Golovanov, S., Tatanov, O., Belyaev, S., Kurbanov, R., Artamonov, A., Aladinskiy, V., Veselov, M., et al. (2020) · Frontiers in Pharmacology · doi:10.3389/fphar.2020.565644 · Cited by 849
Combining Machine Learning and Computational Chemistry for Predictive Insights Into Chemical Systems
Keith, J. A., Vassilev-Galindo, V., Cheng, B., Chmiela, S., Gastegger, M., Müller, K.-R., & Tkatchenko, A. (2021) · Chemical Reviews · doi:10.1021/acs.chemrev.1c00107 · Cited by 849
Strategies for Pre-training Graph Neural Networks
Hu, W., Liu, B., Gomes, J. S., Žitnik, M., Liang, P., Pande, V. S., & Leskovec, J. (2019) · arXiv (Cornell University) · doi:10.48550/arxiv.1905.12265 · Cited by 158
“For example, in chemistry, predicting chemical properties such as toxicity of molecules is important to accelerate drug discovery, where molecules are naturally represented by molecular graphs [9, 23, 13, 21, 52, 56].”
BackgroundMethodInfluentialSelf-citationAugmenting large language models with chemistry tools
M. Bran, A., Cox, S., Schilter, O., Baldassari, C., White, A. D., & Schwaller, P. (2024) · Nature Machine Intelligence · doi:10.1038/s42256-024-00832-8 · Cited by 794
“• Train a random forest model to predict absorption max wavelength of molecules.”
MethodMol2vec: Unsupervised Machine Learning Approach with Chemical Intuition
Jaeger, S., Fulle, S., & Turk, S. (2018) · Journal of Chemical Information and Modeling · doi:10.1021/acs.jcim.7b00616 · Cited by 758
“Mol2vec yields better predictions (R 2ext = 0.86) than the originally reported multiple linear regression (MLR) model 25 as well as a molecular graph convolution method, 36 and importantly outperforms our Morgan FP based baseline model (R 2ext = 0.66).”
InfluentialMachine Learning in Computer-Aided Synthesis Planning
Coley, C. W., Green, W. H., & Jensen, K. F. (2018) · Accounts of Chemical Research · doi:10.1021/acs.accounts.8b00087 · Cited by 704
Deep learning for molecular design—a review of the state of the art
Elton, D. C., Boukouvalas, Z., Fuge, M. D., & Chung, P. W. (2019) · Molecular Systems Design & Engineering · doi:10.1039/c9me00039a · Cited by 683
Jiang, D., Wu, Z., Hsieh, C.-Y., Chen, G., Liao, B., Wang, Z., Shen, C., Cao, D., Wu, J., & Hou, T. (2021) · Journal of Cheminformatics · doi:10.1186/s13321-020-00479-8 · Cited by 664
Self-citationBig-Data Science in Porous Materials: Materials Genomics and Machine Learning
Jablonka, K. M., Ongari, D., Moosavi, S. M., & Smit, B. (2020) · Chemical Reviews · doi:10.1021/acs.chemrev.0c00004 · Cited by 599
A Critical Review of Machine Learning of Energy Materials
Chen, C., Zuo, Y., Ye, W., Li, X., Deng, Z., & Ong, S. P. (2020) · Advanced Energy Materials · doi:10.1002/aenm.201903242 · Cited by 609
Geometry-enhanced molecular representation learning for property prediction
Fang, X., Liu, L., Lei, J., He, D., Zhang, S., Zhou, J., Wang, F., Wu, H., & Wang, H. (2022) · Nature Machine Intelligence · doi:10.1038/s42256-021-00438-4 · Cited by 597
Explainability in Graph Neural Networks: A Taxonomic Survey
Yuan, H., Yu, H., Gui, S., & Ji, S. (2022) · IEEE Transactions on Pattern Analysis and Machine Intelligence · doi:10.1109/tpami.2022.3204236 · Cited by 583
“Molecular datasets are also widely used in explanation tasks, such as MUTAG [81], BBBP [82], and Tox21 [83].”
MethodLarge-scale chemical language representations capture molecular structure and properties
Ross, J., Belgodere, B., Chenthamarakshan, V., Padhi, I., Mroueh, Y., & Das, P. (2022) · Nature Machine Intelligence · doi:10.1038/s42256-022-00580-7 · Cited by 590
Large-scale comparison of machine learning methods for drug target prediction on ChEMBL
Mayr, A., Klambauer, G., Unterthiner, T., Steijaert, M., Wegner, J. K., Ceulemans, H., Clevert, D.-A., & Hochreiter, S. (2018) · Chemical Science · doi:10.1039/c8sc00148k · Cited by 584
Exploiting machine learning for end-to-end drug discovery and development
Ekins, S., Puhl, A. C., Zorn, K. M., Lane, T. R., Russo, D. P., Klein, J. J., Hickey, A. J., & Clark, A. M. (2019) · Nature Materials · doi:10.1038/s41563-019-0338-z · Cited by 578
Advancing drug discovery via artificial intelligence
Chan, H. C. S., Shan, H., Dahoun, T., Vogel, H., & Yuan, S. (2019) · Trends in Pharmacological Sciences · doi:10.1016/j.tips.2019.06.004 · Cited by 654
Explainability Methods for Graph Convolutional Neural Networks
Pope, P. E., Kolouri, S., Rostami, M., Martin, C. E., & Hoffmann, H. (2019) · 2019 IEEE/CVF Conference on Computer Vision and Pattern Recognition (CVPR) · doi:10.1109/cvpr.2019.01103 · Cited by 553
Rifaioglu, A. S., Atas, H., Martin, M. J., Cetin-Atalay, R., Atalay, V., & Doğan, T. (2019) · Briefings in Bioinformatics · doi:10.1093/bib/bby061 · Cited by 529
Physics-Inspired Structural Representations for Molecules and Materials
Musil, F., Grisafi, A., Bartók, A. P., Ortner, C., Csányi, G., & Ceriotti, M. (2021) · Chemical Reviews · doi:10.1021/acs.chemrev.1c00021 · Cited by 523
A compact review of molecular property prediction with graph neural networks
Wieder, O., Kohlbacher, S., Kuenemann, M., Garon, A., Ducrot, P., Seidel, T., & Langer, T. (2020) · Drug Discovery Today: Technologies · doi:10.1016/j.ddtec.2020.11.009 · Cited by 522
Adaptive Graph Convolutional Neural Networks
Li, R., Wang, S., Zhu, F., & Huang, J. (2018) · Proceedings of the AAAI Conference on Artificial Intelligence · doi:10.1609/aaai.v32i1.11691 · Cited by 842
ElemNet: Deep Learning the Chemistry of Materials From Only Elemental Composition
Jha, D., Ward, L., Paul, A., Liao, W.-K., Choudhary, A., Wolverton, C., & Agrawal, A. (2018) · Scientific Reports · doi:10.1038/s41598-018-35934-y · Cited by 510
Winter, R., Montanari, F., Noé, F., & Clevert, D.-A. (2019) · Chemical Science · doi:10.1039/c8sc04175j · Cited by 510
Machine Learning Methods for Small Data Challenges in Molecular Science
Dou, B., Zhu, Z., Merkurjev, E., Ke, L., Chen, L., Jiang, J., Zhu, Y., Liu, J., Zhang, B., & Wei, G.-W. (2023) · Chemical Reviews · doi:10.1021/acs.chemrev.3c00189 · Cited by 499
DeepPurpose: a deep learning library for drug–target interaction prediction
Huang, K., Fu, T., Glass, L. M., Zitnik, M., Xiao, C., & Sun, J. (2021) · Bioinformatics · doi:10.1093/bioinformatics/btaa1005 · Cited by 484
PotentialNet for Molecular Property Prediction
Feinberg, E. N., Sur, D., Wu, Z., Husic, B. E., Mai, H., Li, Y., Sun, S., Yang, J., Ramsundar, B., & Pande, V. S. (2018) · ACS Central Science · doi:10.1021/acscentsci.8b00507 · Cited by 481
Self-citationArtificial intelligence for natural product drug discovery
Mullowney, M. W., Duncan, K. R., Elsayed, S. S., Garg, N., van der Hooft, J. J. J., Martin, N. I., Meijer, D., Terlouw, B. R., Biermann, F., Blin, K., et al. (2023) · Nature Reviews Drug Discovery · doi:10.1038/s41573-023-00774-7 · Cited by 460
“Using pre-validated and pre-trained chemical models such as ChemBERTa 139 or MoleculeNet 102 reduces the computational load required to train new models from scratch.”
BackgroundMethodSelf-Supervised Graph Transformer on Large-Scale Molecular Data
Rong, Y., Bian, Y., Xu, T., Xie, W., Wei, Y., Huang, W., & Huang, J. (2020) · arXiv (Cornell University) · doi:10.48550/arxiv.2007.02835 · Cited by 388
“To thoroughly evaluate GROVER on downstream tasks, we conduct experiments on 11 benchmark datasets from the MoleculeNet [58] with various targets, such as quantum mechanics, physical chemistry, biophysics and physiology.”
InfluentialSelf-Supervised Representation Learning: Introduction, advances, and challenges
Ericsson, L., Gouk, H., Loy, C. C., & Hospedales, T. M. (2022) · IEEE Signal Processing Magazine · doi:10.1109/msp.2021.3134634 · Cited by 433
“In such applications data are intrinsically hard to collect, but predicting graph properties can significantly impact tasks such as drug discovery and material discovery [92], [93].”
Artificial intelligence in drug discovery: recent advances and future perspectives
Jiménez-Luna, J., Grisoni, F., Weskamp, N., & Schneider, G. (2021) · Expert Opinion on Drug Discovery · doi:10.1080/17460441.2021.1909567 · Cited by 464
“For example, the MoleculeNet benchmarking suite [9] aims to facilitate model testing by providing a timely evaluation of many popular deep learning architectures for drug-related property predictions in well-curated datasets from areas such as biophysics, physical chemistry, and physiology.”
BackgroundMethodPhysics-Inspired Structural Representations for Molecules and Materials
Musil, F., Grisafi, A., Bartók, A., Ortner, C., Cśanyi, G., Ceriotti, M., et al. (2021) · Cambridge University Engineering Department Publications Database · Cited by 440
Dunn, A., Wang, Q., Ganose, A., Dopp, D., & Jain, A. (2020) · npj Computational Materials · doi:10.1038/s41524-020-00406-3 · Cited by 411
Vatansever, S., Schlessinger, A., Wacker, D., Kaniskan, H. Ü., Jin, J., Zhou, M., & Zhang, B. (2021) · Medicinal Research Reviews · doi:10.1002/med.21764 · Cited by 429
“154,155 Using their GCN model, the authors performed a large ‐ scale screening and identified a promising new antibiotic, halicin.”
Computational Approach to Molecular Catalysis by 3d Transition Metals: Challenges and Opportunities
Vogiatzis, K. D., Polynski, M. V., Kirkland, J. K., Townsend, J., Hashemi, A., Liu, C., & Pidko, E. A. (2019) · Chemical Reviews · doi:10.1021/acs.chemrev.8b00361 · Cited by 423
Graph convolutional networks for computational drug development and discovery
Sun, M., Zhao, S., Gilvary, C., Elemento, O., Zhou, J., & Wang, F. (2020) · Briefings in Bioinformatics · doi:10.1093/bib/bbz042 · Cited by 413
CFM-ID 4.0: More Accurate ESI-MS/MS Spectral Prediction and Compound Identification
Wang, F., Liigand, J., Tian, S., Arndt, D., Greiner, R., & Wishart, D. S. (2021) · Analytical Chemistry · doi:10.1021/acs.analchem.1c01465 · Cited by 409
ChemBERTa: Large-Scale Self-Supervised Pretraining for Molecular Property Prediction
Chithrananda, S., Grand, G., & Ramsundar, B. (2020) · arXiv (Cornell University) · doi:10.48550/arxiv.2010.09885 · Cited by 379
“We evaluated our models on several classification tasks from MoleculeNet [30] selected to cover a range of dataset sizes (1.5K - 41.1K examples) and medicinal chemistry applications (brain penetrability, toxicity, and on-target inhibition).”
MethodInfluentialSelf-citationSelf-Supervised Learning of Graph Neural Networks: A Unified Review
Xie, Y., Xu, Z., Zhang, J., Wang, Z., & Ji, S. (2023) · IEEE Transactions on Pattern Analysis and Machine Intelligence · doi:10.1109/tpami.2022.3170559 · Cited by 389
“importance to make use of a massive amount of unlabeled graphs such as molecular graphs [21], [22].”
BackgroundDeep learning in drug discovery: an integrative review and future challenges
Askr, H., Elgeldawi, E., Aboul Ella, H., Elshaier, Y. A. M. M., Gomaa, M. M., & Hassanien, A. E. (2023) · Artificial Intelligence Review · doi:10.1007/s10462-022-10306-1 · Cited by 390
“S ec on d, S M D IP c an no t m ak e re co m - m en da tio ns fo r t he b es t c ou rs e of a ct io n to b e do ne fo r t he m an ag em en t o f D D I si nc e it ca nn ot fo re ca st th e un fa vo ra bl e eff ec ts b ro ug ht o n by th e in te ra ct io n 1 3 Researchers may now use deep neural networks to analyze medi…”
BackgroundArtificial Intelligence in Drug Design
Hessler, G., & Baringhaus, K.-H. (2018) · Molecules · doi:10.3390/molecules23102520 · Cited by 373
Geometric deep learning on molecular representations
Atz, K., Grisoni, F., & Schneider, G. (2021) · Nature Machine Intelligence · doi:10.1038/s42256-021-00418-8 · Cited by 373
Multi-objective de novo drug design with conditional graph generative model
Li, Y., Zhang, L., & Liu, Z. (2018) · Journal of Cheminformatics · doi:10.1186/s13321-018-0287-6 · Cited by 376
“Graph convolution In this work, we rely on graph convolutional network (GCN) [24] to extract information from intermediate graph states Gi .”
MethodDrug–target affinity prediction using graph neural network and contact maps
Jiang, M., Li, Z., Zhang, S., Wang, S., Wang, X., Yuan, Q., & Wei, Z. (2020) · RSC Advances · doi:10.1039/d0ra02297g · Cited by 372
Transfer Learning for Drug Discovery
Cai, C., Wang, S., Xu, Y., Zhang, W., Tang, K., Ouyang, Q., Lai, L., & Pei, J. (2020) · Journal of Medicinal Chemistry · doi:10.1021/acs.jmedchem.9b02147 · Cited by 366
Nandy, A., Duan, C., Taylor, M. G., Liu, F., Steeves, A. H., & Kulik, H. J. (2021) · Chemical Reviews · doi:10.1021/acs.chemrev.1c00347 · Cited by 358
Jing, Y., Bian, Y., Hu, Z., Wang, L., & Xie, X.-Q. S. (2018) · The AAPS Journal · doi:10.1208/s12248-018-0210-0 · Cited by 351
“Recently, Wu et al. introduced their large-scale benchmark package, MoleculeNet, for molecular ML study (52).”
BackgroundKorotcov, A., Tkachenko, V., Russo, D. P., & Ekins, S. (2017) · Molecular Pharmaceutics · doi:10.1021/acs.molpharmaceut.7b00578 · Cited by 352
“Most recently, one group has suggested some datasets for molecular machine learning and used these for comparison with selected machine learning methods 41 .”
BackgroundMethodYang, Z., Zhong, W., Zhao, L., & Yu-Chian Chen, C. (2022) · Chemical Science · doi:10.1039/d1sc05180f · Cited by 344
Artificial Intelligence and Machine Learning Technology Driven Modern Drug Discovery and Development
Sarkar, C., Das, B., Rawat, V. S., Wahlang, J. B., Nongpiur, A., Tiewsoh, I., Lyngdoh, N. M., Das, D., Bidarolli, M., & Sony, H. T. (2023) · International Journal of Molecular Sciences · doi:10.3390/ijms24032026 · Cited by 347
“In comparison with Kearnes’ method, this approach commonly yields superior prediction outcomes on public data groups of the “MoleculeNet” benchmark assignments [195].”
Chemformer: a pre-trained transformer for computational chemistry
Irwin, R., Dimitriadis, S., He, J., & Bjerrum, E. J. (2022) · Machine Learning: Science and Technology · doi:10.1088/2632-2153/ac3ffb · Cited by 343
DNA-Encoded Chemical Libraries: A Comprehensive Review with Succesful Stories and Future Challenges
Gironda-Martínez, A., Donckele, E. J., Samain, F., & Neri, D. (2021) · ACS Pharmacology & Translational Science · doi:10.1021/acsptsci.1c00118 · Cited by 344
A Comprehensive Survey on Deep Graph Representation Learning
Ju, W., Fang, Z., Gu, Y., Liu, Z., Long, Q., Qiao, Z., Qin, Y., Shen, J., Sun, F., Xiao, Z., et al. (2024) · Neural Networks · doi:10.1016/j.neunet.2024.106207 · Cited by 341
Jha, D., Choudhary, K., Tavazza, F., Liao, W.-K., Choudhary, A., Campbell, C., & Agrawal, A. (2019) · Nature Communications · doi:10.1038/s41467-019-13297-w · Cited by 339
Exposing the Limitations of Molecular Machine Learning with Activity Cliffs
van Tilborg, D., Alenicheva, A., & Grisoni, F. (2022) · Journal of Chemical Information and Modeling · doi:10.1021/acs.jcim.2c01073 · Cited by 337
“MoleculeACE complements existing benchmarks and datasets for molecular property prediction 30–33 by providing a novel framework specifically focused on identifying activity cliffs and quantifying the corresponding model performance.”
BackgroundUncertainty Quantification Using Neural Networks for Molecular Property Prediction
Hirschfeld, L., Swanson, K., Yang, K., Barzilay, R., & Coley, C. W. (2020) · Journal of Chemical Information and Modeling · doi:10.1021/acs.jcim.0c00502 · Cited by 334
Lenselink, E. B., ten Dijke, N., Bongers, B., Papadatos, G., van Vlijmen, H. W. T., Kowalczyk, W., IJzerman, A. P., & van Westen, G. J. P. (2017) · Journal of Cheminformatics · doi:10.1186/s13321-017-0232-0 · Cited by 334
“Recently different flavors of neural networks also have shown to outperform random forests on various, diverse cheminformatics tasks [24].”
BackgroundBenchmarking graph neural networks for materials chemistry
Fung, V., Zhang, J., Juarez, E., & Sumpter, B. G. (2021) · npj Computational Materials · doi:10.1038/s41524-021-00554-0 · Cited by 332
Uni-Mol: A Universal 3D Molecular Representation Learning Framework
Zhou, G., Gao, Z., Ding, Q., Zheng, H., Xu, H., Wei, Z., Zhang, L., & Ke, G. (2023) · ChemRxiv · doi:10.26434/chemrxiv-2022-jjm0j-v4 · Cited by 324
Machine Learning in Chemical Engineering: Strengths, Weaknesses, Opportunities, and Threats
Dobbelaere, M. R., Plehiers, P. P., Van de Vijver, R., Stevens, C. V., & Van Geem, K. M. (2021) · Engineering · doi:10.1016/j.eng.2021.03.019 · Cited by 323
AUC Maximization in the Era of Big Data and AI: A Survey
Yang, T., & Ying, Y. (2023) · ACM Computing Surveys · doi:10.1145/3554729 · Cited by 323
“Tox21, ToxCast) [174], MIT AICURES Challenge dataset (2), Stanford OGB benchmark datasets (e.”
BackgroundInfluentialBigSMILES: A Structurally-Based Line Notation for Describing Macromolecules
Lin, T.-S., Coley, C. W., Mochigase, H., Beech, H. K., Wang, W., Wang, Z., Woods, E., Craig, S. L., Johnson, J. A., Kalow, J. A., et al. (2019) · ACS Central Science · doi:10.1021/acscentsci.9b00476 · Cited by 322
Sieg, J., Flachsenberg, F., & Rarey, M. (2019) · Journal of Chemical Information and Modeling · doi:10.1021/acs.jcim.8b00712 · Cited by 321
AI in drug discovery and its clinical relevance
Qureshi, R., Irfan, M., Gondal, T. M., Khan, S., Wu, J., Hadi, M. U., Heymach, J., Le, X., Yan, H., & Alam, T. (2023) · Heliyon · doi:10.1016/j.heliyon.2023.e17575 · Cited by 319
“We need to develop “ImageNet” for molecules and more benchmarks like MoleculeNet [78].”
InfluentialZeng, X., Xiang, H., Yu, L., Wang, J., Li, K., Nussinov, R., & Cheng, F. (2022) · Nature Machine Intelligence · doi:10.1038/s42256-022-00557-6 · Cited by 308
“The rise of advanced artificial intelligence technologies 9,10 motivated their application to drug design 11–13 and target identification 14–16 .”
BackgroundExploiting Edge Features for Graph Neural Networks
Gong, L., & Cheng, Q. (2019) · 2019 IEEE/CVF Conference on Computer Vision and Pattern Recognition (CVPR) · doi:10.1109/cvpr.2019.00943 · Cited by 279
“Our models are compared with two baseline models which are shown in MoleculeNet [31]: Random Forest and Weave.”
MethodA Structure-Based Platform for Predicting Chemical Reactivity
Sandfort, F., Strieth-Kalthoff, F., Kühnemund, M., Beecks, C., & Glorius, F. (2020) · Chem · doi:10.1016/j.chempr.2020.02.017 · Cited by 288
Visan, A. I., & Negut, I. (2024) · Life · doi:10.3390/life14020233 · Cited by 279
“Significant progress has been made in various areas through the use of AI technology, including predicting molecular properties and activities [104–106], virtual screening [107,108], retrosynthetic analysis [109,110], and generating new drugs [111,112].”
BackgroundDeep learning methods for molecular representation and property prediction
Li, Z., Jiang, M., Wang, S., & Zhang, S. (2022) · Drug Discovery Today · doi:10.1016/j.drudis.2022.103373 · Cited by 279
WILDS: A Benchmark of in-the-Wild Distribution Shifts
Koh, P. W., Sagawa, S., Marklund, H., Xie, S. M., Zhang, M., Balsubramani, A., Hu, W., Yasunaga, M., Phillips, R. L., Gao, I., et al. (2020) · arXiv · doi:10.48550/arxiv.2012.07421 · Cited by 518
“While OGB-MolPCBA primarily focuses on predicting biophysical activity (e.g., protein binding), other datasets in MoleculeNet (Wu et al., 2018) include prediction of quantum mechanical properties (e.g., HOMO/LUMO), physical chemistry properties (e.g., water solubility), and physiological properties…”
InfluentialOn the Bottleneck of Graph Neural Networks and its Practical ImplicationsPreprint
Alon, U., & Yahav, E. (2020) · arXiv (Cornell University) · doi:10.48550/arxiv.2006.05205 · Cited by 732
“Data The QM9 dataset (Ramakrishnan et al., 2014; Gilmer et al., 2017; Wu et al., 2018) Models We used the implementation of Brockschmidt (2020) who performed an extensive hyper-parameter tuning for multiple GNNs, by searching over 500 configurations; we took the same training/validation/test splits…”
MethodA review of large language models and autonomous agents in chemistry
Ramos, M. C., Collison, C. J., & White, A. D. (2025) · Chemical Science · doi:10.1039/d4sc03921a · Cited by 274
Combustion machine learning: Principles, progress and prospects
Ihme, M., Chung, W. T., & Mishra, A. A. (2022) · Progress in Energy and Combustion Science · doi:10.1016/j.pecs.2022.101010 · Cited by 265
Scalia, G., Grambow, C. A., Pernici, B., Li, Y.-P., & Green, W. H. (2020) · Journal of Chemical Information and Modeling · doi:10.1021/acs.jcim.9b00975 · Cited by 269
GEOM, energy-annotated molecular conformations for property prediction and molecular generation
Axelrod, S., & Gómez-Bombarelli, R. (2022) · Scientific Data · doi:10.1038/s41597-022-01288-4 · Cited by 264
“Table 3 shows the species from MoleculeNet 31 that are included in GEOM.”
BackgroundMethodInfluentialArtificial intelligence in drug design
Zhong, F., Xing, J., Li, X., Liu, X., Fu, Z., Xiong, Z., Lu, D., Wu, X., Zhao, J., Tan, X., et al. (2018) · Science China Life Sciences · doi:10.1007/s11427-018-9342-2 · Cited by 259
“This model has been implemented in the DeepChem toolbox and the results of MoleculeNet benchmark tests suggest that the graph CNN can learn useful molecular features and it often performs better than other models (Wu et al., 2017).”
MethodOrbNet: Deep learning for quantum chemistry using symmetry-adapted atomic-orbital features
Qiao, Z., Welborn, M., Anandkumar, A., Manby, F. R., & Miller, T. F. (2020) · The Journal of Chemical Physics · doi:10.1063/5.0021955 · Cited by 242
DeepDDS: deep graph neural network with attention mechanism to predict synergistic drug combinations
Wang, J., Liu, X., Shen, S., Deng, L., & Liu, H. (2022) · Briefings in Bioinformatics · doi:10.1093/bib/bbab390 · Cited by 261
Is Multitask Deep Learning Practical for Pharma?
Ramsundar, B., Liu, B., Wu, Z., Verras, A., Tudor, M., Sheridan, R. P., & Pande, V. (2017) · Journal of Chemical Information and Modeling · doi:10.1021/acs.jcim.7b00146 · Cited by 263
Self-citationSELFIES and the future of molecular string representations
Krenn, M., Ai, Q., Barthel, S., Carson, N., Frei, A., Frey, N. C., Friederich, P., Gaudin, T., Gayle, A. A., Jablonka, K. M., et al. (2022) · Patterns · doi:10.1016/j.patter.2022.100588 · Cited by 261
Transformer-CNN: Swiss knife for QSAR modeling and interpretation
Karpov, P., Godin, G., & Tetko, I. V. (2020) · Journal of Cheminformatics · doi:10.1186/s13321-020-00423-w · Cited by 262
Metadata
- Authors
- Wu, Z., Ramsundar, B., Feinberg, E. N., Gomes, J., Geniesse, C., Pappu, A. S., Leswing, K., & Pande, V.
- Affiliations
- Stanford University (US)
- Stanford Medicine (US)
- Schrodinger (United States) (US)
- Corresponding author
- Pande, Vijay
- Venue
- Chemical Science
- Publisher
- Royal Society of Chemistry (RSC)
- Published
- 2018
- Volume
- 9
- Issue
- 2
- Pages
- 513-530
- ISSN
- 2041-6520 (ISSN-L)
- 2041-6539
- PMC
- PMC5868307
- OpenAlex
- W2594183968
- Cited by
- 3,107
- References
- 62
- Citations by year
- 2026: 553 · 2025: 561 · 2024: 485 · 2023: 387 · 2022: 328 · 2021: 309 · 2020: 251 · 2019: 144 · 2018: 73
- FWCI
- 98.85
- Type
- journal article
- Language
- en
- Open access
- diamond
- doi.org
- Licence
- Locations
- Chemical Science (publishedVersion, cc-by-nc)
- Europe PMC (PubMed Central) (publishedVersion, cc-by-nc)
- PubMed Central (publishedVersion, cc-by-nc)
- PubMed (publishedVersion)
- arXiv (Cornell University) (submittedVersion)
- The HKU Scholars Hub (University of Hong Kong) (submittedVersion)
- arXiv (Cornell University)
- Funders
- Hertz Foundation
- NIH (R01 GM062868, U19 AI109662)
- Topics
- Life Sciences › Pharmacology, Toxicology and Pharmaceutics › Drug Discovery › Computational Drug Discovery Methods
- Physical Sciences › Materials Science › Materials Chemistry › Machine Learning in Materials Science
- Physical Sciences › Physics and Astronomy › Atomic and Molecular Physics, and Optics › Advanced Chemical Physics Studies
- Keywords
- molecular machine learning, benchmark, MoleculeNet, molecular property prediction, DeepChem, open source software, data scarcity, imbalanced classification, quantum mechanical properties, biophysical properties
About these checks
Registry, retraction, Cites and statistics results are computed, not judged, with one exception: a printed reference that no index lists is read once by a model before it counts as a citation error. Claims are extracted by a model and kept only when their quote appears verbatim in the text; each cited source is then checked, with a model’s help, for whether it says what the claim relies on. Those verdicts can be wrong — read the claim’s quote and the cited source before relying on one.
Statistics and arithmetic are recomputed, not judged.
Confidence bands are shown only for fields calibrated on our annotated test set. None is calibrated yet, so no band is shown.
What counts as a claim ›How we measure confidence ›How we check this ›
Are you an author, or do you see a problem with this page? Request a review
Data sources
Bibliographic data: Semantic Scholar, OpenAlex, Crossref.
Contains information from the Semantic Scholar Academic Graph Datasets, made available under the ODC Attribution License (ODC-BY 1.0).
Semantic Scholar’s data is described in: Kinney, R., et al. (2023). The Semantic Scholar Open Data Platform. arXiv:2301.10140.
