

The DOI matches its Crossref record; 6 of the 6 references it cites were found in a registry or an index.
The Reactome pathway Knowledgebase
Open accessAbstract
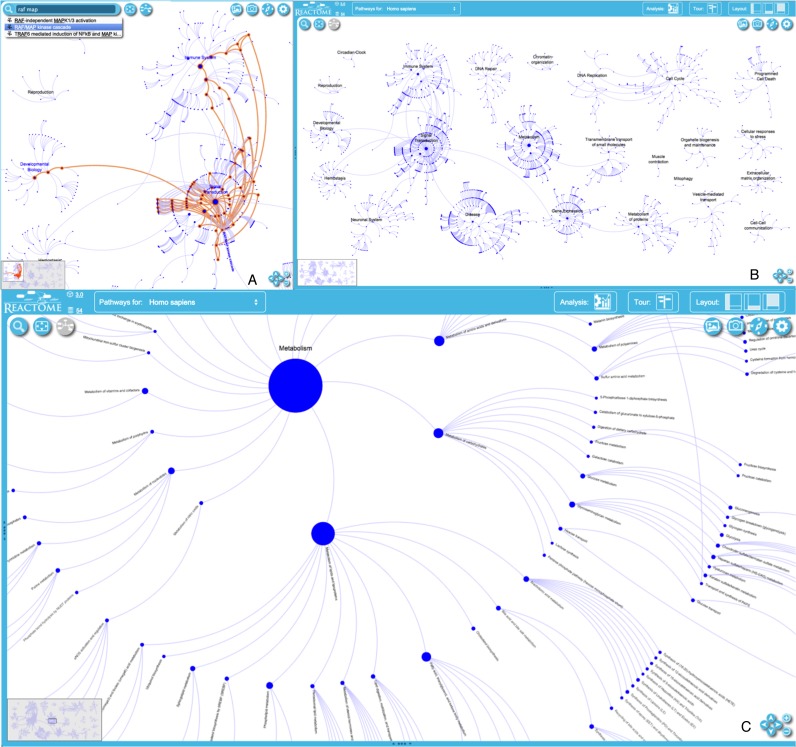
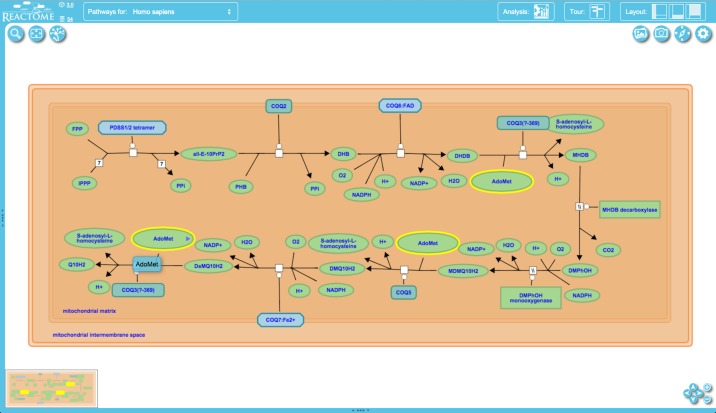
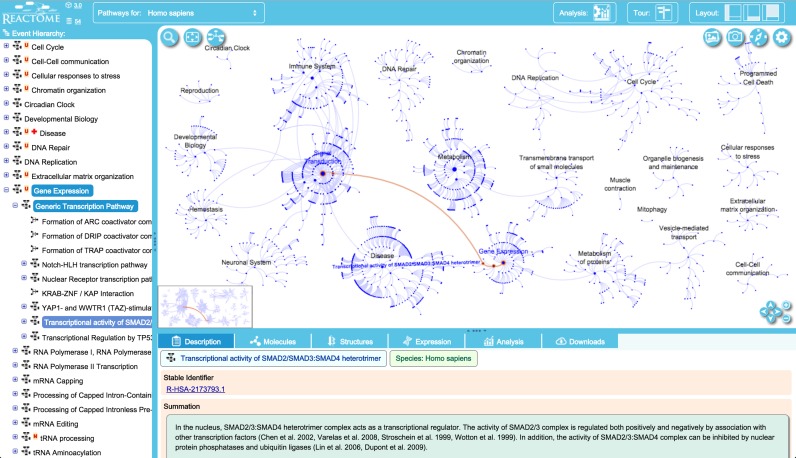
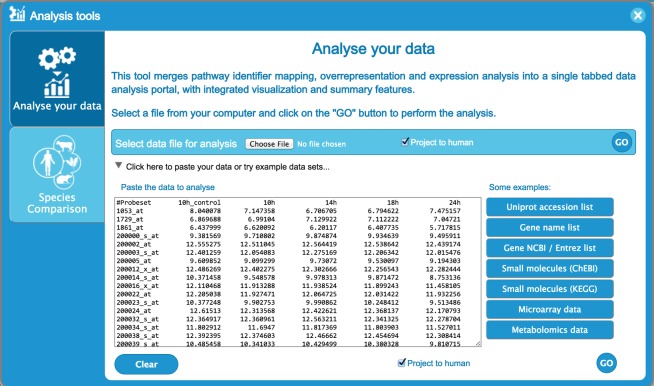
The Reactome Knowledgebase (www.reactome.org) provides molecular details of signal transduction, transport, DNA replication, metabolism and other cellular processes as an ordered network of molecular transformations-an extended version of a classic metabolic map, in a single consistent data model. Reactome functions both as an archive of biological processes and as a tool for discovering unexpected functional relationships in data such as gene expression pattern surveys or somatic mutation catalogues from tumour cells. Over the last two years we redeveloped major components of the Reactome web interface to improve usability, responsiveness and data visualization. A new pathway diagram viewer provides a faster, clearer interface and smooth zooming from the entire reaction network to the details of individual reactions. Tool performance for analysis of user datasets has been substantially improved, now generating detailed results for genome-wide expression datasets within seconds. The analysis module can now be accessed through a RESTFul interface, facilitating its inclusion in third party applications. A new overview module allows the visualization of analysis results on a genome-wide Reactome pathway hierarchy using a single screen page. The search interface now provides auto-completion as well as a faceted search to narrow result lists efficiently.
Overview
The claims and statistics of this paper haven’t been checked yet.
Run the check — free, no account needed. It reads the open-access text and checks the sources it cites.
Integrity signals
Registry
Cites
Statistics
Figures
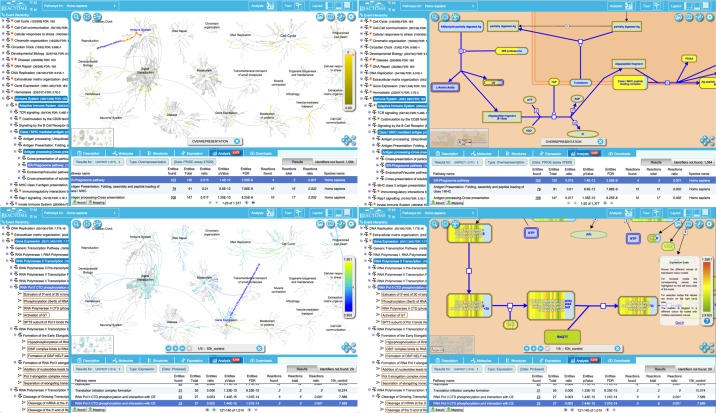
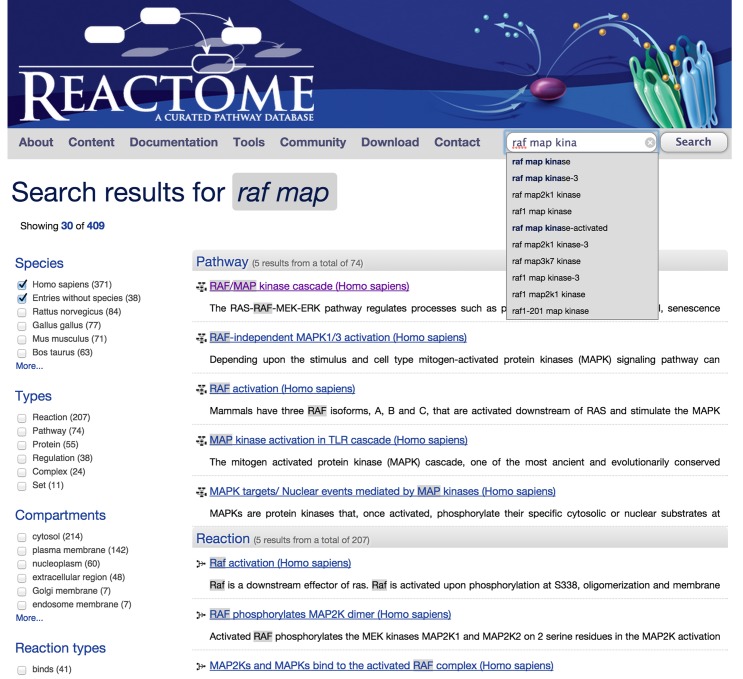
Verification
Claims the paper makes
The claims and statistics of this paper haven’t been checked yet.
Run the check — free, no account needed. It reads the open-access text and checks the sources it cites.
Claims other papers make about this one
Each is checked against this paper’s own text: does it say what the citing paper says it does?
The cited source says what the claim attributes to it.
In the citing paper
“Gene set enrichment analysis21 (Fig. 5c and Supplementary Data 7) reveals that cluster 7 is enriched in genes related to antigen presentation, while the closely related clusters 5 and 6 feature genes related to anti-inflammatory responses (IL-10, IL-4, and IL-13).”
From Single cell RNA sequencing of human microglia uncovers a subset associated with Alzheimer’s disease (2020) · cites this paper as [21]
Self-check
Percentages, sums and reported differences re-computed from the paper’s own numbers.
The self-check needs the paper’s full text.
Citations
Cites
Gene Ontology: tool for the unification of biology
Ashburner, M., Ball, C. A., Blake, J. A., Botstein, D., Butler, H., Cherry, J. M., Davis, A. P., Dolinski, K., Dwight, S. S., Eppig, J. T., et al. (2000) · Nature Genetics · doi:10.1038/75556 · Cited by 43,206
Caspi, R., Billington, R., Ferrer, L., Foerster, H., Fulcher, C. A., Keseler, I. M., Kothari, A., Krummenacker, M., Latendresse, M., Mueller, L. A., et al. (2016) · Nucleic Acids Research · doi:10.1093/nar/gkv1164 · Cited by 3,395
Pancreatic cancer genomes reveal aberrations in axon guidance pathway genes
Initiative, A. P. C. G., Biankin, A. V., Waddell, N., Kassahn, K. S., Gingras, M.-C., Muthuswamy, L. B., Johns, A. L., Miller, D. K., Wilson, P. J., Patch, A.-M., et al. (2012) · Nature · doi:10.1038/nature11547 · Cited by 2,058
Self-citationThe BioPAX community standard for pathway data sharing
Demir, E., Cary, M. P., Paley, S., Fukuda, K., Lemer, C., Vastrik, I., Wu, G., D'Eustachio, P., Schaefer, C., Luciano, J., et al. (2010) · Nature Biotechnology · doi:10.1038/nbt.1666 · Cited by 745
Self-citationLibSBML: an API Library for SBML
Bornstein, B. J., Keating, S. M., Jouraku, A., & Hucka, M. (2008) · Bioinformatics · doi:10.1093/bioinformatics/btn051 · Cited by 373
Controlled vocabularies and semantics in systems biology
Courtot, M., Juty, N., Knüpfer, C., Waltemath, D., Zhukova, A., Dräger, A., Dumontier, M., Finney, A., Golebiewski, M., Hastings, J., et al. (2011) · Molecular Systems Biology · doi:10.1038/msb.2011.77 · Cited by 316
Research works printed but not linked: 4
- Croft, 2014, The Reactome Pathway Knowledgebase, Nucleic Acids Res., 4, D472, 10.1093/nar/gkt1102 · DOI · Paper page
- 10.1093/nar/gku1011 · DOI
- 10.1093/nar/gku1179 · DOI · Paper page
- 10.1161/ATVBAHA.113.301147 · DOI
Cited by
Sorted by citations
Szklarczyk, D., Gable, A. L., Lyon, D., Junge, A., Wyder, S., Huerta-Cepas, J., Simonovic, M., Doncheva, N. T., Morris, J. H., Bork, P., et al. (2019) · Nucleic Acids Research · doi:10.1093/nar/gky1131 · Cited by 17,749
Metascape provides a biologist-oriented resource for the analysis of systems-level datasets
Zhou, Y., Zhou, B., Pache, L., Chang, M., Khodabakhshi, A. H., Tanaseichuk, O., Benner, C., & Chanda, S. K. (2019) · Nature Communications · doi:10.1038/s41467-019-09234-6 · Cited by 14,611
STRING v10: protein–protein interaction networks, integrated over the tree of life
Szklarczyk, D., Franceschini, A., Wyder, S., Forslund, K., Heller, D., Huerta-Cepas, J., Simonovic, M., Roth, A., Santos, A., Tsafou, K. P., et al. (2015) · Nucleic Acids Research · doi:10.1093/nar/gku1003 · Cited by 10,436
The Gene Ontology Resource: 20 years and still GOing strong
The Gene Ontology Consortium (2019) · Nucleic Acids Research · doi:10.1093/nar/gky1055 · Cited by 4,747
Raudvere, U., Kolberg, L., Kuzmin, I., Arak, T., Adler, P., Peterson, H., & Vilo, J. (2019) · Nucleic Acids Research · doi:10.1093/nar/gkz369 · Cited by 5,045
PubChem in 2021: new data content and improved web interfaces
Kim, S., Chen, J., Cheng, T., Gindulyte, A., He, J., He, S., Li, Q., Shoemaker, B. A., Thiessen, P. A., Yu, B., et al. (2021) · Nucleic Acids Research · doi:10.1093/nar/gkaa971 · Cited by 3,953
HMDB 4.0: the human metabolome database for 2018
Wishart, D. S., Feunang, Y. D., Marcu, A., Guo, A. C., Liang, K., Vázquez-Fresno, R., Sajed, T., Johnson, D., Li, C., Karu, N., et al. (2018) · Nucleic Acids Research · doi:10.1093/nar/gkx1089 · Cited by 3,438
Alzheimer Disease Genetics Consortium (ADGC), Kunkle, B. W., The European Alzheimer’s Disease Initiative (EADI), Cohorts for Heart and Aging Research in Genomic Epidemiology Consortium (CHARGE), Genetic and Environmental Risk in AD/Defining Genetic, P. A. E. R. F. A. D. C. (., Grenier-Boley, B., Sims, R., Bis, J. C., Damotte, V., Naj, A. C., et al. (2019) · Nature Genetics · doi:10.1038/s41588-019-0358-2 · Cited by 2,946
A subcellular map of the human proteome
Thul, P. J., Åkesson, L., Wiking, M., Mahdessian, D., Geladaki, A., Ait Blal, H., Alm, T., Asplund, A., Björk, L., Breckels, L. M., et al. (2017) · Science · doi:10.1126/science.aal3321 · Cited by 2,813
Li, W., Xu, H., Xiao, T., Cong, L., Love, M. I., Zhang, F., Irizarry, R. A., Liu, J. S., Brown, M., & Liu, X. S. (2014) · Genome Biology · doi:10.1186/s13059-014-0554-4 · Cited by 2,684
Moffitt, R. A., Marayati, R., Flate, E. L., Volmar, K. E., Loeza, S. G. H., Hoadley, K. A., Rashid, N. U., Williams, L. A., Eaton, S. C., Chung, A. H., et al. (2015) · Nature Genetics · doi:10.1038/ng.3398 · Cited by 2,194
Current best practices in single-cell RNA-seq analysis: a tutorial
Luecken, M. D., & Theis, F. J. (2019) · Molecular Systems Biology · doi:10.15252/msb.20188746 · Cited by 2,231
GERAD1 Consortium, Pardiñas, A. F., CRESTAR Consortium, Holmans, P., Pocklington, A. J., Escott-Price, V., Ripke, S., Carrera, N., Legge, S. E., Bishop, S., et al. (2018) · Nature Genetics · doi:10.1038/s41588-018-0059-2 · Cited by 1,552
Fritsche, L. G., Igl, W., Bailey, J. N. C., Grassmann, F., Sengupta, S., Bragg-Gresham, J. L., Burdon, K. P., Hebbring, S. J., Wen, C., Gorski, M., et al. (2016) · Nature Genetics · doi:10.1038/ng.3448 · Cited by 1,544
Multi-Omics Factor Analysis—a framework for unsupervised integration of multi-omics data sets
Argelaguet, R., Velten, B., Arnol, D., Dietrich, S., Zenz, T., Marioni, J. C., Buettner, F., Huber, W., & Stegle, O. (2018) · Molecular Systems Biology · doi:10.15252/msb.20178124 · Cited by 1,510
Multiplex single-cell profiling of chromatin accessibility by combinatorial cellular indexing
Cusanovich, D. A., Daza, R., Adey, A., Pliner, H. A., Christiansen, L., Gunderson, K. L., Steemers, F. J., Trapnell, C., & Shendure, J. (2015) · Science · doi:10.1126/science.aab1601 · Cited by 1,248
Gene expression elucidates functional impact of polygenic risk for schizophrenia
Fromer, M., Roussos, P., Sieberts, S. K., Johnson, J. S., Kavanagh, D. H., Perumal, T. M., Ruderfer, D. M., Oh, E. C., Topol, A., Shah, H. R., et al. (2016) · Nature Neuroscience · doi:10.1038/nn.4399 · Cited by 1,091
DisGeNET: a discovery platform for the dynamical exploration of human diseases and their genes
Pinero, J., Queralt-Rosinach, N., Bravo, A., Deu-Pons, J., Bauer-Mehren, A., Baron, M., Sanz, F., & Furlong, L. I. (2015) · Database · doi:10.1093/database/bav028 · Cited by 1,124
MOFA+: a statistical framework for comprehensive integration of multi-modal single-cell data
Argelaguet, R., Arnol, D., Bredikhin, D., Deloro, Y., Velten, B., Marioni, J. C., & Stegle, O. (2020) · Genome Biology · doi:10.1186/s13059-020-02015-1 · Cited by 1,091
Identification of bioactive metabolites using activity metabolomics
Rinschen, M. M., Ivanisevic, J., Giera, M., & Siuzdak, G. (2019) · Nature Reviews Molecular Cell Biology · doi:10.1038/s41580-019-0108-4 · Cited by 1,008
Javierre, B. M., Burren, O. S., Wilder, S. P., Kreuzhuber, R., Hill, S. M., Sewitz, S., Cairns, J., Wingett, S. W., Várnai, C., Thiecke, M. J., et al. (2016) · Cell · doi:10.1016/j.cell.2016.09.037 · Cited by 1,046
CD28 Costimulation: From Mechanism to Therapy
Esensten, J. H., Helou, Y. A., Chopra, G., Weiss, A., & Bluestone, J. A. (2016) · Immunity · doi:10.1016/j.immuni.2016.04.020 · Cited by 937
Undulating changes in human plasma proteome profiles across the lifespan
Lehallier, B., Gate, D., Schaum, N., Nanasi, T., Lee, S. E., Yousef, H., Moran Losada, P., Berdnik, D., Keller, A., Verghese, J., et al. (2019) · Nature Medicine · doi:10.1038/s41591-019-0673-2 · Cited by 981
Dual proteome-scale networks reveal cell-specific remodeling of the human interactome
Huttlin, E. L., Bruckner, R. J., Navarrete-Perea, J., Cannon, J. R., Baltier, K., Gebreab, F., Gygi, M. P., Thornock, A., Zarraga, G., Tam, S., et al. (2020) · doi:10.1101/2020.01.19.905109 · Cited by 960
Monaco, G., Lee, B., Xu, W., Mustafah, S., Hwang, Y. Y., Carré, C., Burdin, N., Visan, L., Ceccarelli, M., Poidinger, M., et al. (2019) · Cell Reports · doi:10.1016/j.celrep.2019.01.041 · Cited by 958
Orchestrating single-cell analysis with Bioconductor
Amezquita, R. A., Lun, A. T. L., Becht, E., Carey, V. J., Carpp, L. N., Geistlinger, L., Marini, F., Rue-Albrecht, K., Risso, D., Soneson, C., et al. (2020) · Nature Methods · doi:10.1038/s41592-019-0654-x · Cited by 945
Deep learning in cancer diagnosis, prognosis and treatment selection
Tran, K. A., Kondrashova, O., Bradley, A., Williams, E. D., Pearson, J. V., & Waddell, N. (2021) · Genome Medicine · doi:10.1186/s13073-021-00968-x · Cited by 932
Proteogenomic Characterization Reveals Therapeutic Vulnerabilities in Lung Adenocarcinoma
Gillette, M. A., Satpathy, S., Cao, S., Dhanasekaran, S. M., Vasaikar, S. V., Krug, K., Petralia, F., Li, Y., Liang, W.-W., Reva, B., et al. (2020) · Cell · doi:10.1016/j.cell.2020.06.013 · Cited by 820
Metastatic Latency and Immune Evasion through Autocrine Inhibition of WNT
Malladi, S., Macalinao, D. G., Jin, X., He, L., Basnet, H., Zou, Y., de Stanchina, E., & Massagué, J. (2016) · Cell · doi:10.1016/j.cell.2016.02.025 · Cited by 791
TREM2 regulates microglial cholesterol metabolism upon chronic phagocytic challenge
Nugent, A. A., Lin, K., van Lengerich, B., Lianoglou, S., Przybyla, L., Davis, S. S., Llapashtica, C., Wang, J., Kim, D. J., Xia, D., et al. (2020) · Neuron · doi:10.1016/j.neuron.2019.12.007 · Cited by 745
Systems biology and multi-omics integration: viewpoints from the metabolomics research community
Pinu, F. R., Beale, D. J., Paten, A. M., Kouremenos, K., Swarup, S., Schirra, H. J., & Wishart, D. (2019) · Metabolites · doi:10.3390/metabo9040076 · Cited by 723
Single cell RNA sequencing of human microglia uncovers a subset associated with Alzheimer’s disease
Olah, M., Menon, V., Habib, N., Taga, M. F., Ma, Y., Yung, C. J., Cimpean, M., Khairallah, A., Coronas-Samano, G., Sankowski, R., et al. (2020) · Nature Communications · doi:10.1038/s41467-020-19737-2 · Cited by 722
Dimitrov, D., Türei, D., Garrido-Rodriguez, M., Burmedi, P. L., Nagai, J. S., Boys, C., Ramirez Flores, R. O., Kim, H., Szalai, B., Costa, I. G., et al. (2022) · Nature Communications · doi:10.1038/s41467-022-30755-0 · Cited by 664
Proteogenomic and metabolomic characterization of human glioblastoma
Wang, L.-B., Karpova, A., Gritsenko, M. A., Kyle, J. E., Cao, S., Li, Y., Rykunov, D., Colaprico, A., Rothstein, J. H., Hong, R., et al. (2021) · Cancer Cell · doi:10.1016/j.ccell.2021.01.006 · Cited by 661
Aung, K. L., Fischer, S. E., Denroche, R. E., Jang, G.-H., Dodd, A., Creighton, S., Southwood, B., Liang, S.-B., Chadwick, D., Zhang, A., et al. (2018) · Clinical Cancer Research · doi:10.1158/1078-0432.ccr-17-2994 · Cited by 618
Identification of Genetic Factors that Modify Clinical Onset of Huntington’s Disease
Lee, J.-M., Wheeler, V. C., Chao, M. J., Vonsattel, J. P. G., Pinto, R. M., Lucente, D., Abu-Elneel, K., Ramos, E. M., Mysore, J. S., Gillis, T., et al. (2015) · Cell · doi:10.1016/j.cell.2015.07.003 · Cited by 655
Multi-omic machine learning predictor of breast cancer therapy response
Sammut, S.-J., Crispin-Ortuzar, M., Chin, S.-F., Provenzano, E., Bardwell, H. A., Ma, W., Cope, W., Dariush, A., Dawson, S.-J., Abraham, J. E., et al. (2022) · Nature · doi:10.1038/s41586-021-04278-5 · Cited by 654
Genome-wide CRISPR Screens in Primary Human T Cells Reveal Key Regulators of Immune Function
Shifrut, E., Carnevale, J., Tobin, V., Roth, T. L., Woo, J. M., Bui, C. T., Li, P. J., Diolaiti, M. E., Ashworth, A., & Marson, A. (2018) · Cell · doi:10.1016/j.cell.2018.10.024 · Cited by 573
Proteogenomic Characterization of Endometrial Carcinoma
Dou, Y., Kawaler, E. A., Cui Zhou, D., Gritsenko, M. A., Huang, C., Blumenberg, L., Karpova, A., Petyuk, V. A., Savage, S. R., Satpathy, S., et al. (2020) · Cell · doi:10.1016/j.cell.2020.01.026 · Cited by 485
Building a knowledge graph to enable precision medicine
Chandak, P., Huang, K., & Zitnik, M. (2023) · Scientific Data · doi:10.1038/s41597-023-01960-3 · Cited by 522
Mungall, C. J., McMurry, J. A., Köhler, S., Balhoff, J. P., Borromeo, C., Brush, M., Carbon, S., Conlin, T., Dunn, N., Engelstad, M., et al. (2017) · Nucleic Acids Research · doi:10.1093/nar/gkw1128 · Cited by 441
Sniekers, S., Stringer, S., Watanabe, K., Jansen, P. R., Coleman, J. R. I., Krapohl, E., Taskesen, E., Hammerschlag, A. R., Okbay, A., Zabaneh, D., et al. (2017) · Nature Genetics · doi:10.1038/ng.3869 · Cited by 490
Microbiota-derived 3-IAA influences chemotherapy efficacy in pancreatic cancer
Tintelnot, J., Xu, Y., Lesker, T. R., Schönlein, M., Konczalla, L., Giannou, A. D., Pelczar, P., Kylies, D., Puelles, V. G., Bielecka, A. A., et al. (2023) · Nature · doi:10.1038/s41586-023-05728-y · Cited by 478
Hou, Y., Lautrup, S., Cordonnier, S., Wang, Y., Croteau, D. L., Zavala, E., Zhang, Y., Moritoh, K., O’Connell, J. F., Baptiste, B. A., et al. (2018) · Proceedings of the National Academy of Sciences · doi:10.1073/pnas.1718819115 · Cited by 472
Biologically informed deep neural network for prostate cancer discovery
Elmarakeby, H. A., Hwang, J., Arafeh, R., Crowdis, J., Gang, S., Liu, D., AlDubayan, S. H., Salari, K., Kregel, S., Richter, C., et al. (2021) · Nature · doi:10.1038/s41586-021-03922-4 · Cited by 456
Single-nucleus profiling of human dilated and hypertrophic cardiomyopathy
Chaffin, M., Papangeli, I., Simonson, B., Akkad, A.-D., Hill, M. C., Arduini, A., Fleming, S. J., Melanson, M., Hayat, S., Kost-Alimova, M., et al. (2022) · Nature · doi:10.1038/s41586-022-04817-8 · Cited by 418
The next-generation Open Targets Platform: reimagined, redesigned, rebuilt
Ochoa, D., Hercules, A., Carmona, M., Suveges, D., Baker, J., Malangone, C., Lopez, I., Miranda, A., Cruz-Castillo, C., Fumis, L., et al. (2023) · Nucleic Acids Research · doi:10.1093/nar/gkac1046 · Cited by 432
Wang, H., Zhang, H., Wang, Y., Brown, Z. J., Xia, Y., Huang, Z., Shen, C., Hu, Z., Beane, J., Ansa-Addo, E. A., et al. (2021) · Journal of Hepatology · doi:10.1016/j.jhep.2021.07.032 · Cited by 398
the Accelerating Medicines Partnership Rheumatoid Arthritis and Systemic Lupus Erythematosus (AMP RA/SLE) Consortium, Der, E., Suryawanshi, H., Morozov, P., Kustagi, M., Goilav, B., Ranabothu, S., Izmirly, P., Clancy, R., Belmont, H. M., et al. (2019) · Nature Immunology · doi:10.1038/s41590-019-0386-1 · Cited by 403
A comprehensive single cell transcriptional landscape of human hematopoietic progenitors
Pellin, D., Loperfido, M., Baricordi, C., Wolock, S. L., Montepeloso, A., Weinberg, O. K., Biffi, A., Klein, A. M., & Biasco, L. (2019) · Nature Communications · doi:10.1038/s41467-019-10291-0 · Cited by 360
Meningeal lymphatic dysfunction exacerbates traumatic brain injury pathogenesis.
Bolte, A. C., Dutta, A. B., Hurt, M. E., Smirnov, I., Kovacs, M. A., McKee, C. A., Ennerfelt, H. E., Shapiro, D., Nguyen, B. H., Frost, E. L., et al. (2020) · Nature Communications · doi:10.1038/s41467-020-18113-4 · Cited by 357
Predicting transcriptional outcomes of novel multigene perturbations with GEARS
Roohani, Y., Huang, K., & Leskovec, J. (2024) · Nature Biotechnology · doi:10.1038/s41587-023-01905-6 · Cited by 355
Systematic Evaluation of Molecular Networks for Discovery of Disease Genes
Huang, J. K., Carlin, D. E., Yu, M. K., Zhang, W., Kreisberg, J. F., Tamayo, P., & Ideker, T. (2018) · Cell Systems · doi:10.1016/j.cels.2018.03.001 · Cited by 289
WD40 repeat domain proteins: a novel target class?
Schapira, M., Tyers, M., Torrent, M., & Arrowsmith, C. H. (2017) · Nature Reviews Drug Discovery · doi:10.1038/nrd.2017.179 · Cited by 335
Single-cell transcriptional profiles in human skeletal muscle
Rubenstein, A. B., Smith, G. R., Raue, U., Begue, G., Minchev, K., Ruf-Zamojski, F., Nair, V. D., Wang, X., Zhou, L., Zaslavsky, E., et al. (2020) · Scientific Reports · doi:10.1038/s41598-019-57110-6 · Cited by 323
Cano-Gamez, K., Soskic, B., Roumeliotis, T. I., So, E., Smyth, D. J., Baldrighi, M., Willé, D., Nakic, N., Esparza-Gordillo, J., Larminie, C. G. C., et al. (2020) · Nature Communications · doi:10.1038/s41467-020-15543-y · Cited by 274
Utilizing graph machine learning within drug discovery and development
Gaudelet, T., Day, B., Jamasb, A. R., Soman, J., Regep, C., Liu, G., Hayter, J. B. R., Vickers, R., Roberts, C., Tang, J., et al. (2021) · Briefings in Bioinformatics · doi:10.1093/bib/bbab159 · Cited by 313
Hill, W. D., Marioni, R. E., Maghzian, O., Ritchie, S. J., Hagenaars, S. P., McIntosh, A. M., Gale, C. R., Davies, G., & Deary, I. J. (2019) · Molecular Psychiatry · doi:10.1038/s41380-017-0001-5 · Cited by 311
Disease severity-specific neutrophil signatures in blood transcriptomes stratify COVID-19 patients
(DeCOI), G. C.-1. O. I., Aschenbrenner, A. C., Mouktaroudi, M., Krämer, B., Oestreich, M., Antonakos, N., Nuesch-Germano, M., Gkizeli, K., Bonaguro, L., Reusch, N., et al. (2021) · Genome Medicine · doi:10.1186/s13073-020-00823-5 · Cited by 255
Germline Chd8 haploinsufficiency alters brain development in mouse
Gompers, A. L., Su-Feher, L., Ellegood, J., Copping, N. A., Riyadh, M. A., Stradleigh, T. W., Pride, M. C., Schaffler, M. D., Wade, A. A., Catta-Preta, R., et al. (2017) · Nature Neuroscience · doi:10.1038/nn.4592 · Cited by 266
Single-cell analysis of olfactory neurogenesis and differentiation in adult humans
Durante, M. A., Kurtenbach, S., Sargi, Z. B., Harbour, J. W., Choi, R., Kurtenbach, S., Goss, G. M., Matsunami, H., & Goldstein, B. J. (2020) · Nature Neuroscience · doi:10.1038/s41593-020-0587-9 · Cited by 254
Atypical KRASG12R Mutant Is Impaired in PI3K Signaling and Macropinocytosis in Pancreatic Cancer
Hobbs, G. A., Baker, N. M., Miermont, A. M., Thurman, R. D., Pierobon, M., Tran, T. H., Anderson, A. O., Waters, A. M., Diehl, J. N., Papke, B., et al. (2020) · Cancer Discovery · doi:10.1158/2159-8290.cd-19-1006 · Cited by 231
SABIO-RK: an updated resource for manually curated biochemical reaction kinetics
Wittig, U., Rey, M., Weidemann, A., Kania, R., & Müller, W. (2018) · Nucleic Acids Research · doi:10.1093/nar/gkx1065 · Cited by 204
The BRENDA enzyme information system–From a database to an expert system
Schomburg, I., Jeske, L., Ulbrich, M., Placzek, S., Chang, A., & Schomburg, D. (2017) · Journal of Biotechnology · doi:10.1016/j.jbiotec.2017.04.020 · Cited by 222
Pereira, S., Kildegaard, H. F., & Andersen, M. R. (2018) · Biotechnology Journal · doi:10.1002/biot.201700499 · Cited by 214
HumanNet v2: human gene networks for disease research
Hwang, S., Kim, C. Y., Yang, S., Kim, E., Hart, T., Marcotte, E. M., & Lee, I. (2019) · Nucleic Acids Research · doi:10.1093/nar/gky1126 · Cited by 210
Liu, W., Taso, O., Wang, R., Bayram, S., Graham, A. C., Garcia-Reitboeck, P., Mallach, A., Andrews, W. D., Piers, T. M., Botia, J. A., et al. (2020) · Human Molecular Genetics · doi:10.1093/hmg/ddaa209 · Cited by 214
Probiotic Bacillus subtilis protects against α-synuclein aggregation in C. elegans
Goya, M. E., Xue, F., Sampedro-Torres-Quevedo, C., Arnaouteli, S., Riquelme-Dominguez, L., Romanowski, A., Brydon, J., Ball, K. L., Stanley-Wall, N. R., & Doitsidou, M. (2020) · Cell Reports · doi:10.1016/j.celrep.2019.12.078 · Cited by 205
V'kovski, P., Gerber, M., Kelly, J., Pfaender, S., Ebert, N., Braga Lagache, S., Simillion, C., Portmann, J., Stalder, H., Gaschen, V., et al. (2019) · eLife · doi:10.7554/elife.42037 · Cited by 186
A Review of bioinformatics tools for bio-prospecting from metagenomic sequence data
Roumpeka, D. D., Wallace, R. J., Escalettes, F., Fotheringham, I., & Watson, M. (2017) · Frontiers in Genetics · doi:10.3389/fgene.2017.00023 · Cited by 199
Beresford-Jones, B. S., Forster, S. C., Stares, M. D., Notley, G., Viciani, E., Browne, H. P., Boehmler, D. J., Soderholm, A. T., Kumar, N., Vervier, K., et al. (2022) · Cell Host & Microbe · doi:10.1016/j.chom.2021.12.003 · Cited by 194
Single cell molecular alterations reveal target cells and pathways of concussive brain injury
Arneson, D., Zhang, G., Ying, Z., Zhuang, Y., Byun, H. R., Ahn, I. S., Gomez-Pinilla, F., & Yang, X. (2018) · Nature Communications · doi:10.1038/s41467-018-06222-0 · Cited by 193
Pooled Knockin Targeting for Genome Engineering of Cellular Immunotherapies
Roth, T. L., Li, P. J., Blaeschke, F., Nies, J. F., Apathy, R., Mowery, C., Yu, R., Nguyen, M. L. T., Lee, Y., Truong, A., et al. (2020) · Cell · doi:10.1016/j.cell.2020.03.039 · Cited by 186
Dissecting intratumoral myeloid cell plasticity by single cell RNA-seq
Song, Q., Hawkins, G. A., Wudel, L., Chou, P., Forbes, E., Pullikuth, A. K., Liu, L., Jin, G., Craddock, L., Topaloglu, U., et al. (2019) · Cancer Medicine · doi:10.1002/cam4.2113 · Cited by 168
Moretti, S., Martin, O., Van Du Tran, T., Bridge, A., Morgat, A., & Pagni, M. (2016) · Nucleic Acids Research · doi:10.1093/nar/gkv1117 · Cited by 162
Johnson, A. A., Shokhirev, M. N., Wyss-Coray, T., & Lehallier, B. (2020) · Ageing Research Reviews · doi:10.1016/j.arr.2020.101070 · Cited by 166
TCRD and pharos 2021: mining the human proteome for disease biology
Sheils, T. K., Mathias, S. L., Kelleher, K. J., Siramshetty, V. B., Nguyen, D.-T., Bologa, C. G., Jensen, L. J., Vidović, D., Koleti, A., Schürer, S. C., et al. (2021) · Nucleic Acids Research · doi:10.1093/nar/gkaa993 · Cited by 160
Artificial Intelligence and Early Detection of Pancreatic Cancer: 2020 Summative Review
Kenner, B., Chari, S. T., Kelsen, D., Klimstra, D. S., Pandol, S. J., Rosenthal, M., Rustgi, A. K., Taylor, J. A., Yala, A., Abul-Husn, N., et al. (2021) · Pancreas · doi:10.1097/mpa.0000000000001762 · Cited by 158
GWAS for executive function and processing speed suggests involvement of the CADM2 gene
Ibrahim-Verbaas, C. A., Bressler, J., Debette, S., Schuur, M., Smith, A. V., Bis, J. C., Davies, G., Trompet, S., Smith, J. A., Wolf, C., et al. (2016) · Molecular Psychiatry · doi:10.1038/mp.2015.37 · Cited by 147
Beta-Poisson model for single-cell RNA-seq data analyses
Vu, T. N., Wills, Q. F., Kalari, K. R., Niu, N., Wang, L., Rantalainen, M., & Pawitan, Y. (2016) · Bioinformatics · doi:10.1093/bioinformatics/btw202 · Cited by 157
Overcoming Genetically Based Resistance Mechanisms to PD-1 Blockade
Torrejon, D. Y., Abril-Rodriguez, G., Champhekar, A. S., Tsoi, J., Campbell, K. M., Kalbasi, A., Parisi, G., Zaretsky, J. M., Garcia-Diaz, A., Puig-Saus, C., et al. (2020) · Cancer Discovery · doi:10.1158/2159-8290.cd-19-1409 · Cited by 146
Deelen, P., van Dam, S., Herkert, J. C., Karjalainen, J. M., Brugge, H., Abbott, K. M., van Diemen, C. C., van der Zwaag, P. A., Gerkes, E. H., Zonneveld-Huijssoon, E., et al. (2019) · Nature Communications · doi:10.1038/s41467-019-10649-4 · Cited by 138
Development of an in vitro human liver system for interrogating nonalcoholic steatohepatitis
Feaver, R. E., Cole, B. K., Lawson, M. J., Hoang, S. A., Marukian, S., Blackman, B. R., Figler, R. A., Sanyal, A. J., Wamhoff, B. R., & Dash, A. (2016) · JCI Insight · doi:10.1172/jci.insight.90954 · Cited by 153
Harding, S. D., Armstrong, J. F., Faccenda, E., Southan, C., Alexander, S. P. H., Davenport, A. P., Pawson, A. J., Spedding, M., Davies, J. A., & NC-IUPHAR (2022) · Nucleic Acids Research · doi:10.1093/nar/gkab1010 · Cited by 149
The BLUEPRINT Data Analysis Portal
Fernández, J. M., de la Torre, V., Richardson, D., Royo, R., Puiggròs, M., Moncunill, V., Fragkogianni, S., Clarke, L., Flicek, P., Rico, D., et al. (2016) · Cell Systems · doi:10.1016/j.cels.2016.10.021 · Cited by 151
A human multi-lineage hepatic organoid model for liver fibrosis
Guan, Y., Enejder, A., Wang, M., Fang, Z., Cui, L., Chen, S.-Y., Wang, J., Tan, Y., Wu, M., Chen, X., et al. (2021) · Nature Communications · doi:10.1038/s41467-021-26410-9 · Cited by 149
Winkler, T. W., Grassmann, F., Brandl, C., Kiel, C., Günther, F., Strunz, T., Weidner, L., Zimmermann, M. E., Korb, C. A., Poplawski, A., et al. (2020) · BMC Medical Genomics · doi:10.1186/s12920-020-00760-7 · Cited by 138
Bruno, M., Kersten, S., Bain, J. M., Jaeger, M., Rosati, D., Kruppa, M. D., Lowman, D. W., Rice, P. J., Graves, B., Ma, Z., et al. (2020) · Nature Microbiology · doi:10.1038/s41564-020-0780-3 · Cited by 145
The Mosaic Genome of Indigenous African Cattle as a Unique Genetic Resource for African Pastoralism
Kim, K., Kwon, T., Dessie, T., Yoo, D., Mwai, O. A., Jang, J., Sung, S., Lee, S., Salim, B., Jung, J., et al. (2020) · Nature Genetics · doi:10.1038/s41588-020-0694-2 · Cited by 140
Exploration of databases and methods supporting drug repurposing: a comprehensive survey
Tanoli, Z., Seemab, U., Scherer, A., Wennerberg, K., Tang, J., & Vähä-Koskela, M. (2021) · Briefings in Bioinformatics · doi:10.1093/bib/bbaa003 · Cited by 131
CytoTalk: De novo construction of signal transduction networks using single-cell transcriptomic data
Hu, Y., Peng, T., Gao, L., & Tan, K. (2021) · Science Advances · doi:10.1126/sciadv.abf1356 · Cited by 136
Pharos 2023: an integrated resource for the understudied human proteome
Kelleher, K. J., Sheils, T. K., Mathias, S. L., Yang, J. J., Metzger, V. T., Siramshetty, V. B., Nguyen, D.-T., Jensen, L. J., Vidović, D., Schürer, S. C., et al. (2023) · Nucleic Acids Research · doi:10.1093/nar/gkac1033 · Cited by 137
Siddharth, J., Chakrabarti, A., Pannérec, A., Karaz, S., Morin-Rivron, D., Masoodi, M., Feige, J. N., & Parkinson, S. J. (2017) · Aging · doi:10.18632/aging.101262 · Cited by 127
Boland, M. L., Oró, D., Tølbøl, K. S., Thrane, S. T., Nielsen, J. C., Cohen, T. S., Tabor, D. E., Fernandes, F., Tovchigrechko, A., Veidal, S. S., et al. (2019) · World Journal of Gastroenterology · doi:10.3748/wjg.v25.i33.4904 · Cited by 129
Barriga, F. M., Tsanov, K. M., Ho, Y.-J., Sohail, N., Zhang, A., Baslan, T., Wuest, A. N., Del Priore, I., Meškauskaitė, B., Livshits, G., et al. (2022) · Nature Cancer · doi:10.1038/s43018-022-00443-5 · Cited by 125
Extending the small-molecule similarity principle to all levels of biology with the Chemical Checker
Duran-Frigola, M., Pauls, E., Guitart-Pla, O., Bertoni, M., Alcalde, V., Amat, D., Juan-Blanco, T., & Aloy, P. (2020) · Nature Biotechnology · doi:10.1038/s41587-020-0502-7 · Cited by 126
Leiter, O., Seidemann, S., Overall, R. W., Ramasz, B., Rund, N., Schallenberg, S., Grinenko, T., Wielockx, B., Kempermann, G., & Walker, T. L. (2019) · Stem Cell Reports · doi:10.1016/j.stemcr.2019.02.009 · Cited by 119
Mistimed food intake and sleep alters 24-hour time-of-day patterns of the human plasma proteome
Depner, C. M., Melanson, E. L., McHill, A. W., & Wright, K. P. (2018) · Proceedings of the National Academy of Sciences · doi:10.1073/pnas.1714813115 · Cited by 122
Seninge, L., Anastopoulos, I., Ding, H., & Stuart, J. (2021) · Nature Communications · doi:10.1038/s41467-021-26017-0 · Cited by 107
Discovery of drug-omics associations in type 2 diabetes with generative deep-learning models
Allesøe, R. L., Lundgaard, A. T., Hernández Medina, R., Aguayo-Orozco, A., Johansen, J., Nissen, J. N., Brorsson, C., Mazzoni, G., Niu, L., Biel, J. H., et al. (2023) · Nature Biotechnology · doi:10.1038/s41587-022-01520-x · Cited by 111
Metadata
- Authors
- Fabregat, A., Sidiropoulos, K., Garapati, P., Gillespie, M., Hausmann, K., Haw, R., Jassal, B., Jupe, S., Korninger, F., McKay, S., Matthews, L., May, B., Milacic, M., Rothfels, K., Shamovsky, V., Webber, M., Weiser, J., Williams, M., Wu, G., Stein, L., Hermjakob, H., & D'Eustachio, P.
- Affiliations
- European Bioinformatics Institute (GB)
- Ontario Institute for Cancer Research (CA)
- New York University (US)
- ORCID
- Venue
- Nucleic Acids Research
- Publisher
- Oxford University Press (OUP)
- Published
- 2015-12-09
- Volume
- 44
- Issue
- D1
- Pages
- D481-D487
- ISSN
- 0305-1048 (ISSN-L)
- 1362-4962
- PMC
- PMC4702931
- OpenAlex
- W1989277387
- Cited by
- 5,605
- References
- 6
- Citations by year
- 2026: 18 · 2025: 133 · 2024: 368 · 2023: 491 · 2022: 738 · 2021: 968 · 2020: 827 · 2019: 667 · 2018: 483 · 2017: 386 · 2016: 265 · 2015: 187
- FWCI
- 153.21
- Type
- journal article
- Language
- en
- Open access
- gold
- doi.org
- Locations
- Nucleic Acids Research (publishedVersion, cc-by)
- Europe PMC (PubMed Central) (publishedVersion, cc-by)
- PubMed Central (publishedVersion, cc-by)
- PubMed (publishedVersion)
- Cold Spring Harbor Laboratory Institutional Repository (Cold Spring Harbor Laboratory) (acceptedVersion)
- HighWire Press Open Archive (submittedVersion)
- Funders
- National Institutes of Health
- National Human Genome Research Institute (U41HG003751, P41HG003751)
- National Institute of General Medical Sciences (U54GM114833)
- Topics
- Life Sciences › Biochemistry, Genetics and Molecular Biology › Molecular Biology › Bioinformatics and Genomic Networks
- Health Sciences › Medicine › Health Informatics › Biomedical Text Mining and Ontologies
- Life Sciences › Biochemistry, Genetics and Molecular Biology › Molecular Biology › Gene Regulatory Network Analysis
- Keywords
- Reactome, signal transduction, metabolic maps, cardiovascular disease, disease annotation, gene expression profiles, somatic mutations
- MeSH terms
- Humans, Proteins, Software, Signal Transduction, Gene Expression, Knowledge Bases, Metabolic Networks and Pathways, Databases, Chemical
About these checks
Registry, retraction, Cites and statistics results are computed, not judged, with one exception: a printed reference that no index lists is read once by a model before it counts as a citation error. Claims are extracted by a model and kept only when their quote appears verbatim in the text; each cited source is then checked, with a model’s help, for whether it says what the claim relies on. Those verdicts can be wrong — read the claim’s quote and the cited source before relying on one.
Statistics and arithmetic are recomputed, not judged.
Confidence bands are shown only for fields calibrated on our annotated test set. None is calibrated yet, so no band is shown.
What counts as a claim ›How we measure confidence ›How we check this ›
Are you an author, or do you see a problem with this page? Request a review
