

The DOI matches its Crossref record; 59 of the 59 references it cites were found in a registry or an index; 13 of the 65 sources its claims cite were checked for support.
miR-10b-5p expression in Huntington’s disease brain relates to age of onset and the extent of striatal involvement
Open accessAbstract
BACKGROUND: MicroRNAs (miRNAs) are small non-coding RNAs that recognize sites of complementarity of target messenger RNAs, resulting in transcriptional regulation and translational repression of target genes. In Huntington's disease (HD), a neurodegenerative disease caused by a trinucleotide repeat expansion, miRNA dyregulation has been reported, which may impact gene expression and modify the progression and severity of HD. METHODS: We performed next-generation miRNA sequence analysis in prefrontal cortex (Brodmann Area 9) from 26 HD, 2 HD gene positive, and 36 control brains. Neuropathological information was available for all HD brains, including age at disease onset, CAG-repeat size, Vonsattel grade, and Hadzi-Vonsattel striatal and cortical scores, a continuous measure of the extent of neurodegeneration. Linear models were performed to examine the relationship of miRNA expression to these clinical features, and messenger RNA targets of associated miRNAs were tested for gene ontology term enrichment. RESULTS: We identified 75 miRNAs differentially expressed in HD brain (FDR q-value <0.05). Among the HD brains, nine miRNAs were significantly associated with Vonsattel grade of neuropathological involvement and three of these, miR-10b-5p, miR-10b-3p, and miR-302a-3p, significantly related to the Hadzi-Vonsattel striatal score (a continuous measure of striatal involvement) after adjustment for CAG length. Five miRNAs (miR-10b-5p, miR-196a-5p, miR-196b-5p, miR-10b-3p, and miR-106a-5p) were identified as having a significant relationship to CAG length-adjusted age of onset including miR-10b-5p, the mostly strongly over-expressed miRNA in HD cases. Although prefrontal cortex was the source of tissue profiled in these studies, the relationship of miR-10b-5p expression to striatal involvement in the disease was independent of cortical involvement. Correlation of miRNAs to the clinical features clustered by direction of effect and the gene targets of the observed miRNAs showed association to processes relating to nervous system development and transcriptional regulation. CONCLUSIONS: These results demonstrate that miRNA expression in cortical BA9 provides insight into striatal involvement and support a role for these miRNAs, particularly miR-10b-5p, in HD pathogenicity. The miRNAs identified in our studies of postmortem brain tissue may be detectable in peripheral fluids and thus warrant consideration as accessible biomarkers for disease stage, rate of progression, and other important clinical characteristics of HD.
Overview
AI snapshot
Written from the paper’s full text.
TL;DR
Small RNA sequencing of Huntington’s disease (HD) prefrontal cortex identified widespread miRNA dysregulation, with miR-10b-5p as the most strongly over-expressed miRNA and a key correlate of striatal pathology and age of onset. The findings support a role for miRNAs, particularly miR-10b-5p, in HD pathogenicity and as candidate biomarkers.
Key findings
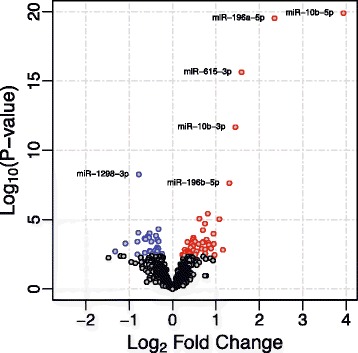
- 938 miRNAs were reliably quantified; 75 were differentially expressed in HD versus control brain (FDR q < 0.05), with 46 up-regulated and 29 down-regulated. miR-10b-5p showed a 3.9 log2 fold increase in HD.
- Nine miRNAs were significantly associated with Vonsattel grade; three of these—miR-10b-5p, miR-10b-3p, and miR-302a-3p—related to Hadzi-Vonsattel striatal score after CAG adjustment (FDR q = 2.28e-2). Five miRNAs related to CAG-adjusted age of onset: miR-10b-5p (q = 3.49e-3), miR-196a-5p (q = 1.32e-2), miR-196b-5p (q = 1.71e-2), miR-10b-3p (q = 1.71e-2), and miR-106a-5p (q = 1.71e-2).
- miR-10b-5p’s relationship to striatal involvement remained significant after correcting for cortical involvement (p = 0.04; miR-10b-3p p = 0.01; miR-302a-3p p = 0.005). For predicting HD versus controls, miR-10b-5p AUC was 99.47% (95% CI 98.46%–100%).
- Gene ontology enrichment of predicted targets of clinically associated miRNAs showed shared processes including “nervous system development” (up p = 8.5e-5, down p = 9.9e-7) and transcriptional regulation.
Methods
- Next-generation small RNA sequencing was performed on prefrontal cortex (Brodmann Area 9) from 26 symptomatic HD, 2 asymptomatic HD gene-positive, and 36 control brains; neuropathological data included age at onset, CAG-repeat size, Vonsattel grade, and Hadzi-Vonsattel striatal and cortical scores.
- Differential expression used DESeq2 variance-stabilizing transformation, ComBat batch correction, and LIMMA with age at death adjustment; FDR correction was applied across 938 miRNA comparisons. Clinical-feature associations used CAG-adjusted residuals and linear regression, with FDR correction across 75 differentially expressed miRNAs.
- Predicted mRNA targets were identified with TargetScan and tested for GO enrichment using topGO and REVIGO; a subset of samples was orthogonally validated with a Firefly multiplexed miRNA assay.
Limitations
- Stated: the cell type responsible for miRNA changes cannot be determined because tissue homogenate was used, so signals are likely both neuronal and non-neuronal. The authors also state it remains unknown which altered miRNAs are compensatory/neuroprotective versus pathological/neurotoxic, and whether changes are consequential or innocent by-products.
- Evident from the text: the asymptomatic grade 0 group was very small (n = 2), limiting pre-symptomatic conclusions; the study is cross-sectional postmortem tissue, so causal direction and progression dynamics cannot be established.
Model-written summary. Check it against the paper before relying on it.
Integrity signals
Registry
Cites
Statistics
Figures
Verification
Claims the paper makes
53 Own result · 22 Not checked yet · 17 Own interpretation · 14 No full text of the sources · 11 Own method · 4 Supported · 3 Partly supported · 2 No basis given · accuracy not yet measured
Every source the paper cites for this claim was checked and supports it.
In the paper
“All five miRNAs reported as differentially expressed in our previous study (miR-10b-5p, miR-196a-5p, miR-196b-5p, miR-615-3p and miR-1247-5p) were significantly differentially expressed in this study [13].”
§ miR-10b-5p expression in Huntington’s disease brain relates to age of onset and the extent of striatal involvement > Discussion
What the sources say
- Supportedcites [13] Hoss AG, Kartha VK, Dong X, Latourelle JC, Dumitriu A, Hadzi TC, et al. MicroRNAs located in the Hox gene clusters are implicated in huntington’s disease pathogenesis. PLoS Genet. 2014;10(2):e1004188. source
The cited paper’s Results section, “Five miRNAs are up-regulated in HD,” reports five significantly differentially expressed miRNAs, and the Results section on expression correlations identifies the same five named in the citing sentence. The citation supports their identification as findings of the previous study; the citing authors’ statement about significance in their own study is not a finding attributed to this source. (LLM, conf=0.93)
plainn = 36- Asserted: passes — The authors put it forward as true.
- Checkable: passes — It can be checked against evidence.
- Load-bearing: passes — The paper’s conclusions depend on it.
- Based: passes — The paper gives a reason why it holds.
- Supported
Every source the paper cites for this claim was checked and supports it.
In the paper
“miRNAs enriched in microglial cultures (miR-126-5p, miR-126-3p, miR-141, miR-142-3p, miR-142-5p, miR-150, miR-200c and miR-223) were all were up-regulated.”
§ miR-10b-5p expression in Huntington’s disease brain relates to age of onset and the extent of striatal involvement > Discussion
What the sources say
- Supportedcites [16] Jovicic A, Roshan R, Moisoi N, Pradervand S, Moser R, Pillai B, et al. Comprehensive expression analyses of neural cell-type-specific miRNAs identify new determinants of the specification and maintenance of neuronal phenotypes. J Neurosci. 2013;33(12):5127–37. source
Table 1 (Discussion; page not provided) lists miR-126, miR-126*, miR-141, miR-142-3p, miR-142-5p, miR-150, miR-200c and miR-223 as specifically enriched in microglia. The statement that they were up-regulated describes the citing authors’ own study, not a result attributed to this source. (LLM, conf=0.90)
plain- Asserted: passes — The authors put it forward as true.
- Checkable: passes — It can be checked against evidence.
- Load-bearing: passes — The paper’s conclusions depend on it.
- Based: passes — The paper gives a reason why it holds.
- Supported
Every source the paper cites for this claim was checked and supports it.
In the paper
“miR-10b-5p also targets brain-derived neurotrophic factor (BDNF) [39]”
§ miR-10b-5p expression in Huntington’s disease brain relates to age of onset and the extent of striatal involvement > Discussion
What the sources say
- Supportedcites [39] Varendi K, Kumar A, Harma MA, Andressoo JO: miR-1, miR-10b, miR-155, and miR-191 are novel regulators of BDNF. Cellular and molecular life sciences: CMLS 2014 source
The Results section reports that mutating the miR-10b site abolished its inhibitory effect, supporting direct targeting of the BDNF 3′UTR. The paper calls the microRNA miR-10b rather than miR-10b-5p. (LLM, conf=0.88)
plaindirect- Asserted: passes — The authors put it forward as true.
- Checkable: passes — It can be checked against evidence.
- Load-bearing: passes — The paper’s conclusions depend on it.
- Based: passes — The paper gives a reason why it holds.
- Supported
A result the paper reports from its own data — it cites no other source for it, so there is none to check. The quote shows it is in the paper.
In the paper
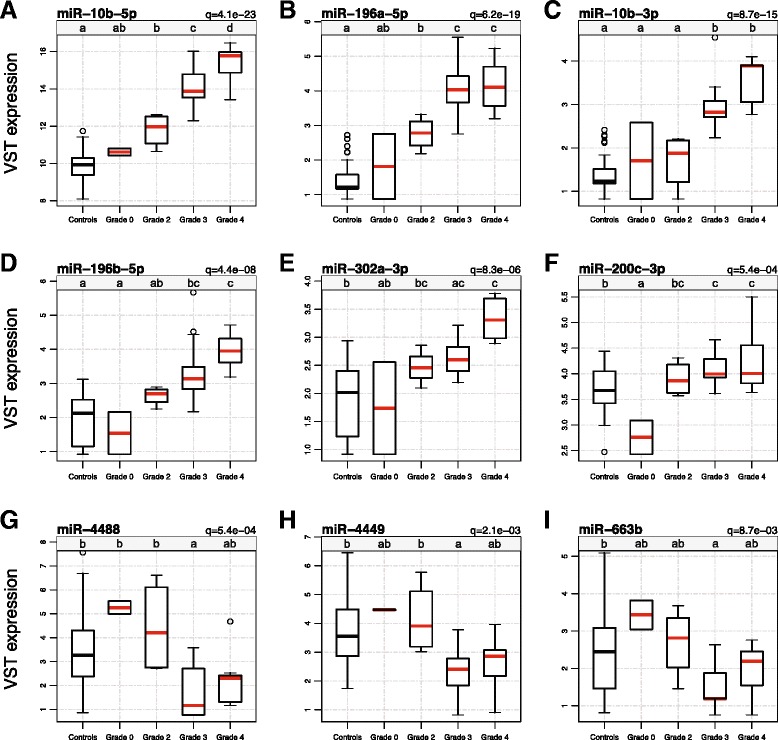
“Nine miRNAs were significant in both ANOVA tests after adjusting for multiple comparisons, indicating a significant difference in the expression of these miRNAs across Vonsattel grades (both FDR q-values < 0.05”
§ miR-10b-5p expression in Huntington’s disease brain relates to age of onset and the extent of striatal involvement > Results > Nine miRNAs relate to Vonsattel grade
hedgedcorrelational- Asserted: passes — The authors put it forward as true.
- Checkable: passes — It can be checked against evidence.
- Load-bearing: passes — The paper’s conclusions depend on it.
- Based: passes — The paper gives a reason why it holds.
A result the paper reports from its own data — it cites no other source for it, so there is none to check. The quote shows it is in the paper.
In the paper
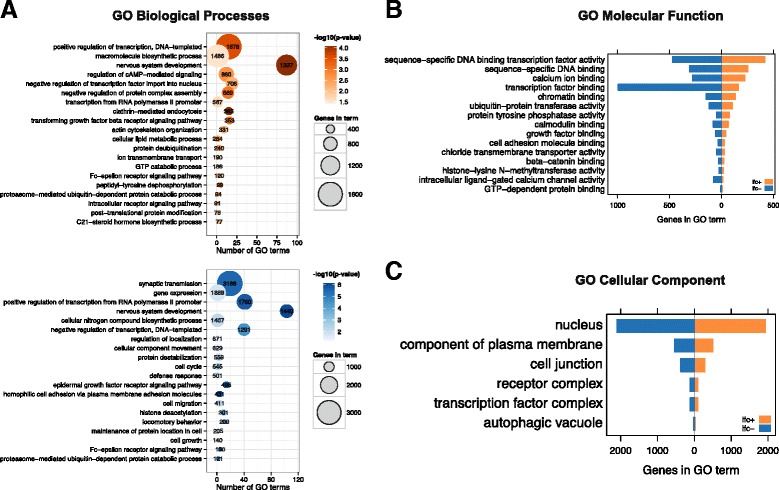
“260 GO Biological Processes, 78 GO Molecular Functions, 48 GO Cellular Component terms for mRNA targets of up-regulated miRNA were significant.”
§ miR-10b-5p expression in Huntington’s disease brain relates to age of onset and the extent of striatal involvement > Results > Targets of HD-related miRNAs are associated with nervous system development and transcriptional regulation
plaincorrelational- Asserted: passes — The authors put it forward as true.
- Checkable: passes — It can be checked against evidence.
- Load-bearing: passes — The paper’s conclusions depend on it.
- Based: passes — The paper gives a reason why it holds.
A result the paper reports from its own data — it cites no other source for it, so there is none to check. The quote shows it is in the paper.
In the paper
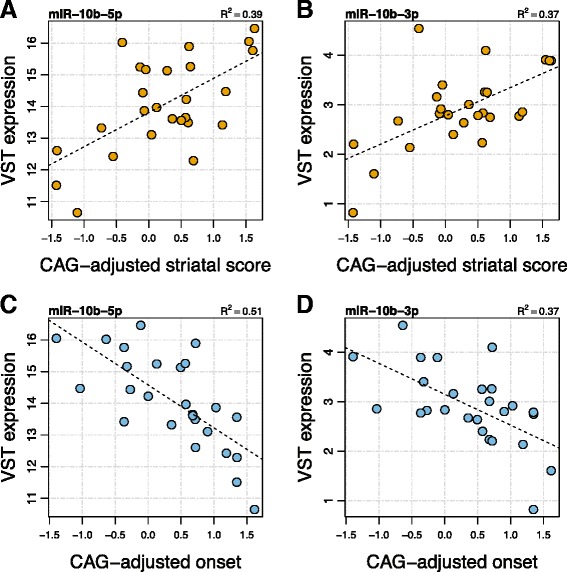
“five miRNAs were identified as having significant association to CAG-adjusted age of onset (miR-10b-5p, FDR q-value = 3.49e-3; miR-196a-5p, FDR q-value = 1.32e-2; miR-196b-5p, FDR q-value = 1.71e-2; miR-10b-3p, FDR q-value = 1.71e-2; miR-106a-5p, FDR q-value = 1.71e-2).”
§ miR-10b-5p expression in Huntington’s disease brain relates to age of onset and the extent of striatal involvement > Results > miRNA expression relates to striatal involvement and age of onset in HD
plaincorrelational- Asserted: passes — The authors put it forward as true.
- Checkable: passes — It can be checked against evidence.
- Load-bearing: passes — The paper’s conclusions depend on it.
- Based: passes — The paper gives a reason why it holds.
A result the paper reports from its own data — it cites no other source for it, so there is none to check. The quote shows it is in the paper.
In the paper
“75 of these were significantly differentially expressed in HD versus control brains after adjusting for multiple comparisons (FDR q-value < 0.05”
- Also stated in: § Results · plain
“We identified 75 miRNAs differentially expressed in HD brain (FDR q-value <0.05).”
§ miR-10b-5p expression in Huntington’s disease brain relates to age of onset and the extent of striatal involvement > Results > Differential expression analysis highlights disrupted miRNA expression in HD brain
plaincorrelational- Asserted: passes — The authors put it forward as true.
- Checkable: passes — It can be checked against evidence.
- Load-bearing: unclear — It is unclear whether the paper’s conclusions depend on it.
- Based: passes — The paper gives a reason why it holds.
- Also stated in: § Results · plain
A result the paper reports from its own data — it cites no other source for it, so there is none to check. The quote shows it is in the paper.
In the paper
“Seven out of sixteen miRNAs assayed approached but did not reach significance after adjustment in this subset (unadjusted p-value < 0.05, miR-10b-5p, miR-194-5p, miR-223-3p, miR-132-3p, miR-144-5p, miR-148a-3p, miR-486-5p).”
§ miR-10b-5p expression in Huntington’s disease brain relates to age of onset and the extent of striatal involvement > Results > Differential expression analysis highlights disrupted miRNA expression in HD brain
plainn = 15- Asserted: passes — The authors put it forward as true.
- Checkable: passes — It can be checked against evidence.
- Load-bearing: unclear — It is unclear whether the paper’s conclusions depend on it.
- Based: passes — The paper gives a reason why it holds.
A result the paper reports from its own data — it cites no other source for it, so there is none to check. The quote shows it is in the paper.
In the paper
“miR-10b-5p was 3.9 log2 fold increased”
§ miR-10b-5p expression in Huntington’s disease brain relates to age of onset and the extent of striatal involvement > Results > Differential expression analysis highlights disrupted miRNA expression in HD brain
plain- Asserted: passes — The authors put it forward as true.
- Checkable: passes — It can be checked against evidence.
- Load-bearing: passes — The paper’s conclusions depend on it.
- Based: passes — The paper gives a reason why it holds.
A result the paper reports from its own data — it cites no other source for it, so there is none to check. The quote shows it is in the paper.
In the paper
“When comparing HD to controls to predict HD, the AUC was 99.47% (95% confidence level was 98.46%-100%).”
§ miR-10b-5p expression in Huntington’s disease brain relates to age of onset and the extent of striatal involvement > Results > Nine miRNAs relate to Vonsattel grade
plaincorrelational- Asserted: passes — The authors put it forward as true.
- Checkable: passes — It can be checked against evidence.
- Load-bearing: passes — The paper’s conclusions depend on it.
- Based: passes — The paper gives a reason why it holds.
- It may state two separate claims as one. 38
- Probably not a substantial claim. 38
- The quote only partly states this claim. 1
Every source the paper cites for this claim was checked and supports it.
In the paper
“support the presence and robust up-regulation of Hox-related miRNAs in HD brain [13].”
§ miR-10b-5p expression in Huntington’s disease brain relates to age of onset and the extent of striatal involvement > Discussion
What the sources say
- Supportedcites [13] Hoss AG, Kartha VK, Dong X, Latourelle JC, Dumitriu A, Hadzi TC, et al. MicroRNAs located in the Hox gene clusters are implicated in huntington’s disease pathogenesis. PLoS Genet. 2014;10(2):e1004188. source
The Results section (“Five miRNAs are up-regulated in HD”) reports significant up-regulation in HD prefrontal cortex, including a 28.41-fold increase for miR-10b-5p. The Discussion section (“miR-10b-5p, miR-196a-5p, miR-196b-5p and miR-615-3p implicate Hox cluster genes”) identifies four of the five up-regulated miRNAs as Hox-cluster-related. The claim is supported for the HD brain tissue studied. (LLM, conf=0.94)
boostedn = 27- Asserted: passes — The authors put it forward as true.
- Checkable: passes — It can be checked against evidence.
- Load-bearing: passes — The paper’s conclusions depend on it.
- Based: passes — The paper gives a reason why it holds.
It may state two separate claims as one.
- Supported
The cited sources support only part of this claim — read each source’s verdict below.
In the paper
“While onset age is unequivocally related to the size of the expanded CAG repeat, with longer repeats leading to earlier onset, only 50% to 70% of the variation can be attributed to repeat size [3,4].”
§ miR-10b-5p expression in Huntington’s disease brain relates to age of onset and the extent of striatal involvement > Background
What the sources say
- Partly supportedcites [3] Li JL, Hayden MR, Almqvist EW, Brinkman RR, Durr A, Dode C, et al. A genome scan for modifiers of age at onset in Huntington disease: the HD MAPS study. Am J Hum Genet. 2003;73(3):682–7. sourceExperimental — accuracy not yet measured
The Abstract says expanded CAG repeat size partly explains variation in HD age at onset, and the paper adjusts onset age for repeat size in its analysis. The passages do not specify that longer repeats lead to earlier onset, so that direction of the relationship is not verified by our copy. (LLM, conf=0.78)
- Not checked — no full text of the sourcecites [4] Djousse L, Knowlton B, Hayden M, Almqvist EW, Brinkman R, Ross C, et al. Interaction of normal and expanded CAG repeat sizes influences age at onset of Huntington disease. Am J Med Genet A. 2003;119A(3):279–82. source
boosteddirect- Asserted: passes — The authors put it forward as true.
- Checkable: passes — It can be checked against evidence.
- Load-bearing: fails — The paper’s conclusions may not depend on it.
- Based: passes — The paper gives a reason why it holds.
Probably not a substantial claim. The paper’s conclusions may not depend on it.
- Partly supported
The cited sources support only part of this claim — read each source’s verdict below.
In the paper
“In HD, the dysregulation of miRNAs has been reported in HD in vitro models, transgenic HD animals and human HD brain [12-24].”
§ miR-10b-5p expression in Huntington’s disease brain relates to age of onset and the extent of striatal involvement > Background
What the sources say
- Not checked — no full text of the sourcecites [12] Gaughwin PM, Ciesla M, Lahiri N, Tabrizi SJ, Brundin P, Bjorkqvist M. Hsa-miR-34b is a plasma-stable microRNA that is elevated in pre-manifest Huntington’s disease. Hum Mol Genet. 2011;20(11):2225–37. source
- Supportedcites [13] Hoss AG, Kartha VK, Dong X, Latourelle JC, Dumitriu A, Hadzi TC, et al. MicroRNAs located in the Hox gene clusters are implicated in huntington’s disease pathogenesis. PLoS Genet. 2014;10(2):e1004188. source
The Introduction reports altered miRNA expression in cellular and mouse models of HD. The Results section reports five significantly up-regulated miRNAs in human HD prefrontal cortex compared with controls. Page numbers were not provided in the copy. (LLM, conf=0.93)
- Partly supportedcites [14] Jin J, Cheng Y, Zhang Y, Wood W, Peng Q, Hutchison E, et al. Interrogation of brain miRNA and mRNA expression profiles reveals a molecular regulatory network that is perturbed by mutant huntingtin. J Neurochem. 2012;123(4):477–90. sourceExperimental — accuracy not yet measured
The Results report altered miRNA expression in transgenic HD mice, and the Discussion describes earlier miRNA findings in postmortem human HD brain. The paper also uses an HD cell model, but the passages found do not report dysregulated miRNA expression in that in vitro model; its miR-200a assay involves transfection. Page numbers were not available in our copy. (LLM, conf=0.84)
- Not checked — no full text of the sourcecites [15] Johnson R, Zuccato C, Belyaev ND, Guest DJ, Cattaneo E, Buckley NJ. A microRNA-based gene dysregulation pathway in Huntington’s disease. Neurobiol Dis. 2008;29(3):438–45. source
- Partly supportedcites [16] Jovicic A, Roshan R, Moisoi N, Pradervand S, Moser R, Pillai B, et al. Comprehensive expression analyses of neural cell-type-specific miRNAs identify new determinants of the specification and maintenance of neuronal phenotypes. J Neurosci. 2013;33(12):5127–37. sourceExperimental — accuracy not yet measured
The Introduction cites prior work on brain-enriched miRNAs in disease states, and the References list a study reporting that miR-9/miR-9* is downregulated in Huntington’s disease. Our copy does not specify dysregulation across HD in vitro models, transgenic animals, and human HD brain, so it supports only the broader HD-miRNA point. (LLM, conf=0.78)
- Supportedcites [17] Kocerha J, Xu Y, Prucha MS, Zhao D, Chan AW. microRNA-128a dysregulation in transgenic Huntington’s disease monkeys. Molecular Brain. 2014;7:46. source
The Background explicitly reports miRNA dysregulation in HD patients, transgenic HD mice, and in vitro experimental models. The paper also reports dysregulated miRNAs in transgenic HD monkey brains and human HD brain tissue. (LLM, conf=0.94)
- Not checked — no full text of the sourcecites [18] Lee ST, Chu K, Im WS, Yoon HJ, Im JY, Park JE, et al. Altered microRNA regulation in Huntington’s disease models. Exp Neurol. 2011;227(1):172–9. source
- Supportedcites [19] Marti E, Pantano L, Banez-Coronel M, Llorens F, Minones-Moyano E, Porta S, et al. A myriad of miRNA variants in control and Huntington’s disease brain regions detected by massively parallel sequencing. Nucleic Acids Res. 2010;38(20):7219–35. source
The Methods (Human brain samples) identify the samples as frontal cortex and striatum from HD patients and controls. The Results (miRNA transcriptome deregulation in HD samples) report significantly upregulated and downregulated miRNAs in those samples. This paper supports the human-brain part of the sentence’s grouped citations; the sentence does not specifically assign the in vitro or animal-model findings to this paper. (LLM, conf=0.91)
- Partly supportedcites [20] Packer AN, Xing Y, Harper SQ, Jones L, Davidson BL. The bifunctional microRNA miR-9/miR-9* regulates REST and CoREST and is downregulated in Huntington’s disease. J Neurosci. 2008;28(53):14341–6. sourceExperimental — accuracy not yet measured
The Results section, “miRNA expression changes with HD progression” (page unavailable), reports altered miRNA levels in human HD cortex, supporting the human-brain part of the sentence. The passages from this paper do not establish miRNA dysregulation in HD in vitro models or transgenic HD animals. (LLM, conf=0.86)
- Supportedcites [21] Sinha M, Ghose J, Bhattarcharyya NP. Micro RNA −214,-150,-146a and-125b target Huntingtin gene. RNA Biol. 2011;8(6):1005–21. source
The Introduction reports altered miRNA expression in a cell model of HD. The Abstract reports decreased miRNA expression in R6/2 HD mice and altered expression in postmortem brains of HD patients, covering all three settings in the claim. (LLM, conf=0.92)
plain- Asserted: passes — The authors put it forward as true.
- Checkable: passes — It can be checked against evidence.
- Load-bearing: passes — The paper’s conclusions depend on it.
- Based: passes — The paper gives a reason why it holds.
Probably not a substantial claim.
The cited sources support only part of this claim — read each source’s verdict below.
In the paper
“a growth factor required for the survival and differentiation of striatal neurons [40].”
§ miR-10b-5p expression in Huntington’s disease brain relates to age of onset and the extent of striatal involvement > Discussion
What the sources say
- Partly supportedcites [40] Li Y, Yui D, Luikart BW, McKay RM, Li Y, Rubenstein JL, et al. Conditional ablation of brain-derived neurotrophic factor-TrkB signaling impairs striatal neuron development. Proc Natl Acad Sci U S A. 2012;109(38):15491–6. sourceExperimental — accuracy not yet measured
The Discussion (page unavailable) says BDNF is important for striatal-neuron survival in vitro, and the paper reports impaired striatal development and maturation after BDNF depletion. It does not establish the unqualified claim that BDNF is required for striatal-neuron survival; its developmental findings support the differentiation part more broadly. (LLM, conf=0.86)
plaindirect- Asserted: passes — The authors put it forward as true.
- Checkable: passes — It can be checked against evidence.
- Load-bearing: passes — The paper’s conclusions depend on it.
- Based: passes — The paper gives a reason why it holds.
Probably not a substantial claim.
- Partly supported
A result the paper reports from its own data — it cites no other source for it, so there is none to check. The quote shows it is in the paper.
In the paper
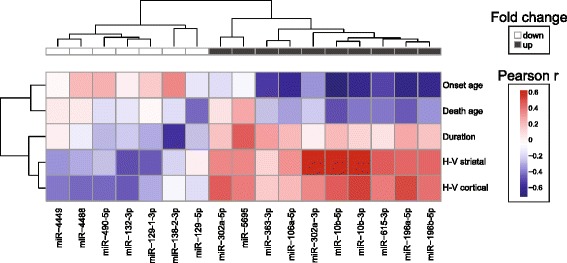
“Differentially expressed miRNAs increased in HD compared to controls tended to have negative correlations with onset and death, and positive correlations with striatal and cortical score.”
§ miR-10b-5p expression in Huntington’s disease brain relates to age of onset and the extent of striatal involvement > Results > miRNA expression relates to striatal involvement and age of onset in HD
hedgedcorrelational- Asserted: passes — The authors put it forward as true.
- Checkable: passes — It can be checked against evidence.
- Load-bearing: passes — The paper’s conclusions depend on it.
- Based: passes — The paper gives a reason why it holds.
It may state two separate claims as one.
A result the paper reports from its own data — it cites no other source for it, so there is none to check. The quote shows it is in the paper.
In the paper
“In HD, 46 miRNAs were identified as significantly up-regulated and 29 as down-regulated in their expression.”
§ miR-10b-5p expression in Huntington’s disease brain relates to age of onset and the extent of striatal involvement > Results > Differential expression analysis highlights disrupted miRNA expression in HD brain
plain- Asserted: passes — The authors put it forward as true.
- Checkable: passes — It can be checked against evidence.
- Load-bearing: unclear — It is unclear whether the paper’s conclusions depend on it.
- Based: passes — The paper gives a reason why it holds.
It may state two separate claims as one.
A result the paper reports from its own data — it cites no other source for it, so there is none to check. The quote shows it is in the paper.
In the paper
“In a next-generation sequence analysis of small non-coding RNAs in 26 HD and 36 control brains we detected 938 miRNAs and 75 of these were differentially expressed.”
§ miR-10b-5p expression in Huntington’s disease brain relates to age of onset and the extent of striatal involvement > Discussion
plainn = 36- Asserted: passes — The authors put it forward as true.
- Checkable: passes — It can be checked against evidence.
- Load-bearing: passes — The paper’s conclusions depend on it.
- Based: passes — The paper gives a reason why it holds.
It may state two separate claims as one.
A result the paper reports from its own data — it cites no other source for it, so there is none to check. The quote shows it is in the paper.
In the paper
“the expression of miRNAs in grade 3 and 4 brains appeared relatively similar to one another, with the exception of miR-10b-5p, as mentioned above, and miR-4488, where grade 3 brains were significantly lower than all other groups”
§ miR-10b-5p expression in Huntington’s disease brain relates to age of onset and the extent of striatal involvement > Results > Nine miRNAs relate to Vonsattel grade
hedgedcorrelational- Asserted: passes — The authors put it forward as true.
- Checkable: passes — It can be checked against evidence.
- Load-bearing: passes — The paper’s conclusions depend on it.
- Based: passes — The paper gives a reason why it holds.
It may state two separate claims as one.
A result the paper reports from its own data — it cites no other source for it, so there is none to check. The quote shows it is in the paper.
In the paper
“No significant relationship of the expression of the 75 differentially expressed miRNA to CAG-adjusted cortical score was observed, although nominal associations were seen.”
§ miR-10b-5p expression in Huntington’s disease brain relates to age of onset and the extent of striatal involvement > Results > miRNA expression relates to striatal involvement and age of onset in HD
plain- Asserted: passes — The authors put it forward as true.
- Checkable: passes — It can be checked against evidence.
- Load-bearing: passes — The paper’s conclusions depend on it.
- Based: passes — The paper gives a reason why it holds.
It may state two separate claims as one.
In the paper
“5712 unique mRNA targets for miRNAs with positive fold change in HD (miR-106a/302a-5p, miR-196a/miR-196b, miR-302a-3p, miR-363, miR-10b, miR-615-3p), and 6572 mRNA targets for negative fold change in HD (miR-129-3p, miR-129-5p, miR-132-3p, miR-4449, miR-4488, miR-490-5p) were found using Targetscan [33]”
§ miR-10b-5p expression in Huntington’s disease brain relates to age of onset and the extent of striatal involvement > Results > Targets of HD-related miRNAs are associated with nervous system development and transcriptional regulation
What the sources say
- Not checked — no full text of the sourcecites [33] Lewis BP, Burge CB, Bartel DP. Conserved seed pairing, often flanked by adenosines, indicates that thousands of human genes are microRNA targets. Cell. 2005;120(1):15–20. source
plain- Asserted: passes — The authors put it forward as true.
- Checkable: passes — It can be checked against evidence.
- Load-bearing: passes — The paper’s conclusions depend on it.
- Based: passes — The paper gives a reason why it holds.
It may state two separate claims as one.
A result the paper reports from its own data — it cites no other source for it, so there is none to check. The quote shows it is in the paper.
In the paper
“Eight of the remaining nine miRNAs that failed to achieve significance had the same direction of effect”
§ miR-10b-5p expression in Huntington’s disease brain relates to age of onset and the extent of striatal involvement > Results > Differential expression analysis highlights disrupted miRNA expression in HD brain
plainn = 15- Asserted: passes — The authors put it forward as true.
- Checkable: passes — It can be checked against evidence.
- Load-bearing: fails — The paper’s conclusions may not depend on it.
- Based: passes — The paper gives a reason why it holds.
Probably not a substantial claim. The paper’s conclusions may not depend on it.
A result the paper reports from its own data — it cites no other source for it, so there is none to check. The quote shows it is in the paper.
In the paper
“miR-10b-5p was confirmed as significant after correcting for multiple corrections (p-value = 3.0e-10, q-value = 6.6e-9).”
§ miR-10b-5p expression in Huntington’s disease brain relates to age of onset and the extent of striatal involvement > Results > Differential expression analysis highlights disrupted miRNA expression in HD brain
plainn = 15- Asserted: passes — The authors put it forward as true.
- Checkable: passes — It can be checked against evidence.
- Load-bearing: passes — The paper’s conclusions depend on it.
- Based: passes — The paper gives a reason why it holds.
The quote only partly states this claim.
A result the paper reports from its own data — it cites no other source for it, so there is none to check. The quote shows it is in the paper.
In the paper
“65 miRNA were found to be significant in the ANOVA (FDR-adjusted q-value < 0.05), indicating differential expression may be driven by the difference of controls to specific grades.”
§ miR-10b-5p expression in Huntington’s disease brain relates to age of onset and the extent of striatal involvement > Results > Nine miRNAs relate to Vonsattel grade
hedgedconditionaln = 28- Asserted: passes — The authors put it forward as true.
- Checkable: passes — It can be checked against evidence.
- Load-bearing: passes — The paper’s conclusions depend on it.
- Based: passes — The paper gives a reason why it holds.
It may state two separate claims as one.
A result the paper reports from its own data — it cites no other source for it, so there is none to check. The quote shows it is in the paper.
In the paper
“After CAG-adjusted cortical score correction, CAG-adjusted striatal score remained significant (miR-10b-5p p-value = 0.04, miR-10b-3p p-value = 0.01, miR-302a-3p p-value = 0.005).”
§ miR-10b-5p expression in Huntington’s disease brain relates to age of onset and the extent of striatal involvement > Results > miRNA expression relates to striatal involvement and age of onset in HD
plaincorrelationaln = 4- Asserted: passes — The authors put it forward as true.
- Checkable: passes — It can be checked against evidence.
- Load-bearing: passes — The paper’s conclusions depend on it.
- Based: passes — The paper gives a reason why it holds.
It may state two separate claims as one.
A result the paper reports from its own data — it cites no other source for it, so there is none to check. The quote shows it is in the paper.
In the paper
“Samples from symptomatic individuals had striatal scores ranging 1.43–3.82 and cortical scores ranging from 0.40–2.36”
§ miR-10b-5p expression in Huntington’s disease brain relates to age of onset and the extent of striatal involvement > Results > Differential expression analysis highlights disrupted miRNA expression in HD brain
plainn = 26- Asserted: passes — The authors put it forward as true.
- Checkable: passes — It can be checked against evidence.
- Load-bearing: unclear — It is unclear whether the paper’s conclusions depend on it.
- Based: passes — The paper gives a reason why it holds.
It may state two separate claims as one.
The paper states this without a source or data behind it here, so there is nothing to check it against. The quote shows it is in the paper.
In the paper
“Grade 0 brains were neuropathologically normal and asymptomatic at the time of death”
§ miR-10b-5p expression in Huntington’s disease brain relates to age of onset and the extent of striatal involvement > Results > Differential expression analysis highlights disrupted miRNA expression in HD brain
plain- Asserted: passes — The authors put it forward as true.
- Checkable: passes — It can be checked against evidence.
- Load-bearing: fails — The paper’s conclusions may not depend on it.
- Based: passes — The paper gives a reason why it holds.
Probably not a substantial claim. The paper’s conclusions may not depend on it. It may state two separate claims as one.
A result the paper reports from its own data — it cites no other source for it, so there is none to check. The quote shows it is in the paper.
In the paper
“the expression of miR-10b-5p was significant in nearly all comparisons; pairwise contrasts between all grades as well as with the control group were different except for grade 0, although grade 0 was different than grades 2, 3 and 4”
§ miR-10b-5p expression in Huntington’s disease brain relates to age of onset and the extent of striatal involvement > Results > Nine miRNAs relate to Vonsattel grade
plaincorrelational- Asserted: passes — The authors put it forward as true.
- Checkable: passes — It can be checked against evidence.
- Load-bearing: passes — The paper’s conclusions depend on it.
- Based: passes — The paper gives a reason why it holds.
It may state two separate claims as one.
A result the paper reports from its own data — it cites no other source for it, so there is none to check. The quote shows it is in the paper.
In the paper
“the expression of miRNAs in grade 0 brains was rarely different than controls, with the exception of miR-200c-3p, where its expression in grade 0 brains was significantly lower than both controls and grades 2–4 brains”
§ miR-10b-5p expression in Huntington’s disease brain relates to age of onset and the extent of striatal involvement > Results > Nine miRNAs relate to Vonsattel grade
plain- Asserted: passes — The authors put it forward as true.
- Checkable: passes — It can be checked against evidence.
- Load-bearing: unclear — It is unclear whether the paper’s conclusions depend on it.
- Based: passes — The paper gives a reason why it holds.
It may state two separate claims as one.
A result the paper reports from its own data — it cites no other source for it, so there is none to check. The quote shows it is in the paper.
In the paper
“Fourteen differentially expressed miRNAs were significantly differentially expressed in the replication set and thirteen of these fourteen were significant in the combined sequence analysis.”
§ miR-10b-5p expression in Huntington’s disease brain relates to age of onset and the extent of striatal involvement > Results > Differential expression analysis highlights disrupted miRNA expression in HD brain
plaincorrelationaln = 27- Asserted: passes — The authors put it forward as true.
- Checkable: passes — It can be checked against evidence.
- Load-bearing: unclear — It is unclear whether the paper’s conclusions depend on it.
- Based: passes — The paper gives a reason why it holds.
It may state two separate claims as one.
A result the paper reports from its own data — it cites no other source for it, so there is none to check. The quote shows it is in the paper.
In the paper
“In HD and controls, most 5′-3′ miRNA pairs were positively correlated in their expression, with the exception of miR-1298 in HD and miR-10b and miR-302a in controls”
§ miR-10b-5p expression in Huntington’s disease brain relates to age of onset and the extent of striatal involvement > Results > Differential expression analysis highlights disrupted miRNA expression in HD brain
plaincorrelational- Asserted: passes — The authors put it forward as true.
- Checkable: passes — It can be checked against evidence.
- Load-bearing: unclear — It is unclear whether the paper’s conclusions depend on it.
- Based: passes — The paper gives a reason why it holds.
It may state two separate claims as one.
None of the sources cited for this claim have been checked yet.
In the paper
“were significantly up-regulated in their expression [21,38].”
§ miR-10b-5p expression in Huntington’s disease brain relates to age of onset and the extent of striatal involvement > Discussion
plain- Asserted: passes — The authors put it forward as true.
- Checkable: passes — It can be checked against evidence.
- Load-bearing: fails — The paper’s conclusions may not depend on it.
- Based: passes — The paper gives a reason why it holds.
Probably not a substantial claim. The paper’s conclusions may not depend on it. It may state two separate claims as one.
A result the paper reports from its own data — it cites no other source for it, so there is none to check. The quote shows it is in the paper.
In the paper
“Many of these miRNA changes appear present ordinal trends with an increase (miR-10b-5p, miR-10b-3p, miR-302a, miR-196a-5p, miR-196b-5p) or decrease (miR-663b, miR-4488, miR-4449) in their expression across grade.”
§ miR-10b-5p expression in Huntington’s disease brain relates to age of onset and the extent of striatal involvement > Discussion
hedgedcorrelational- Asserted: passes — The authors put it forward as true.
- Checkable: passes — It can be checked against evidence.
- Load-bearing: passes — The paper’s conclusions depend on it.
- Based: passes — The paper gives a reason why it holds.
It may state two separate claims as one.
A result the paper reports from its own data — it cites no other source for it, so there is none to check. The quote shows it is in the paper.
In the paper
“Generally, these miRNAs had strong, positive associations to striatal and cortical H-V scores, weak positive association with disease duration and strong negative associations to onset and death age.”
§ miR-10b-5p expression in Huntington’s disease brain relates to age of onset and the extent of striatal involvement > Discussion
plaincorrelational- Asserted: passes — The authors put it forward as true.
- Checkable: passes — It can be checked against evidence.
- Load-bearing: passes — The paper’s conclusions depend on it.
- Based: passes — The paper gives a reason why it holds.
It may state two separate claims as one.
A result the paper reports from its own data — it cites no other source for it, so there is none to check. The quote shows it is in the paper.
In the paper
“Three miRNAs (miR-10b-3p/5p, miR-302a) related to H-V striatal score, independent of the CAG repeat expansion size and for miR-10b-5p, independent of cortical involvement.”
§ miR-10b-5p expression in Huntington’s disease brain relates to age of onset and the extent of striatal involvement > Discussion
plaincorrelational- Asserted: passes — The authors put it forward as true.
- Checkable: passes — It can be checked against evidence.
- Load-bearing: passes — The paper’s conclusions depend on it.
- Based: passes — The paper gives a reason why it holds.
It may state two separate claims as one.
A result the paper reports from its own data — it cites no other source for it, so there is none to check. The quote shows it is in the paper.
In the paper
“Down-regulated miRNAs clustered together as well but were less defined in their relationships to clinical features.”
§ miR-10b-5p expression in Huntington’s disease brain relates to age of onset and the extent of striatal involvement > Discussion
plaincorrelational- Asserted: passes — The authors put it forward as true.
- Checkable: passes — It can be checked against evidence.
- Load-bearing: unclear — It is unclear whether the paper’s conclusions depend on it.
- Based: passes — The paper gives a reason why it holds.
It may state two separate claims as one.
What the paper did — it cites no source for this, so there is none to check. The quote shows it is in the paper.
In the paper
“The increased sample size enables the detection of significantly altered miRNAs with lower levels of differential expression as well as more comprehensive characterization of the relationship of these miRNAs to relevant clinical features of the disease”
§ miR-10b-5p expression in Huntington’s disease brain relates to age of onset and the extent of striatal involvement > Background
plaindirectn = 36- Asserted: passes — The authors put it forward as true.
- Checkable: passes — It can be checked against evidence.
- Load-bearing: passes — The paper’s conclusions depend on it.
- Based: passes — The paper gives a reason why it holds.
It may state two separate claims as one.
A claim is checked only against the cited paper’s full text, never its abstract, and none is available for its sources.
In the paper
“In the central nervous system (CNS), miRNAs are abundant, as brain-specific miRNAs assist in various neuronal processes such as synaptic development, maturation and plasticity [8,9].”
§ miR-10b-5p expression in Huntington’s disease brain relates to age of onset and the extent of striatal involvement > Background
What the sources say
- Not checked — no full text of the sourcecites [8] Schratt GM, Tuebing F, Nigh EA, Kane CG, Sabatini ME, Kiebler M, et al. A brain-specific microRNA regulates dendritic spine development. Nature. 2006;439(7074):283–9. source
- Not checked — no full text of the sourcecites [9] Cao X, Yeo G, Muotri AR, Kuwabara T, Gage FH. Noncoding RNAs in the mammalian central nervous system. Annu Rev Neurosci. 2006;29:77–103. source
plaindirect- Asserted: passes — The authors put it forward as true.
- Checkable: passes — It can be checked against evidence.
- Load-bearing: fails — The paper’s conclusions may not depend on it.
- Based: passes — The paper gives a reason why it holds.
Probably not a substantial claim. The paper’s conclusions may not depend on it. It may state two separate claims as one.
None of the sources cited for this claim have been checked yet.
In the paper
“The remaining variation is highly heritable (h2 = 0.56), suggesting a strong role for genes that modify disease progression [3].”
§ miR-10b-5p expression in Huntington’s disease brain relates to age of onset and the extent of striatal involvement > Background
What the sources say
- Not checked yetcites [3] Li JL, Hayden MR, Almqvist EW, Brinkman RR, Durr A, Dode C, et al. A genome scan for modifiers of age at onset in Huntington disease: the HD MAPS study. Am J Hum Genet. 2003;73(3):682–7. source
Checked before — its earlier verdict is held back until a new check runs.
hedgedcorrelational- Asserted: passes — The authors put it forward as true.
- Checkable: passes — It can be checked against evidence.
- Load-bearing: passes — The paper’s conclusions depend on it.
- Based: passes — The paper gives a reason why it holds.
It may state two separate claims as one.
- Not checked yet
None of the sources cited for this claim have been checked yet.
In the paper
“varying from age 4 years to age 80 [2].”
§ miR-10b-5p expression in Huntington’s disease brain relates to age of onset and the extent of striatal involvement > Background
What the sources say
- Not checked yetcites [2] Myers RH. Huntington’s disease genetics. NeuroRx. 2004;1(2):255–62. source
Checked before — its earlier verdict is held back until a new check runs.
plain- Asserted: passes — The authors put it forward as true.
- Checkable: passes — It can be checked against evidence.
- Load-bearing: fails — The paper’s conclusions may not depend on it.
- Based: passes — The paper gives a reason why it holds.
Probably not a substantial claim. The paper’s conclusions may not depend on it.
- Not checked yet
In the paper
“miRNAs influence a diverse range of cellular processes [7]”
§ miR-10b-5p expression in Huntington’s disease brain relates to age of onset and the extent of striatal involvement > Background
What the sources say
- Not checked — no full text of the sourcecites [7] Alvarez-Garcia I, Miska EA. MicroRNA functions in animal development and human disease. Development. 2005;132(21):4653–62. source
plain- Asserted: passes — The authors put it forward as true.
- Checkable: passes — It can be checked against evidence.
- Load-bearing: fails — The paper’s conclusions may not depend on it.
- Based: passes — The paper gives a reason why it holds.
Probably not a substantial claim. The paper’s conclusions may not depend on it.
In the paper
“H-V scores are a continuous metric and therefore more amenable to adjustment of covariates such as CAG repeat size in modeling of neuropathological involvement and independently assesses striatal and cortical involvement.”
§ miR-10b-5p expression in Huntington’s disease brain relates to age of onset and the extent of striatal involvement > Results > Differential expression analysis highlights disrupted miRNA expression in HD brain
What the sources say
- Not checked yetcites [28] Hadzi TC, Hendricks AE, Latourelle JC, Lunetta KL, Cupples LA, Gillis T, et al. Assessment of cortical and striatal involvement in 523 Huntington disease brains. Neurology. 2012;79(16):1708–15. source
plainn = 523- Asserted: passes — The authors put it forward as true.
- Checkable: passes — It can be checked against evidence.
- Load-bearing: passes — The paper’s conclusions depend on it.
- Based: passes — The paper gives a reason why it holds.
It may state two separate claims as one.
None of the sources cited for this claim have been checked yet.
In the paper
“Altered miRNA expression has been observed in diseases of the CNS, particularly in age-dependent neurodegenerative diseases, which suggests that the expression of miRNAs may contribute to neuropathogenesis [10,11].”
§ miR-10b-5p expression in Huntington’s disease brain relates to age of onset and the extent of striatal involvement > Background
What the sources say
- Not checked yetcites [10] Gascon E, Gao FB. Cause or effect: misregulation of microRNA pathways in neurodegeneration. Front Neurosci. 2012;6:48. source
Checked before — its earlier verdict is held back until a new check runs.
- Not checked yetcites [11] Junn E, Mouradian MM. MicroRNAs in neurodegenerative diseases and their therapeutic potential. Pharmacol Ther. 2012;133(2):142–50. source
Checked before — its earlier verdict is held back until a new check runs.
hedgedconditional- Asserted: passes — The authors put it forward as true.
- Checkable: passes — It can be checked against evidence.
- Load-bearing: fails — The paper’s conclusions may not depend on it.
- Based: passes — The paper gives a reason why it holds.
Probably not a substantial claim. The paper’s conclusions may not depend on it. It may state two separate claims as one.
- Not checked yet
None of the sources cited for this claim have been checked yet.
In the paper
“MicroRNAs (miRNAs) are small non-coding RNAs that negatively regulate the expression of genes in a sequence-specific manner, binding to the 3′-untranslated region (3′UTR) to initiate cleavage or translational repression of target transcripts [5,6].”
§ miR-10b-5p expression in Huntington’s disease brain relates to age of onset and the extent of striatal involvement > Background
What the sources say
plaindirect- Asserted: passes — The authors put it forward as true.
- Checkable: passes — It can be checked against evidence.
- Load-bearing: fails — The paper’s conclusions may not depend on it.
- Based: passes — The paper gives a reason why it holds.
Probably not a substantial claim. The paper’s conclusions may not depend on it.
None of the sources cited for this claim have been checked yet.
In the paper
“To avoid confounding the analysis of these clinical features by the known, strong relationship between HTT CAG repeat size and disease pathology and onset [4,28,31,32], CAG-adjusted residuals were calculated for all continuous clinical traits”
§ miR-10b-5p expression in Huntington’s disease brain relates to age of onset and the extent of striatal involvement > Results > miRNA expression relates to striatal involvement and age of onset in HD
What the sources say
- Not checked — no full text of the sourcecites [4] Djousse L, Knowlton B, Hayden M, Almqvist EW, Brinkman R, Ross C, et al. Interaction of normal and expanded CAG repeat sizes influences age at onset of Huntington disease. Am J Med Genet A. 2003;119A(3):279–82. source
- Not checked yetcites [28] Hadzi TC, Hendricks AE, Latourelle JC, Lunetta KL, Cupples LA, Gillis T, et al. Assessment of cortical and striatal involvement in 523 Huntington disease brains. Neurology. 2012;79(16):1708–15. source
Checked before — its earlier verdict is held back until a new check runs.
- Not checked yetcites [31] Langbehn DR, Hayden MR, Paulsen JS. CAG-repeat length and the age of onset in Huntington disease (HD): a review and validation study of statistical approaches. Am J Med Genet B Neuropsychiatr Genet. 2010;153B(2):397–408. source
Checked before — its earlier verdict is held back until a new check runs.
- Not checked — no full text of the sourcecites [32] Myers RH, Vonsattel JP, Stevens TJ, Cupples LA, Richardson EP, Martin JB, et al. Clinical and neuropathologic assessment of severity in Huntington’s disease. Neurology. 1988;38(3):341–7. source
boosted- Asserted: passes — The authors put it forward as true.
- Checkable: passes — It can be checked against evidence.
- Load-bearing: passes — The paper’s conclusions depend on it.
- Based: passes — The paper gives a reason why it holds.
Probably not a substantial claim.
None of the sources cited for this claim have been checked yet.
In the paper
“miR-132 is highly enriched in the brain [34,35]”
§ miR-10b-5p expression in Huntington’s disease brain relates to age of onset and the extent of striatal involvement > Discussion
What the sources say
- Not checked yetcites [34] Lagos-Quintana M, Rauhut R, Yalcin A, Meyer J, Lendeckel W, Tuschl T. Identification of tissue-specific microRNAs from mouse. Current Biol CB. 2002;12(9):735–9. source
- Not checked yetcites [35] Miska EA, Alvarez-Saavedra E, Townsend M, Yoshii A, Sestan N, Rakic P, et al. Microarray analysis of microRNA expression in the developing mammalian brain. Genome Biol. 2004;5(9):R68. source
plain- Asserted: passes — The authors put it forward as true.
- Checkable: passes — It can be checked against evidence.
- Load-bearing: fails — The paper’s conclusions may not depend on it.
- Based: passes — The paper gives a reason why it holds.
Probably not a substantial claim. The paper’s conclusions may not depend on it.
What the paper did — it cites no source for this, so there is none to check. The quote shows it is in the paper.
In the paper
“Firefly Bioworks microRNA assay, a multiplexed, particle-based technology using flow cytometry to measure miRNA levels, was used to quantify and orthogonally validate miRNA differential expression from sequencing”
§ miR-10b-5p expression in Huntington’s disease brain relates to age of onset and the extent of striatal involvement > Results > Differential expression analysis highlights disrupted miRNA expression in HD brain
plainn = 15- Asserted: passes — The authors put it forward as true.
- Checkable: passes — It can be checked against evidence.
- Load-bearing: passes — The paper’s conclusions depend on it.
- Based: passes — The paper gives a reason why it holds.
Probably not a substantial claim. It may state two separate claims as one.
In the paper
“Huntington’s disease (HD) is an inherited disorder caused by a CAG trinucleotide repeat expansion in HTT which leads to progressive motor and cognitive impairment due to the gradual loss of neurons within striatal and cortical brain regions [1].”
§ miR-10b-5p expression in Huntington’s disease brain relates to age of onset and the extent of striatal involvement > Background
What the sources say
- Not checked yetcites [1] HDCRG. A novel gene containing a trinucleotide repeat that is expanded and unstable on Huntington’s disease chromosomes. Cell. 1993;72(6):971–83. source
plaindirect- Asserted: passes — The authors put it forward as true.
- Checkable: passes — It can be checked against evidence.
- Load-bearing: fails — The paper’s conclusions may not depend on it.
- Based: passes — The paper gives a reason why it holds.
Probably not a substantial claim. The paper’s conclusions may not depend on it. It may state two separate claims as one.
None of the sources cited for this claim have been checked yet.
In the paper
“We believe these miRNA signals are not attributed to a change in BA9 architecture, influenced by neuronal cell death or reactive glial response, because cell numbers between HD and controls from the same brain samples were indistinguishable [13,30].”
§ miR-10b-5p expression in Huntington’s disease brain relates to age of onset and the extent of striatal involvement > Discussion
What the sources say
- Not checked yetcites [13] Hoss AG, Kartha VK, Dong X, Latourelle JC, Dumitriu A, Hadzi TC, et al. MicroRNAs located in the Hox gene clusters are implicated in huntington’s disease pathogenesis. PLoS Genet. 2014;10(2):e1004188. source
Checked before — its earlier verdict is held back until a new check runs.
- Not checked yetcites [30] Bai G, Cheung I, Shulha HP, Coelho JE, Li P, Dong X, et al. Epigenetic dysregulation of hairy and enhancer of split 4 (HES4) is associated with striatal degeneration in postmortem Huntington brains. Hum Mol Genet. 2015;24(5):1441–56. source
Checked before — its earlier verdict is held back until a new check runs.
hedged- Asserted: passes — The authors put it forward as true.
- Checkable: passes — It can be checked against evidence.
- Load-bearing: passes — The paper’s conclusions depend on it.
- Based: passes — The paper gives a reason why it holds.
It may state two separate claims as one.
- Not checked yet
A claim is checked only against the cited paper’s full text, never its abstract, and none is available for its sources.
In the paper
“Concordant with our findings, miR-132-3p down-regulation in human HD parietal cortical tissue [15] and in brains of R6/2 and YAC128 HD mouse models has been observed [15,18].”
§ miR-10b-5p expression in Huntington’s disease brain relates to age of onset and the extent of striatal involvement > Discussion
What the sources say
- Not checked — no full text of the sourcecites [15] Johnson R, Zuccato C, Belyaev ND, Guest DJ, Cattaneo E, Buckley NJ. A microRNA-based gene dysregulation pathway in Huntington’s disease. Neurobiol Dis. 2008;29(3):438–45. source
- Not checked — no full text of the sourcecites [18] Lee ST, Chu K, Im WS, Yoon HJ, Im JY, Park JE, et al. Altered microRNA regulation in Huntington’s disease models. Exp Neurol. 2011;227(1):172–9. source
plain- Asserted: passes — The authors put it forward as true.
- Checkable: passes — It can be checked against evidence.
- Load-bearing: fails — The paper’s conclusions may not depend on it.
- Based: passes — The paper gives a reason why it holds.
Probably not a substantial claim. The paper’s conclusions may not depend on it. It may state two separate claims as one.
In the paper
“which may consequently lead to death of striatal neurons [42].”
§ miR-10b-5p expression in Huntington’s disease brain relates to age of onset and the extent of striatal involvement > Discussion
What the sources say
- Not checked — no full text of the sourcecites [42] Zuccato C, Ciammola A, Rigamonti D, Leavitt BR, Goffredo D, Conti L, et al. Loss of huntingtin-mediated BDNF gene transcription in Huntington’s disease. Science. 2001;293(5529):493–8. source
hedgedconditional- Asserted: passes — The authors put it forward as true.
- Checkable: passes — It can be checked against evidence.
- Load-bearing: fails — The paper’s conclusions may not depend on it.
- Based: passes — The paper gives a reason why it holds.
Probably not a substantial claim. The paper’s conclusions may not depend on it.
A conclusion the paper draws from its own results — it cites no other source for it, so there is none to check. The quote shows it is in the paper.
In the paper
“over-expression of miR-10b-5p might be harmful to neuronal cells.”
§ miR-10b-5p expression in Huntington’s disease brain relates to age of onset and the extent of striatal involvement > Discussion
hedgedconditional- Asserted: passes — The authors put it forward as true.
- Checkable: passes — It can be checked against evidence.
- Load-bearing: fails — The paper’s conclusions may not depend on it.
- Based: passes — The paper gives a reason why it holds.
Probably not a substantial claim. The paper’s conclusions may not depend on it.
In the paper
“its over-expression in vitro and in animal transgenic models suppressed mutant HTT expression [24].”
§ miR-10b-5p expression in Huntington’s disease brain relates to age of onset and the extent of striatal involvement > Discussion
What the sources say
- Not checked — no full text of the sourcecites [24] Cheng PH, Li CL, Chang YF, Tsai SJ, Lai YY, Chan AW, et al. miR-196a ameliorates phenotypes of Huntington disease in cell, transgenic mouse, and induced pluripotent stem cell models. Am J Hum Genet. 2013;93(2):306–12. source
plaindirect- Asserted: passes — The authors put it forward as true.
- Checkable: passes — It can be checked against evidence.
- Load-bearing: fails — The paper’s conclusions may not depend on it.
- Based: passes — The paper gives a reason why it holds.
Probably not a substantial claim. The paper’s conclusions may not depend on it.
None of the sources cited for this claim have been checked yet.
In the paper
“Another target of miR-132 is acetylcholinesterase (ACHE), which encodes an enzyme responsible for the breakdown of the neurotransmitter acetylcholine at the neural synapse [37].”
§ miR-10b-5p expression in Huntington’s disease brain relates to age of onset and the extent of striatal involvement > Discussion
What the sources say
- Not checked yetcites [37] McGleenon BM, Dynan KB, Passmore AP. Acetylcholinesterase inhibitors in Alzheimer’s disease. Br J Clin Pharmacol. 1999;48(4):471–80. source
Checked before — its earlier verdict is held back until a new check runs.
plaindirect- Asserted: passes — The authors put it forward as true.
- Checkable: passes — It can be checked against evidence.
- Load-bearing: fails — The paper’s conclusions may not depend on it.
- Based: passes — The paper gives a reason why it holds.
Probably not a substantial claim. The paper’s conclusions may not depend on it. It may state two separate claims as one.
- Not checked yet
None of the sources cited for this claim have been checked yet.
In the paper
“miRNAs that target the HTT 3′UTR and reduce HTT transcript levels in vitro, miR-148a-5p, miR-150-5p and miR-214-5p”
§ miR-10b-5p expression in Huntington’s disease brain relates to age of onset and the extent of striatal involvement > Discussion
What the sources say
- Not checked yetcites [21] Sinha M, Ghose J, Bhattarcharyya NP. Micro RNA −214,-150,-146a and-125b target Huntingtin gene. RNA Biol. 2011;8(6):1005–21. source
Checked before — its earlier verdict is held back until a new check runs.
- Not checked yetcites [38] Kozlowska E, Krzyzosiak WJ, Koscianska E. Regulation of huntingtin gene expression by miRNA-137, −214, −148a, and their respective isomiRs. Int J Mol Sci. 2013;14(8):16999–7016. source
Checked before — its earlier verdict is held back until a new check runs.
plaindirect- Asserted: passes — The authors put it forward as true.
- Checkable: passes — It can be checked against evidence.
- Load-bearing: unclear — It is unclear whether the paper’s conclusions depend on it.
- Based: passes — The paper gives a reason why it holds.
It may state two separate claims as one.
- Not checked yet
A conclusion the paper draws from its own results — it cites no other source for it, so there is none to check. The quote shows it is in the paper.
In the paper
“Our findings identify many miRNA alterations in HD brain and a large number of these are related to clinical manifestations of the disease, where the signal is independent of the size of the CAG repeat expansion.”
§ miR-10b-5p expression in Huntington’s disease brain relates to age of onset and the extent of striatal involvement > Conclusions
plaincorrelational- Asserted: passes — The authors put it forward as true.
- Checkable: passes — It can be checked against evidence.
- Load-bearing: passes — The paper’s conclusions depend on it.
- Based: passes — The paper gives a reason why it holds.
It may state two separate claims as one.
None of the sources cited for this claim have been checked yet.
In the paper
“acetylcholinesterase inhibitors are FDA-approved for the treatment of cognitive impairments in Alzheimer’s disease [37].”
§ miR-10b-5p expression in Huntington’s disease brain relates to age of onset and the extent of striatal involvement > Discussion
What the sources say
- Not checked yetcites [37] McGleenon BM, Dynan KB, Passmore AP. Acetylcholinesterase inhibitors in Alzheimer’s disease. Br J Clin Pharmacol. 1999;48(4):471–80. source
Checked before — its earlier verdict is held back until a new check runs.
plain- Asserted: passes — The authors put it forward as true.
- Checkable: passes — It can be checked against evidence.
- Load-bearing: fails — The paper’s conclusions may not depend on it.
- Based: passes — The paper gives a reason why it holds.
Probably not a substantial claim. The paper’s conclusions may not depend on it.
- Not checked yet
What the paper did — it cites no source for this, so there is none to check. The quote shows it is in the paper.
In the paper
“HD samples and controls were not different in postmortem interval (PMI) (p-value = 0.69), RNA integrity number (p-value = 0.08) or gender (p-value = 0.51) but differed in ages at death (HD mean age =59.5, control mean age =68.6; p-value = 0.01) (see Table 1).”
§ miR-10b-5p expression in Huntington’s disease brain relates to age of onset and the extent of striatal involvement > Methods > Sample information
plainn = 2- Asserted: passes — The authors put it forward as true.
- Checkable: passes — It can be checked against evidence.
- Load-bearing: passes — The paper’s conclusions depend on it.
- Based: passes — The paper gives a reason why it holds.
It may state two separate claims as one.
A conclusion the paper draws from its own results — it cites no other source for it, so there is none to check. The quote shows it is in the paper.
In the paper
“These patterns suggest that decreasing up-regulated miRNAs and increasing down-regulated miRNA may be beneficial.”
§ miR-10b-5p expression in Huntington’s disease brain relates to age of onset and the extent of striatal involvement > Discussion
hedgedconditional- Asserted: passes — The authors put it forward as true.
- Checkable: fails — It may be too vague to check against evidence.
- Load-bearing: passes — The paper’s conclusions depend on it.
- Based: passes — The paper gives a reason why it holds.
Probably not a substantial claim. It may be too vague to check against evidence. It may state two separate claims as one.
What the paper did — it cites no source for this, so there is none to check. The quote shows it is in the paper.
In the paper
“Asymptomatic HD samples did not differ in age at death (mean age =67.5) in comparison to HD or control samples (control p-value = 0.92; HD p-value = 0.40).”
§ miR-10b-5p expression in Huntington’s disease brain relates to age of onset and the extent of striatal involvement > Methods > Sample information
plainn = 2- Asserted: passes — The authors put it forward as true.
- Checkable: passes — It can be checked against evidence.
- Load-bearing: fails — The paper’s conclusions may not depend on it.
- Based: passes — The paper gives a reason why it holds.
Probably not a substantial claim. The paper’s conclusions may not depend on it.
A conclusion the paper draws from its own results — it cites no other source for it, so there is none to check. The quote shows it is in the paper.
In the paper
“Differentially expressed miRNAs may also target HTT transcripts as a response to mutant HTT to reduce HTT transcriptional levels and limit toxicity.”
§ miR-10b-5p expression in Huntington’s disease brain relates to age of onset and the extent of striatal involvement > Discussion
hedgedconditional- Asserted: passes — The authors put it forward as true.
- Checkable: passes — It can be checked against evidence.
- Load-bearing: fails — The paper’s conclusions may not depend on it.
- Based: passes — The paper gives a reason why it holds.
Probably not a substantial claim. The paper’s conclusions may not depend on it.
None of the sources cited for this claim have been checked yet.
In the paper
“Acetylcholinesterase is critically involved in cognition”
§ miR-10b-5p expression in Huntington’s disease brain relates to age of onset and the extent of striatal involvement > Discussion
What the sources say
- Not checked yetcites [37] McGleenon BM, Dynan KB, Passmore AP. Acetylcholinesterase inhibitors in Alzheimer’s disease. Br J Clin Pharmacol. 1999;48(4):471–80. source
Checked before — its earlier verdict is held back until a new check runs.
plaindirect- Asserted: passes — The authors put it forward as true.
- Checkable: passes — It can be checked against evidence.
- Load-bearing: fails — The paper’s conclusions may not depend on it.
- Based: passes — The paper gives a reason why it holds.
Probably not a substantial claim. The paper’s conclusions may not depend on it.
- Not checked yet
What the paper did — it cites no source for this, so there is none to check. The quote shows it is in the paper.
In the paper
“Covariates (PMI, RIN, age at death) were not included in linear models, as neither PMI nor RIN were determined to have an effect on the outcome of the results.”
§ miR-10b-5p expression in Huntington’s disease brain relates to age of onset and the extent of striatal involvement > Methods > HD feature analysis
plain- Asserted: passes — The authors put it forward as true.
- Checkable: passes — It can be checked against evidence.
- Load-bearing: passes — The paper’s conclusions depend on it.
- Based: passes — The paper gives a reason why it holds.
Probably not a substantial claim.
None of the sources cited for this claim have been checked yet.
In the paper
“miR-10b-5p has been observed to facilitate neurodifferentiation [43].”
§ miR-10b-5p expression in Huntington’s disease brain relates to age of onset and the extent of striatal involvement > Discussion
What the sources say
- Not checked yetcites [43] Meseguer S, Mudduluru G, Escamilla JM, Allgayer H, Barettino D. MicroRNAs-10a and -10b contribute to retinoic acid-induced differentiation of neuroblastoma cells and target the alternative splicing regulatory factor SFRS1 (SF2/ASF). J Biol Chem. 2011;286(21118818):4150–64. source
Checked before — its earlier verdict is held back until a new check runs.
plaindirect- Asserted: passes — The authors put it forward as true.
- Checkable: passes — It can be checked against evidence.
- Load-bearing: fails — The paper’s conclusions may not depend on it.
- Based: passes — The paper gives a reason why it holds.
Probably not a substantial claim. The paper’s conclusions may not depend on it.
- Not checked yet
A conclusion the paper draws from its own results — it cites no other source for it, so there is none to check. The quote shows it is in the paper.
In the paper
“Thus, decreased miR-132 levels may negatively impact brain health, through the dysregulation of p250GAP (limiting its suppression) and ACHE (indirectly decreasing acetylcholine levels).”
§ miR-10b-5p expression in Huntington’s disease brain relates to age of onset and the extent of striatal involvement > Discussion
hedgedconditional- Asserted: passes — The authors put it forward as true.
- Checkable: passes — It can be checked against evidence.
- Load-bearing: fails — The paper’s conclusions may not depend on it.
- Based: passes — The paper gives a reason why it holds.
Probably not a substantial claim. The paper’s conclusions may not depend on it.
What the paper did — it cites no source for this, so there is none to check. The quote shows it is in the paper.
In the paper
“For the cluster analysis in Figure 4, Pearson correlations for miRNA expression to clinical feature were performed and those miRNAs with p-values < 0.05, without adjustment for multiple comparisons, were reported.”
§ miR-10b-5p expression in Huntington’s disease brain relates to age of onset and the extent of striatal involvement > Methods > HD feature analysis
plaincorrelational- Asserted: passes — The authors put it forward as true.
- Checkable: passes — It can be checked against evidence.
- Load-bearing: fails — The paper’s conclusions may not depend on it.
- Based: passes — The paper gives a reason why it holds.
Probably not a substantial claim. The paper’s conclusions may not depend on it. It may state two separate claims as one.
What the paper did — it cites no source for this, so there is none to check. The quote shows it is in the paper.
In the paper
“Age at death could not be included in the analysis due to the relationship of age at death and HD clinical pathology.”
§ miR-10b-5p expression in Huntington’s disease brain relates to age of onset and the extent of striatal involvement > Methods > HD feature analysis
plain- Asserted: passes — The authors put it forward as true.
- Checkable: passes — It can be checked against evidence.
- Load-bearing: passes — The paper’s conclusions depend on it.
- Based: passes — The paper gives a reason why it holds.
Probably not a substantial claim.
In the paper
“normal huntingtin protein is reported to up-regulate BDNF levels”
§ miR-10b-5p expression in Huntington’s disease brain relates to age of onset and the extent of striatal involvement > Discussion
What the sources say
- Not checked — no full text of the sourcecites [42] Zuccato C, Ciammola A, Rigamonti D, Leavitt BR, Goffredo D, Conti L, et al. Loss of huntingtin-mediated BDNF gene transcription in Huntington’s disease. Science. 2001;293(5529):493–8. source
hedgeddirect- Asserted: passes — The authors put it forward as true.
- Checkable: passes — It can be checked against evidence.
- Load-bearing: fails — The paper’s conclusions may not depend on it.
- Based: passes — The paper gives a reason why it holds.
Probably not a substantial claim. The paper’s conclusions may not depend on it.
A conclusion the paper draws from its own results — it cites no other source for it, so there is none to check. The quote shows it is in the paper.
In the paper
“Disruption to any of these systems may affect neuron health.”
§ miR-10b-5p expression in Huntington’s disease brain relates to age of onset and the extent of striatal involvement > Discussion
hedgedconditional- Asserted: passes — The authors put it forward as true.
- Checkable: fails — It may be too vague to check against evidence.
- Load-bearing: fails — The paper’s conclusions may not depend on it.
- Based: passes — The paper gives a reason why it holds.
Probably not a substantial claim. It may be too vague to check against evidence. The paper’s conclusions may not depend on it.
In the paper
“its expression has been shown to affect neuron morphogenesis and enhance neurite outgrowth by suppressing the GTPase-activating protein p250GAP (p250GAP/RICS) [36].”
§ miR-10b-5p expression in Huntington’s disease brain relates to age of onset and the extent of striatal involvement > Discussion
What the sources say
- Not checked yetcites [36] Vo N, Klein ME, Varlamova O, Keller DM, Yamamoto T, Goodman RH, et al. A cAMP-response element binding protein-induced microRNA regulates neuronal morphogenesis. Proc Natl Acad Sci U S A. 2005;102(45):16426–31. source
plaindirect- Asserted: passes — The authors put it forward as true.
- Checkable: passes — It can be checked against evidence.
- Load-bearing: fails — The paper’s conclusions may not depend on it.
- Based: passes — The paper gives a reason why it holds.
Probably not a substantial claim. The paper’s conclusions may not depend on it. It may state two separate claims as one.
A conclusion the paper draws from its own results — it cites no other source for it, so there is none to check. The quote shows it is in the paper.
In the paper
“we believe this is an issue of statistical power.”
§ miR-10b-5p expression in Huntington’s disease brain relates to age of onset and the extent of striatal involvement > Discussion
hedged- Asserted: passes — The authors put it forward as true.
- Checkable: passes — It can be checked against evidence.
- Load-bearing: fails — The paper’s conclusions may not depend on it.
- Based: fails — The paper may give no reason why it holds.
Probably not a substantial claim. The paper’s conclusions may not depend on it. The paper may give no reason why it holds.
In the paper
“mutant huntingtin impairs BDNF protein abundance”
§ miR-10b-5p expression in Huntington’s disease brain relates to age of onset and the extent of striatal involvement > Discussion
What the sources say
- Not checked — no full text of the sourcecites [42] Zuccato C, Ciammola A, Rigamonti D, Leavitt BR, Goffredo D, Conti L, et al. Loss of huntingtin-mediated BDNF gene transcription in Huntington’s disease. Science. 2001;293(5529):493–8. source
plaindirect- Asserted: passes — The authors put it forward as true.
- Checkable: passes — It can be checked against evidence.
- Load-bearing: fails — The paper’s conclusions may not depend on it.
- Based: passes — The paper gives a reason why it holds.
Probably not a substantial claim. The paper’s conclusions may not depend on it.
What the paper did — it cites no source for this, so there is none to check. The quote shows it is in the paper.
In the paper
“This study was reviewed by the Boston University School of Medicine Institutional Review Board (Protocol H-28974), and was approved as exempt because the study involves only tissue collected post-mortem, and consequently not classified as human subjects.”
§ miR-10b-5p expression in Huntington’s disease brain relates to age of onset and the extent of striatal involvement > Methods > Ethics review
plain- Asserted: passes — The authors put it forward as true.
- Checkable: passes — It can be checked against evidence.
- Load-bearing: fails — The paper’s conclusions may not depend on it.
- Based: passes — The paper gives a reason why it holds.
Probably not a substantial claim. The paper’s conclusions may not depend on it. It may state two separate claims as one.
In the paper
“Although miR-196a does not directly target HTT [33]”
§ miR-10b-5p expression in Huntington’s disease brain relates to age of onset and the extent of striatal involvement > Discussion
What the sources say
- Not checked — no full text of the sourcecites [33] Lewis BP, Burge CB, Bartel DP. Conserved seed pairing, often flanked by adenosines, indicates that thousands of human genes are microRNA targets. Cell. 2005;120(1):15–20. source
plain- Asserted: passes — The authors put it forward as true.
- Checkable: passes — It can be checked against evidence.
- Load-bearing: fails — The paper’s conclusions may not depend on it.
- Based: passes — The paper gives a reason why it holds.
Probably not a substantial claim. The paper’s conclusions may not depend on it.
In the paper
“increased miR-196a expression was observed in a primate model of HD”
§ miR-10b-5p expression in Huntington’s disease brain relates to age of onset and the extent of striatal involvement > Discussion
What the sources say
- Not checked — no full text of the sourcecites [24] Cheng PH, Li CL, Chang YF, Tsai SJ, Lai YY, Chan AW, et al. miR-196a ameliorates phenotypes of Huntington disease in cell, transgenic mouse, and induced pluripotent stem cell models. Am J Hum Genet. 2013;93(2):306–12. source
plain- Asserted: passes — The authors put it forward as true.
- Checkable: passes — It can be checked against evidence.
- Load-bearing: fails — The paper’s conclusions may not depend on it.
- Based: passes — The paper gives a reason why it holds.
Probably not a substantial claim. The paper’s conclusions may not depend on it.
A conclusion the paper draws from its own results — it cites no other source for it, so there is none to check. The quote shows it is in the paper.
In the paper
“Up- and down-regulated miRNAs may target genes in similar biological systems, and these genes are involved in transcriptional regulation, neuronal development and other important aspects surrounding neuron function.”
§ miR-10b-5p expression in Huntington’s disease brain relates to age of onset and the extent of striatal involvement > Conclusions
hedgedconditional- Asserted: passes — The authors put it forward as true.
- Checkable: passes — It can be checked against evidence.
- Load-bearing: unclear — It is unclear whether the paper’s conclusions depend on it.
- Based: passes — The paper gives a reason why it holds.
It may state two separate claims as one.
Self-check
Percentages, sums and reported differences re-computed from the paper’s own numbers.
Each contradiction between two passages listed here was confirmed by an independent check.
Rated minor: it would not touch a result — a value no result rests on, a p-value that stays on the same side of the significance level, or a conflict that is clerical, resolved elsewhere in the paper, or outside its own findings.
In the paper
§ miR-10b-5p expression in Huntington’s disease brain relates to age of onset and the extent of striatal involvement > Results > Differential expression analysis highlights disrupted miRNA expression in HD brain
“miR-10b-5p was confirmed as significant after correcting for multiple corrections (p-value = 3.0e-10, q-value = 6.6e-9).”
§ miR-10b-5p expression in Huntington’s disease brain relates to age of onset and the extent of striatal involvement > Results > Differential expression analysis highlights disrupted miRNA expression in HD brain
“Seven out of sixteen miRNAs assayed approached but did not reach significance after adjustment in this subset (unadjusted p-value < 0.05, miR-10b-5p, miR-194-5p, miR-223-3p, miR-132-3p, miR-144-5p, miR-148a-3p, miR-486-5p).”
Rated minor: it would not touch a result — a value no result rests on, a p-value that stays on the same side of the significance level, or a conflict that is clerical, resolved elsewhere in the paper, or outside its own findings.
In the paper
§ miR-10b-5p expression in Huntington’s disease brain relates to age of onset and the extent of striatal involvement > Results > Nine miRNAs relate to Vonsattel grade
“miR-200c-3p, where its expression in grade 0 brains was significantly lower than both controls and grades 2–4 brains (see Figure 2G).”
§ miR-10b-5p expression in Huntington’s disease brain relates to age of onset and the extent of striatal involvement > Results > Nine miRNAs relate to Vonsattel grade
“D. miR-196b-5p, E. miR-302a-3p, F. miR-200c-3p, G. miR-4488”
Rated minor: it would not touch a result — a value no result rests on, a p-value that stays on the same side of the significance level, or a conflict that is clerical, resolved elsewhere in the paper, or outside its own findings.
In the paper
§ miR-10b-5p expression in Huntington’s disease brain relates to age of onset and the extent of striatal involvement > Results > Differential expression analysis highlights disrupted miRNA expression in HD brain
“Combined study, N=64 logFC”
§ miR-10b-5p expression in Huntington’s disease brain relates to age of onset and the extent of striatal involvement > Methods > miRNA sequence analysis
“Using 36 controls and 26 HD grades 2–4, differential expression analysis was performed with LIMMA version 3.20.8 [54,55], adjusting for age at death in the model.”
Citations
Cites
Moderated estimation of fold change and dispersion for RNA-seq data with DESeq2
Love, M. I., Huber, W., & Anders, S. (2014) · Genome Biology · doi:10.1186/s13059-014-0550-8 · Cited by 95,106
Bartel (2004) · doi:10.1016/s0092-8674(04)00045-5 · Cited by 34,714
Cutadapt removes adapter sequences from high-throughput sequencing reads
Martin, M. (2011) · EMBnet.journal · doi:10.14806/ej.17.1.200 · Cited by 33,889
BEDTools: a flexible suite of utilities for comparing genomic features
Quinlan, A. R., & Hall, I. M. (2010) · Bioinformatics · doi:10.1093/bioinformatics/btq033 · Cited by 27,437
Ultrafast and memory-efficient alignment of short DNA sequences to the human genome.
Langmead, B., Trapnell, C., Pop, M., & Salzberg, S. L. (2009) · Genome Biology · doi:10.1186/gb-2009-10-3-r25 · Cited by 21,849
MicroRNAs: Target Recognition and Regulatory Functions
Bartel, D. P. (2009) · Cell · doi:10.1016/j.cell.2009.01.002 · Cited by 20,068
Differential expression analysis for sequence count data
Anders, S., & Huber, W. (2010) · Genome Biology · doi:10.1186/gb-2010-11-10-r106 · Cited by 15,581
Simultaneous Inference in General Parametric Models
Hothorn, T., Bretz, F., & Westfall, P. H. (2008) · Biometrical Journal · doi:10.1002/bimj.200810425 · Cited by 14,265
Gene Expression Omnibus: NCBI gene expression and hybridization array data repository
Edgar, R. (2002) · Nucleic Acids Research · doi:10.1093/nar/30.1.207 · Cited by 13,288
Lewis, B. P., Burge, C. B., & Bartel, D. P. (2005) · Cell · doi:10.1016/j.cell.2004.12.035 · Cited by 11,855
Cited by
Sorted by citations
Functional roles and networks of non-coding RNAs in the pathogenesis of neurodegenerative diseases
Wu, Y.-Y., & Kuo, H.-C. (2020) · Journal of Biomedical Science · doi:10.1186/s12929-020-00636-z · Cited by 213
Microbiome profiling reveals gut dysbiosis in a transgenic mouse model of Huntington's disease
Kong, G., Cao, K.-A. L., Judd, L. M., Li, S., Renoir, T., & Hannan, A. J. (2020) · Neurobiology of Disease · doi:10.1016/j.nbd.2018.09.001 · Cited by 212
Loganathan, T., & Doss, C. G. P. (2023) · Functional & Integrative Genomics · doi:10.1007/s10142-022-00947-4 · Cited by 196
Ma, L., Zhang, X., Yu, K., Xu, X., Chen, T., Shi, Y. Y., Wang, Y., Qiu, S., Guo, S., Cui, J., et al. (2021) · Free Radical Biology and Medicine · doi:10.1016/j.freeradbiomed.2021.03.023 · Cited by 184
Noncoding RNAs in neurodegeneration
Salta, E., & De Strooper, B. (2017) · Nature Reviews Neuroscience · doi:10.1038/nrn.2017.90 · Cited by 183
Metadata
- Authors
- Hoss, A. G., Labadorf, A., Latourelle, J. C., Kartha, V. K., Hadzi, T. C., Gusella, J. F., MacDonald, M. E., Chen, J.-F., Akbarian, S., Weng, Z., Vonsattel, J. P., & Myers, R. H.
- Affiliations
- Boston University (US)
- Harvard University (US)
- Icahn School of Medicine at Mount Sinai (US)
- University of Massachusetts Chan Medical School (US)
- NewYork–Presbyterian Hospital (US)
- Corresponding author
- Myers, Richard H
- ORCID
- Venue
- BMC Medical Genomics
- Published
- 2015-03-01
- Volume
- 8
- Issue
- 1
- Pages
- 10-10
- ISSN
- 1755-8794 (ISSN-L)
- PMC
- PMC4349621
- OpenAlex
- W2102648007
- Semantic Scholar
- 0e54f8e987daaf026db58f607b6699cc300f019e
- Cited by
- 151
- References
- 59
- Citations by year
- 2026: 5 · 2025: 7 · 2024: 12 · 2023: 17 · 2022: 19 · 2021: 19 · 2020: 17 · 2019: 13 · 2018: 11 · 2017: 14 · 2016: 10 · 2015: 6
- FWCI
- 5.27
- Type
- journal article
- Language
- en
- Open access
- gold
- doi.org
- Locations
- BMC Medical Genomics (publishedVersion, cc-by)
- Europe PMC (PubMed Central) (publishedVersion, cc-by)
- PubMed Central (publishedVersion, cc-by)
- PubMed (publishedVersion)
- Digital Access to Scholarship at Harvard (DASH) (Harvard University) (submittedVersion, cc-by)
- The Journal of the American Medical Association (JAMA) Network (American Medical Association) (submittedVersion, cc-by)
- Funders
- McLean Hospital
- National Institutes of Health
- National Institute of Mental Health (P50MH096890)
- National Institute of Neurological Disorders and Stroke (R01NS073947, R21NS076958, R01NS032765, U24NS072026)
- Topics
- Life Sciences › Neuroscience › Cellular and Molecular Neuroscience › Genetic Neurodegenerative Diseases
- Life Sciences › Biochemistry, Genetics and Molecular Biology › Cancer Research › MicroRNA in disease regulation
- Health Sciences › Medicine › Clinical Neurology › Amyotrophic Lateral Sclerosis Research
- Keywords
- Huntington's disease, miR-10b-5p, microRNA expression, age of onset, prefrontal cortex, CAG repeat expansion, miR-196a-5p, miR-106a-5p, miRNA target genes, neurodegeneration, disease progression biomarkers, trinucleotide repeats
- MeSH terms
- Adult, Aged, Brain, Cerebral Cortex, Corpus Striatum, Female, Gene Expression Regulation, Humans, Huntington Disease, Male, Middle Aged, Linear Models, Age of Onset, Disease Progression, Gene Expression Profiling, MicroRNAs, High-Throughput Nucleotide Sequencing
About these checks
Registry, retraction, Cites and statistics results are computed, not judged, with one exception: a printed reference that no index lists is read once by a model before it counts as a citation error. Claims are extracted by a model and kept only when their quote appears verbatim in the text; each cited source is then checked, with a model’s help, for whether it says what the claim relies on. Those verdicts can be wrong — read the claim’s quote and the cited source before relying on one.
A language model drew the claims from the paper on 2026-11-10, under version 3 of the claim definition (model deepseek-v4.1-flash, prompt extract-v3).
A second model labelled each claim on 2026-11-10 (model jev-1.13-20260917, definition revision gold-guideline-v0.2).
Cited sources are checked with a language model’s help (gpt-6-sol).
Statistics and arithmetic are recomputed, not judged.
Confidence bands are shown only for fields calibrated on our annotated test set. None is calibrated yet, so no band is shown.
What counts as a claim ›How we measure confidence ›How we check this ›
Are you an author, or do you see a problem with this page? Request a review
