

The DOI matches its Crossref record; 105 of the 105 references it cites were found in a registry or an index.
Behavioral Modeling of Human Choices Reveals Dissociable Effects of Physical Effort and Temporal Delay on Reward Devaluation
Open accessAbstract
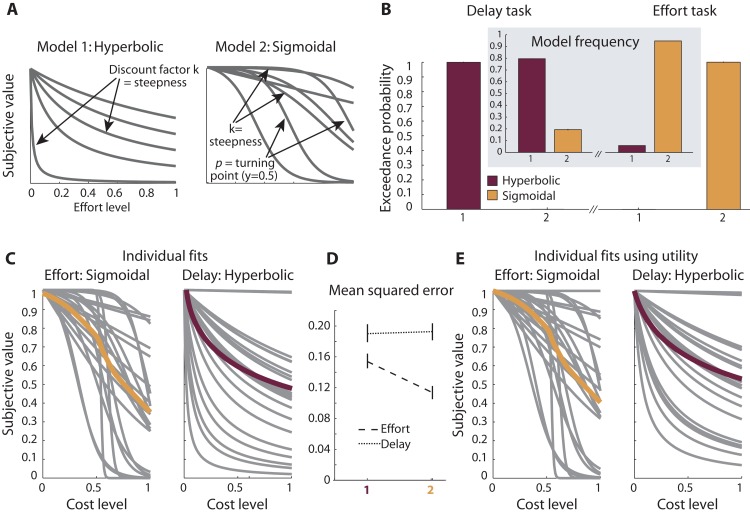
There has been considerable interest from the fields of biology, economics, psychology, and ecology about how decision costs decrease the value of rewarding outcomes. For example, formal descriptions of how reward value changes with increasing temporal delays allow for quantifying individual decision preferences, as in animal species populating different habitats, or normal and clinical human populations. Strikingly, it remains largely unclear how humans evaluate rewards when these are tied to energetic costs, despite the surge of interest in the neural basis of effort-guided decision-making and the prevalence of disorders showing a diminished willingness to exert effort (e.g., depression). One common assumption is that effort discounts reward in a similar way to delay. Here we challenge this assumption by formally comparing competing hypotheses about effort and delay discounting. We used a design specifically optimized to compare discounting behavior for both effort and delay over a wide range of decision costs (Experiment 1). We then additionally characterized the profile of effort discounting free of model assumptions (Experiment 2). Contrary to previous reports, in both experiments effort costs devalued reward in a manner opposite to delay, with small devaluations for lower efforts, and progressively larger devaluations for higher effort-levels (concave shape). Bayesian model comparison confirmed that delay-choices were best predicted by a hyperbolic model, with the largest reward devaluations occurring at shorter delays. In contrast, an altogether different relationship was observed for effort-choices, which were best described by a model of inverse sigmoidal shape that is initially concave. Our results provide a novel characterization of human effort discounting behavior and its first dissociation from delay discounting. This enables accurate modelling of cost-benefit decisions, a prerequisite for the investigation of the neural underpinnings of effort-guided choice and for understanding the deficits in clinical disorders characterized by behavioral inactivity.
Overview
The claims and statistics of this paper haven’t been checked yet.
Run the check — free, no account needed. It reads the open-access text and checks the sources it cites.
Integrity signals
Registry
Cites
Statistics
Figures
Verification
Claims the paper makes
The claims and statistics of this paper haven’t been checked yet.
Run the check — free, no account needed. It reads the open-access text and checks the sources it cites.
Claims other papers make about this one
Each is checked against this paper’s own text: does it say what the citing paper says it does?
In the citing paper
“Third, by controlling the temporal parameters of both the cognitive and physical effort tasks, it was possible to eliminate delay discounting as an explanation of choice behaviour [5, 47, 48].”
From Neurocomputational mechanisms underlying subjective valuation of effort costs (2017) · cites this paper as [5]
Self-check
Percentages, sums and reported differences re-computed from the paper’s own numbers.
The self-check needs the paper’s full text.
Citations
Cites
Prospect Theory: An Analysis of Decision under Risk
Kahneman, D., & Tversky, A. (1979) · Econometrica · doi:10.2307/1914185 · Cited by 48,524
Prospect theory: An analysis of decision under risk
Kahneman, D. J., & Tversky, A. (1988) · Cambridge University Press eBooks · doi:10.1017/cbo9780511609220.014 · Cited by 32,720
Gelman, A., Carlin, J. B., Stern, H. S., & Rubin, D. B. (2003) · doi:10.1201/9780429258480 · Cited by 27,276
Advances in prospect theory: Cumulative representation of uncertainty
Tversky, A., & Kahneman, D. (1992) · Journal of Risk and Uncertainty · doi:10.1007/bf00122574 · Cited by 15,467 · cited 1×
“Similarly, the probability with which reward is received is subjectively distorted such that small probabilities are over-weighted and large probabilities under-weighted [1,13].”
BackgroundInformation theory, inference, and learning algorithms
(2004) · Choice Reviews Online · doi:10.5860/choice.41-5949 · Cited by 6,536
Golden eggs and hyperbolic discounting
Laibson, D. (1997) · The Quarterly Journal of Economics · doi:10.1162/003355397555253 · Cited by 6,122
Time Discounting and Time Preference: A Critical Review
Frederick, S., Loewenstein, G., & O’Donoghue, T. (2002) · Journal of Economic Literature · doi:10.1257/002205102320161311 · Cited by 6,106
Time Discounting and Time Preference: A Critical Review
Frederick, S. W., Loewenstein, G. F., & O’Donoghue, T. (2002) · Journal of Economic Literature · doi:10.1257/jel.40.2.351 · Cited by 4,116
Stevens, S. S. (1957) · Psychological Review · doi:10.1037/h0046162 · Cited by 3,388 · cited 4×
“Our two main criteria to define a theoretically grounded model for effort discounting were (1) that it can take initially concave shapes because (a) intuition tells us that small efforts should have a relatively small or no impact on value, but large efforts should lead to steep discounting of rewards; (b) studies on…”
BackgroundResultInfluentialSubgenual prefrontal cortex abnormalities in mood disorders
Drevets, W. C., Price, J. L., Simpson, J. R., Todd, R. D., Reich, T., Vannier, M., & Raichle, M. E. (1997) · Nature · doi:10.1038/386824a0 · Cited by 2,693
Some empirical evidence on dynamic inconsistency
Thaler, R. H. (1981) · Economics Letters · doi:10.1016/0165-1765(81)90067-7 · Cited by 2,282
Learning the value of information in an uncertain world
Behrens, T. E. J., Woolrich, M. W., Walton, M. E., & Rushworth, M. F. S. (2007) · Nature Neuroscience · doi:10.1038/nn1954 · Cited by 2,053 · cited 1×
“, hyperbolic versus exponential model for delay discounting [59]; an improved volatility learning model over a standard reinforcement learning model; see [60]).”
BackgroundAn adjusting procedure for studying delayed reinforcement.
Commons, M. L., Mazur, J., Nevin, J. A., & Rachlin, H. C. (1987) · doi:10.4324/9781315825502-11 · Cited by 1,842
Impulsivity and cigarette smoking: delay discounting in current, never, and ex-smokers
Bickel, W. K., Odum, A. L., & Madden, G. J. (1999) · Psychopharmacology · doi:10.1007/pl00005490 · Cited by 1,433
Bayesian model selection for group studies
Stephan, K. E., Penny, W. D., Daunizeau, J., Moran, R. J., & Friston, K. J. (2009) · NeuroImage · doi:10.1016/j.neuroimage.2009.03.025 · Cited by 1,423 · cited 3×
“BMC at the group level, also known as random effects model [101,102], has become a standard statistical test in the fields of neuroimaging and behavioral modeling ([101] cited> 250 times).”
BackgroundMethodPEST: Efficient Estimates on Probability Functions
Taylor, M. M., & Creelman, C. D. (1967) · The Journal of the Acoustical Society of America · doi:10.1121/1.1910407 · Cited by 1,173 · cited 2×
“The reward magnitude associated with each force level was adjusted on a trial-by-trial basis using an adaptive staircase algorithm, independently for each effort level (Parameter Estimation by Sequential Testing, PEST, see [91]).”
MethodDiscounting of Delayed Rewards: A Life-Span Comparison
Green, L., Fry, A. F., & Myerson, J. (1994) · Psychological Science · doi:10.1111/j.1467-9280.1994.tb00610.x · Cited by 1,165
The neurobiology of anhedonia and other reward-related deficits
Der-Avakian, A., & Markou, A. (2012) · Trends in Neurosciences · doi:10.1016/j.tins.2011.11.005 · Cited by 1,130
Effort-related functions of nucleus accumbens dopamine and associated forebrain circuits
Salamone, J. D., Correa, M., Farrar, A., & Mingote, S. M. (2007) · Psychopharmacology · doi:10.1007/s00213-006-0668-9 · Cited by 1,000 · cited 1×
“, apathy, depression, fatigue, abulia), and may thus be critical in understanding the basis of several common psychiatric and neurological conditions [9,88].”
BackgroundDiscount rates inferred from decisions: an experimental study
Benzion, U., Israel, H., Rapoport, A., & Yagil, J. (1987) · Management Science · doi:10.1287/mnsc.35.3.270 · Cited by 967
Measures of impulsivity in cigarette smokers and non-smokers
Mitchell, S. H. (1999) · Psychopharmacology · doi:10.1007/pl00005491 · Cited by 911
Variational free energy and the Laplace approximation
Friston, K., Mattout, J., Trujillo-Barreto, N., Ashburner, J., & Penny, W. (2007) · NeuroImage · doi:10.1016/j.neuroimage.2006.08.035 · Cited by 880
Comparing dynamic causal models.
Penny, W. D., Stephan, K. E., Mechelli, A., & Friston, K. J. (2004) · NeuroImage · doi:10.1016/j.neuroimage.2004.03.026 · Cited by 848
Treadway, M. T., Buckholtz, J. W., Schwartzman, A. N., Lambert, W. E., & Zald, D. H. (2009) · PLoS ONE · doi:10.1371/journal.pone.0006598 · Cited by 769
Petry, N. M. (2001) · Psychopharmacology · doi:10.1007/s002130000638 · Cited by 761
Bidding on the future: Evidence against normative discounting of delayed rewards.
Kirby, K. N. (1997) · Journal of Experimental Psychology General · doi:10.1037/0096-3445.126.1.54 · Cited by 750 · cited 1×
“, hyperbolic versus exponential model for delay discounting [59]; an improved volatility learning model over a standard reinforcement learning model; see [60]).”
BackgroundTreadway, M. T., Bossaller, N. A., Shelton, R. C., & Zald, D. H. (2012) · Journal of Abnormal Psychology · doi:10.1037/a0028813 · Cited by 733
Comparing families of dynamic causal models
Penny, W. D., Stephan, K. E., Daunizeau, J., Rosa, M. J., Friston, K. J., Schofield, T. M., & Leff, A. P. (2010) · PLoS Computational Biology · doi:10.1371/journal.pcbi.1000709 · Cited by 688 · cited 3×
“BMC at the group level, also known as random effects model [101,102], has become a standard statistical test in the fields of neuroimaging and behavioral modeling ([101] cited> 250 times).”
BackgroundMethodSelf-citationContrasting Roles of Basolateral Amygdala and Orbitofrontal Cortex in Impulsive Choice
Winstanley, C. A., Theobald, D. E. H., Cardinal, R. N., & Robbins, T. W. (2004) · The Journal of Neuroscience · doi:10.1523/jneurosci.5606-03.2004 · Cited by 675
Impulsivity and rapid discounting of delayed hypothetical rewards in cocaine-dependent individuals.
Coffey, S., Gudleski, G., Saladin, M., & Brady, K. (2003) · Experimental and clinical psychopharmacology · doi:10.1037//1064-1297.11.1.18 · Cited by 655
The relation between the surface electromyogram and muscular force.
Milner‐Brown, H. S., & Stein, R. B. (1975) · The Journal of Physiology · doi:10.1113/jphysiol.1975.sp010904 · Cited by 644 · cited 1×
“For example the rate coding of muscle units changes little at low force levels, but increases more with increasing effort levels [66,67].”
BackgroundImpulsivity and rapid discounting of delayed hypothetical rewards in cocaine-dependent individuals.
Coffey, S. F., Gudleski, G. D., Saladin, M. E., & Brady, K. T. (2003) · Experimental and Clinical Psychopharmacology · doi:10.1037/1064-1297.11.1.18 · Cited by 625
Kukulka, C. G., & Clamann, H. P. (1981) · Brain Research · doi:10.1016/0006-8993(81)90266-3 · Cited by 583
Separate neural pathways process different decision costs
Rudebeck, P. H., Walton, M. E., Smyth, A. N., Bannerman, D. M., & Rushworth, M. F. S. (2006) · Nature Neuroscience · doi:10.1038/nn1756 · Cited by 580 · cited 2×
“Furthermore, lesions of ACC impair effort-guided choices, but leave intact those guided by delay, while lesions of OFC have the opposite effects, suggesting that (at least partially) distinct networks of brain regions support these two functions [46,78].”
BackgroundResultNeural computations associated with goal-directed choice
Rangel, A., & Hare, T. (2010) · Current Opinion in Neurobiology · doi:10.1016/j.conb.2010.03.001 · Cited by 532 · cited 1×
“Although effort and delays are commonly referred to as decision costs, one attractive proposal is that while effort is a decision cost that is ascribed to a particular action, delay is one of the parameters (like risk, uncertainty) that can be ascribed to—and discount—the value of an outcome ([43], but see [44,45] for…”
BackgroundAnterior Cingulate: Single Neuronal Signals Related to Degree of Reward Expectancy
Shidara, M., & Richmond, B. J. (2002) · Science · doi:10.1126/science.1069504 · Cited by 515 · cited 1×
“The ACC may be particularly crucial for guiding effort-based choices because neurons encode both the effort cost and reward payoff of an option as well as the selected action [25,82–84], and also the number of actions required to obtain reward [85].”
BackgroundWalton, M. E., Bannerman, D. M., Alterescu, K., & Rushworth, M. F. S. (2003) · Journal of Neuroscience · doi:10.1523/jneurosci.23-16-06475.2003 · Cited by 512 · cited 1×
“Furthermore, lesions of ACC impair effort-guided choices, but leave intact those guided by delay, while lesions of OFC have the opposite effects, suggesting that (at least partially) distinct networks of brain regions support these two functions [46,78].”
BackgroundSeparate Valuation Subsystems for Delay and Effort Decision Costs
Prévost, C., Pessiglione, M., Météreau, E., Cléry-Melin, M.-L., & Dreher, J.-C. (2010) · The Journal of Neuroscience · doi:10.1523/jneurosci.2752-10.2010 · Cited by 499 · cited 5×
“More generally, data from two tasks in which effort costs were unconfounded from delay costs provide robust evidence against the notion that effort discounting is best explained by a hyperbolic function as previously suggested [29,38,39].”
BackgroundMethodInfluentialDouble dissociation of value computations in orbitofrontal and anterior cingulate neurons
Kennerley, S. W., Behrens, T. E. J., & Wallis, J. D. (2011) · Nature Neuroscience · doi:10.1038/nn.2961 · Cited by 485
Age-related changes in the neural correlates of motor performance
Ward, N. (2003) · Brain · doi:10.1093/brain/awg071 · Cited by 480
Dopaminergic and Glutamatergic Regulation of Effort- and Delay-Based Decision Making
Floresco, S., Tse, M., & Ghods-Sharifi, S. (2007) · Neuropsychopharmacology · doi:10.1038/sj.npp.1301565 · Cited by 453
Neurons in the frontal lobe encode the value of multiple decision variables
Kennerley, S. W., Dahmubed, A. F., Lara, A. H., & Wallis, J. D. (2009) · Journal of Cognitive Neuroscience · doi:10.1162/jocn.2009.21100 · Cited by 453
Self-citationIndividual laboratory-measured discount rates predict field behavior
Chabris, C. F., Laibson, D., Morris, C. L., Schuldt, J. P., & Taubinsky, D. (2008) · Journal of Risk and Uncertainty · doi:10.1007/s11166-008-9053-x · Cited by 429
Anatomic and Behavioral Aspects of Frontal‐Subcortical Circuitsa
CUMMINGS, J. L. (1995) · Annals of the New York Academy of Sciences · doi:10.1111/j.1749-6632.1995.tb38127.x · Cited by 362
Decision-Making Dysfunctions in Psychiatry—Altered Homeostatic Processing?
Paulus, M. P. (2007) · Science · doi:10.1126/science.1142997 · Cited by 311
Cortico-limbic-striatal circuits subserving different forms of cost-benefit decision making
Floresco, S. B., Onge, J. R. S., Ghods-Sharifi, S., & Winstanley, C. A. (2008) · Cognitive, Affective, & Behavioral Neuroscience · doi:10.3758/cabn.8.4.375 · Cited by 305
Weighing up the benefits of work: Behavioral and neural analyses of effort-related decision making
Walton, M. E., Kennerley, S. W., Bannerman, D. M., Phillips, P. E. M., & Rushworth, M. F. S. (2006) · Neural Networks · doi:10.1016/j.neunet.2006.03.005 · Cited by 305
Prefrontal Cortex and Impulsive Decision Making
Kim, S., & Lee, D. (2010) · Biological Psychiatry · doi:10.1016/j.biopsych.2010.07.005 · Cited by 303
Comparing dynamic causal models using AIC, BIC and free energy
Penny, W. D. (2012) · NeuroImage · doi:10.1016/j.neuroimage.2011.07.039 · Cited by 298
Self-citationDenk, F., Walton, M. E., Jennings, K. A., Sharp, T., Rushworth, M. F. S., & Bannerman, D. M. (2004) · Psychopharmacology · doi:10.1007/s00213-004-2059-4 · Cited by 294
Exponential versus hyperbolic discounting of delayed outcomes: Risk and waiting time.
GREEN, L., & MYERSON, J. (1996) · American Zoologist · doi:10.1093/icb/36.4.496 · Cited by 294
The many faces of fatigue in major depressive disorder
Demyttenaere, K., De Fruyt, J., & Stahl, S. M. (2005) · The International Journal of Neuropsychopharmacology · doi:10.1017/s1461145704004729 · Cited by 288 · cited 1×
“The motivational disturbances experienced in some of these conditions can profoundly affect one’s personal and professional life, and cause limitations in terms of life function, interaction with the environment, and responsiveness to treatment [26,89,90].”
BackgroundEmotion and decision-making: affect-driven belief systems in anxiety and depression
Paulus, M. P., & Yu, A. J. (2012) · Trends in Cognitive Sciences · doi:10.1016/j.tics.2012.07.009 · Cited by 287
Neuroeconomic Foundations of Economic Choice—Recent Advances
Fehr, E., & Rangel, A. (2011) · The Journal of Economic Perspectives · doi:10.1257/jep.25.4.3 · Cited by 283
Madden, G. J., Bickel, W. K., & Jacobs, E. A. (1999) · Experimental and Clinical Psychopharmacology · doi:10.1037/1064-1297.7.3.284 · Cited by 280
Dopamine, behavioral economics, and effort
Salamone, J. D. (2009) · Frontiers in Behavioral Neuroscience · doi:10.3389/neuro.08.013.2009 · Cited by 277 · cited 1×
“The motivational disturbances experienced in some of these conditions can profoundly affect one’s personal and professional life, and cause limitations in terms of life function, interaction with the environment, and responsiveness to treatment [26,89,90].”
BackgroundEisenberg, D. T. A., MacKillop, J., Modi, M. E., Beauchemin, J., Dang, D., Lisman, S. A., Lum, J. K., & Wilson, D. S. (2007) · Behavioral and Brain Functions · doi:10.1186/1744-9081-3-2 · Cited by 264
DISCOUNTING OF DELAYED FOOD REWARDS IN PIGEONS AND RATS: IS THERE A MAGNITUDE EFFECT?
Green, L., Myerson, J., Holt, D. D., Slevin, J. R., & Estle, S. J. (2004) · Journal of the Experimental Analysis of Behavior · doi:10.1901/jeab.2004.81-39 · Cited by 257
Winstanley, C. A., Olausson, P., Taylor, J. R., & Jentsch, J. D. (2010) · Alcoholism Clinical and Experimental Research · doi:10.1111/j.1530-0277.2010.01215.x · Cited by 244
Calculating utility: preclinical evidence for cost–benefit analysis by mesolimbic dopamine
Phillips, P. E. M., Walton, M. E., & Jhou, T. C. (2007) · Psychopharmacology · doi:10.1007/s00213-006-0626-6 · Cited by 237 · cited 5×
“It is an intriguing hypothesis that the linear discounting of efforts suggested in the context of fixed-ratio schedules [37] may be caused by an interaction of simultaneously occurring discounting processes, namely the convex discounting of delays, and the concave discounting of force-related effort put forward here.”
BackgroundMethodInfluentialWill Travel for Food: Spatial Discounting in Two New World Monkeys
Stevens, J. R., Rosati, A. G., Ross, K. R., & HAUSER, M. D. (2005) · Current Biology · doi:10.1016/j.cub.2005.09.016 · Cited by 228 · cited 2×
“Second, the willingness to travel further or to wait for rewards differs between animal species [6], providing some indication that the willingness to exert effort or to wait for rewards may not correlate between species or individuals.”
BackgroundThe effect of temporal constraints on the value of money and other commodities
Raineri, A., & Rachlin, H. C. (1993) · Journal of Behavioral Decision Making · doi:10.1002/bdm.3960060202 · Cited by 226
Prefrontostriatal Circuitry Regulates Effort-Related Decision Making
Hauber, W., & Sommer, S. (2009) · Cerebral Cortex · doi:10.1093/cercor/bhn241 · Cited by 224
Dissociable effects of lesions to orbitofrontal cortex subregions on impulsive choice in the rat
Mar, A. C., Walker, A. L. J., Theobald, D. E., Eagle, D. M., & Robbins, T. W. (2011) · The Journal of Neuroscience · doi:10.1523/jneurosci.6620-10.2011 · Cited by 206
CONTEXTUAL CONTROL OF DELAY DISCOUNTING BY PATHOLOGICAL GAMBLERS
Dixon, M. R., Jacobs, E. A., & Sanders, S. (2006) · Journal of Applied Behavior Analysis · doi:10.1901/jaba.2006.173-05 · Cited by 201
Variational Bayesian inference for fMRI time series
Penny, W. D., Kiebel, S. J., & Friston, K. J. (2003) · NeuroImage · doi:10.1016/s1053-8119(03)00071-5 · Cited by 200
Hartmann, M. N., Hager, O. M., Reimann, A. V., Chumbley, J. R., Kirschner, M., Seifritz, E., Tobler, P. N., & Kaiser, S. (2015) · Schizophrenia Bulletin · doi:10.1093/schbul/sbu102 · Cited by 200
Why Don't You Try Harder? An Investigation of Effort Production in Major Depression
Cléry-Melin, M.-L., Schmidt, L., Lafargue, G., Baup, N., Fossati, P., & Pessiglione, M. (2011) · PLoS ONE · doi:10.1371/journal.pone.0023178 · Cited by 191
The adaptive value of preference for immediacy: when shortsighted rules have farsighted consequences
Stephens, D. W. (2001) · Behavioral Ecology · doi:10.1093/beheco/12.3.330 · Cited by 180
Decision Making: From Neuroscience to Psychiatry
Lee, D. (2013) · Neuron · doi:10.1016/j.neuron.2013.04.008 · Cited by 178 · cited 2×
“, apathy, depression, fatigue, abulia), and may thus be critical in understanding the basis of several common psychiatric and neurological conditions [9,88].”
BackgroundZeeb, F. D., Floresco, S., & Winstanley, C. A. (2010) · Psychopharmacology · doi:10.1007/s00213-010-1871-2 · Cited by 177
Parabolic discounting of monetary rewards by physical effort
Hartmann, M. N., Hager, O. M., Tobler, P. N., & Kaiser, S. (2013) · Behavioural Processes · doi:10.1016/j.beproc.2013.09.014 · Cited by 169 · cited 8×
“We found that simpler functions fulfilling the concave property of our model, such as a quadratic function with only one parameter, also provide good fits to effort-based choices [40].”
BackgroundMethodResultInfluentialAbdellaoui, M., Barrios, C., & Wakker, P. P. (2006) · Journal of Econometrics · doi:10.1016/j.jeconom.2006.05.025 · Cited by 169 · cited 2×
“The utility function is typically concave for the average human participant [57,58].”
BackgroundFrank, M. J., Scheres, A., & Sherman, S. J. (2007) · Philosophical Transactions of the Royal Society B Biological Sciences · doi:10.1098/rstb.2007.2058 · Cited by 168
The Psychopharmacology of Energy and Fatigue
Stahl, S. M. (2002) · The Journal of Clinical Psychiatry · doi:10.4088/jcp.v63n0102 · Cited by 159 · cited 1×
“The motivational disturbances experienced in some of these conditions can profoundly affect one’s personal and professional life, and cause limitations in terms of life function, interaction with the environment, and responsiveness to treatment [26,89,90].”
BackgroundHillman, K. L., & Bilkey, D. K. (2010) · Journal of Neuroscience · doi:10.1523/jneurosci.1273-10.2010 · Cited by 157
Ghods-Sharifi, S., & Floresco, S. (2010) · Behavioral Neuroscience · doi:10.1037/a0018932 · Cited by 155
Rate currencies and the foraging starling: the fallacy of the averages revisited
Melissa Bateson, B., & Kacelnik, A. (1996) · Behavioral Ecology · doi:10.1093/beheco/7.3.341 · Cited by 153
THE BEHAVIORAL PHARMACOLOGY OF EFFORT‐RELATED CHOICE BEHAVIOR: DOPAMINE, ADENOSINE AND BEYOND
Salamone, J. D., Correa, M., Nunes, E. J., Randall, P. A., & Pardo, M. (2012) · Journal of the Experimental Analysis of Behavior · doi:10.1901/jeab.2012.97-125 · Cited by 151
Single-Neuron Mechanisms Underlying Cost-Benefit Analysis in Frontal Cortex
Hosokawa, T., Kennerley, S. W., Sloan, J., & Wallis, J. D. (2013) · Journal of Neuroscience · doi:10.1523/jneurosci.2221-13.2013 · Cited by 141
Evidence for Hyperbolic Temporal Discounting of Reward in Control of Movements
Haith, A. M., Reppert, T. R., & Shadmehr, R. (2012) · Journal of Neuroscience · doi:10.1523/jneurosci.0424-12.2012 · Cited by 129 · cited 1×
“Although effort and delays are commonly referred to as decision costs, one attractive proposal is that while effort is a decision cost that is ascribed to a particular action, delay is one of the parameters (like risk, uncertainty) that can be ascribed to—and discount—the value of an outcome ([43], but see [44,45] for…”
BackgroundWalton, M. E., Groves, J., Jennings, K. A., Croxson, P. L., Sharp, T., Rushworth, M. F. S., & Bannerman, D. M. (2009) · European Journal of Neuroscience · doi:10.1111/j.1460-9568.2009.06726.x · Cited by 129
Ishiwari, K., Weber, S. M., Mingote, S., Correa, M., & Salamone, J. D. (2003) · Behavioural Brain Research · doi:10.1016/j.bbr.2003.08.007 · Cited by 128
To walk or to fly? How birds choose among foraging modes
Bautista, L. M., Tinbergen, J. M., & Kacelnik, A. (2001) · Proceedings of the National Academy of Sciences · doi:10.1073/pnas.98.3.1089 · Cited by 128
Impulsivity and apathy in Parkinson's disease
Sinha, N., Manohar, S., & Husain, M. (2013) · Journal of Neuropsychology · doi:10.1111/jnp.12013 · Cited by 125
Andrade, L. F., & Petry, N. M. (2011) · Psychopharmacology · doi:10.1007/s00213-011-2508-9 · Cited by 120
Previous Cocaine Exposure Makes Rats Hypersensitive to Both Delay and Reward Magnitude
Roesch, M. R., Takahashi, Y. K., Gugsa, N., Bissonette, G. B., & Schoenbaum, G. M. (2007) · Journal of Neuroscience · doi:10.1523/jneurosci.4080-06.2007 · Cited by 119
Cocker, P. J., Hosking, J. G., Benoit, J. R. A., & Winstanley, C. A. (2012) · Neuropsychopharmacology · doi:10.1038/npp.2012.30 · Cited by 105
Bayesian neural networks for classification: how useful is the evidence framework?
Penny, W. D., & Roberts, S. (1999) · Neural Networks · doi:10.1016/s0893-6080(99)00040-4 · Cited by 104 · cited 1×
“There is a high degree of correlation between findings from cross-validation and Bayesian model comparison (see for example [98]).”
BackgroundMingote, S., Weber, S. M., Ishiwari, K., Correa, M., & Salamone, J. D. (2005) · European Journal of Neuroscience · doi:10.1111/j.1460-9568.2005.03972.x · Cited by 101 · cited 1×
“There is also some evidence that different neurotransmitters are critical in assessing delay- versus effort-related costs [86,87], and that dopamine manipulations have differential effects on these two behaviors [69].”
BackgroundTaylor, M. M., & Creelman, C. D. (1967) · The Journal of the Acoustical Society of America · doi:10.1121/1.1910698 · Cited by 99
Neural integration of risk and effort costs by the frontal pole: only upon request
Burke, C. J., Brünger, C., Kahnt, T., Park, S. Q., & Tobler, P. N. (2013) · The Journal of Neuroscience · doi:10.1523/jneurosci.3662-12.2013 · Cited by 87 · cited 2×
“Other work has suggested or implicitly used a linear model of effort discounting [31,37], and, more recently, a quadratic function [40].”
BackgroundMethodEndepols, H., Sommer, S., Backes, H., Wiedermann, D., Graf, R., & Hauber, W. (2010) · Journal of Neuroscience · doi:10.1523/jneurosci.1202-10.2010 · Cited by 84
Hamilton, K. R., & Potenza, M. N. (2012) · The American Journal of Drug and Alcohol Abuse · doi:10.3109/00952990.2011.643978 · Cited by 80
Effort in isometric muscular contractions related to force level and duration
Stevens, J. C., & Cain, W. S. (1970) · Perception & Psychophysics · doi:10.3758/bf03210214 · Cited by 77 · cited 4×
“Our two main criteria to define a theoretically grounded model for effort discounting were (1) that it can take initially concave shapes because (a) intuition tells us that small efforts should have a relatively small or no impact on value, but large efforts should lead to steep discounting of rewards; (b) studies on…”
BackgroundResultInfluentialControl of movements and temporal discounting of reward
Shadmehr, R. (2010) · Current Opinion in Neurobiology · doi:10.1016/j.conb.2010.08.017 · Cited by 75 · cited 1×
“Although effort and delays are commonly referred to as decision costs, one attractive proposal is that while effort is a decision cost that is ascribed to a particular action, delay is one of the parameters (like risk, uncertainty) that can be ascribed to—and discount—the value of an outcome ([43], but see [44,45] for…”
BackgroundReformative self‐control and discounting of reward value by delay or effort1
Sugiwaka, H., & Okouchi, H. (2004) · Japanese Psychological Research · doi:10.1111/j.1468-5884.2004.00231.x · Cited by 70 · cited 3×
“More generally, data from two tasks in which effort costs were unconfounded from delay costs provide robust evidence against the notion that effort discounting is best explained by a hyperbolic function as previously suggested [29,38,39].”
BackgroundMethodEffect of orbitofrontal cortex lesions on temporal discounting in rats
Jo, S., Kim, K.-U., Lee, D., & Jung, M. W. (2013) · Behavioural Brain Research · doi:10.1016/j.bbr.2013.02.014 · Cited by 66
Wu, S., Delgado, M. R., & Maloney, L. T. (2011) · Journal of Neuroscience · doi:10.1523/jneurosci.0540-11.2011 · Cited by 64 · cited 2×
“The utility function is typically concave for the average human participant [57,58].”
BackgroundA COMPARISON OF DELAYS AND RATIO REQUIREMENTS IN SELF‐CONTROL CHOICE
Grossbard, C. L., & Mazur, J. (1986) · Journal of the Experimental Analysis of Behavior · doi:10.1901/jeab.1986.45-305 · Cited by 62 · cited 2×
“More generally, data from two tasks in which effort costs were unconfounded from delay costs provide robust evidence against the notion that effort discounting is best explained by a hyperbolic function as previously suggested [29,38,39].”
BackgroundMethodDifferences in delay discounting between smokers and nonsmokers remain when both rewards are delayed
Mitchell, S. H., & Wilson, V. B. (2011) · Psychopharmacology · doi:10.1007/s00213-011-2521-z · Cited by 54
Chivers, L. L., & Higgins, S. T. (2012) · The American Journal of Drug and Alcohol Abuse · doi:10.3109/00952990.2011.643979 · Cited by 22
Calvert, A. L., Green, L., & Myerson, J. (2011) · Frontiers in Neuroscience · doi:10.3389/fnins.2011.00096 · Cited by 21
DISCOUNT RATES INFERRED FROM DECISIONS: AN EXPERIMENTAL STUDY
Ben‐Zion, U., Israel, H., Rapoport, A., & Yagil, J. (1987) · Financial Review · doi:10.1111/j.1540-6288.1987.tb01155.x · Cited by 19
Hartmann-Riemer, M. N., Hager, O. M., Reimann, A. V., Kirschner, M., Chumbley, J. R., Tobler, P. N., & Kaiser, S. (2014) · Schizophrenia Research · doi:10.1016/s0920-9964(14)70444-x · Cited by 8
Research works printed but not linked: 1
- Meier S, Sprenger C. Present-Biased Preferences and Credit Card Borrowing [Internet]. Rochester, NY: Social Science Research Network; Report No.: ID 1412276. Available: http://papers.ssrn.com/abstract=1412276
Cited by
Sorted by citations
Neurocomputational mechanisms underlying subjective valuation of effort costs
Chong, T. T.-J., Apps, M., Giehl, K., Sillence, A., Grima, L. L., & Husain, M. (2017) · PLOS Biology · doi:10.1371/journal.pbio.1002598 · Cited by 415
“These functions have been used in several previous studies to fit effort discounting in the physical domain [5, 14, 33].”
BackgroundMethodA Representation of Effort in Decision-Making and Motor Control
Shadmehr, R., Huang, H. J., & Ahmed, A. A. (2016) · Current Biology · doi:10.1016/j.cub.2016.05.065 · Cited by 269
Klein-Flügge, M. C., Kennerley, S. W., Friston, K. J., & Bestmann, S. (2016) · Journal of Neuroscience · doi:10.1523/jneurosci.0292-16.2016 · Cited by 271
“We performed several behavioral experiments to develop a behavioral model that can formally describe the range of effort discounting behaviors observed in healthy populations (Klein-Flügge et al., 2015).”
BackgroundMethodResultInfluentialSelf-citationWhy not try harder? Computational approach to motivation deficits in neuro-psychiatric diseases
Pessiglione, M., Vinckier, F., Bouret, S., Jean Daunizeau, A., & Bouc, R. L. (2017) · Brain · doi:10.1093/brain/awx278 · Cited by 255
“Indifference points can be determined through an adaptive design, such as a stair-case procedure, that increments effort and/or rewards levels based on observed choices (Westbrook et al., 2013; Klein-Flugge et al., 2015; Le Bouc et al., 2016).”
BackgroundMüller, T., & Apps, M. A. J. (2018) · Neuropsychologia · doi:10.1016/j.neuropsychologia.2018.04.030 · Cited by 265
Metadata
- Authors
- Klein-Flügge, M. C., Kennerley, S. W., Saraiva, A. C., Penny, W. D., & Bestmann, S.
- Affiliations
- Wellcome Centre for Human Neuroimaging (GB)
- UCL Queen Square Institute of Neurology (GB)
- Corresponding author
- Klein-Flügge, Miriam C.
- Venue
- PLoS Computational Biology
- Publisher
- Public Library of Science (PLoS)
- Published
- 2015-03-27
- Volume
- 11
- Issue
- 3
- Pages
- e1004116
- ISSN
- 1553-734X (ISSN-L)
- 1553-7358
- PMC
- PMC4376637
- OpenAlex
- W2087839453
- Cited by
- 163
- References
- 104
- Citations by year
- 2026: 17 · 2025: 15 · 2024: 12 · 2023: 17 · 2022: 16 · 2021: 22 · 2020: 13 · 2019: 12 · 2018: 15 · 2017: 16 · 2016: 7 · 2015: 1
- FWCI
- 9.85
- Type
- journal article
- Language
- en
- Update notices
- correction (2017-02-27)
- Open access
- gold
- doi.org
- Licence
- Locations
- PLoS Computational Biology (publishedVersion, cc-by)
- Europe PMC (PubMed Central) (publishedVersion, cc-by)
- PubMed Central (publishedVersion, cc-by)
- PubMed (publishedVersion)
- UEA Digital Repository (University of East Anglia) (acceptedVersion)
- DOAJ (DOAJ: Directory of Open Access Journals) (submittedVersion, cc-by-sa)
- UCL Discovery (University College London) (submittedVersion)
- Figshare (submittedVersion, cc-by)
- Funders
- Wellcome Trust (091593, 091593/Z/10/, 096689/Z/11/Z, /Z/11/Z, 096689, 086120, 086120/Z/08/Z)
- Directorate for Biological Sciences
- Biotechnology and Biological Sciences Research Council
- Topics
- Social Sciences › Decision Sciences › General Decision Sciences › Decision-Making and Behavioral Economics
- Life Sciences › Neuroscience › Cognitive Neuroscience › Neural and Behavioral Psychology Studies
- Life Sciences › Neuroscience › Cellular and Molecular Neuroscience › Neurotransmitter Receptor Influence on Behavior
- Keywords
- effort discounting, delay discounting, reward devaluation, hyperbolic discounting, depression, Bayesian model selection, human choice behavior
- MeSH terms
- Adult, Choice Behavior, Female, Humans, Male, Models, Biological, Reward, Task Performance and Analysis, Hand Strength, Computational Biology, Young Adult
About these checks
Registry, retraction, Cites and statistics results are computed, not judged, with one exception: a printed reference that no index lists is read once by a model before it counts as a citation error. Claims are extracted by a model and kept only when their quote appears verbatim in the text; each cited source is then checked, with a model’s help, for whether it says what the claim relies on. Those verdicts can be wrong — read the claim’s quote and the cited source before relying on one.
Statistics and arithmetic are recomputed, not judged.
Confidence bands are shown only for fields calibrated on our annotated test set. None is calibrated yet, so no band is shown.
What counts as a claim ›How we measure confidence ›How we check this ›
Are you an author, or do you see a problem with this page? Request a review
