

The DOI matches its Crossref record; 63 of the 63 references it cites were found in a registry or an index.
Transcranial Electrical Currents to Probe EEG Brain Rhythms and Memory Consolidation during Sleep in Humans
Open accessAbstract
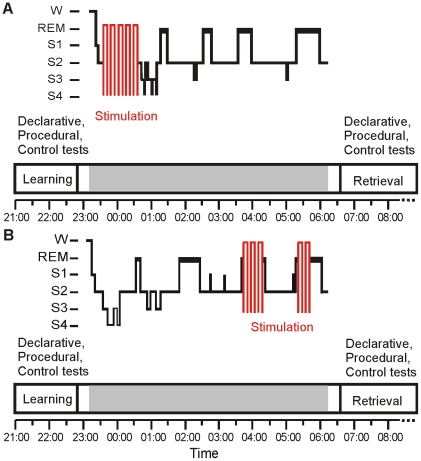
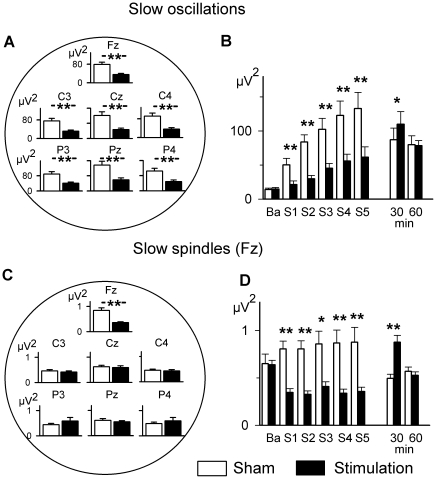
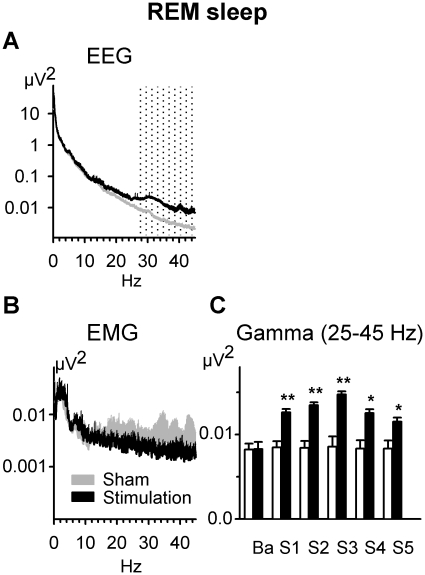
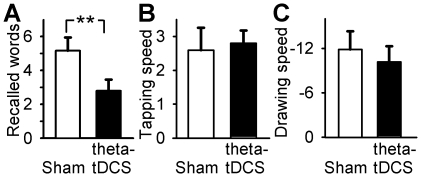
Previously the application of a weak electric anodal current oscillating with a frequency of the sleep slow oscillation (∼0.75 Hz) during non-rapid eye movement sleep (NonREM) sleep boosted endogenous slow oscillation activity and enhanced sleep-associated memory consolidation. The slow oscillations occurring during NonREM sleep and theta oscillations present during REM sleep have been considered of critical relevance for memory formation. Here transcranial direct current stimulation (tDCS) oscillating at 5 Hz, i.e., within the theta frequency range (theta-tDCS) is applied during NonREM and REM sleep. Theta-tDCS during NonREM sleep produced a global decrease in slow oscillatory activity conjoint with a local reduction of frontal slow EEG spindle power (8-12 Hz) and a decrement in consolidation of declarative memory, underlining the relevance of these cortical oscillations for sleep-dependent memory consolidation. In contrast, during REM sleep theta-tDCS appears to increase global gamma (25-45 Hz) activity, indicating a clear brain state-dependency of theta-tDCS. More generally, results demonstrate the suitability of oscillating-tDCS as a tool to analyze functions of endogenous EEG rhythms and underlying endogenous electric fields as well as the interactions between EEG rhythms of different frequencies.
Overview
The claims and statistics of this paper haven’t been checked yet.
Run the check — free, no account needed. It reads the open-access text and checks the sources it cites.
Integrity signals
Registry
Cites
Statistics
Figures
Verification
Claims the paper makes
The claims and statistics of this paper haven’t been checked yet.
Run the check — free, no account needed. It reads the open-access text and checks the sources it cites.
Claims other papers make about this one
Each is checked against this paper’s own text: does it say what the citing paper says it does?
The source backs part of the claim, not all of it — or backs it for a different population, condition or comparison.
In the citing paper
“Marshall et al. (2011) found that theta transcranial direct current stimulation (theta-tDCS) applied during REM sleep increases fast beta/gamma EEG oscillations”
From The Functional Role of Dreaming in Emotional Processes (2019) · cites this paper as Marshall et al., 2011
Experimental — accuracy not yet measuredThe source backs part of the claim, not all of it — or backs it for a different population, condition or comparison.
In the citing paper
“The theta-tDCS condition was associated with worse mood (i.e., as measured by Positive and Negative Affect Scale negative scores) on the morning after awakening from sleep, compared to sham”
From The Functional Role of Dreaming in Emotional Processes (2019) · cites this paper as Marshall et al., 2011
Experimental — accuracy not yet measuredThe cited source says what the claim attributes to it.
In the citing paper
“the widespread increase in gamma activity with theta-tDCS provided evidence for the functional coupling between these two rhythms”
From The Functional Role of Dreaming in Emotional Processes (2019) · cites this paper as Marshall et al., 2011
The cited source says what the claim attributes to it.
In the citing paper
“tDCS at the 5 Hz theta frequency during early non-REM sleep had an immediate suppressing rather than enhancing effect on endogenous slow oscillation and frontal slow spindle activity, and impaired overnight retention of word pairs (784).”
From About Sleep's Role in Memory (2013) · cites this paper as [784]
The cited source says what the claim attributes to it.
In the citing paper
“C:in contrast, tDCS oscillating at 5 Hz (theta-tDCS) decreased slow oscillation activity at all recording sites and slow frontal spindle activity, and these effects were associated with an impaired retention of declarative memory across sleep.”
From About Sleep's Role in Memory (2013) · cites this paper as [784]
In the citing paper
“In addition, there is evidence that toDCS only at 0.75 Hz (not at 5 Hz) and applied only during sleep leads to an increase of memory consolidation [32,52,53].”
Self-check
Percentages, sums and reported differences re-computed from the paper’s own numbers.
The self-check needs the paper’s full text.
Citations
Cites
Development and validation of brief measures of positive and negative affect: The PANAS scales.
Watson, D., Clark, L. A., & Tellegen, A. (1988) · Journal of Personality and Social Psychology · doi:10.1037/0022-3514.54.6.1063 · Cited by 32,433
Rechtschaffen, A. (1968) · Medical Entomology and Zoology · Cited by 11,772
Hobson, J. A. (1969) · Electroencephalography and Clinical Neurophysiology · doi:10.1016/0013-4694(69)90021-2 · Cited by 5,215
Diekelmann, S., & Born, J. (2010) · Nature Reviews Neuroscience · doi:10.1038/nrn2762 · Cited by 3,760
Theta oscillations in the hippocampus
Buzsáki, G. (2002) · Neuron · doi:10.1016/s0896-6273(02)00586-x · Cited by 3,332
Wechsler Adult Intelligence Scale--Third Edition
Wechsler, D. (2019) · PsycTESTS Dataset · doi:10.1037/t49755-000 · Cited by 2,327
Neural synchrony in brain disorders: Relevance for cognitive dysfunctions and pathophysiology
Uhlhaas, P. J., & Singer, W. (2006) · Neuron · doi:10.1016/j.neuron.2006.09.020 · Cited by 2,194
Boosting slow oscillations during sleep potentiates memory
Marshall, L., Helgadóttir, H., Mölle, M., & Born, J. (2006) · Nature · doi:10.1038/nature05278 · Cited by 1,792
Self-citationDijk, D., & Czeisler, C. (1995) · The Journal of Neuroscience · doi:10.1523/jneurosci.15-05-03526.1995 · Cited by 1,356
Practice with Sleep Makes Perfect
Walker, M. P., Brakefield, T., Morgan, A., Hobson, J. A., & Stickgold, R. (2002) · Neuron · doi:10.1016/s0896-6273(02)00746-8 · Cited by 1,307
Effects of early and late nocturnal sleep on declarative and procedural memory
Plihal, W., & Born, J. (1997) · Journal of Cognitive Neuroscience · doi:10.1162/jocn.1997.9.4.534 · Cited by 1,026
Sleep deprivation: effect on sleep stages and EEG power density in man
Borbély, A. A., Baumann, F., Brandeis, D., Strauch, I., & Lehmann, D. (1981) · Electroencephalography and Clinical Neurophysiology · doi:10.1016/0013-4694(81)90225-x · Cited by 1,013
Dependence on REM Sleep of Overnight Improvement of a Perceptual Skill
Karni, A., Tanne, D., Rubenstein, B. S., Askenasy, J. J. M., & Sagi, D. (1994) · Science · doi:10.1126/science.8036518 · Cited by 1,002
Cross-frequency coupling between neuronal oscillations
Jensen, O., & Colgin, L. L. (2007) · Trends in Cognitive Sciences · doi:10.1016/j.tics.2007.05.003 · Cited by 991
Coherent 40-Hz oscillation characterizes dream state in humans.
Llinás, R., & Ribary, U. (1993) · Proceedings of the National Academy of Sciences · doi:10.1073/pnas.90.5.2078 · Cited by 962
Endogenous electric fields may guide neocortical network activity
Fröhlich, F., & McCormick, D. A. (2010) · Neuron · doi:10.1016/j.neuron.2010.06.005 · Cited by 913
Learning-dependent increases in sleep spindle density
Gais, S., Mölle, M., Helms, K., & Born, J. (2002) · The Journal of Neuroscience · doi:10.1523/jneurosci.22-15-06830.2002 · Cited by 859
Brain Oscillatory Substrates of Visual Short-Term Memory Capacity
Sauseng, P., Klimesch, W., Heise, K.-F., Gruber, W. R., Holz, E. M., Karim, A. A., Glennon, M., Gerloff, C. P., Birbaumer, N., & Hummel, F. C. (2009) · Current Biology · doi:10.1016/j.cub.2009.08.062 · Cited by 707
The contribution of sleep to hippocampus-dependent memory consolidation
Marshall, L., & Born, J. (2007) · Trends in Cognitive Sciences · doi:10.1016/j.tics.2007.09.001 · Cited by 667
Grouping of spindle activity during slow oscillations in human non-rapid eye movement sleep
Mölle, M., Marshall, L., Gais, S., & Born, J. (2002) · The Journal of Neuroscience · doi:10.1523/jneurosci.22-24-10941.2002 · Cited by 617
Wagner, U., Gais, S., & Born, J. (2001) · Learning & Memory · doi:10.1101/lm.36801 · Cited by 605 · cited 1×
“Indications in the present study for an influence of theta-tDCS during REM sleep on control tests are supportive of processes during REM affecting cortical associations and emotional tone of dreams and/or memories [59,60].”
BackgroundREM sleep, prefrontal theta, and the consolidation of human emotional memory
Nishida, M., Pearsall, J., Buckner, R. L., & Walker, M. P. (2009) · Cerebral Cortex · doi:10.1093/cercor/bhn155 · Cited by 603
Sleep as a fundamental property of neuronal assemblies
Krueger, J. M., Rector, D. M., Roy, S., Van Dongen, H. P. A., Belenky, G., & Panksepp, J. (2008) · Nature Reviews Neuroscience · doi:10.1038/nrn2521 · Cited by 596
Frontal-midline theta from the perspective of hippocampal “theta”
Mitchell, D. J., McNaughton, N., Flanagan, D., & Kirk, I. J. (2008) · Progress in Neurobiology · doi:10.1016/j.pneurobio.2008.09.005 · Cited by 549
Transcranial direct current stimulation during sleep improves declarative memory
Marshall, L., Mölle, M., Hallschmid, M., & Born, J. (2004) · The Journal of Neuroscience · doi:10.1523/jneurosci.2725-04.2004 · Cited by 548
Self-citationNeurobiology of REM and NREM sleep
McCarley, R. W. (2007) · Sleep Medicine · doi:10.1016/j.sleep.2007.03.005 · Cited by 538
Isomura, Y., Sirota, A., Özen, S., Montgomery, S., Mizuseki, K., Henze, D. A., & Buzsáki, G. (2006) · Neuron · doi:10.1016/j.neuron.2006.10.023 · Cited by 500
Hemodynamic cerebral correlates of sleep spindles during human non-rapid eye movement sleep
Schabus, M., Dang-Vu, T. T., Albouy, G., Balteau, E., Boly, M., Carrier, J., Darsaud, A., Degueldre, C., Desseilles, M., Gais, S., et al. (2007) · Proceedings of the National Academy of Sciences · doi:10.1073/pnas.0703084104 · Cited by 488
Achermann, P., Dijk, D.-J., Brunner, D. P., & Borbély, A. A. (1993) · Brain Research Bulletin · doi:10.1016/0361-9230(93)90016-5 · Cited by 470
Lucid dreaming: a state of consciousness with features of both waking and non-lucid dreaming
Voss, U., Holzmann, R., Tuin, I., & Hobson, A. J. (2009) · Sleep · doi:10.1093/sleep/32.9.1191 · Cited by 445
Frequency-Dependent Electrical Stimulation of the Visual Cortex
Kanai, R., Chaieb, L., Antal, A., Walsh, V., & Paulus, W. (2008) · Current Biology · doi:10.1016/j.cub.2008.10.027 · Cited by 440
Transcranial Electric Stimulation Entrains Cortical Neuronal Populations in Rats
Irmak, S. O., Sirota, A., Belluscio, M., Anastassiou, C. A., Stark, E., Koch, C., & Buzsáki, G. (2010) · Journal of Neuroscience · doi:10.1523/jneurosci.5252-09.2010 · Cited by 436
New insights into rhythmic brain activity from TMS–EEG studies
Thut, G., & Miniussi, C. (2009) · Trends in Cognitive Sciences · doi:10.1016/j.tics.2009.01.004 · Cited by 425
The sequential hypothesis of the function of sleep
Giuditta, A., Ambrosini, M. V., Montagnese, P., Mandile, P., Cotugno, M., Zucconi, G. G., & Vescia, S. (1995) · Behavioural Brain Research · doi:10.1016/0166-4328(95)00012-i · Cited by 382
Effects of early and late nocturnal sleep on priming and spatial memory
Plihal, W., & Born, J. (1999) · Psychophysiology · doi:10.1111/1469-8986.3650571 · Cited by 364
Sleep states and memory processes in humans: procedural versus declarative memory systems
Smith, C. (2001) · Sleep Medicine Reviews · doi:10.1053/smrv.2001.0164 · Cited by 355
Sleep-Dependent θ Oscillations in the Human Hippocampus and Neocortex
Cantero, J. L., Atienza, M., Stickgold, R., Kahana, M. J., Madsen, J. R., & Kocsis, B. (2003) · The Journal of Neuroscience · doi:10.1523/jneurosci.23-34-10897.2003 · Cited by 312
Sensitivity of Neurons to Weak Electric Fields
Francis, J. T., Gluckman, B. J., & Schiff, S. J. (2003) · Journal of Neuroscience · doi:10.1523/jneurosci.23-19-07255.2003 · Cited by 302
Radman, T., Su, Y., An, J. H., Parra, L. C., & Bikson, M. (2007) · Journal of Neuroscience · doi:10.1523/jneurosci.0095-07.2007 · Cited by 300
Sensitivity of coherent oscillations in rat hippocampus to AC electric fields
Deans, J. K., Powell, A. D., & Jefferys, J. G. R. (2007) · The Journal of Physiology · doi:10.1113/jphysiol.2007.137711 · Cited by 294
Phase-coupling of theta–gamma EEG rhythms during short-term memory processing
Schack, B., Vath, N., Petsche, H., Geissler, H.-G., & Möller, E. (2002) · International Journal of Psychophysiology · doi:10.1016/s0167-8760(01)00199-4 · Cited by 281
Pharmacological REM sleep suppression paradoxically improves rather than impairs skill memory
Rasch, B., Pommer, J., Diekelmann, S., & Born, J. (2009) · Nature Neuroscience · doi:10.1038/nn.2206 · Cited by 259
FOGEL, S., SMITH, C., & COTE, K. (2007) · Behavioural Brain Research · doi:10.1016/j.bbr.2007.02.037 · Cited by 246
Wolansky, T., Clement, E., Peters, S. R., Palczak, M. A., & Dickson, C. T. (2006) · Journal of Neuroscience · doi:10.1523/jneurosci.5594-05.2006 · Cited by 236
Interspecies differences in the occurrence of theta
Winson, J. (1972) · Behavioral Biology · doi:10.1016/s0091-6773(72)80210-4 · Cited by 231
Learning increases human electroencephalographic coherence during subsequent slow sleep oscillations
Mölle, M., Marshall, L., Gais, S., & Born, J. (2004) · Proceedings of the National Academy of Sciences · doi:10.1073/pnas.0402820101 · Cited by 222
Kirov, R., Weiss, C., Siebner, H. R., Born, J., & Marshall, L. (2009) · Proceedings of the National Academy of Sciences · doi:10.1073/pnas.0904438106 · Cited by 208
Gross, D. W., & Gotman, J. (1999) · Neuroscience · doi:10.1016/s0306-4522(99)00343-7 · Cited by 184
Reverberation, storage, and postsynaptic propagation of memories during sleepPreprint
Ribeiro, S. T. G., & Nicolelis, M. A. L. (2004) · Learning & Memory · doi:10.1101/lm.75604 · Cited by 158
Functional EEG topography in sleep and waking: state-dependent and state-independent features
Tinguely, G., Finelli, L. A., Landolt, H.-P., Borbély, A. A., & Achermann, P. (2006) · NeuroImage · doi:10.1016/j.neuroimage.2006.03.017 · Cited by 147
Circadian regulation of ion channels and their functions
Ko, G. Y. ‐., Shi, L., & Ko, M. L. (2009) · Journal of Neurochemistry · doi:10.1111/j.1471-4159.2009.06223.x · Cited by 106
Knoblauch, V. (2002) · Cerebral Cortex · doi:10.1093/cercor/12.10.1092 · Cited by 104
Field effects in the CNS play functional roles
Weiss, S. A. (2010) · Frontiers in Neural Circuits · doi:10.3389/fncir.2010.00015 · Cited by 100
MARZANO, C., FERRARA, M., CURCIO, G., & GENNARO, L. D. (2009) · Journal of Sleep Research · doi:10.1111/j.1365-2869.2009.00776.x · Cited by 99
Fogel, S. M., Smith, C. T., & Beninger, R. J. (2009) · Brain Research Bulletin · doi:10.1016/j.brainresbull.2009.03.002 · Cited by 80
Bergmann, T. O., Groppa, S., Seeger, M., Mölle, M., Marshall, L., & Siebner, H. R. (2009) · Journal of Neurophysiology · doi:10.1152/jn.00437.2009 · Cited by 75
Tucker, M. A., & Fishbein, W. I. (2009) · Journal of Sleep Research · doi:10.1111/j.1365-2869.2009.00740.x · Cited by 74
Nishida, M., Hirai, N., Miwakeichi, F., Maehara, T., Kawai, K., Shimizu, H., & Uchida, S. (2004) · Neuroscience Research · doi:10.1016/j.neures.2004.08.004 · Cited by 54
The time course of high-frequency bands (15–45 Hz) in all-night spectral analysis of sleep EEG
Ferri, R., Elia, M., Musumeci, S. A., & Pettinato, S. (2000) · Clinical Neurophysiology · doi:10.1016/s1388-2457(00)00303-5 · Cited by 52
Functional neuroanatomy of human sleep states after zolpidem and placebo: A H215O‐PET study
Finelli, L. A., Landolt, H., Buck, A., Roth, C., Berthold, T., Borbély, A. A., & Achermann, P. (2000) · Journal of Sleep Research · doi:10.1046/j.1365-2869.2000.00191.x · Cited by 50
Effect of slow-wave sleep deprivation on topographical distribution of spindles
Gennaro, L. D. (2000) · Behavioural Brain Research · doi:10.1016/s0166-4328(00)00247-3 · Cited by 33
Dickson, C. T. (2010) · Behavioural Brain Research · doi:10.1016/j.bbr.2010.04.002 · Cited by 29
Safety Assessment of NMR Clinical Equipment
Schmidt, K. (1987) · Cited by 11
Research works printed but not linked: 1
- MS Doran, 2003, The Dynamic Topography of Individual Sleep Spindles., Sleep Research Online, 5, 133
Cited by
Sorted by citations
Rasch, B., & Born, J. (2013) · Physiological Reviews · doi:10.1152/physrev.00032.2012 · Cited by 2,783
“Further controls ensured that the effects depended on the frequency of the oscillating stimulation and on the brain state (FIGURE 5C): tDCS at the 5 Hz theta frequency during early non-REM sleep had an immediate suppressing rather than enhancing effect on endogenous slow oscillation and frontal slow spindle activity,…”
BackgroundHerrmann, C. S., Rach, S., Neuling, T., & Strüber, D. (2013) · Frontiers in Human Neuroscience · doi:10.3389/fnhum.2013.00279 · Cited by 851
Horvath, J. C., Forte, J. D., & Carter, O. (2015) · Brain Stimulation · doi:10.1016/j.brs.2015.01.400 · Cited by 609
Immediate neurophysiological effects of transcranial electrical stimulation
Liu, A. A., Vöröslakos, M., Kronberg, G., Henin, S. E., Krause, M. R., Huang, Y., Opitz, A., Mehta, A. D., Pack, C. C., Krekelberg, B., et al. (2018) · Nature Communications · doi:10.1038/s41467-018-07233-7 · Cited by 604
Peterchev, A. V., Wagner, T. A., Miranda, P. C., Nitsche, M. A., Paulus, W., Lisanby, S. H., Pascual‐Leone, Á., & Bikson, M. (2011) · Brain stimulation · doi:10.1016/j.brs.2011.10.001 · Cited by 444
Metadata
- Authors
- Marshall, L., Kirov, R., Brade, J., Mölle, M., & Born, J.
- Affiliations
- University of Lübeck (DE)
- Bulgarian Academy of Sciences (BG)
- Corresponding author
- Marshall, Lisa
- Venue
- PLoS ONE
- Publisher
- Public Library of Science (PLoS)
- Published
- 2011-02-14
- Volume
- 6
- Issue
- 2
- Pages
- e16905
- ISSN
- 1932-6203 (ISSN-L)
- PMC
- PMC3038929
- OpenAlex
- W1966385969
- Cited by
- 188
- References
- 63
- Citations by year
- 2026: 3 · 2025: 7 · 2024: 4 · 2023: 7 · 2022: 8 · 2021: 13 · 2020: 14 · 2019: 12 · 2018: 11 · 2017: 16 · 2016: 22 · 2015: 18 · 2014: 16 · 2013: 18 · 2012: 12
- FWCI
- 9.37
- Type
- journal article
- Language
- en
- Open access
- gold
- doi.org
- Locations
- PLoS ONE (publishedVersion, cc-by)
- PubMed Central (publishedVersion, cc-by)
- PubMed (publishedVersion)
- DOAJ (DOAJ: Directory of Open Access Journals) (submittedVersion, cc-by-sa)
- Funders
- Deutsche Forschungsgemeinschaft (SFB654)
- Universität zu Lübeck
- Topics
- Life Sciences › Neuroscience › Neurology › Transcranial Magnetic Stimulation Studies
- Life Sciences › Neuroscience › Cognitive Neuroscience › Sleep and Wakefulness Research
- Life Sciences › Neuroscience › Cognitive Neuroscience › Neural dynamics and brain function
- Keywords
- transcranial direct current stimulation, sleep slow oscillations, REM sleep, NREM sleep, memory consolidation, declarative memory, theta oscillations, gamma oscillations, EEG spindles, endogenous electric fields, sleep-dependent memory
- MeSH terms
- Adolescent, Adult, Biological Clocks, Brain, Electric Stimulation, Electroencephalography, Female, Humans, Male, Memory, Neuropsychological Tests, Sleep, Task Performance and Analysis, Deep Brain Stimulation, Young Adult
About these checks
Registry, retraction, Cites and statistics results are computed, not judged, with one exception: a printed reference that no index lists is read once by a model before it counts as a citation error. Claims are extracted by a model and kept only when their quote appears verbatim in the text; each cited source is then checked, with a model’s help, for whether it says what the claim relies on. Those verdicts can be wrong — read the claim’s quote and the cited source before relying on one.
Statistics and arithmetic are recomputed, not judged.
Confidence bands are shown only for fields calibrated on our annotated test set. None is calibrated yet, so no band is shown.
What counts as a claim ›How we measure confidence ›How we check this ›
Are you an author, or do you see a problem with this page? Request a review
