

The DOI matches its Crossref record; 96 of the 96 references it cites were found in a registry or an index.
Impaired Carbohydrate Digestion and Transport and Mucosal Dysbiosis in the Intestines of Children with Autism and Gastrointestinal Disturbances
Open accessAbstract
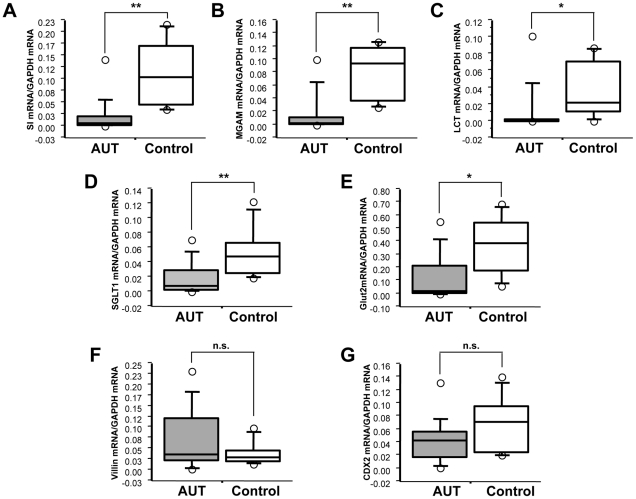
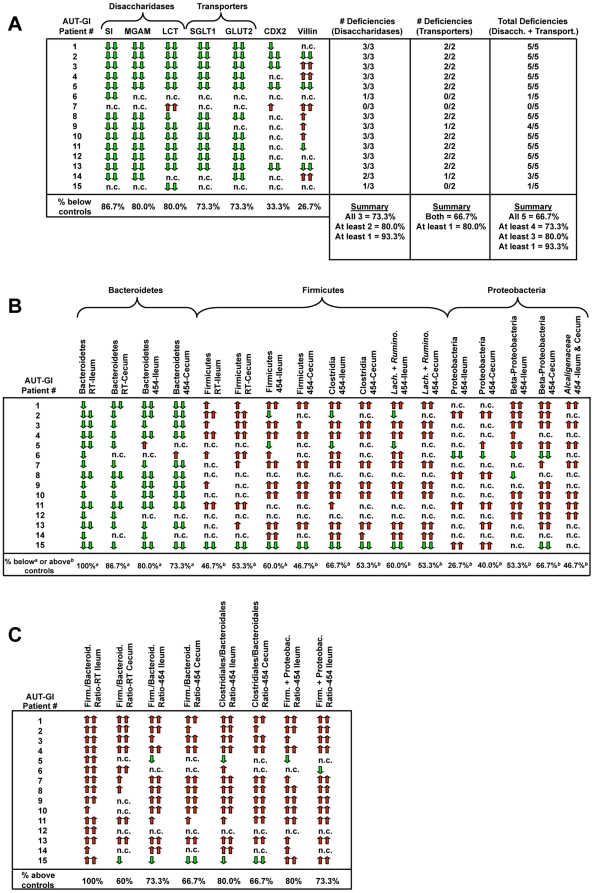
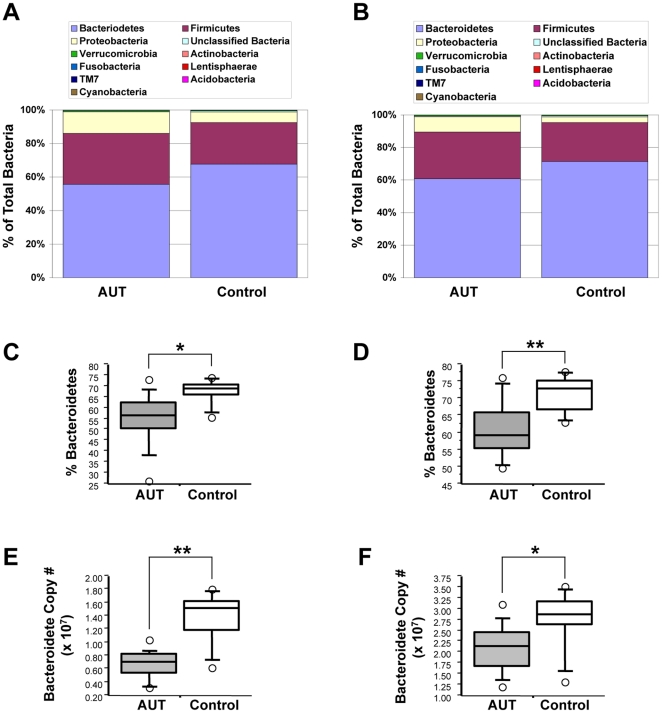
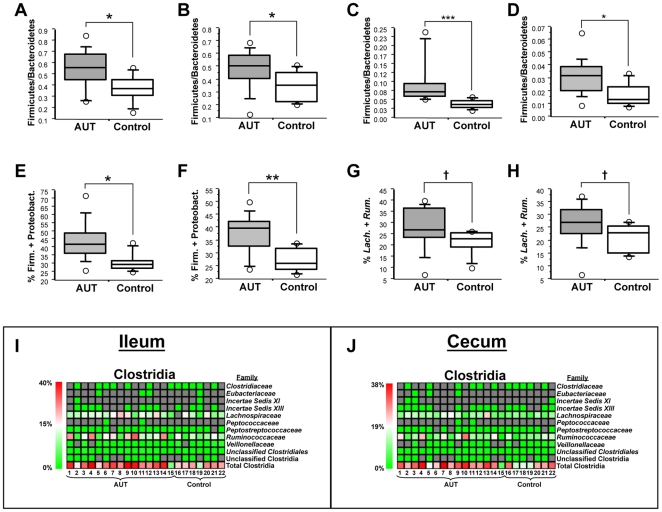
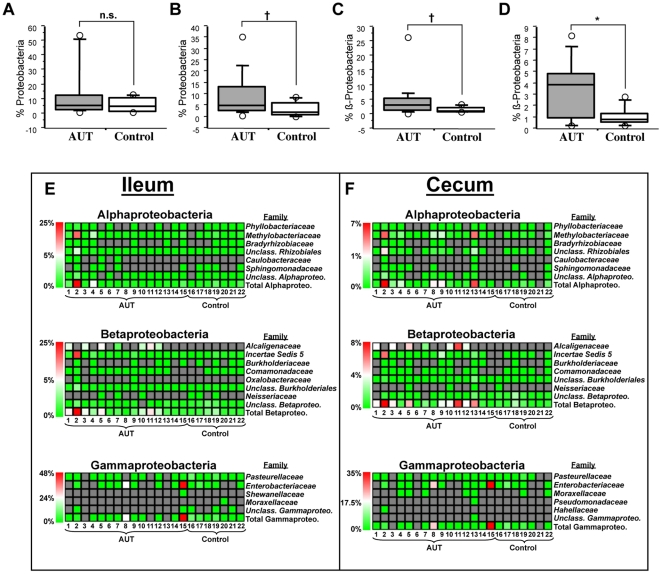
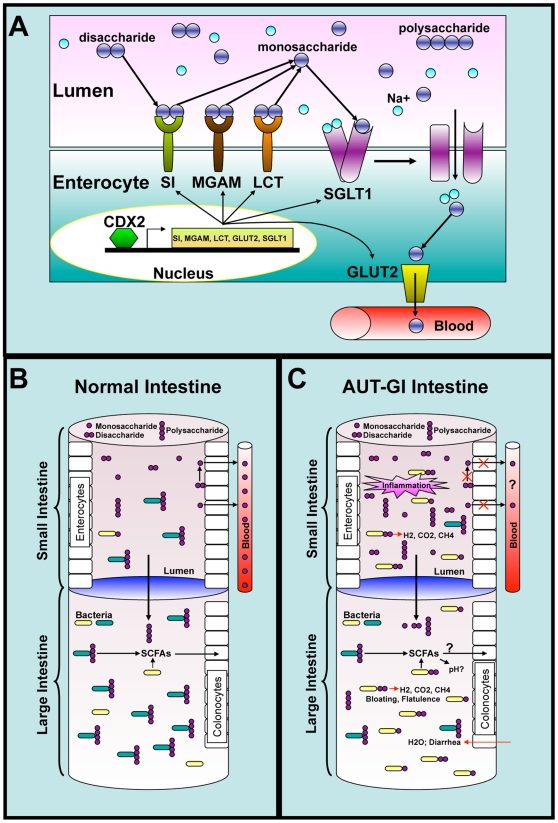
Gastrointestinal disturbances are commonly reported in children with autism, complicate clinical management, and may contribute to behavioral impairment. Reports of deficiencies in disaccharidase enzymatic activity and of beneficial responses to probiotic and dietary therapies led us to survey gene expression and the mucoepithelial microbiota in intestinal biopsies from children with autism and gastrointestinal disease and children with gastrointestinal disease alone. Ileal transcripts encoding disaccharidases and hexose transporters were deficient in children with autism, indicating impairment of the primary pathway for carbohydrate digestion and transport in enterocytes. Deficient expression of these enzymes and transporters was associated with expression of the intestinal transcription factor, CDX2. Metagenomic analysis of intestinal bacteria revealed compositional dysbiosis manifest as decreases in Bacteroidetes, increases in the ratio of Firmicutes to Bacteroidetes, and increases in Betaproteobacteria. Expression levels of disaccharidases and transporters were associated with the abundance of affected bacterial phylotypes. These results indicate a relationship between human intestinal gene expression and bacterial community structure and may provide insights into the pathophysiology of gastrointestinal disturbances in children with autism.
Overview
The claims and statistics of this paper haven’t been checked yet.
Run the check — free, no account needed. It reads the open-access text and checks the sources it cites.
Integrity signals
Registry
Cites
Statistics
Figures
Verification
Claims the paper makes
The claims and statistics of this paper haven’t been checked yet.
Run the check — free, no account needed. It reads the open-access text and checks the sources it cites.
Claims other papers make about this one
Each is checked against this paper’s own text: does it say what the citing paper says it does?
The cited source says what the claim attributes to it.
In the citing paper
“Interestingly, from a Clostridiales cluster standpoint, the studies on Cluster I and Cluster II, as well as Cluster XI, while few, collectively suggested an increase in children with ASD [45, 49, 51, 52, 54].”
From Gut microbiota changes in children with autism spectrum disorder: a systematic review (2020) · cites this paper as [54]
In the citing paper
“Ileal and cecal biopsies from children with ASD and GI dysfunction showed increased Firmicutes and decreased Bacteroidetes [51].”
From The Gut Microbiota and Dysbiosis in Autism Spectrum Disorders (2018) · cites this paper as [51]
In the citing paper
“Two studies showed increases [31, 33] and six studies showed no significant changes in alpha diversity [36, 42, 43, 48, 50, 54].”
From Gut microbiota changes in children with autism spectrum disorder: a systematic review (2020) · cites this paper as [54]
In the citing paper
“The rest of the studies observed either a decrease in Bacteroidetes percentage [50, 54] or no significant differences between cases and controls [31, 36, 48].”
From Gut microbiota changes in children with autism spectrum disorder: a systematic review (2020) · cites this paper as [54]
In the citing paper
“At the phylum level, none of the six studies showed an increase in absolute or relative abundance [31, 33, 36, 48, 51, 54].”
From Gut microbiota changes in children with autism spectrum disorder: a systematic review (2020) · cites this paper as [54]
In the citing paper
“For relative abundance in both total and metabolically active Firmicutes, the studies demonstrated either a decrease [31, 33, 36] or no significant differences between children with ASD, SIB, and HC [48, 51, 54].”
From Gut microbiota changes in children with autism spectrum disorder: a systematic review (2020) · cites this paper as [54]
In the citing paper
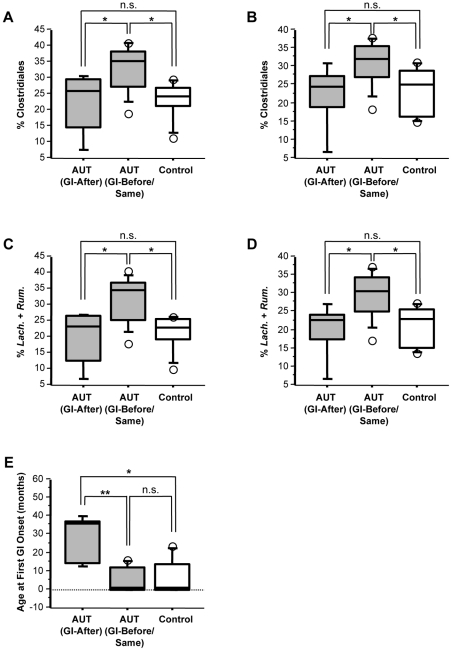
“Although focusing mainly on phylum level changes, the key differences associated with the ASD group with FGID were seen as an increase in Clostridiales, particularly in Lachnospiraceae and Ruminococcaceae.”
From Distinct Microbiome-Neuroimmune Signatures Correlate With Functional Abdominal Pain in Children With Autism Spectrum Disorder (2017) · cites this paper as [23]
In the citing paper
“A single study, with a follow-up report, remains the only characterization of the mucosal microbiome in pediatric ASD.23, 34”
From Distinct Microbiome-Neuroimmune Signatures Correlate With Functional Abdominal Pain in Children With Autism Spectrum Disorder (2017) · cites this paper as [23]
In the citing paper
“Differences in the types and composition of various bacterial species in children with ASD have been reported.22, 23, 24, 25, 26, 27”
From Distinct Microbiome-Neuroimmune Signatures Correlate With Functional Abdominal Pain in Children With Autism Spectrum Disorder (2017) · cites this paper as [23]
In the citing paper
“Although the analysis focused mainly on higher taxonomic levels, an increase in Clostridiales, especially Lachnospiraceaea and Ruminococcaceae, was observed.23”
From Distinct Microbiome-Neuroimmune Signatures Correlate With Functional Abdominal Pain in Children With Autism Spectrum Disorder (2017) · cites this paper as [23]
In the citing paper
“A single tissue-based study in pediatric ASD has been published with a total sample size of 22 subjects (ASD, n = 15; NT, n = 7) and a limited age range of 3–5 years.”
From Distinct Microbiome-Neuroimmune Signatures Correlate With Functional Abdominal Pain in Children With Autism Spectrum Disorder (2017) · cites this paper as [23]
In the citing paper
“A significantly higher prevalence of Sutterella species in biopsies taken from the GI tract of ASD children with GI disturbances compared to controls with GI disturbances has been found [146].”
From Autism, Gastrointestinal Symptoms and Modulation of Gut Microbiota by Nutritional Interventions (2019) · cites this paper as [146]
In the citing paper
“Interestingly, some of the microbial differences seen in children with ASD have been associated with impaired transcription of genes involved in carbohydrate metabolism 52.”
From Gastrointestinal Issues and Autism Spectrum Disorder (2020) · cites this paper as [52]
In the citing paper
“In terms of gender, Luna et al.17 and William et al.24 only included male individuals, the remaining studies included both male and female.”
From Altered composition and function of intestinal microbiota in autism spectrum disorders: A systematic review (2019) · cites this paper as [24]
In the citing paper
“Consistently, William et al.24 and Finegold et al.27 both reported that the Proteobacteria was elevated in ASD patients rather than HCs.”
From Altered composition and function of intestinal microbiota in autism spectrum disorders: A systematic review (2019) · cites this paper as [24]
In the citing paper
“Three studies indicated a clear alteration of the gut bacterial community in ASD patients characterized by a higher Firmicutes/Bacteroidetes ratio in ASD than that in HCs due to a significant increase of Firmicutes and/or a reduction of Bacteroidetes18,24,28.”
From Altered composition and function of intestinal microbiota in autism spectrum disorders: A systematic review (2019) · cites this paper as [24]
In the citing paper
“As for comparability, Luna et al.17, Inoue et al.20, De Angelis et al.23 and William et al.24,25 included case and control with better design, such as all participants has consistent GI symptoms at baseline, thus these studies achieved 2 points in the comparability assessment.”
From Altered composition and function of intestinal microbiota in autism spectrum disorders: A systematic review (2019) · cites this paper as [24]
In the citing paper
“Clostridium has been extensively studied in ASD51,52 due to its characteristic of producing exotoxins and propionate, which may aggravate the symptoms of ASD53.”
From Altered composition and function of intestinal microbiota in autism spectrum disorders: A systematic review (2019) · cites this paper as [52]
In the citing paper
“Faecalibacterium20,23,24 and Ruminococcus23,24,29 were reported increased in ASD patients by three studies, but they were reported reduced in another study27.”
From Altered composition and function of intestinal microbiota in autism spectrum disorders: A systematic review (2019) · cites this paper as [24]
In the citing paper
“In addition, GI microbial dysbiosis, an imbalance in the organisms that make up the gut microbiota, has been documented in multiple studies of children with ASD [5, 7–14].”
From Pilot study of probiotic/colostrum supplementation on gut function in children with autism and gastrointestinal symptoms (2019) · cites this paper as [12]
In the citing paper
“Further, an abnormal ratio of Firmicutes to Bacteroidetes [12] has been observed as well as increased levels of certain detrimental taxa, such as Proteobacteria [10, 12].”
From Pilot study of probiotic/colostrum supplementation on gut function in children with autism and gastrointestinal symptoms (2019) · cites this paper as [12]
In the citing paper
“Many reports show that children with ASD have higher counts of potentially pathogenic Clostridia than typically developing children [7–10, 12], although this is not universally true [13].”
From Pilot study of probiotic/colostrum supplementation on gut function in children with autism and gastrointestinal symptoms (2019) · cites this paper as [12]
Self-check
Percentages, sums and reported differences re-computed from the paper’s own numbers.
The self-check needs the paper’s full text.
Citations
Cites
1 retracted
Enterocolitis in children with developmental disorders
Wakefield, A. J., Anthony, A., MURCH, S. H., Thomson, M. A., Montgomery, S., Davies, S. E., O’Leary, J. J., Berelowitz, M., & Walker-Smith, J. A. (2000) · The American Journal of Gastroenterology · doi:10.1111/j.1572-0241.2000.03248.x · Cited by 244
RetractedSchloss, P. D., Westcott, S. L., Ryabin, T., Hall, J. R., Hartmann, M., Hollister, E. B., Lesniewski, R. A., Oakley, B. B., Parks, D. H., Robinson, C. J., et al. (2009) · Applied and Environmental Microbiology · doi:10.1128/aem.01541-09 · Cited by 19,549
An obesity-associated gut microbiome with increased capacity for energy harvest
Turnbaugh, P. J., Ley, R. E., Mahowald, M. A., Magrini, V., Mardis, E. R., & Gordon, J. I. (2006) · Nature · doi:10.1038/nature05414 · Cited by 12,444
Human gut microbes associated with obesity
Ley, R. E., Turnbaugh, P. J., Klein, S., & Gordon, J. I. (2006) · Nature · doi:10.1038/4441022a · Cited by 8,785
Obesity alters gut microbial ecology
Ley, R. E., Bäckhed, F., Turnbaugh, P., Lozupone, C. A., Knight, R. D., & Gordon, J. I. (2005) · Proceedings of the National Academy of Sciences · doi:10.1073/pnas.0504978102 · Cited by 6,176
Frank, D. N., St. Amand, A. L., Feldman, R. A., Boedeker, E. C., Harpaz, N., & Pace, N. R. (2007) · Proceedings of the National Academy of Sciences · doi:10.1073/pnas.0706625104 · Cited by 4,611
Normal gut microbiota modulates brain development and behavior
Heijtz, R. D., Wang, S., Anuar, F., Qian, Y., Björkholm, B., Samuelsson, A., Hibberd, M. L., Forssberg, H., & Pettersson, S. (2011) · Proceedings of the National Academy of Sciences · doi:10.1073/pnas.1010529108 · Cited by 3,228
The gut flora as a forgotten organ
O'Hara, A. M., & Shanahan, F. (2006) · The EMBO Reports · doi:10.1038/sj.embor.7400731 · Cited by 2,791
Sudo, N., Chida, Y., Aiba, Y., Sonoda, J., Oyama, N., Yu, X., Kubo, C., & Koga, Y. (2004) · The Journal of Physiology · doi:10.1113/jphysiol.2004.063388 · Cited by 2,735
Dethlefsen, L., Huse, S., Sogin, M. L., & Relman, D. A. (2008) · PLoS Biology · doi:10.1371/journal.pbio.0060280 · Cited by 2,361
Cited by
Sorted by citations
Hsiao, E. Y., McBride, S. W., Hsien, S., Sharon, G., Hyde, E. R., McCue, T., Codelli, J. A., Chow, J., Reisman, S. E., Petrosino, J. F., et al. (2013) · Cell · doi:10.1016/j.cell.2013.11.024 · Cited by 3,283
Gut–brain axis: How the microbiome influences anxiety and depression
Foster, J. A., & McVey Neufeld, K.-A. (2013) · Trends in Neurosciences · doi:10.1016/j.tins.2013.01.005 · Cited by 2,460
Interactions between the microbiota, immune and nervous systems in health and disease
Fung, T. C., Olson, C. A., & Hsiao, E. Y. (2017) · Nature Neuroscience · doi:10.1038/nn.4476 · Cited by 1,900
The interplay between the intestinal microbiota and the brain
Collins, S. M., Surette, M., & Bercik, P. (2012) · Nature Reviews Microbiology · doi:10.1038/nrmicro2876 · Cited by 1,611
The central nervous system and the gut microbiome
Sharon, G., Sampson, T. R., Geschwind, D. H., & Mazmanian, S. K. (2016) · Cell · doi:10.1016/j.cell.2016.10.027 · Cited by 1,513
Human Gut Microbiota from Autism Spectrum Disorder Promote Behavioral Symptoms in Mice
Sharon, G., Cruz, N. J., Kang, D.-W., Gandal, M. J., Wang, B., Kim, Y.-M., Zink, E. M., Casey, C. P., Taylor, B. C., Lane, C. J., et al. (2019) · Cell · doi:10.1016/j.cell.2019.05.004 · Cited by 1,182
New evidences on the altered gut microbiota in autism spectrum disorders
Strati, F., Cavalieri, D., Albanese, D., De Felice, C., Donati, C., Hayek, J., Jousson, O., Leoncini, S., Renzi, D., Calabrò, A., et al. (2017) · Microbiome · doi:10.1186/s40168-017-0242-1 · Cited by 1,040
Reduced incidence of Prevotella and other fermenters in intestinal microflora of autistic children
Kang, D.-W., Park, J. G., Ilhan, Z. E., Wallstrom, G., LaBaer, J., Adams, J. B., & Krajmalnik-Brown, R. (2013) · PLoS ONE · doi:10.1371/journal.pone.0068322 · Cited by 976
De Angelis, M., Piccolo, M., Vannini, L., Siragusa, S., De Giacomo, A., Serrazzanetti, D. I., Cristofori, F., Guerzoni, M. E., Gobbetti, M., & Francavilla, R. (2013) · PLoS ONE · doi:10.1371/journal.pone.0076993 · Cited by 887
The Role of Microbiota-Gut-Brain Axis in Neuropsychiatric and Neurological Disorders
Socała, K., Doboszewska, U., Szopa, A., Serefko, A., Włodarczyk, M., Zielińska, A., Poleszak, E., Fichna, J., & Wlaź, P. (2021) · Pharmacological Research · doi:10.1016/j.phrs.2021.105840 · Cited by 857
Gastrointestinal Symptoms in Autism Spectrum Disorder: A Meta-analysis
McElhanon, B. O., McCracken, C., Karpen, S., & Sharp, W. G. (2014) · Pediatrics · doi:10.1542/peds.2013-3995 · Cited by 831
The role of microbiome in central nervous system disorders
Wang, Y., & Kasper, L. H. (2014) · Brain Behavior and Immunity · doi:10.1016/j.bbi.2013.12.015 · Cited by 803
The Gut Microbiome and the Brain
Galland, L. (2014) · Journal of Medicinal Food · doi:10.1089/jmf.2014.7000 · Cited by 648
Gastrointestinal microbiota in children with autism in Slovakia
Tomova, A., Husarova, V., Lakatosova, S., Bakos, J., Vlkova, B., Babinska, K., & Ostatnikova, D. (2015) · Physiology & Behavior · doi:10.1016/j.physbeh.2014.10.033 · Cited by 632
Emerging Roles for the Gut Microbiome in Autism Spectrum Disorder
Vuong, H. E., & Hsiao, E. Y. (2017) · Biological Psychiatry · doi:10.1016/j.biopsych.2016.08.024 · Cited by 595
Role of the intestinal microbiome in health and disease: from correlation to causation
de Vos, W. M., & de Vos, E. A. (2012) · Nutrition Reviews · doi:10.1111/j.1753-4887.2012.00505.x · Cited by 440
Altered gut microbiota and activity in a murine model of autism spectrum disorders
de Theije, C. G. M., Wopereis, H., Ramadan, M., van Eijndthoven, T., Lambert, J., Knol, J., Garssen, J., Kraneveld, A. D., & Oozeer, R. (2014) · Brain Behavior and Immunity · doi:10.1016/j.bbi.2013.12.005 · Cited by 433
The microbiome: stress, health and disease
Moloney, R. D., Desbonnet, L., Clarke, G., Dinan, T. G., & Cryan, J. F. (2014) · Mammalian Genome · doi:10.1007/s00335-013-9488-5 · Cited by 430
MacFabe, D. F. (2012) · Microbial Ecology in Health and Disease · doi:10.3402/mehd.v23i0.19260 · Cited by 438
Wang, L., Christophersen, C. T., Sorich, M. J., Gerber, J. P., Angley, M. T., & Conlon, M. A. (2013) · Molecular Autism · doi:10.1186/2040-2392-4-42 · Cited by 418
Fecal Microbiota Transplantation in Neurological Disorders
Vendrik, K. E. W., Ooijevaar, R. E., de Jong, P. R. C., Laman, J. D., van Oosten, B. W., van Hilten, J. J., Ducarmon, Q. R., Keller, J. J., Kuijper, E. J., & Contarino, M. F. (2020) · Frontiers in Cellular and Infection Microbiology · doi:10.3389/fcimb.2020.00098 · Cited by 413
Wang, L., Christophersen, C. T., Sorich, M. J., Gerber, J. P., Angley, M. T., & Conlon, M. A. (2012) · Digestive Diseases and Sciences · doi:10.1007/s10620-012-2167-7 · Cited by 412
The Possible Role of the Microbiota-Gut-Brain-Axis in Autism Spectrum Disorder
Srikantha, P., & Mohajeri, M. H. (2019) · International Journal of Molecular Sciences · doi:10.3390/ijms20092115 · Cited by 400
The dormant blood microbiome in chronic, inflammatory diseases
Potgieter, M., Bester, J., Kell, D. B., & Pretorius, E. (2015) · FEMS Microbiology Reviews · doi:10.1093/femsre/fuv013 · Cited by 384
The Neuro-endocrinological Role of Microbial Glutamate and GABA Signaling
Mazzoli, R., & Pessione, E. (2016) · Frontiers in Microbiology · doi:10.3389/fmicb.2016.01934 · Cited by 383
Williams, B. L., Hornig, M., Parekh, T., & Lipkin, W. I. (2012) · mBio · doi:10.1128/mbio.00261-11 · Cited by 378
Self-citationDifferences in fecal microbial metabolites and microbiota of children with autism spectrum disorders
Kang, D.-W., Ilhan, Z. E., Isern, N. G., Hoyt, D. W., Howsmon, D. P., Shaffer, M., Lozupone, C. A., Hahn, J., Adams, J. B., & Krajmalnik-Brown, R. (2018) · Anaerobe · doi:10.1016/j.anaerobe.2017.12.007 · Cited by 381
Looft, T. P., Allen, H. K., Cantarel, B. L., Levine, U. Y., Bayles, D. O., Alt, D. P., Henrissat, B., & Stanton, T. B. (2014) · The ISME Journal · doi:10.1038/ismej.2014.12 · Cited by 378
Autism-related dietary preferences mediate autism-gut microbiome associations
Yap, C. X., Henders, A. K., Alvares, G. A., Wood, D., Krause, L., Tyson, G. W., Restuadi, R., Wallace, L. M., McLaren, T., Hansell, N. K., et al. (2021) · Cell · doi:10.1016/j.cell.2021.10.015 · Cited by 371
Liu, F., Li, J., Wu, F., Zheng, H., Peng, Q., & Zhou, H. (2019) · Translational Psychiatry · doi:10.1038/s41398-019-0389-6 · Cited by 336
Jašarević, E., Howerton, C. L., Howard, C. D., & Bale, T. L. (2015) · Endocrinology · doi:10.1210/en.2015-1177 · Cited by 329
Heiss, C. N., & Olofsson, L. E. (2019) · Journal of Neuroendocrinology · doi:10.1111/jne.12684 · Cited by 304
Xu, M., Xu, X., Li, J., & Li, F. (2019) · Frontiers in Psychiatry · doi:10.3389/fpsyt.2019.00473 · Cited by 309
Morris, G., Berk, M., Carvalho, A. F., Caso, J. R., Sanz, Y., Walder, K. R., & Maes, M. H. J. (2016) · Molecular Neurobiology · doi:10.1007/s12035-016-0004-2 · Cited by 318
Altered brain-gut axis in autism: comorbidity or causative mechanisms
Mayer, E. A., Padua, D., & Tillisch, K. (2014) · BioEssays · doi:10.1002/bies.201400075 · Cited by 304
Modulation of Gut Microbiota–Brain Axis by Probiotics, Prebiotics, and Diet
Liu, X., Cao, S., & Zhang, X. (2015) · Journal of Agricultural and Food Chemistry · doi:10.1021/acs.jafc.5b02404 · Cited by 304
Microbiota regulation of the mammalian gut-brain axis
Burokas, A., Moloney, R. D., Dinan, T. G., & Cryan, J. F. (2015) · Advances in applied microbiology · doi:10.1016/bs.aambs.2015.02.001 · Cited by 300
The microbiota–gut–brain axis in gastrointestinal disorders: stressed bugs, stressed brain or both?
Palma, G. D., Collins, S. M., Berčík, P., & Verdu, E. F. (2014) · The Journal of Physiology · doi:10.1113/jphysiol.2014.273995 · Cited by 309
Samsel, A., & Seneff, S. (2013) · Entropy · doi:10.3390/e15041416 · Cited by 307
Luna, R. A., Oezguen, N., Balderas, M., Venkatachalam, A., Runge, J. K., Versalovic, J., Veenstra-VanderWeele, J., Anderson, G. M., Savidge, T., & Williams, K. C. (2017) · Cellular and Molecular Gastroenterology and Hepatology · doi:10.1016/j.jcmgh.2016.11.008 · Cited by 295
Naviaux, J. C., Wang, L., Li, K., Bright, A., Alaynick, W. A., Williams, K. R., Powell, S. B., & Naviaux, R. K. (2015) · Molecular Autism · doi:10.1186/2040-2392-6-1 · Cited by 285
Cross talk: the microbiota and neurodevelopmental disorders
Kelly, J. R., Minuto, C., Cryan, J. F., Clarke, G., & Dinan, T. G. (2017) · Frontiers in Neuroscience · doi:10.3389/fnins.2017.00490 · Cited by 271
Kim, Y., & Shin, C. (2018) · Current Neuropharmacology · doi:10.2174/1570159x15666170915141036 · Cited by 281
Gut Microbiota Features in Young Children With Autism Spectrum Disorders
Coretti, L., Paparo, L., Riccio, M. P., Amato, F., Cuomo, M., Natale, A., Borrelli, L., Corrado, G., De Caro, C., Comegna, M., et al. (2018) · Frontiers in Microbiology · doi:10.3389/fmicb.2018.03146 · Cited by 266
Current Understanding of Gut Microbiota in Mood Disorders: An Update of Human Studies
Huang, T., Lai, J., Du, Y., Xu, Y., Ruan, L., & Hu, S. (2019) · Frontiers in Genetics · doi:10.3389/fgene.2019.00098 · Cited by 276
The Gut Microbiome: A New Frontier in Autism Research
Mulle, J. G., Sharp, W. G., & Cubells, J. F. (2013) · Current Psychiatry Reports · doi:10.1007/s11920-012-0337-0 · Cited by 262
Communication between gastrointestinal bacteria and the nervous system
Bravo, J. A., Julio-Pieper, M., Forsythe, P., Kunze, W., Dinan, T. G., Bienenstock, J., & Cryan, J. F. (2012) · Current Opinion in Pharmacology · doi:10.1016/j.coph.2012.09.010 · Cited by 261
MacFabe, D. F. (2015) · Microbial Ecology in Health and Disease · doi:10.3402/mehd.v26.28177 · Cited by 263
The gut microbiota–brain axis in neurological disorder
Ullah, H., Arbab, S., Tian, Y., Liu, C., Chen, Y., Li, Q., Khan, M. I. U., Hassan, I. U., & Li, K. (2023) · Frontiers in Neuroscience · doi:10.3389/fnins.2023.1225875 · Cited by 292
Cerebral folate receptor autoantibodies in autism spectrum disorder
Frye, R. E., Sequeira, J. M., Quadros, E. V., James, S. J., & Rossignol, D. A. (2012) · Molecular Psychiatry · doi:10.1038/mp.2011.175 · Cited by 257
Sanctuary, M. R., Kain, J. N., Chen, S. Y., Kalanetra, K., Lemay, D. G., Rose, D. R., Yang, H. T., Tancredi, D. J., German, J. B., Slupsky, C. M., et al. (2019) · PLOS ONE · doi:10.1371/journal.pone.0210064 · Cited by 255
Severance, E. G., Yolken, R. H., & Eaton, W. W. (2014) · Schizophrenia Research · doi:10.1016/j.schres.2014.06.027 · Cited by 260
The intestinal microbiome, probiotics and prebiotics in neurogastroenterology
Saulnier, D. M., Ringel, Y., Heyman, M. B., Foster, J. A., Bercik, P., Shulman, R. J., Versalovic, J., Verdu, E. F., Dinan, T. G., Hecht, G., et al. (2013) · Gut Microbes · doi:10.4161/gmic.22973 · Cited by 248
Immune Dysfunction and Autoimmunity as Pathological Mechanisms in Autism Spectrum Disorders
Hughes, H. K., Ko, E. M., Rose, D. R., & Ashwood, P. (2018) · Frontiers in Cellular Neuroscience · doi:10.3389/fncel.2018.00405 · Cited by 253
Gut microbiome composition and diversity are related to human personality traits
Johnson, K. V. ‐. (2019) · Human Microbiome Journal · doi:10.1016/j.humic.2019.100069 · Cited by 257
Frye, R. E., Melnyk, S., & MacFabe, D. F. (2013) · Translational Psychiatry · doi:10.1038/tp.2012.143 · Cited by 239
Metabolic features of the cell danger response
Naviaux, R. K. (2013) · Mitochondrion · doi:10.1016/j.mito.2013.08.006 · Cited by 243
The Microbiome in Psychology and Cognitive Neuroscience
Sarkar, A., Harty, S., Lehto, S. M., Moeller, A. H., Dinan, T. G., Dunbar, R., Cryan, J. F., & Burnet, P. W. J. (2018) · Trends in Cognitive Sciences · doi:10.1016/j.tics.2018.04.006 · Cited by 238
Gut microbiota and autism: key concepts and findings
Ding, H. T., Taur, Y., & Walkup, J. T. (2017) · Journal of Autism and Developmental Disorders · doi:10.1007/s10803-016-2960-9 · Cited by 232
Butyrate enhances mitochondrial function during oxidative stress in cell lines from boys with autism
Rose, S., Bennuri, S. C., Davis, J. E., Wynne, R., Slattery, J. C., Tippett, M., Delhey, L., Melnyk, S., Kahler, S. G., MacFabe, D. F., et al. (2018) · Translational Psychiatry · doi:10.1038/s41398-017-0089-z · Cited by 226
Clinical and Molecular Characteristics of Mitochondrial Dysfunction in Autism Spectrum Disorder
Rose, S., Niyazov, D. M., Rossignol, D. A., Goldenthal, M. J., Kahler, S. G., & Frye, R. E. (2018) · Molecular Diagnosis & Therapy · doi:10.1007/s40291-018-0352-x · Cited by 237
Microbiome disturbances and autism spectrum disorders
Rosenfeld, C. S. (2015) · Drug Metabolism and Disposition · doi:10.1124/dmd.115.063826 · Cited by 229
Rose, D. R., Yang, H., Serena, G., Sturgeon, C., Ma, B., Careaga, M., Hughes, H. K., Angkustsiri, K., Rose, M., Hertz-Picciotto, I., et al. (2018) · Brain, Behavior, and Immunity · doi:10.1016/j.bbi.2018.03.025 · Cited by 227
The Gut Microbiota and Dysbiosis in Autism Spectrum Disorders
Hughes, H. K., Rose, D., & Ashwood, P. (2018) · Current Neurology and Neuroscience Reports · doi:10.1007/s11910-018-0887-6 · Cited by 225
Herath, M., Hosie, S., Bornstein, J. C., Franks, A. E., & Hill‐Yardin, E. L. (2020) · Frontiers in Cellular and Infection Microbiology · doi:10.3389/fcimb.2020.00248 · Cited by 236
Autism, Gastrointestinal Symptoms and Modulation of Gut Microbiota by Nutritional Interventions
Ristori, M. V., Quagliariello, A., Reddel, S., Ianiro, G., Vicari, S., Gasbarrini, A., & Putignani, L. (2019) · Nutrients · doi:10.3390/nu11112812 · Cited by 214
Gastrointestinal issues in autism spectrum disorder
Hsiao, E. Y. (2014) · Harvard Review of Psychiatry · doi:10.1097/hrp.0000000000000029 · Cited by 209
Host microbiota modulates development of social preference in mice
Arentsen, T., Raith, H., Qian, Y., Forssberg, H., & Heijtz, R. D. (2015) · Microbial Ecology in Health and Disease · doi:10.3402/mehd.v26.29719 · Cited by 207
Altered Gut Microbiota in Chinese Children With Autism Spectrum Disorders
Ma, B., Liang, J., Dai, M., Wang, J., Luo, J., Zhang, Z., & Jing, J. (2019) · Frontiers in Cellular and Infection Microbiology · doi:10.3389/fcimb.2019.00040 · Cited by 202
Urinary p-cresol in autism spectrum disorder
Persico, A. M., & Napolioni, V. (2013) · Neurotoxicology and Teratology · doi:10.1016/j.ntt.2012.09.002 · Cited by 189
Tye, C., Runicles, A. K., Whitehouse, A. J. O., & Alvares, G. A. (2019) · Frontiers in Psychiatry · doi:10.3389/fpsyt.2018.00751 · Cited by 177
Atypical interoception as a common risk factor for psychopathology: A review
Brewer, R., Murphy, J., & Bird, G. (2021) · Neuroscience & Biobehavioral Reviews · doi:10.1016/j.neubiorev.2021.07.036 · Cited by 180
Intestinal Dysbiosis and Yeast Isolation in Stool of Subjects with Autism Spectrum Disorders
Iovene, M. R., Bombace, F., Maresca, R., Sapone, A., Iardino, P., Picardi, A., Marotta, R., Schiraldi, C., Siniscalco, D., Serra, N., et al. (2017) · Mycopathologia · doi:10.1007/s11046-016-0068-6 · Cited by 184
Coretti, L., Cristiano, C., Florio, E., Scala, G., Lama, A., Keller, S., Cuomo, M., Russo, R., Pero, R., Paciello, O., et al. (2017) · Scientific Reports · doi:10.1038/srep45356 · Cited by 175
Toscano, C. V., Carvalho, H. M., & Ferreira, J. P. (2018) · Perceptual and Motor Skills · doi:10.1177/0031512517743823 · Cited by 134
The Role of Gut Dysbiosis in the Pathophysiology of Neuropsychiatric Disorders
Anand, N., Gorantla, V. R., & Chidambaram, S. B. (2022) · Cells · doi:10.3390/cells12010054 · Cited by 194
Qiao, Y., Wu, M., Feng, Y., Zhou, Z., Chen, L., & Chen, F. (2018) · Scientific Reports · doi:10.1038/s41598-018-19982-y · Cited by 174
The contribution of the gut microbiome to neurodevelopment and neuropsychiatric disorders
Warner, B. B. (2018) · Pediatric Research · doi:10.1038/s41390-018-0191-9 · Cited by 171
Autism Spectrum Disorders: Etiology and Pathology
Sauer, A. K., Stanton, J. E., Hans, S., & Grabrucker, A. M. (2021) · Exon Publications eBooks · doi:10.36255/exonpublications.autismspectrumdisorders.2021.etiology · Cited by 195
Fiebiger, U., Bereswill, S., & Heimesaat, M. M. (2016) · European Journal of Microbiology and Immunology · doi:10.1556/1886.2016.00036 · Cited by 165
Can probiotics benefit children with autism spectrum disorders?
Navarro, F., Liu, Y., & Rhoads, J. M. (2016) · World Journal of Gastroenterology · doi:10.3748/wjg.v22.i46.10093 · Cited by 154
Moody microbes or fecal phrenology: what do we know about the microbiota-gut-brain axis?
Forsythe, P., Kunze, W., & Bienenstock, J. (2016) · BMC Medicine · doi:10.1186/s12916-016-0604-8 · Cited by 162
Gastrointestinal Issues and Autism Spectrum Disorder
Madra, M., Ringel, R., & Margolis, K. G. (2020) · Child and Adolescent Psychiatric Clinics of North America · doi:10.1016/j.chc.2020.02.005 · Cited by 159
Frye, R. E. (2018) · CNS Drugs · doi:10.1007/s40263-018-0556-y · Cited by 169
Gut microbiota changes in children with autism spectrum disorder: a systematic review
Ho, L. K. H., Tong, V. J. W., Syn, N., Nagarajan, N., Tham, E. H., Tay, S. K., Shorey, S., Tambyah, P. A., & Law, E. C. N. (2020) · Gut Pathogens · doi:10.1186/s13099-020-0346-1 · Cited by 149
Jašarević, E., Rodgers, A. B., & Bale, T. L. (2014) · Neurobiology of Stress · doi:10.1016/j.ynstr.2014.10.005 · Cited by 152
Inoue, R., Sakaue, Y., Sawai, C., Sawai, T., Ozeki, M., Romero-Pérez, G. A., & Tsukahara, T. (2016) · Bioscience, Biotechnology, and Biochemistry · doi:10.1080/09168451.2016.1222267 · Cited by 148
Microbiome and nutrition in autism spectrum disorder: Current knowledge and research needs
Berding, K., & Donovan, S. M. (2016) · Nutrition Reviews · doi:10.1093/nutrit/nuw048 · Cited by 146
Kong, X., Liu, J., Çetinbaş, M., Sadreyev, R. I., Koh, M., Huang, H. Y., Adeseye, A., He, P., Zhu, J., Russell, H., et al. (2019) · Nutrients · doi:10.3390/nu11092128 · Cited by 155
Zhang, W., Qu, W., Wang, H., & Yan, H. (2021) · Translational Psychiatry · doi:10.1038/s41398-021-01254-5 · Cited by 155
Influence of the microbiota-gut-brain axis on behavior and welfare in farm animals: A review
Kraïmi, N., Dawkins, M. S., Gebhardt‐Henrich, S. G., Velge, P., Rychlı́k, I., Volf, J., Créach, P., Smith, A. L., Colles, F. M., & Leterrier, C. (2019) · Physiology & Behavior · doi:10.1016/j.physbeh.2019.112658 · Cited by 161
Nutritional interventions for autism spectrum disorder
Karhu, E., Zukerman, R. J., Eshraghi, R. S., Mittal, J., Deth, R. C., Castejon, A. M., Trivedi, M. S., Mittal, R., & Eshraghi, A. A. (2019) · Nutrition Reviews · doi:10.1093/nutrit/nuz092 · Cited by 159
Connection between gut microbiome and brain development in preterm infants
Lu, J. N., & Claud, E. C. (2018) · Developmental Psychobiology · doi:10.1002/dev.21806 · Cited by 152
Frye, R. E., Rose, S., Slattery, J. M., & MacFabe, D. F. (2015) · Microbial Ecology in Health and Disease · doi:10.3402/mehd.v26.27458 · Cited by 145
Microbiota and neurologic diseases: potential effects of probiotics
Umbrello, G., & Esposito, S. (2016) · Journal of Translational Medicine · doi:10.1186/s12967-016-1058-7 · Cited by 147
Madore, C., Leyrolle, Q., Lacabanne, C., Benmamar-Badel, A., Joffre, C., Nadjar, A., & Layé, S. (2016) · Neural Plasticity · doi:10.1155/2016/3597209 · Cited by 141
Risk Factors for Unhealthy Weight Gain and Obesity among Children with Autism Spectrum Disorder
Dhaliwal, K. K., Orsso, C. E., Richard, C., Haqq, A. M., & Zwaigenbaum, L. (2019) · International Journal of Molecular Sciences · doi:10.3390/ijms20133285 · Cited by 157
Autism and nutrition: the role of the gut–brain axis
Sande, M. M. H. V. D., van Buul, V. J., & Brouns, F. J. P. H. (2014) · Nutrition Research Reviews · doi:10.1017/s0954422414000110 · Cited by 148
The role of microbes and autoimmunity in the pathogenesis of neuropsychiatric illness
Hornig, M. (2013) · Current Opinion in Rheumatology · doi:10.1097/bor.0b013e32836208de · Cited by 138
Self-citationAutism Spectrum Disorder as a Brain-Gut-Microbiome Axis Disorder
Saurman, V. E., Margolis, K. G., & Luna, R. A. (2020) · Digestive Diseases and Sciences · doi:10.1007/s10620-020-06133-5 · Cited by 144
Metadata
- Authors
- Williams, B. L., Hornig, M., Buie, T., Bauman, M. L., Cho Paik, M., Wick, I., Bennett, A., Jabado, O., Hirschberg, D. L., & Lipkin, W. I.
- Affiliations
- Columbia University (US)
- Massachusetts General Hospital (US)
- Harvard University (US)
- Corresponding author
- Lipkin, W. Ian
- Venue
- PLoS ONE
- Publisher
- Public Library of Science (PLoS)
- Published
- 2011-09-16
- Volume
- 6
- Issue
- 9
- Pages
- e24585
- ISSN
- 1932-6203 (ISSN-L)
- PMC
- PMC3174969
- OpenAlex
- W2005365566
- Cited by
- 492
- References
- 96
- Citations by year
- 2026: 10 · 2025: 34 · 2024: 25 · 2023: 31 · 2022: 41 · 2021: 46 · 2020: 38 · 2019: 52 · 2018: 45 · 2017: 21 · 2016: 31 · 2015: 37 · 2014: 32 · 2013: 28 · 2012: 19
- FWCI
- 10.51
- Type
- journal article
- Language
- en
- Open access
- gold
- doi.org
- Locations
- PLoS ONE (publishedVersion, cc-by)
- Europe PMC (PubMed Central) (publishedVersion, cc-by)
- PubMed Central (publishedVersion, cc-by)
- PubMed (publishedVersion)
- DOAJ (DOAJ: Directory of Open Access Journals) (submittedVersion, cc-by-sa)
- Figshare (submittedVersion, cc-by)
- Funders
- U.S. Department of Defense
- National Institutes of Health
- National Institute of Neurological Disorders and Stroke (NS 047537, U01NS047537)
- Topics
- Life Sciences › Biochemistry, Genetics and Molecular Biology › Molecular Biology › Gut microbiota and health
- Life Sciences › Neuroscience › Cognitive Neuroscience › Autism Spectrum Disorder Research
- Health Sciences › Medicine › Gastroenterology › Gastrointestinal motility and disorders
- Keywords
- autism spectrum disorder, gastrointestinal diseases, carbohydrate digestion, disaccharidases, hexose transporters, intestinal gene expression, CDX2, Firmicutes/Bacteroidetes ratio, Betaproteobacteria, Bacteroidetes, enterocytes
- MeSH terms
- Autistic Disorder, Biological Transport, Child, Preschool, Clostridium, Digestion, Female, Food Hypersensitivity, Gastrointestinal Diseases, Humans, Ileum, Infant, Intestinal Mucosa, Male, RNA, Bacterial, RNA, Messenger, RNA, Ribosomal, 16S, Time Factors, Comorbidity, Membrane Transport Proteins, Carbohydrate Metabolism, Metagenomics, Transcriptome
About these checks
Registry, retraction, Cites and statistics results are computed, not judged, with one exception: a printed reference that no index lists is read once by a model before it counts as a citation error. Claims are extracted by a model and kept only when their quote appears verbatim in the text; each cited source is then checked, with a model’s help, for whether it says what the claim relies on. Those verdicts can be wrong — read the claim’s quote and the cited source before relying on one.
Statistics and arithmetic are recomputed, not judged.
Confidence bands are shown only for fields calibrated on our annotated test set. None is calibrated yet, so no band is shown.
What counts as a claim ›How we measure confidence ›How we check this ›
Are you an author, or do you see a problem with this page? Request a review
