

The DOI matches its Crossref record; 55 of the 55 references it cites were found in a registry or an index.
Diversity of Bifidobacteria within the Infant Gut Microbiota
Open accessAbstract
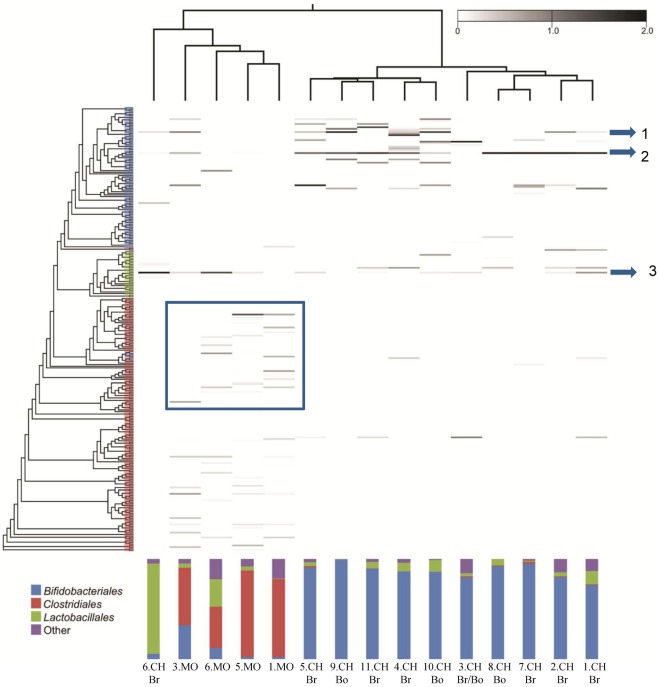
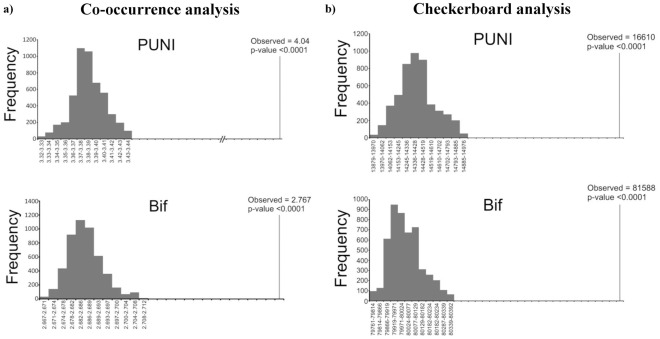
BACKGROUND: The human gastrointestinal tract (GIT) represents one of the most densely populated microbial ecosystems studied to date. Although this microbial consortium has been recognized to have a crucial impact on human health, its precise composition is still subject to intense investigation. Among the GIT microbiota, bifidobacteria represent an important commensal group, being among the first microbial colonizers of the gut. However, the prevalence and diversity of members of the genus Bifidobacterium in the infant intestinal microbiota has not yet been fully characterized, while some inconsistencies exist in literature regarding the abundance of this genus. METHODS/PRINCIPAL FINDINGS: In the current report, we assessed the complexity of the infant intestinal bifidobacterial population by analysis of pyrosequencing data of PCR amplicons derived from two hypervariable regions of the 16 S rRNA gene. Eleven faecal samples were collected from healthy infants of different geographical origins (Italy, Spain or Ireland), feeding type (breast milk or formula) and mode of delivery (vaginal or caesarean delivery), while in four cases, faecal samples of corresponding mothers were also analyzed. CONCLUSIONS: In contrast to several previously published culture-independent studies, our analysis revealed a predominance of bifidobacteria in the infant gut as well as a profile of co-occurrence of bifidobacterial species in the infant's intestine.
Overview
The claims and statistics of this paper haven’t been checked yet.
Run the check — free, no account needed. It reads the open-access text and checks the sources it cites.
Integrity signals
Registry
Cites
Statistics
Figures
Verification
Claims the paper makes
The claims and statistics of this paper haven’t been checked yet.
Run the check — free, no account needed. It reads the open-access text and checks the sources it cites.
Claims other papers make about this one
Each is checked against this paper’s own text: does it say what the citing paper says it does?
The source backs part of the claim, not all of it — or backs it for a different population, condition or comparison.
In the citing paper
“PS infants showed an earlier and more robust colonisation of infant-associated Bifidobacterium species, particularly B. breve and B. longum subsp. infantis, compared to NPS infants51–53.”
From Impact of early life antibiotic and probiotic treatment on gut microbiome and resistome of very-low-birth-weight preterm infants. (2025) · cites this paper as [52]
Experimental — accuracy not yet measured
Self-check
Percentages, sums and reported differences re-computed from the paper’s own numbers.
The self-check needs the paper’s full text.
Citations
Cites
Cytoscape: A software Environment for integrated models of biomolecular interaction networks
Shannon, P., Markiel, A., Ozier, O., Baliga, N. S., Wang, J. T., Ramage, D., Amin, N., Schwikowski, B., & Ideker, T. (2003) · Genome Research · doi:10.1101/gr.1239303 · Cited by 51,888
QIIME allows analysis of high-throughput community sequencing data
Caporaso, J. G., Kuczynski, J., Stombaugh, J., Bittinger, K., Bushman, F. D., Costello, E. K., Fierer, N., Peña, A. G., Goodrich, J. K., Gordon, J. I., et al. (2010) · Nature Methods · doi:10.1038/nmeth.f.303 · Cited by 34,887 · cited 3×
“All reads were classified to the lowest possible taxonomic rank using QIIME and a reference dataset from the Ribosomal Database Project [31].”
MethodSearch and clustering orders of magnitude faster than BLAST
Edgar, R. C. (2010) · Bioinformatics · doi:10.1093/bioinformatics/btq461 · Cited by 21,098
An obesity-associated gut microbiome with increased capacity for energy harvest
Turnbaugh, P. J., Ley, R. E., Mahowald, M. A., Magrini, V., Mardis, E. R., & Gordon, J. I. (2006) · Nature · doi:10.1038/nature05414 · Cited by 12,444 · cited 1×
“Furthermore, microbial dysbiosis has been linked to several functional gut disorders, such as inflammatory bowel disease [4,5], irritable bowel syndrome [6], stomach cancer [7], mucosa-associated lymphoid tissue lymphoma [8], obesity [9,10] and necrotizing enterocolitis [11].”
BackgroundDiversity of the Human Intestinal Microbial Flora
Eckburg, P. B., Bik, E. M., Bernstein, C. N., Purdom, E., Dethlefsen, L., Sargent, M., Gill, S. R., Nelson, K. E., & Relman, D. A. (2005) · Science · doi:10.1126/science.1110591 · Cited by 7,913 · cited 2×
“2b), confirming previously published data on the fecal microbiota of adult subjects [13].”
BackgroundResultDietary Modulation of the Human Colonic Microbiota: Introducing the Concept of Prebiotics
Gibson, G. R., & Roberfroid, M. B. (1995) · Journal of Nutrition · doi:10.1093/jn/125.6.1401 · Cited by 7,659 · cited 1×
“infantis) are genetically adapted to utilize hostproduced glycans like mucins and human milk oligosaccharides [50–53].”
BackgroundHost-Bacterial Mutualism in the Human Intestine
Bäckhed, F., Ley, R. E., Sonnenburg, J. L., Peterson, D. A., & Gordon, J. I. (2005) · Science · doi:10.1126/science.1104816 · Cited by 5,277 · cited 1×
“. Studies employing murine models have highlighted the critical role played by the gut microbiota in the development of a properly functioning gastrointestinal tract”
BackgroundThe Ribosomal Database Project: improved alignments and new tools for rRNA analysis
Cole, J. R., Wang, Q., Cardenas, E., Fish, J., Chai, B., Farris, R. J., Kulam-Syed-Mohideen, A. S., McGarrell, D. M., Marsh, T. L., Garrity, G. M., et al. (2008) · Nucleic Acids Research · doi:10.1093/nar/gkn879 · Cited by 4,873 · cited 1×
“All reads were classified to the lowest possible taxonomic rank using QIIME and a reference dataset from the Ribosomal Database Project [31].”
MethodSokol, H., Pigneur, B., Watterlot, L., Lakhdari, O., Bermúdez-Humarán, L. G., Gratadoux, J.-J., Blugeon, S., Bridonneau, C., Furet, J.-P., Corthier, G., et al. (2008) · Proceedings of the National Academy of Sciences · doi:10.1073/pnas.0804812105 · Cited by 4,413 · cited 1×
“Furthermore, microbial dysbiosis has been linked to several functional gut disorders, such as inflammatory bowel disease [4,5], irritable bowel syndrome [6], stomach cancer [7], mucosa-associated lymphoid tissue lymphoma [8], obesity [9,10] and necrotizing enterocolitis [11].”
BackgroundHelicobacter pylori Infection and the Risk of Gastric Carcinoma
Parsonnet, J., FRIEDMAN, G. D., Vandersteen, D. P., Chang, Y., Vogelman∥, J. H., Orentreich∥, N., & Sibley, R. K. (1991) · New England Journal of Medicine · doi:10.1056/nejm199110173251603 · Cited by 3,893 · cited 1×
“Furthermore, microbial dysbiosis has been linked to several functional gut disorders, such as inflammatory bowel disease [4,5], irritable bowel syndrome [6], stomach cancer [7], mucosa-associated lymphoid tissue lymphoma [8], obesity [9,10] and necrotizing enterocolitis [11].”
Background
Research works printed but not linked: 1
- JM Diamond, 1975, Assembly of species community., Ecology and Evolution of Communities, eds Cody ML, Diamond JM (Harvard Univ Press, Cambridge, MA),, 342–444
Cited by
Sorted by citations
Milani, C., Duranti, S., Bottacini, F., Casey, E., Turroni, F., Mahony, J., Belzer, C., Delgado Palacio, S., Arboleya Montes, S., Mancabelli, L., et al. (2017) · Microbiology and Molecular Biology Reviews · doi:10.1128/mmbr.00036-17 · Cited by 1,950
“Bifidobacterium has been considered to represent the dominant bacterial genus in the breastfed infant gut microbiota (41, 269), but recent studies have also shown a high occurrence of enterobacteria in such an infant population.”
BackgroundResultSelf-citationRivière, A., Selak, M., Lantin, D., Leroy, F., & Vuyst, L. D. (2016) · Frontiers in Microbiology · doi:10.3389/fmicb.2016.00979 · Cited by 1,810
“In general, B. bifidum and B. longum are the dominant species in infants, whereas B. adolescentis and B. longum dominate the adult gut microbiota (Turroni et al., 2012).”
BackgroundBacteria as vitamin suppliers to their host: A gut microbiota perspective
LeBlanc, J. G., Milani, C., de Giori, G. S., Sesma, F., van Sinderen, D., & Ventura, M. (2013) · Current Opinion in Biotechnology · doi:10.1016/j.copbio.2012.08.005 · Cited by 1,613
Self-citationMicrobiota-mediated colonization resistance against intestinal pathogens
Buffie, C. G., & Pamer, E. G. (2013) · Nature reviews. Immunology · doi:10.1038/nri3535 · Cited by 1,564
Probiotics, gut microbiota, and their influence on host health and disease
Sánchez, B., Delgado, S., Blanco‐Míguez, A., Lourenço, A., Gueimonde, M., & Margolles, A. (2017) · Molecular Nutrition & Food Research · doi:10.1002/mnfr.201600240 · Cited by 1,104
“Therefore, since bifidobacteria populations are abundant in breast-fed infants, compared with those fed with infant formula, it is generally believed that the presence of bifidobacteria in the microbiota of infants is an indicator of good health [93, 94].”
BackgroundSelf-citationLinks between diet, gut microbiota composition and gut metabolism
Flint, H. J., Duncan, S. H., Scott, K. P., & Louis, P. (2015) · Proceedings of the Nutrition Society · doi:10.1017/s0029665114001463 · Cited by 1,020
Jakobsson, H. E., Abrahamsson, T. R., Jenmalm, M. C., Harris, K., Quince, C., Jernberg, C., Björkstén, B., Engstrand, L., & Andersson, A. F. (2014) · Gut · doi:10.1136/gutjnl-2012-303249 · Cited by 1,011
Gut microbiota of healthy Canadian infants: profiles by mode of delivery and infant diet at 4 months
Azad, M. B., Konya, T., Maughan, H., Guttman, D. S., Field, C. J., Chari, R. S., Sears, M. R., Becker, A. B., Scott, J. A., & Kozyrskyj, A. L. (2013) · Canadian Medical Association Journal · doi:10.1503/cmaj.121189 · Cited by 989
“In the meantime, our subsample of 24 infants is relatively large among studies of infant gut microbiota, many of which have included fewer than 15 infants.(18,22,23,29)”
BackgroundThe Intestinal Microbiome in Early Life: Health and Disease
Arrieta, M.-C., Stiemsma, L. T., Amenyogbe, N., Brown, E. M., & Finlay, B. (2014) · Frontiers in Immunology · doi:10.3389/fimmu.2014.00427 · Cited by 1,024
Carbohydrate metabolism in Bifidobacteria
Pokusaeva, K., Fitzgerald, G. F., & van Sinderen, D. (2011) · Genes & Nutrition · doi:10.1007/s12263-010-0206-6 · Cited by 890
Linking Gut Microbiota and Inflammation to Obesity and Insulin Resistance
Saad, M. J. A., Santos, A., & Prada, P. O. (2016) · Physiology · doi:10.1152/physiol.00041.2015 · Cited by 836
Gut Bifidobacteria Populations in Human Health and Aging
Arboleya, S., Watkins, C., Stanton, C., & Ross, R. P. (2016) · Frontiers in Microbiology · doi:10.3389/fmicb.2016.01204 · Cited by 701
“The presence of different species of bifidobacteria changes with age, from childhood to old age.”
BackgroundIntestinal Dysbiosis Associated with Systemic Lupus Erythematosus
Hevia, A., Milani, C., López, P., Cuervo, A., Arboleya, S., Duranti, S., Turroni, F., González, S., Suárez, A., Gueimonde, M., et al. (2014) · mBio · doi:10.1128/mbio.01548-14 · Cited by 632
Self-citationFate, activity, and impact of ingested bacteria within the human gut microbiota
Derrien, M., & van Hylckama Vlieg, J. E. T. (2015) · Trends in Microbiology · doi:10.1016/j.tim.2015.03.002 · Cited by 605
Hiippala, K., Jouhten, H., Ronkainen, A., Hartikainen, A., Kainulainen, V., Jalanka, J., & Satokari, R. M. (2018) · Nutrients · doi:10.3390/nu10080988 · Cited by 619
“In humans, bifidobacteria are among the founder-species of the infant gut and frequently one of the major taxa or even the most abundant genus of infant gut microbiota [60].”
BackgroundDevelopment of intestinal microbiota in infants and its impact on health
Matamoros, S., Guen, C. G., Vacon, F. L., Potel, G., & de la Cochetière, M.-F. (2013) · Trends in Microbiology · doi:10.1016/j.tim.2012.12.001 · Cited by 565
Diet and the development of the human intestinal microbiome
Voreades, N., Kozil, A., & Weir, T. L. (2014) · Frontiers in Microbiology · doi:10.3389/fmicb.2014.00494 · Cited by 519
“Regardless of the macronutrient composition of the diet, individuals that lost a significant amount of body weight had a change in their ratio of Bacteroidetes to Firmicutes, driven by increases in the Bacteroidetes.”
BackgroundInfluentialBifidobacteria and Their Health-Promoting Effects
Hidalgo-Cantabrana, C., Delgado, S., Ruiz, L., Ruas-Madiedo, P., Sánchez, B., & Margolles, A. (2017) · Microbiology Spectrum · doi:10.1128/microbiolspec.bad-0010-2016 · Cited by 490
“…PCR amplicons of the 16S rRNA gene from infant stools from different geographical origins reinforced the notion of bi fi dobacteria as being a predominant component of the infant gut microbiota, which may undoubtedly in fl uence the development of the immune system and physiology of the infant (33).”
BackgroundThe function of our microbiota: who is out there and what do they do?
Ottman, N., Smidt, H., de Vos, W. M., & Belzer, C. (2012) · Frontiers in Cellular and Infection Microbiology · doi:10.3389/fcimb.2012.00104 · Cited by 523
Intestinal microbiota, diet and health
Power, S. E., O'Toole, P. W., Stanton, C., Ross, R. P., & Fitzgerald, G. F. (2014) · British Journal Of Nutrition · doi:10.1017/s0007114513002560 · Cited by 476
Self-citationAsnicar, F., Manara, S., Zolfo, M., Truong, D. T., Scholz, M., Armanini, F., Ferretti, P., Gorfer, V., Pedrotti, A., Tett, A., et al. (2017) · mSystems · doi:10.1128/msystems.00164-16 · Cited by 445
“a detrimental effect on the bifidobacterial population (38, 66, 67).”
BackgroundRole of the Gut Microbiome in the Pathogenesis of Obesity and Obesity-Related Metabolic Dysfunction
Bouter, K. E. C., van Raalte, D. H., Groen, A. K., & Nieuwdorp, M. (2017) · Gastroenterology · doi:10.1053/j.gastro.2016.12.048 · Cited by 443
“breast-fed infants compared to formula fed infants [8, 9] and that the introduction of solid food is another important determinant of microbial composition [10].”
BackgroundLawson, M. A., O’Neill, I. J., Kujawska, M., Javvadi, S. G., Wijeyesekera, A., Flegg, Z., Chalklen, L., & Hall, L. J. (2019) · The ISME Journal · doi:10.1038/s41396-019-0553-2 · Cited by 386
“In agreement with previous studies [22–24], we observed a high prevalence of Bifidobacterium in each infant faecal sample (mean=82.53±12.36%).”
InfluentialMadan, J. C., Koestler, D. C., Stanton, B. A., Davidson, L. E., Moulton, L. A., Housman, M. L., Moore, J. H., Guill, M. F., Morrison, H. G., Sogin, M. L., et al. (2012) · mBio · doi:10.1128/mbio.00251-12 · Cited by 361
“(44), which is being attributed to technical biases related to DNA extraction protocols or primers utilized.”
BackgroundHuman milk oligosaccharides: Shaping the infant gut microbiota and supporting health
Walsh, C., Lane, J. A., van Sinderen, D., & Hickey, R. M. (2020) · Journal of Functional Foods · doi:10.1016/j.jff.2020.104074 · Cited by 359
“…recognised as avid HMO consumers, B. bifidum and B. infantis are detected in low numbers in the faeces of breast-fed infants, while B. longum and B. breve are often found as the dominant species in infant stools (Turroni et al., 2012), even though they demonstrate limited HMO assimilation in vitro.”
Turroni, F., Ventura, M., Buttó, L. F., Duranti, S., O’Toole, P. W., Motherway, M. O., & van Sinderen, D. (2014) · Cellular and Molecular Life Sciences · doi:10.1007/s00018-013-1318-0 · Cited by 336
“The dominant phylum in the human adult microbiota is represented by Firmicutes, which in some individuals represents over 90 % of the total gut microbiota [12].”
BackgroundInfluentialSelf-citationDuranti, S., Lugli, G. A., Mancabelli, L., Armanini, F., Turroni, F., James, K., Ferretti, P., Gorfer, V., Ferrario, C., Milani, C., et al. (2017) · Microbiome · doi:10.1186/s40168-017-0282-6 · Cited by 327
Self-citationImpact of the gut microbiota on the development of obesity and type 2 diabetes mellitus
Moreno‐Indias, I., Cardona, F., Tinahones, F. J., & Queipo‐Ortuño, M. I. (2014) · Frontiers in Microbiology · doi:10.3389/fmicb.2014.00190 · Cited by 325
“Stool was collected at 6 and 12 months of life and it was found that the children who were 7 years old with a normal weight had a higher number of Bifidobacterium spp. and a smaller number of Staphylococcus aureus than the children who became overweight several years later.”
BackgroundMethodInfluentialThe Human Neonatal Gut Microbiome: A Brief Review
Gritz, E. C., & Bhandari, V. (2015) · Frontiers in Pediatrics · doi:10.3389/fped.2015.00017 · Cited by 323
“demonstrated Bifidobacteria species as a predominant component of the term infant gut microbiota, challenging the notion that the infant gut contains low numbers of Bifidobacterium (22).”
BackgroundAssessing the Fecal Microbiota: An Optimized Ion Torrent 16S rRNA Gene-Based Analysis Protocol
Milani, C., Hevia, A., Foroni, E., Duranti, S., Turroni, F., Lugli, G. A., Sánchez, B., Martín, R., Gueimonde, M., van Sinderen, D., et al. (2013) · PLoS ONE · doi:10.1371/journal.pone.0068739 · Cited by 314
“For this purpose two human fecal DNA samples were used, one retrieved from a three month infant stool sample, which based on previous published data was considered to possess a low level of complexity [18] and another one extracted from a mother’s fecal sample assumed to include a diverse composition of microbiota [18…”
Self-citationAzad, M. B., Konya, T., Maughan, H., Guttman, D. S., Field, C. J., Sears, M. R., Becker, A. B., Scott, J. A., Kozyrskyj, A. L., & CHILD Study Investigators (2013) · Allergy Asthma and Clinical Immunology · doi:10.1186/1710-1492-9-15 · Cited by 323
“The main limitation of this study is sample size; despite being relatively large among infant gut microbiota studies (many of which have comprised fewer than 15 infants [46-52]), we had insufficient power to detect differences according to type of pet or number of siblings.”
BackgroundBifidobacteria exhibit social behavior through carbohydrate resource sharing in the gut
Milani, C., Lugli, G. A., Duranti, S., Turroni, F., Mancabelli, L., Ferrario, C., Mangifesta, M., Hevia, A., Viappiani, A., Scholz, M., et al. (2015) · Scientific Reports · doi:10.1038/srep15782 · Cited by 284
Self-citationBiochemistry of complex glycan depolymerisation by the human gut microbiota
Ndeh, D. A., & Gilbert, H. J. (2018) · FEMS Microbiology Reviews · doi:10.1093/femsre/fuy002 · Cited by 289
Walker, A. W., Martin, J. C., Scott, P., Parkhill, J., Flint, H. J., & Scott, K. P. (2015) · Microbiome · doi:10.1186/s40168-015-0087-4 · Cited by 273
“infantis, in the infant microbiota [24].”
Engevik, M. A., Luk, B., Chang‐Graham, A. L., Hall, A., Herrmann, B. I., Ruan, W. H., Endres, B. T., Shi, Z., Garey, K. W., Hyser, J. M., et al. (2019) · mBio · doi:10.1128/mbio.01087-19 · Cited by 280
“B. dentium , similar to other Bifidobacterium strains, is a recognized member of the healthy infant and adult human gut microbiota, according to the Human Microbiome Project (86) and sequencing studies (39, 84, 85, 166).”
Metagenomic Analysis of Milk of Healthy and Mastitis-Suffering Women
Jiménez, E., de Andrés, J., Manrique, M., Pareja-Tobes, P., Tobes, R., Martínez-Blanch, J. F., Codoñer, F. M., Ramón, D., Fernández, L., & Rodríguez, J. M. (2015) · Journal of Human Lactation · doi:10.1177/0890334415585078 · Cited by 286
“In contrast, an assessment of the complexity of the infant intestinal bifidobacterial population by analysis of pyrosequencing data of PCR amplicons suggested a predominance of bifidobacteria in the infant gut as well as a profile of co-occurrence of bifidobacterial species in the infant intestine.(40) Mastitis is a c…”
ResultHow biological sex of the host shapes its gut microbiota
Valeri, F., & Endres, K. (2021) · Frontiers in Neuroendocrinology · doi:10.1016/j.yfrne.2021.100912 · Cited by 278
“Similar to Lactobacilli, the Bifidobacterial species residing in the infant’s gut are responsible for fermentation of oligosaccharides within the breast milk (Sela et al., 2008; Turroni et al., 2012) and for the ultimate production of short chain fatty acids (SCFAs) and other organic compounds which are beneficial for…”
BackgroundGlycan Utilization and Cross-Feeding Activities by Bifidobacteria
Turroni, F., Milani, C., Duranti, S., Mahony, J., van Sinderen, D., & Ventura, M. (2018) · Trends in Microbiology · doi:10.1016/j.tim.2017.10.001 · Cited by 263
Self-citationExploring Vertical Transmission of Bifidobacteria from Mother to Child
Milani, C., Mancabelli, L., Lugli, G. A., Duranti, S., Turroni, F., Ferrario, C., Mangifesta, M., Viappiani, A., Ferretti, P., Gorfer, V., et al. (2015) · Applied and Environmental Microbiology · doi:10.1128/aem.02037-15 · Cited by 259
“Furthermore, since we were interested in evaluating the compositions of bifidobacterial populations occurring in the guts of mother-child pairs, we included only mothers who were exclusively or in large part breastfeeding their newborns and babies that had been vaginally delivered, conditions that were previously show…”
InfluentialSelf-citationGenomic Encyclopedia of Type Strains of the Genus Bifidobacterium
Milani, C., Lugli, G. A., Duranti, S., Turroni, F., Bottacini, F., Mangifesta, M., Sánchez, B., Viappiani, A., Mancabelli, L., Taminiau, B., et al. (2014) · Applied and Environmental Microbiology · doi:10.1128/aem.02308-14 · Cited by 251
Self-citationCong, X. S., Xu, W., Janton, S., Henderson, W. A., Matson, A. P., McGrath, J. M., Maas, K. R., & Graf, J. (2016) · PLoS ONE · doi:10.1371/journal.pone.0152751 · Cited by 245
“Although the exact composition of a “normal” neonatal gut microbiome is still unknown, researchers have begun mapping the human GI microbiota using recently developed culture-independent, DNA-based genomic technologies [10].”
BackgroundTurroni, F., Serafini, F., Foroni, E., Duranti, S., Motherway, M. O., Taverniti, V., Mangifesta, M., Milani, C., Viappiani, A., Roversi, T., et al. (2013) · Proceedings of the National Academy of Sciences · doi:10.1073/pnas.1303897110 · Cited by 255
“FEMS Immunol Med Microbiol 51(3):535–546.”
InfluentialSelf-citationPamela Thomson, M., Medina, D. A., & Garrido, D. A. (2017) · Food Microbiology · doi:10.1016/j.fm.2017.09.001 · Cited by 246
“Other species are 161 present both in the infant and adult gut microbiome, such as B. bifidum, B. pseudocatenulatum and 162 Bifidobacterium longum subsp. longum (B. longum) (Avershina et al., 2013; Turroni et al., 2012).”
BackgroundMancabelli, L., Milani, C., Lugli, G. A., Turroni, F., Cocconi, D., van Sinderen, D., & Ventura, M. (2017) · FEMS Microbiology Ecology · doi:10.1093/femsec/fix153 · Cited by 247
“Nonetheless, the accuracy of the majority of published microbiota analyses is very much dependent on the applied methodology (Turroni et al. 2012; Milani et al. 2013).”
BackgroundSelf-citationEcological dynamics of the vaginal microbiome in relation to health and disease
Greenbaum, S., Greenbaum, G., Moran‐Gilad, J., & Weintraub, A. Y. (2018) · American Journal of Obstetrics and Gynecology · doi:10.1016/j.ajog.2018.11.1089 · Cited by 258
Malmuthuge, N., Griebel, P. J., & Guan, L. L. (2014) · Applied and Environmental Microbiology · doi:10.1128/aem.03864-13 · Cited by 238
“The gastrointestinal tracts (GIT) of newborns contain a less diverse microbiome than those of adults, and progressive colonization over time increases this diversity (1).”
BackgroundRuiz‐Moyano, S., Totten, S. M., Garrido, D. A., Smilowitz, J. T., German, J. B., Lebrilla, C. B., & Mills, D. A. (2013) · Applied and Environmental Microbiology · doi:10.1128/aem.01843-13 · Cited by 236
“most frequently detected in breast-fed infant feces (11, 14, 33).”
BackgroundNogacka, A. M., Salazar, N., Suárez, M., Milani, C., Arboleya, S., Sánchez, G. S., Fernández, N., Alaez, L., Hernández‐Barranco, A. M., Reyes‐Gavilán, C. G. D. L., et al. (2017) · Microbiome · doi:10.1186/s40168-017-0313-3 · Cited by 237
“After the initial colonization steps, the infant microbiota often appears dominated by Actinobacteria , frequently accompanied also by high levels of Proteobacteria [15 – 17].”
Self-citationTannock, G. W., Lawley, B., Munro, K., Pathmanathan, S. G., Zhou, S. J., Makrides, M., Gibson, R. A., Sullivan, T., Prosser, C. G., Lowry, D. J., et al. (2013) · Applied and Environmental Microbiology · doi:10.1128/aem.03910-12 · Cited by 233
“Differentiation of the two subspecies has not always been made in studies of bifidobacterial diversity (32).”
BackgroundGarrido, D., Dallas, D. C., & Mills, D. A. (2013) · Microbiology · doi:10.1099/mic.0.064113-0 · Cited by 228
Milani, C., Turroni, F., Duranti, S., Lugli, G. A., Mancabelli, L., Ferrario, C., van Sinderen, D., & Ventura, M. (2015) · Applied and Environmental Microbiology · doi:10.1128/aem.03500-15 · Cited by 229
“Furthermore, their relative abundance in the human gut microbiome has been substantially underestimated due to various technical issues (11, 15, 82, 83).”
BackgroundSelf-citationEpigenetic Matters: The Link between Early Nutrition, Microbiome, and Long-term Health Development
Indrio, F., Martini, S., Francavilla, R., Corvaglia, L., Cristofori, F., Mastrolia, S. A., Neu, J., Rautava, S., Spena, G. R., Raimondi, F., et al. (2017) · Frontiers in Pediatrics · doi:10.3389/fped.2017.00178 · Cited by 253
“Facultative anaerobic bacteria subsequently replace these taxa and consist in large relative abundances of Actinobacteria and Firmicutes (85).”
BackgroundInfluentialYi, D. Y., & Kim, S. (2021) · Nutrients · doi:10.3390/nu13093094 · Cited by 265
“The gut microbiome of infant feces usually has a high abundance of Bifidobacterium, especially in exclusively breastfed infants [63,64].”
BackgroundGut microbiota and malnutrition
Million, M., Diallo, A., & Raoult, D. (2016) · Microbial Pathogenesis · doi:10.1016/j.micpath.2016.02.003 · Cited by 227
Elison, E., Vigsnaes, L. K., Rindom Krogsgaard, L., Rasmussen, J., Sørensen, N., McConnell, B., Hennet, T., Sommer, M. O. A., & Bytzer, P. (2016) · British Journal of Nutrition · doi:10.1017/s0007114516003354 · Cited by 218
“In fact, diet is, together with genetics and environmental factors, one of the main contributors to the diversity of human intestinal microbiota((37)).”
Gioia, D. D., Aloisio, I., Mazzola, G., & Biavati, B. (2013) · Applied Microbiology and Biotechnology · doi:10.1007/s00253-013-5405-9 · Cited by 215
“Turroni et al. (2012) delineated that the low counts obtained by these investigations were most likely due to technical biases, in particular related to DNA extraction protocols and/or the PCR primers used.”
BackgroundTurroni, F., Milani, C., Duranti, S., Mancabelli, L., Mangifesta, M., Viappiani, A., Lugli, G. A., Ferrario, C., Gioiosa, L., Ferrarini, A., et al. (2016) · The ISME Journal · doi:10.1038/ismej.2015.236 · Cited by 210
Self-citationVlasova, A. N., Kandasamy, S., Chattha, K. S., Rajashekara, G., & Saif, L. J. (2016) · Veterinary Immunology and Immunopathology · doi:10.1016/j.vetimm.2016.01.003 · Cited by 198
“…(Actinobacteria) appear between days 2 and 5 after birth and reach a maximum of up to 99% of all bacteria within one week becoming the predominant bacterial component of the infant fecal microbiota (Kurokawa et al., 2007; Mitsuoka and Kaneuchi, 1977; Turroni et al., 2012; Yatsunenko et al., 2012).”
BackgroundBifidobacteria and the infant gut: an example of co-evolution and natural selection
Turroni, F., Milani, C., Duranti, S., Ferrario, C., Lugli, G. A., Mancabelli, L., van Sinderen, D., & Ventura, M. (2017) · Cellular and Molecular Life Sciences · doi:10.1007/s00018-017-2672-0 · Cited by 214
Self-citationHost–microbe interactions that facilitate gut colonization by commensal bifidobacteria
Ventura, M., Turroni, F., Motherway, M. O., MacSharry, J. A., & van Sinderen, D. (2012) · Trends in Microbiology · doi:10.1016/j.tim.2012.07.002 · Cited by 197
Self-citationGut microbiome and breast-feeding: Implications for early immune development
Davis, E. C., Dunne-Castagna, V. P., Sela, D. A., Hilliard, M. A., Lindberg, S. K., Mantis, N. J., Seppo, A., & Järvinen, K. M. (2022) · Journal of Allergy and Clinical Immunology · doi:10.1016/j.jaci.2022.07.014 · Cited by 245
Gastrointestinal function development and microbiota
Mauro, A. D., Neu, J., Riezzo, G., Raimondi, F., Martinelli, D., Francavilla, R., & Indrio, F. (2013) · The Italian Journal of Pediatrics/Italian journal of pediatrics · doi:10.1186/1824-7288-39-15 · Cited by 204
Egan, M., Motherway, M. O., Kilcoyne, M., Kane, M., Joshi, L., Ventura, M., & van Sinderen, D. (2014) · BMC Microbiology · doi:10.1186/s12866-014-0282-7 · Cited by 193
“breve strains have been identified in the adult human bifidobacterial population, although the relative abundance is lower than in infants [5,64].”
BackgroundInfluentialSelf-citationGarrido, D. A., Ruiz‐Moyano, S., Lemay, D. G., Sela, D. A., German, J. B., & Mills, D. A. (2015) · Scientific Reports · doi:10.1038/srep13517 · Cited by 189
Garrido, D. A., Ruiz‐Moyano, S., Kirmiz, N., Davis, J. C. C., Totten, S. M., Lemay, D. G., Ugalde, J. A., German, J. B., Lebrilla, C. B., & Mills, D. A. (2016) · Scientific Reports · doi:10.1038/srep35045 · Cited by 191
Priming for Life: Early Life Nutrition and the Microbiota-Gut-Brain Axis
Ratsika, A., Codagnone, M. G., O’Mahony, S. M., Stanton, C., & Cryan, J. F. (2021) · Nutrients · doi:10.3390/nu13020423 · Cited by 194
Min, B. H., Devi, S., Kwon, G.-H., Gupta, H., Jeong, J., Sharma, S. P., Won, S., Oh, K., Yoon, S. J., Park, H., et al. (2024) · Gut Microbes · doi:10.1080/19490976.2024.2307568 · Cited by 190
“47 The genus Bifidobacterium has a fructose-6-phosphate phos-phoketolase pathway used for carbohydrate fermentation.”
BackgroundLaforest‐Lapointe, I., & Arrieta, M. (2017) · Frontiers in Immunology · doi:10.3389/fimmu.2017.00788 · Cited by 195
“Bifidobacterium species and subspecies are dominant members of the infant gut microbiome (56) and are strong modulators of the immune response (57).”
BackgroundThe Impact of the Milk Glycobiome on the Neonate Gut Microbiota
Pacheco, A. R., Barile, D., Underwood, M. A., & Mills, D. A. (2014) · Annual Review of Animal Biosciences · doi:10.1146/annurev-animal-022114-111112 · Cited by 187
“It is well established now that bifidobacteria dominate the intestinal microbial population of infants (72, 74, 75), reaching∼75%of the gut microbial population (51).”
BackgroundBifidobacteria—Insight into clinical outcomes and mechanisms of its probiotic action
Sarkar, A., & Mandal, S. (2016) · Microbiological Research · doi:10.1016/j.micres.2016.07.001 · Cited by 190
“Bifidobacterial flora in neonatal gut is established within the first few days after delivery and constitutes upto almost 80% of the microfloral composition during infancy (Turroni et al. 2012).”
Diversity, ecology and intestinal function of bifidobacteria
Bottacini, F., Ventura, M., van Sinderen, D., & Motherway, M. O. (2014) · Microbial Cell Factories · doi:10.1186/1475-2859-13-s1-s4 · Cited by 184
“7%, respectively [105], while it was noted that these two Bifidobacterium species were apparently absent in a study that analysed the Bifidobacterium composition of the adult gut microbiota [106].”
BackgroundSelf-citationAbility of bifidobacteria to metabolize chitin-glucan and its impact on the gut microbiota
Alessandri, G., Milani, C., Duranti, S., Mancabelli, L., Ranjanoro, T., Modica, S., Carnevali, L., Statello, R., Bottacini, F., Turroni, F., et al. (2019) · Scientific Reports · doi:10.1038/s41598-019-42257-z · Cited by 183
Self-citationBojović, K., Ignjatović, Đ., Bajić, S. S., Milutinović, D. V., Tomić, M., Golić, N., & Tolinački, M. (2020) · Frontiers in Cellular and Infection Microbiology · doi:10.3389/fcimb.2020.00223 · Cited by 172
“It is important to emphasize that Bifidobacteria are among the first microbial colonizers of the gut immediately after birth (Turroni et al., 2012), a dominant bacterial genus in the infant gut microbiota (Harmsen et al.”
BackgroundDavis, E. C., Wang, M., & Donovan, S. M. (2017) · Gut Microbes · doi:10.1080/19490976.2016.1278104 · Cited by 169
Association between the gut microbiota and diet: Fetal life, early childhood, and further life
Kashtanova, D. A., Popenko, A., Ткачева, О. Н., Tyakht, A., Alexeev, D. G., & Boytsov, S. A. (2016) · Nutrition · doi:10.1016/j.nut.2015.12.037 · Cited by 176
The infant gut microbiome as a microbial organ influencing host well-being
Turroni, F., Milani, C., Duranti, S., Lugli, G. A., Bernasconi, S., Margollés, A., Pierro, F. D., van Sinderen, D., & Ventura, M. (2020) · The Italian Journal of Pediatrics/Italian journal of pediatrics · doi:10.1186/s13052-020-0781-0 · Cited by 176
“bifidum is among the first colonizers of the human gut, reaching high numbers in the infant gut, but also detected at very low levels in adults [11].”
BackgroundSelf-citationFeeding the microbiota: Transducer of nutrient signals for the host
Shanahan, F., van Sinderen, D., O’Toole, P. W., & Stanton, C. (2017) · Gut · doi:10.1136/gutjnl-2017-313872 · Cited by 157
Self-citationElucidating the gut microbiome of ulcerative colitis: bifidobacteria as novel microbial biomarkers
Duranti, S., Gaiani, F., Mancabelli, L., Milani, C., Grandi, A., Bolchi, A., Santoni, A., Lugli, G. A., Ferrario, C., Mangifesta, M., et al. (2016) · FEMS Microbiology Ecology · doi:10.1093/femsec/fiw191 · Cited by 159
Self-citationKaetzel, C. S. (2014) · Immunology Letters · doi:10.1016/j.imlet.2014.05.008 · Cited by 158
Correlation between lactoferrin and beneficial microbiota in breast milk and infant’s feces
Mastromarino, P., Capobianco, D., Campagna, G., Laforgia, N., Drimaco, P., Dileone, A., & Baldassarre, M. E. (2014) · BioMetals · doi:10.1007/s10534-014-9762-3 · Cited by 157
“1 %, respectively (Turroni et al. 2012).”
Yan, S., Yang, B. K., Zhao, J., Zhao, J., Stanton, C., Ross, R. P., Zhang, H., & Chen, W. (2019) · Food & Function · doi:10.1039/c9fo00014c · Cited by 157
Validating bifidobacterial species and subspecies identity in commercial probiotic products
Lewis, Z. T., Shani, G., Masarweh, C. F., Popovic, M., Frese, S. A., Sela, D. A., Underwood, M. A., & Mills, D. A. (2016) · Pediatric Research · doi:10.1038/pr.2015.244 · Cited by 154
“Bifidobacterium-containing products are often used in a NICU setting due to their status as generally recognized as safe (GRAS) microorganisms, their ubiquity in the gut of healthy breast-fed infants, and their observed health effects (17,18).”
BackgroundA Review of the Source and Function of Microbiota in Breast Milk
Stuebe, A. M., Seed, P. C., & LaTuga, M. S. (2014) · Seminars in Reproductive Medicine · doi:10.1055/s-0033-1361824 · Cited by 166
“14,20,21 In terms of viruses, human immunode fi ciency virus (HIV) in breast milk appears to be distinct based on phylogenetic classi fi cation from HIV found in the peripheral blood of infected mothers.”
BackgroundJames, K., Motherway, M. O., Bottacini, F., & van Sinderen, D. (2016) · Scientific Reports · doi:10.1038/srep38560 · Cited by 153
Metabolism of Sialic Acid by Bifidobacterium breve UCC2003
Egan, M., Motherway, M. O., Ventura, M., & van Sinderen, D. (2014) · Applied and Environmental Microbiology · doi:10.1128/aem.01114-14 · Cited by 151
“breve strains are numerically prevalent in the gut microbiota of healthy, breast-fed infants (16), although the ability of members of this bifidobacterial species to utilize human milk and hostderived carbohydrates is relatively unexplored (see below).”
BackgroundSelf-citationBomhof, M. R., Saha, D. C., Reid, D. T., Paul, H. A., & Reimer, R. A. (2013) · Obesity · doi:10.1002/oby.20632 · Cited by 150
“infantis and other bifidobacteria are some of the first organisms to colonize the gut after childbirth and are recognized as an important commensal group of bacteria (32).”
BackgroundDevelopment of Gut Microbiota in the First 1000 Days after Birth and Potential Interventions
Pantazi, A. C., Bălașa, A. L., Mihai, C. M., Chisnoiu, T., Lupu, V. V., Kassim, M. A. K., Mihai, L., Frecuș, C. E., Chirila, S. I., Lupu, A., et al. (2023) · Nutrients · doi:10.3390/nu15163647 · Cited by 166
Human Milk Microbiota and Oligosaccharides: A Glimpse into Benefits, Diversity, and Correlations
Moubareck, C. A. (2021) · Nutrients · doi:10.3390/nu13041123 · Cited by 155
“It is essential here to note the distinction between gut microbiota of breastfed and formula-fed infants: It is well known today that Bifidobacterium is the predominant intestinal genus in both feeding modes [151], with species variations.”
BackgroundAlessandri, G., van Sinderen, D., & Ventura, M. (2021) · Computational and Structural Biotechnology Journal · doi:10.1016/j.csbj.2021.03.006 · Cited by 152
“revealed the presence of putative novel members of the genus Bifidobacterium [36,41,67].”
BackgroundSelf-citationBifidobacterium bifidum: A Key Member of the Early Human Gut Microbiota
Turroni, F., Duranti, S., Milani, C., Lugli, G. A., van Sinderen, D., & Ventura, M. (2019) · Microorganisms · doi:10.3390/microorganisms7110544 · Cited by 140
“infantis, are more typically found in the fecal samples from breast-fed infants [7].”
BackgroundSelf-citationThe Microbiota of the Human Mammary Ecosystem
Fernández, L., Pannaraj, P. S., Rautava, S., & Rodríguez, J. M. (2020) · Frontiers in Cellular and Infection Microbiology · doi:10.3389/fcimb.2020.586667 · Cited by 149
Aloisio, I., Mazzola, G., Corvaglia, L., Tonti, G., Faldella, G., Biavati, B., & Gioia, D. D. (2014) · Applied Microbiology and Biotechnology · doi:10.1007/s00253-014-5712-9 · Cited by 146
“The diversity of bifidobacteria population in 11 newborn fecal samples has recently been investigated using pyrosequencing (Turroni et al. 2012).”
Gut Microbiota as a Target for Preventive and Therapeutic Intervention against Food Allergy
Aitoro, R., Paparo, L., Amoroso, A., Costanzo, M. D., Cosenza, L., Granata, V., Scala, C. D., Nocerino, R., Trinchese, G., Montella, M. O., et al. (2017) · Nutrients · doi:10.3390/nu9070672 · Cited by 138
The Interaction of the Gut Microbiota with the Mucus Barrier in Health and Disease in Human
Corfield, A. P. (2018) · Microorganisms · doi:10.3390/microorganisms6030078 · Cited by 140
“Among other bacterial species that have special relevance for the mucins is the anaerobe Bifidobacteria, which are abundant in early life, especially in breast fed infants [65,66].”
BackgroundRole of Bifidobacteria on Infant Health
Saturio, S., Nogacka, A. M., Alvarado-Jasso, G. M., Salazar, N., Reyes‐Gavilán, C. G. D. L., Gueimonde, M., & Arboleya, S. (2021) · Microorganisms · doi:10.3390/microorganisms9122415 · Cited by 148
“bifidum, are the most commonly found, although the Bifidobacterium species composition will be affected by different perinatal factors [32,40].”
BackgroundSelf-citationPaediatric oral biopharmaceutics: Key considerations and current challenges
Batchelor, H. K., Fotaki, N., & Klein, S. (2013) · Advanced Drug Delivery Reviews · doi:10.1016/j.addr.2013.10.006 · Cited by 141
Al–Sadi, R., Viszwapriya, D., Nighot, P. K., Guo, S., Nighot, M., Do, T., & Ma, T. Y. (2021) · International Journal of Molecular Sciences · doi:10.3390/ijms22158070 · Cited by 136
Comparative genomics of the Bifidobacterium brevetaxon
Bottacini, F., Motherway, M. O., Kuczynski, J., O’Connell, K. J., Serafini, F., Duranti, S., Milani, C., Turroni, F., Lugli, G. A., Zomer, A., et al. (2014) · BMC Genomics · doi:10.1186/1471-2164-15-170 · Cited by 130
“longum occurs immediately after birth, with a correlation being observed between strains present in mother and progeny, thus suggesting that such bifidobacteria are transmitted from mother to child during vaginal delivery and/or breast feeding [5,6].”
BackgroundSelf-citationExploring the role of the microbiota member Bifidobacterium in modulating immune-linked diseases
O’Neill, I. J., Schofield, Z., & Hall, L. J. (2017) · Emerging Topics in Life Sciences · doi:10.1042/etls20170058 · Cited by 131
Cionci, N. B., Baffoni, L., Gaggìa, F., & Gioia, D. D. (2018) · Nutrients · doi:10.3390/nu10111723 · Cited by 138
“Among the different species belonging to the Bifidobacterium genus, Bifidobacterium breve, is the dominant one in breast-fed newborns [53] and one of the most used in infants.”
Background
Metadata
- Authors
- Turroni, F., Peano, C., Pass, D. A., Foroni, E., Severgnini, M., Claesson, M. J., Kerr, C., Hourihane, J., Murray, D., Fuligni, F., Gueimonde, M., Margolles, A., De Bellis, G., O’Toole, P. W., van Sinderen, D., Marchesi, J. R., & Ventura, M.
- Affiliations
- University of Parma (IT)
- National Research Council (IT)
- Cardiff University (GB)
- University College Cork (IE)
- Consejo Superior de Investigaciones Científicas (ES)
- Corresponding author
- Ventura, Marco
- ORCID
- Venue
- PLoS ONE
- Publisher
- Public Library of Science (PLoS)
- Published
- 2012-05-11
- Volume
- 7
- Issue
- 5
- Pages
- e36957
- ISSN
- 1932-6203 (ISSN-L)
- PMC
- PMC3350489
- OpenAlex
- W2048550695
- Cited by
- 647
- References
- 54
- Citations by year
- 2026: 17 · 2025: 32 · 2024: 45 · 2023: 36 · 2022: 49 · 2021: 57 · 2020: 71 · 2019: 29 · 2018: 46 · 2017: 56 · 2016: 52 · 2015: 50 · 2014: 48 · 2013: 41 · 2012: 17
- FWCI
- 20.04
- Type
- journal article
- Language
- en
- Open access
- gold
- doi.org
- Locations
- PLoS ONE (publishedVersion, cc-by)
- Europe PMC (PubMed Central) (publishedVersion, cc-by)
- PubMed Central (publishedVersion, cc-by)
- PubMed (publishedVersion)
- ORCA Online Research @Cardiff (Cardiff University) (acceptedVersion)
- DIGITAL.CSIC (Spanish National Research Council (CSIC)) (submittedVersion)
- DOAJ (DOAJ: Directory of Open Access Journals) (submittedVersion, cc-by-sa)
- Figshare (submittedVersion, cc-by)
- Funders
- Royal Society
- Irish Research Council for Science, Engineering and Technology
- Science Foundation Ireland (02/CE/B124, 07/CE/B1368)
- Ministero dell’Istruzione, dell’Università e della Ricerca
- Natural Environment Research Council (NBAF010005)
- Topics
- Life Sciences › Biochemistry, Genetics and Molecular Biology › Molecular Biology › Gut microbiota and health
- Health Sciences › Nursing › Nutrition and Dietetics › Infant Nutrition and Health
- Life Sciences › Agricultural and Biological Sciences › Food Science › Probiotics and Fermented Foods
- Keywords
- Bifidobacterium, infant gut microbiota, bacterial diversity, 16S rRNA gene, fecal microbiota, breastfeeding, bottle feeding, mode of delivery, vaginal delivery, cesarean section, maternal microbiota, species co-occurrence, gut commensal bacteria
- MeSH terms
- Base Sequence, Bifidobacterium, Feces, Female, Genes, Bacterial, Humans, Infant, Phylogeny, Pregnancy, RNA, Bacterial, RNA, Ribosomal, 16S, Genetic Variation, DNA Primers, Gastrointestinal Tract, Metagenome
About these checks
Registry, retraction, Cites and statistics results are computed, not judged, with one exception: a printed reference that no index lists is read once by a model before it counts as a citation error. Claims are extracted by a model and kept only when their quote appears verbatim in the text; each cited source is then checked, with a model’s help, for whether it says what the claim relies on. Those verdicts can be wrong — read the claim’s quote and the cited source before relying on one.
Statistics and arithmetic are recomputed, not judged.
Confidence bands are shown only for fields calibrated on our annotated test set. None is calibrated yet, so no band is shown.
What counts as a claim ›How we measure confidence ›How we check this ›
Are you an author, or do you see a problem with this page? Request a review
