

The DOI matches its Crossref record; 30 of the 30 references it cites were found in a registry or an index.
MicroRNA Expression Levels Are Altered in the Cerebrospinal Fluid of Patients with Young-Onset Alzheimer’s Disease
Overview
The claims and statistics of this paper haven’t been checked yet.
Run the check — free, no account needed. It reads the open-access text and checks the sources it cites.
Integrity signals
Registry
Cites
Statistics
Figures
Verification
Claims the paper makes
The claims and statistics of this paper haven’t been checked yet.
Run the check — free, no account needed. It reads the open-access text and checks the sources it cites.
Claims other papers make about this one
Each is checked against this paper’s own text: does it say what the citing paper says it does?
The cited source says what the claim attributes to it.
In the citing paper
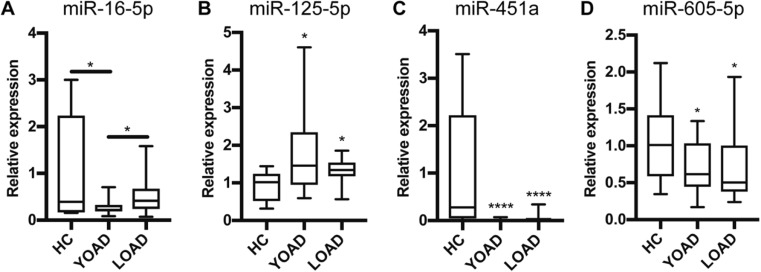
“A study about the miRNA expression of exosomes isolated from the CSF of EOAD patients found that miR-125b-5p was upregulated and miR-16-5p, miR-451a and miR-605-5p were downregulated compared to HC (see Table 4) [36].”
From MicroRNAs in Extracellular Vesicles of Alzheimer’s Disease (2023) · cites this paper as [36]
The cited source says what the claim attributes to it.
In the citing paper
“miR-125b-5p was upregulated in brains [36,48,50] and EVs from CSF of AD patients compared to HC [49,66].”
From MicroRNAs in Extracellular Vesicles of Alzheimer’s Disease (2023) · cites this paper as [36]
In the citing paper
“Indeed, it has been reported that miRNAs in exosomes are dysregulated in AD patients when compared to healthy people [36,41].”
From MicroRNAs in Extracellular Vesicles of Alzheimer’s Disease (2023) · cites this paper as [36]
In the citing paper
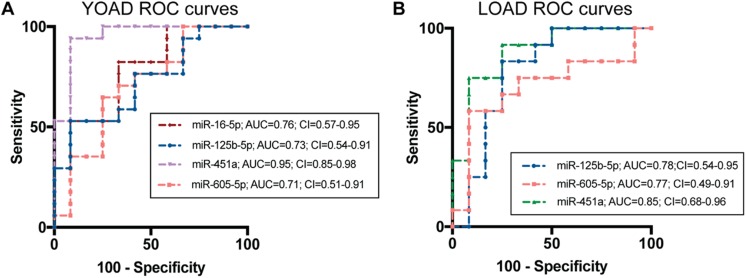
“According to ROC analysis, miR-451a has the best performance in distinguishing EOAD or LOAD from HC (AUC = 0.95 and 0.85, respectively, as listed in Table 5) [36].”
From MicroRNAs in Extracellular Vesicles of Alzheimer’s Disease (2023) · cites this paper as [36]
Self-check
Percentages, sums and reported differences re-computed from the paper’s own numbers.
The self-check needs the paper’s full text.
Citations
Cites
Subramanian, A., Tamayo, P., Mootha, V. K., Mukherjee, S., Ebert, B. L., Gillette, M. A., Paulovich, A., Pomeroy, S. L., Golub, T. R., Lander, E. S., et al. (2005) · Proceedings of the National Academy of Sciences · doi:10.1073/pnas.0506580102 · Cited by 53,625
The Montreal Cognitive Assessment, MoCA: a brief screening tool for mild cognitive impairment
Nasreddine, Z. S., Phillips, N. A., Bédirian, V., Charbonneau, S., Whitehead, V., Collin, I., Cummings, J. L., & Chertkow, H. (2005) · Journal of the American Geriatrics Society · doi:10.1111/j.1532-5415.2005.53221.x · Cited by 25,553
DeLong, E. R., DeLong, D. M., & Clarke-Pearson, D. L. (1988) · Biometrics · doi:10.2307/2531595 · Cited by 22,649
McKhann, G. M., Knopman, D. S., Chertkow, H., Hyman, B. T., Jack, C. R., Kawas, C. H., Klunk, W. E., Koroshetz, W. J., Manly, J. J., Mayeux, R., et al. (2011) · Alzheimer's & Dementia · doi:10.1016/j.jalz.2011.03.005 · Cited by 18,657
The MIQE guidelines: minimum information for publication of quantitative real-time PCR experiments
Bustin, S. A., Benes, V., Garson, J. A., Hellemans, J., Huggett, J., Kubista, M., Mueller, R., Nolan, T., Pfaffl, M. W., Shipley, G. L., et al. (2009) · Clinical Chemistry · doi:10.1373/clinchem.2008.112797 · Cited by 16,303 · cited 1×
“miRNA expression changes were calculated as relative expression to control using the Ct value from each qrt-PCR reaction by the 2 method [58, 59].”
pROC: an open-source package for R and S+ to analyze and compare ROC curves
Robin, X., Turck, N., Hainard, A., Tiberti, N., Lisacek, F., Sanchez, J.-C., & Müller, M. (2011) · BMC Bioinformatics · doi:10.1186/1471-2105-12-77 · Cited by 13,697
A simulation study of the number of events per variable in logistic regression analysis
Peduzzi, P., Concato, J., Kemper, E., Holford, T. R., & Feinstein, A. R. (1996) · Journal of Clinical Epidemiology · doi:10.1016/s0895-4356(96)00236-3 · Cited by 9,655
Sperling, R. A., Aisen, P. S., Beckett, L. A., Bennett, D. A., Craft, S., Fagan, A. M., Iwatsubo, T., Jack, C. R., Kaye, J., Montine, T. J., et al. (2011) · Alzheimer's & Dementia · doi:10.1016/j.jalz.2011.03.003 · Cited by 7,155
limma: Linear Models for Microarray Data
Smyth, G. K. (2005) · Statistics for Biology and Health · doi:10.1007/0-387-29362-0_23 · Cited by 5,796
Goate, A., Chartier-Harlin, M.-C., Mullan, M., Brown, J., Crawford, F., Fidani, L., Giuffra, L., Haynes, A., Irving, N., James, L., et al. (1991) · Nature · doi:10.1038/349704a0 · Cited by 4,659
The Alzheimer’s disease neuroimaging initiative (ADNI): MRI methods
Jack, C. R., Bernstein, M. A., Fox, N. C., Thompson, P., Alexander, G., Harvey, D., Borowski, B., Britson, P. J., L. Whitwell, J., Ward, C., et al. (2008) · Journal of Magnetic Resonance Imaging · doi:10.1002/jmri.21049 · Cited by 4,347
Walsh, D. M., Klyubin, I., Fadeeva, J. V., Cullen, W. K., Anwyl, R., Wolfe, M. S., Rowan, M. J., & Selkoe, D. J. (2002) · Nature · doi:10.1038/416535a · Cited by 4,291
Cloning of a gene bearing missense mutations in early-onset familial Alzheimer's disease
Sherrington, R., Rogaev, E. I., Liang, Y., Rogaeva, E. A., Levesque, G., Ikeda, M., Chi, H., Lin, C., Li, G., Holman, K., et al. (1995) · Nature · doi:10.1038/375754a0 · Cited by 4,051
Shankar, G. M., Li, S., Mehta, T. H., Garcia-Munoz, A., Shepardson, N. E., Smith, I., Brett, F. M., Farrell, M. A., Rowan, M. J., Lemere, C. A., et al. (2008) · Nature Medicine · doi:10.1038/nm1782 · Cited by 3,685
Identification of a unique TGF-β–dependent molecular and functional signature in microglia
Butovsky, O., Jedrychowski, M. P., Moore, C. S., Cialic, R., Lanser, A. J., Gabriely, G., Koeglsperger, T., Dake, B., Wu, P. M., Doykan, C. E., et al. (2014) · Nature Neuroscience · doi:10.1038/nn.3599 · Cited by 2,543
Enrichment Map: A Network-Based Method for Gene-Set Enrichment Visualization and Interpretation
Merico, D., Isserlin, R., Stueker, O., Emili, A., & Bader, G. D. (2010) · PLoS ONE · doi:10.1371/journal.pone.0013984 · Cited by 2,235
Rogaev, E. I., Sherrington, R., Rogaeva, E. A., Levesque, G., Ikeda, M., Liang, Y., Chi, H., Lin, C., Holman, K., Tsuda, T., et al. (1995) · Nature · doi:10.1038/376775a0 · Cited by 2,052
Towards a molecular understanding of microRNA-mediated gene silencing
Jonas, S., & Izaurralde, E. (2015) · Nature Reviews Genetics · doi:10.1038/nrg3965 · Cited by 1,872
Cogswell, J. P., Ward, J., Taylor, I. A., Waters, M., Shi, Y., Cannon, B., Kelnar, K., Kemppainen, J., Brown, D., Chen, C., et al. (2008) · Journal of Alzheimer s Disease · doi:10.3233/jad-2008-14103 · Cited by 943
Campion, D., Dumanchin, C., Hannequin, D., Dubois, B., Belliard, S., Puel, M., Thomas-Anterion, C., Michon, A., Martin, C., Charbonnier, F., et al. (1999) · The American Journal of Human Genetics · doi:10.1086/302553 · Cited by 785
Conserved epigenomic signals in mice and humans reveal immune basis of Alzheimer's disease
Gjoneska, E., Pfenning, A. R., Mathys, H., Quon, G., Kundaje, A., Tsai, L.-H., & Kellis, M. (2015) · Nature · doi:10.1038/nature14252 · Cited by 576
Neurons secrete miR-132-containing exosomes to regulate brain vascular integrity
Xu, B., Zhang, Y., Du, X.-F., Li, J., Zi, H.-X., Bu, J.-W., Yan, Y., Han, H., & Du, J.-L. (2017) · Cell Research · doi:10.1038/cr.2017.62 · Cited by 354
Yang, C.-C., Barrós-Loscertales, A., Pinazo, D., Ventura-Campos, N., Borchardt, V., Bustamante, J.-C., Rodríguez-Pujadas, A., Fuentes-Claramonte, P., Balaguer, R., Ávila, C., et al. (2016) · Neural Plasticity · doi:10.1155/2016/9504642 · Cited by 284
Jovičić, A., Roshan, R., Moisoi, N., Pradervand, S., Moser, R., Pillai, B., & Luthi-Carter, R. (2013) · The Journal of Neuroscience · doi:10.1523/jneurosci.0600-12.2013 · Cited by 251
Pei, J.-J., Braak, H., An, W.-L., Winblad, B., Cowburn, R. F., Iqbal, K., & Grundke-Iqbal, I. (2002) · Molecular Brain Research · doi:10.1016/s0169-328x(02)00488-6 · Cited by 247
MicroRNA Profiling of CSF Reveals Potential Biomarkers to Detect Alzheimer`s Disease
Denk, J., Boelmans, K., Siegismund, C., Lassner, D., Arlt, S., & Jahn, H. (2015) · PLOS ONE · doi:10.1371/journal.pone.0126423 · Cited by 236
Liu, C.-C., Tsai, C.-W., Deak, F., Rogers, J., Penuliar, M., Sung, Y. M., Maher, J. N., Fu, Y., Li, X., Xu, H., et al. (2014) · Neuron · doi:10.1016/j.neuron.2014.08.048 · Cited by 222
Circulating miRNAs as Potential Biomarkers in Alzheimer's Disease
Galimberti, D., Villa, C., Fenoglio, C., Serpente, M., Ghezzi, L., Cioffi, S. M. G., Arighi, A., Fumagalli, G., & Scarpini, E. (2014) · Journal of Alzheimer’s Disease · doi:10.3233/jad-140756 · Cited by 222
Wan, Y., Liu, Y., Wang, X., Wu, J., Liu, K., Zhou, J., Liu, L., & Zhang, C. (2015) · PLOS ONE · doi:10.1371/journal.pone.0121975 · Cited by 182
Neuronal exosomes reveal Alzheimer's disease biomarkers in Down syndrome
Hamlett, E. D., Goetzl, E. J., Ledreux, A., Vasilevko, V., Boger, H. A., LaRosa, A., Clark, D., Carroll, S. L., Carmona‐Iragui, M., Fortea, J., et al. (2017) · Alzheimer's & Dementia · doi:10.1016/j.jalz.2016.08.012 · Cited by 129
Research works printed but not linked: 96
- Janssen JC, Beck JA, Campbell TA, Dickinson A, Fox NC, Harvey RJ, Houlden H, Rossor MN et al (2003) Early onset familial Alzheimer’s disease: mutation frequency in 31 families. Neurology 60:235–239 · DOI
- Eriksson H, Fereshtehnejad S-M, Falahati F, Farahmand B, Religa D, Eriksdotter M (2014) Differences in routine clinical practice between early and late onset Alzheimer’s disease: data from the Swedish Dementia Registry (SveDem). J Alzheimers Dis 41:411–419 · DOI
- Frisoni GB (2005) Structural correlates of early and late onset Alzheimer’s disease: voxel based morphometric study. J Neurol Neurosurg Psychiatry 76:112–114. https://doi.org/10.1136/jnnp.2003.029876 · DOI
- Sakai M, Hanyu H, Kume K, Sato T, Hirao K, Kanetaka H, Abe S, Kanaya K et al (2013) Rate of progression of Alzheimer’s disease in younger versus older patients: a longitudinal single photon emission computed tomography study: effect of age on AD progression. Geriatr Gerontol Int 13:555–562. https://doi.org/10.1111/j.1447-0594.2012.00934.x · DOI
- Nochlin D, van Belle G, Bird TD, Sumi SM (1993) Comparison of the severity of neuropathologic changes in familial and sporadic Alzheimer’s disease. Alzheimer Dis Assoc Disord 7:212–222
- Koss E, Edland S, Fillenbaum G, Mohs R, Clark C, Galasko D, Morris JC (1996) Clinical and neuropsychological differences between patients with earlier and later onset of Alzheimer’s disease: a CERAD analysis, part XII. Neurology 46:136–141 · DOI · Paper page
- Seltzer B, Sherwin I (1983) A comparison of clinical features in early-and late-onset primary degenerative dementia: one entity or two? Arch Neurol 40:143–146 · DOI
- Jacobs D, Sano M, Marder K, Bell K, Bylsma F, Lafleche G, Albert M, Brandt J et al (1994) Age at onset of Alzheimer’s disease: relation to pattern of cognitive dysfunction and rate of decline. Neurology 44:1215–1220 · DOI · Paper page
- Katzman R (1988) Alzheimer’s disease as an age-dependent disorder. CIBA Found Symp 134:69–85
- Ortof E, Crystal HA (1989) Rate of progression of Alzheimer’s disease. J Am Geriatr Soc 37:511–514 · DOI
- Bowler JV, Munoz DG, Merskey H, Hachinski V (1998) Factors affecting the age of onset and rate of progression of Alzheimer’s disease. J Neurol Neurosurg Psychiatry 65:184–190 · DOI
- Blennow K, Dubois B, Fagan AM, Lewczuk P, de Leon MJ, Hampel H (2015) Clinical utility of cerebrospinal fluid biomarkers in the diagnosis of early Alzheimer’s disease. Alzheimers Dement 11:58–69. https://doi.org/10.1016/j.jalz.2014.02.004 · DOI
- Olsson B, Lautner R, Andreasson U, Öhrfelt A, Portelius E, Bjerke M, Hölttä M, Rosén C et al (2016) CSF and blood biomarkers for the diagnosis of Alzheimer’s disease: a systematic review and meta-analysis. Lancet Neurol 15:673–684 · DOI · Paper page
- Snider BJ, Fagan AM, Roe C, Shah AR, Grant EA, Xiong C, Morris JC, Holtzman DM (2009) Cerebrospinal fluid biomarkers and rate of cognitive decline in very mild dementia of the Alzheimer type. Arch Neurol 66:638–645 · DOI
- Koric L, Felician O, Guedj E, Hubert AM, Mancini J, Boucraut J, Ceccaldi M (2010) Could clinical profile influence CSF biomarkers in early-onset Alzheimer disease? Alzheimer Dis Assoc Disord 24:278–283. https://doi.org/10.1097/WAD.0b013e3181d712d9 · DOI
- Bouwman FH, Schoonenboom NSM, Verwey NA, van Elk EJ, Kok A, Blankenstein MA, Scheltens P, van der Flier WM (2009) CSF biomarker levels in early and late onset Alzheimer’s disease. Neurobiol Aging 30:1895–1901. https://doi.org/10.1016/j.neurobiolaging.2008.02.007 · DOI
- Eulalio A, Huntzinger E, Izaurralde E (2008) Getting to the root of miRNA-mediated gene silencing. Cell 132:9–14. https://doi.org/10.1016/j.cell.2007.12.024 · DOI
- Arroyo JD, Chevillet JR, Kroh EM, Ruf IK, Pritchard CC, Gibson DF, Mitchell PS, Bennett CF et al (2011) Argonaute2 complexes carry a population of circulating microRNAs independent of vesicles in human plasma. Proc Natl Acad Sci 108:5003–5008. https://doi.org/10.1073/pnas.1019055108 · DOI · Paper page
- Turchinovich A, Weiz L, Langheinz A, Burwinkel B (2011) Characterization of extracellular circulating microRNA. Nucleic Acids Res 39:7223–7233. https://doi.org/10.1093/nar/gkr254 · DOI · Paper page
- Vickers KC, Palmisano BT, Shoucri BM, Shamburek RD, Remaley AT (2011) MicroRNAs are transported in plasma and delivered to recipient cells by high-density lipoproteins. Nat Cell Biol 13:423–433. https://doi.org/10.1038/ncb2210 · DOI · Paper page
- Valadi H, Ekström K, Bossios A, Sjöstrand M, Lee JJ, Lötvall JO (2007) Exosome-mediated transfer of mRNAs and microRNAs is a novel mechanism of genetic exchange between cells. Nat Cell Biol 9:654–659. https://doi.org/10.1038/ncb1596 · DOI · Paper page
- Cheng L, Sharples RA, Scicluna BJ, Hill AF (2014) Exosomes provide a protective and enriched source of miRNA for biomarker profiling compared to intracellular and cell-free blood. J Extracell Vesicles 3:23743. https://doi.org/10.3402/jev.v3.23743 · DOI · Paper page
- Chevillet JR, Kang Q, Ruf IK, Briggs HA, Vojtech LN, Hughes SM, Cheng HH, Arroyo JD et al (2014) Quantitative and stoichiometric analysis of the microRNA content of exosomes. Proc Natl Acad Sci 111:14888–14893. https://doi.org/10.1073/pnas.1408301111 · DOI
- Yagi Y, Ohkubo T, Kawaji H, Machida A, Miyata H, Goda S, Roy S, Hayashizaki Y et al (2017) Next-generation sequencing-based small RNA profiling of cerebrospinal fluid exosomes. Neurosci Lett 636:48–57. https://doi.org/10.1016/j.neulet.2016.10.042 · DOI
- Lafourcade C, Ramírez JP, Luarte A, Fernández A, Wyneken U (2016) MIRNAS in astrocyte-derived exosomes as possible mediators of neuronal plasticity: supplementary issue: brain plasticity and repair. J Exp Neurosci 10s1:JEN.S39916. https://doi.org/10.4137/JEN.S39916 · DOI
- Xin H, Wang F, Li Y, Lu QE, Cheung WL, Zhang Y, Zhang ZG, Chopp M (2017) Secondary release of exosomes from astrocytes contributes to the increase in neural plasticity and improvement of functional recovery after stroke in rats treated with exosomes harvested from microRNA 133b-overexpressing multipotent mesenchymal stromal cells. Cell Transplant 26:243–257. https://doi.org/10.3727/096368916X693031 · DOI
- Rajendran L, Honsho M, Zahn TR, Keller P, Geiger KD, Verkade P, Simons K (2006) Alzheimer’s disease β-amyloid peptides are released in association with exosomes. Proc Natl Acad Sci 103:11172–11177 · DOI · Paper page
- Yuyama K, Sun H, Usuki S, Sakai S, Hanamatsu H, Mioka T, Kimura N, Okada M et al (2015) A potential function for neuronal exosomes: Sequestering intracerebral amyloid-β peptide. FEBS Lett 589:84–88. https://doi.org/10.1016/j.febslet.2014.11.027 · DOI
- Kumar S, Reddy PH (2016) Are circulating microRNAs peripheral biomarkers for Alzheimer’s disease? Biochim Biophys Acta (BBA) - Mol Basis Dis 1862:1617–1627. https://doi.org/10.1016/j.bbadis.2016.06.001 · DOI
- Kiko T, Nakagawa K, Tsuduki T, Furukawa K, Arai H, Miyazawa T (2014) MicroRNAs in plasma and cerebrospinal fluid as potential markers for Alzheimer’s disease. J Alzheimers Dis 39:253–259 · DOI · Paper page
- Riancho J, Vázquez-Higuera JL, Pozueta A, Lage C, Kazimierczak M, Bravo M, Calero M, Gonalezález A et al (2017) MicroRNA profile in patients with Alzheimer’s disease: analysis of miR-9-5p and miR-598 in raw and exosome enriched cerebrospinal fluid samples. J Alzheimers Dis 57:483–491. https://doi.org/10.3233/JAD-161179 · DOI · Paper page
- Müller M, Kuiperij HB, Claassen JA, Küsters B, Verbeek MM (2014) MicroRNAs in Alzheimer’s disease: differential expression in hippocampus and cell-free cerebrospinal fluid. Neurobiol Aging 35:152–158. https://doi.org/10.1016/j.neurobiolaging.2013.07.005 · DOI · Paper page
- Alexandrov PN, Dua P, Hill JM, Bhattacharjee S, Zhao Y, Lukiw WJ (2012) microRNA (miRNA) speciation in Alzheimer’s disease (AD) cerebrospinal fluid (CSF) and extracellular fluid (ECF). Int J Biochem Mol Biol 3:365–373
- Burgos K, Malenica I, Metpally R, Courtright A, Rakela B, Beach T, Shill H, Adler C et al (2014) Profiles of extracellular miRNA in cerebrospinal fluid and serum from patients with Alzheimer’s and Parkinson’s diseases correlate with disease status and features of pathology. PLoS One 9:e94839. https://doi.org/10.1371/journal.pone.0094839 · DOI · Paper page
- Gui Y, Liu H, Zhang L, Lv W, Hu X (2015) Altered microRNA profiles in cerebrospinal fluid exosome in Parkinson disease and Alzheimer disease. Oncotarget 6:37043–37053 · DOI · Paper page
- Sørensen SS, Nygaard A-B, Christensen T (2016) miRNA expression profiles in cerebrospinal fluid and blood of patients with Alzheimer’s disease and other types of dementia—an exploratory study. Transl Neurodegener 5:6. https://doi.org/10.1186/s40035-016-0053-5 · DOI
- Antonell A, Lladó A, Altirriba J, Botta-Orfila T, Balasa M, Fernández M, Ferrer I, Sánchez-Valle R et al (2013) A preliminary study of the whole-genome expression profile of sporadic and monogenic early-onset Alzheimer’s disease. Neurobiol Aging 34:1772–1778. https://doi.org/10.1016/j.neurobiolaging.2012.12.026 · DOI
- Hulstaert F, Blennow K, Ivanoiu A, Schoonderwaldt HC, Riemenschneider M, Deyn PPD, Bancher C, Cras P et al (1999) Improved discrimination of AD patients using beta-amyloid(1-42) and tau levels in CSF. Neurology 52:1555–1562 · DOI · Paper page
- Blennow K (2004) Cerebrospinal fluid protein biomarkers for Alzheimer’s disease. NeuroRx 1:213–225 · DOI
- Darvesh S, Leach L, Black SE, Kaplan E, Freedman M (2005) The Behavioural Neurology Assessment. Can J Neurol Sci J Can Sci Neurol 32:167–177. https://doi.org/10.1017/S0317167100003930 · DOI
- Vandesompele J, De Preter K, Pattyn F et al (2002) Accurate normalization of real-time quantitative RT-PCR data by geometric averaging of multiple internal control genes. Genome Biol 3:1 · DOI · Paper page
- Andersen CL, Jensen JL, Ørntoft TF (2004) Normalization of real-time quantitative reverse transcription-PCR data: a model-based variance estimation approach to identify genes suited for normalization, applied to bladder and colon cancer data sets. Cancer Res 64:5245–5250 · DOI · Paper page
- Wang W-X, Fardo DW, Jicha GA, Nelson PT (2017) A customized quantitative PCR microRNA panel provides a technically robust context for studying neurodegenerative disease biomarkers and indicates a high correlation between cerebrospinal fluid and choroid plexus microRNA expression. Mol Neurobiol 54:8191–8202. https://doi.org/10.1007/s12035-016-0316-2 · DOI
- Livak KJ, Schmittgen TD (2001) Analysis of relative gene expression data using real-time quantitative PCR and the 2−ΔΔCT method. Methods 25:402–408. https://doi.org/10.1006/meth.2001.1262 · DOI · Paper page
- Bewick V, Cheek L, Ball J (2004) Statistics review 13: receiver operating characteristic curves. Crit Care 8:508–512 · DOI
- Maindonald JH, Braun J (2010) Data analysis and graphics using R: an example-based approach, 3rd ed. Cambridge University Press, Cambridge; New York · DOI
- Carpenter J, Bithell J (2000) Bootstrap confidence intervals: when, which, what? A practical guide for medical statisticians. Stat Med 19:1141–1164 · DOI
- Agarwal V, Bell GW, Nam J-W, Bartel DP (2015) Predicting effective microRNA target sites in mammalian mRNAs. elife 4:e05005 · DOI · Paper page
- Thiem A, Duşa A (2013) QCA: a package for qualitative comparative analysis. R J 5 · DOI
- Benito-Martin A, Peinado H (2015) FunRich proteomics software analysis, let the fun begin! Proteomics 15:2555–2556. https://doi.org/10.1002/pmic.201500260 · DOI
- Gentleman RC, Carey VJ, Bates DM, Bolstad B, Dettling M, Dudoit S, Ellis B, Gautier L et al (2004) Bioconductor: open software development for computational biology and bioinformatics. Genome Biol 5:R80 · DOI
- Klaus B (2016) An end to end workflow for differential gene expression using Affymetrix microarrays. F1000Research 5 · DOI
- Gautier L, Cope L, Bolstad BM, Irizarry RA (2004) Affy—analysis of Affymetrix GeneChip data at the probe level. Bioinformatics 20:307–315. https://doi.org/10.1093/bioinformatics/btg405 · DOI
- Huang DW, Sherman BT, Lempicki RA (2008) Systematic and integrative analysis of large gene lists using DAVID bioinformatics resources. Nat Protoc 4:44–57. https://doi.org/10.1038/nprot.2008.211 · DOI · Paper page
- Botstein D, Cherry JM, Ashburner M et al (2000) Gene ontology: tool for the unification of biology. Nat Genet 25:25–29 · DOI · Paper page
- Shannon P, Markiel A, Ozier O, Baliga NS, Wang JT, Ramage D, Amin N, Schwikowski B et al (2003) Cytoscape: a software environment for integrated models of biomolecular interaction networks. Genome Res 13:2498–2504 · DOI · Paper page
- Merico D, Isserlin R, Bader GD (2011) Visualizing gene-set enrichment results using the Cytoscape plug-in enrichment map. In: Cagney G, Emili A (eds) Network biology. Humana Press, Totowa, NJ, pp. 257–277 · DOI
- Kucera M, Isserlin R, Arkhangorodsky A, Bader G (2016) AutoAnnotate: a Cytoscape app for summarizing networks with semantic annotations [version 1; referees: 2 approved]. F1000Research 5:1717. https://doi.org/10.12688/f1000research.9090.1 · DOI
- Oesper L, Merico D, Isserlin R, Bader GD (2011) WordCloud: a Cytoscape plugin to create a visual semantic summary of networks. Source Code Biol Med 6:7 · DOI
- Doraiswamy PM, Leon J, Cummings JL, Marin D, Neumann PJ (2002) Prevalence and impact of medical comorbidity in Alzheimer’s disease. J Gerontol A Biol Sci Med Sci 57:M173–M177 · DOI
- Haaksma ML, Vilela LR, Marengoni A, Calderón-Larrañaga A, Leoutsakos JMS, Olde Rikkert MGM, Melis RJF (2017) Comorbidity and progression of late onset Alzheimer’s disease: a systematic review. PLoS One 12:e0177044. https://doi.org/10.1371/journal.pone.0177044 · DOI
- Palop JJ, Mucke L (2010) Amyloid-β-induced neuronal dysfunction in Alzheimer’s disease: from synapses toward neural networks. Nat Neurosci 13:812–818. https://doi.org/10.1038/nn.2583 · DOI · Paper page
- Drewes G, Lichtenberg-Kraag B, Döring F et al (1992) Mitogen activated protein (MAP) kinase transforms tau protein into an Alzheimer-like state. EMBO J 11:2131 · DOI · Paper page
- Munoz L, Ammit AJ (2010) Targeting p38 MAPK pathway for the treatment of Alzheimer’s disease. Neuropharmacology 58:561–568. https://doi.org/10.1016/j.neuropharm.2009.11.010 · DOI
- Inestrosa NC, Varela-Nallar L (2014) Wnt signaling in the nervous system and in Alzheimer’s disease. J Mol Cell Biol 6:64–74. https://doi.org/10.1093/jmcb/mjt051 · DOI · Paper page
- Good PF, Alapat D, Hsu A, Chu C, Perl D, Wen X, Burstein DE, Kohtz DS (2004) A role for semaphorin 3A signaling in the degeneration of hippocampal neurons during Alzheimer’s disease. J Neurochem 91:716–736. https://doi.org/10.1111/j.1471-4159.2004.02766.x · DOI
- Lin L, Lesnick TG, Maraganore DM, Isacson O (2009) Axon guidance and synaptic maintenance: preclinical markers for neurodegenerative disease and therapeutics. Trends Neurosci 32:142–149. https://doi.org/10.1016/j.tins.2008.11.006 · DOI
- Emilsson L, Saetre P, Jazin E (2006) Alzheimer’s disease: mRNA expression profiles of multiple patients show alterations of genes involved with calcium signaling. Neurobiol Dis 21:618–625. https://doi.org/10.1016/j.nbd.2005.09.004 · DOI
- LaFerla FM (2002) Calcium dyshomeostasis and intracellular signalling in Alzheimer’s disease. Nat Rev Neurosci 3:862–872. https://doi.org/10.1038/nrn960 · DOI
- Riascos D, de Leon D, Baker-Nigh A, Nicholas A, Yukhananov R, Bu J, Wu CK, Geula C (2011) Age-related loss of calcium buffering and selective neuronal vulnerability in Alzheimer’s disease. Acta Neuropathol (Berl) 122:565–576. https://doi.org/10.1007/s00401-011-0865-4 · DOI
- Nelson O, Supnet C, Liu H, Bezprozvanny I (2010) Familial Alzheimer’s disease mutations in presenilins: effects on endoplasmic reticulum calcium homeostasis and correlation with clinical phenotypes. J Alzheimers Dis 21:781–793 · DOI
- Berridge MJ (2013) Dysregulation of neural calcium signaling in Alzheimer disease, bipolar disorder and schizophrenia. Prion 7:2–13 · DOI
- Blalock EM, Geddes JW, Chen KC, Porter NM, Markesbery WR, Landfield PW (2004) Incipient Alzheimer’s disease: microarray correlation analyses reveal major transcriptional and tumor suppressor responses. Proc Natl Acad Sci U S A 101:2173–2178 · DOI · Paper page
- Hardy J, Selkoe DJ (2002) The amyloid hypothesis of Alzheimer’s disease: progress and problems on the road to therapeutics. Science 297:353–356 · DOI · Paper page
- Durrenberger PF, Fernando FS, Kashefi SN, Bonnert TP, Seilhean D, Nait-Oumesmar B, Schmitt A, Gebicke-Haerter PJ et al (2015) Common mechanisms in neurodegeneration and neuroinflammation: a BrainNet Europe gene expression microarray study. J Neural Transm 122:1055–1068. https://doi.org/10.1007/s00702-014-1293-0 · DOI
- Wilczynska A, Bushell M (2015) The complexity of miRNA-mediated repression. Cell Death Differ 22:22–33 · DOI
- Banzhaf-Strathmann J, Benito E, May S, Arzberger T, Tahirovic S, Kretzschmar H, Fischer A, Edbauer D (2014) MicroRNA-125b induces tau hyperphosphorylation and cognitive deficits in Alzheimer’s disease. EMBO J 33:1667–1680. https://doi.org/10.15252/embj.201387576 · DOI · Paper page
- Lukiw WJ (2007) Micro-RNA speciation in fetal, adult and Alzheimer’s disease hippocampus. Neuroreport 18:297–300 · DOI · Paper page
- Lukiw WJ, Surjyadipta B, Dua P, Alexandrov PN (2012) Common micro RNAs (miRNAs) target complement factor H (CFH) regulation in Alzheimer’s disease (AD) and in age-related macular degeneration (AMD). Int J Biochem Mol Biol 3:105
- Zhao Y, Pogue A, Lukiw W (2015) MicroRNA (miRNA) signaling in the human CNS in sporadic Alzheimer’s disease (AD)-novel and unique pathological features. Int J Mol Sci 16:30105–30116. https://doi.org/10.3390/ijms161226223 · DOI
- Tan L, Yu J-T, Liu Q-Y, Tan MS, Zhang W, Hu N, Wang YL, Sun L et al (2014) Circulating miR-125b as a biomarker of Alzheimer’s disease. J Neurol Sci 336:52–56. https://doi.org/10.1016/j.jns.2013.10.002 · DOI
- Lusardi TA, Phillips JI, Wiedrick JT, Harrington CA, Lind B, Lapidus JA, Quinn JF, Saugstad JA (2016) MicroRNAs in human cerebrospinal fluid as biomarkers for Alzheimer’s disease. J Alzheimers Dis 55:1223–1233. https://doi.org/10.3233/JAD-160835 · DOI
- Villela D, Ramalho RF, Silva ART, Brentani H, Suemoto CK, Pasqualucci CA, Grinberg LT, Krepischi ACV et al (2016) Differential DNA methylation of microRNA genes in temporal cortex from Alzheimer’s disease individuals. Neural Plast 2016:1–10. https://doi.org/10.1155/2016/2584940 · DOI
- Cheng C, Li W, Zhang Z, Yoshimura S, Hao Q, Zhang C, Wang Z (2013) MicroRNA-144 is regulated by activator protein-1 (AP-1) and decreases expression of Alzheimer disease-related a disintegrin and metalloprotease 10 (ADAM10). J Biol Chem 288:13748–13761. https://doi.org/10.1074/jbc.M112.381392 · DOI
- Cheng L, Doecke JD, Sharples RA et al (2015) Prognostic serum miRNA biomarkers associated with Alzheimer’s disease shows concordance with neuropsychological and neuroimaging assessment. Mol Psychiatry 20:1188–1196 · DOI · Paper page
- Maciotta S, Meregalli M, Torrente Y (2013) The involvement of microRNAs in neurodegenerative diseases. Front Cell Neurosci 7. https://doi.org/10.3389/fncel.2013.00265 · DOI
- Bandres E, Bitarte N, Arias F, Agorreta J, Fortes P, Agirre X, Zarate R, Diaz-Gonzalez JA et al (2009) microRNA-451 regulates macrophage migration inhibitory factor production and proliferation of gastrointestinal cancer cells. Clin Cancer Res 15:2281–2290. https://doi.org/10.1158/1078-0432.CCR-08-1818 · DOI
- Schipper HM, Maes OC, Chertkow HM, Wang E (2007) MicroRNA expression in Alzheimer blood mononuclear cells. Gene Regul Syst Biol 1:263
- Xiao J, Lin H, Luo X, Luo X, Wang Z (2011) miR-605 joins p53 network to form a p53: miR-605: Mdm2 positive feedback loop in response to stress. EMBO J 30:524–532 · DOI · Paper page
- Chen L, Cao Y, Rong D, Wang Y, Cao Y (2017) MicroRNA-605 functions as a tumor suppressor by targeting INPP4B in melanoma. Oncol Rep 38:1276–1286. https://doi.org/10.3892/or.2017.5740 · DOI
- Raoof R, Jimenez-Mateos EM, Bauer S, Tackenberg B, Rosenow F, Lang J, Onugoren MD, Hamer H et al (2017) Cerebrospinal fluid microRNAs are potential biomarkers of temporal lobe epilepsy and status epilepticus. Sci Rep 7:3328. https://doi.org/10.1038/s41598-017-02969-6 · DOI · Paper page
- Helwa I, Cai J, Drewry MD, Zimmerman A, Dinkins MB, Khaled ML, Seremwe M, Dismuke WM et al (2017) A comparative study of serum exosome isolation using differential ultracentrifugation and three commercial reagents. PLoS One 12:e0170628. https://doi.org/10.1371/journal.pone.0170628 · DOI
- Xu R, Greening DW, Zhu H-J, Takahashi N, Simpson RJ (2016) Extracellular vesicle isolation and characterization: toward clinical application. J Clin Invest 126:1152–1162. https://doi.org/10.1172/JCI81129 · DOI
- Van Deun J, Mestdagh P, Sormunen R et al (2014) The impact of disparate isolation methods for extracellular vesicles on downstream RNA profiling. J Extracell Vesicles 3:24858. https://doi.org/10.3402/jev.v3.24858 · DOI
- Parsi S, Smith PY, Goupil C, Dorval V, Hébert SS (2015) Preclinical evaluation of miR-15/107 family members as multifactorial drug targets for Alzheimer’s disease. Mol Ther - Nucleic Acids 4:e256. https://doi.org/10.1038/mtna.2015.33 · DOI · Paper page
- Zhang B, Chen CF, Wang AH, Lin QF (2015) MiR-16 regulates cell death in Alzheimer’s disease by targeting amyloid precursor protein. Eur Rev Med Pharmacol Sci 19:4020–4027
Cited by
Sorted by citations
MicroRNAs in Extracellular Vesicles of Alzheimer’s Disease
Li, W., & Zheng, Y. (2023) · Cells · doi:10.3390/cells12101378 · Cited by 43
Segaran, R. C., Chan, L. Y., Wang, H., Sethi, G., & Tang, F. R. (2020) · Current Medicinal Chemistry · doi:10.2174/0929867327666200121122910 · Cited by 42
Unveiling the Complex Role of Exosomes in Alzheimer’s Disease
Sun, M., & Chen, Z. (2024) · Journal of Inflammation Research · doi:10.2147/jir.s466821 · Cited by 39
Monteiro-Reis, S., Carvalho-Maia, C., Bart, G., Vainio, S. J., Pedro, J., Silva, E. R., Sales, G., Henrique, R., & Jerónimo, C. (2021) · International Journal of Molecular Sciences · doi:10.3390/ijms22063267 · Cited by 21
Ghosh, S., & Ghosh, S. (2022) · Frontiers in Pharmacology · doi:10.3389/fphar.2022.878058 · Cited by 13
Metadata
- Authors
- McKeever, P. M., Schneider, R., Taghdiri, F., Weichert, A., Multani, N., Brown, R. A., Boxer, A. L., Karydas, A., Miller, B., Robertson, J., & Tartaglia, M. C.
- Venue
- Molecular Neurobiology
- Published
- 2018-03-30
- Volume
- 55
- Issue
- 12
- Pages
- 8826-8841
- ISSN
- 0893-7648
- 1559-1182
- PMC
- PMC6208843
- Cited by
- 166
- References
- 30
- Language
- en
About these checks
Registry, retraction, Cites and statistics results are computed, not judged, with one exception: a printed reference that no index lists is read once by a model before it counts as a citation error. Claims are extracted by a model and kept only when their quote appears verbatim in the text; each cited source is then checked, with a model’s help, for whether it says what the claim relies on. Those verdicts can be wrong — read the claim’s quote and the cited source before relying on one.
Statistics and arithmetic are recomputed, not judged.
Confidence bands are shown only for fields calibrated on our annotated test set. None is calibrated yet, so no band is shown.
What counts as a claim ›How we measure confidence ›How we check this ›
Are you an author, or do you see a problem with this page? Request a review
