

Decoding tumour phenotype by noninvasive imaging using a quantitative radiomics approach
Open accessThe DOI matches its Crossref record; 29 of the 29 references it cites were found in a registry or an index.
Abstract
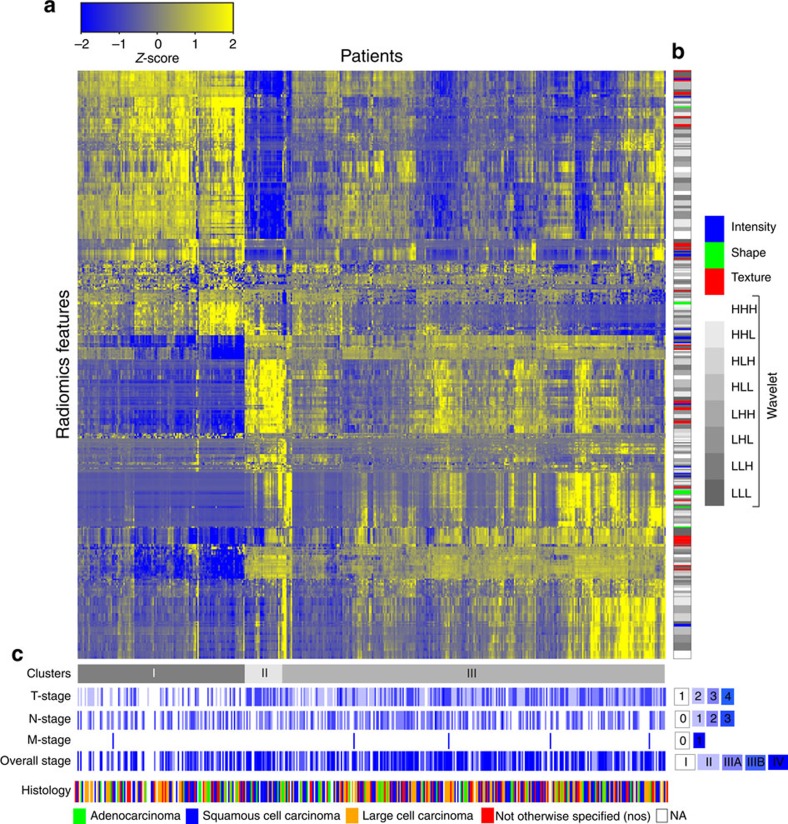
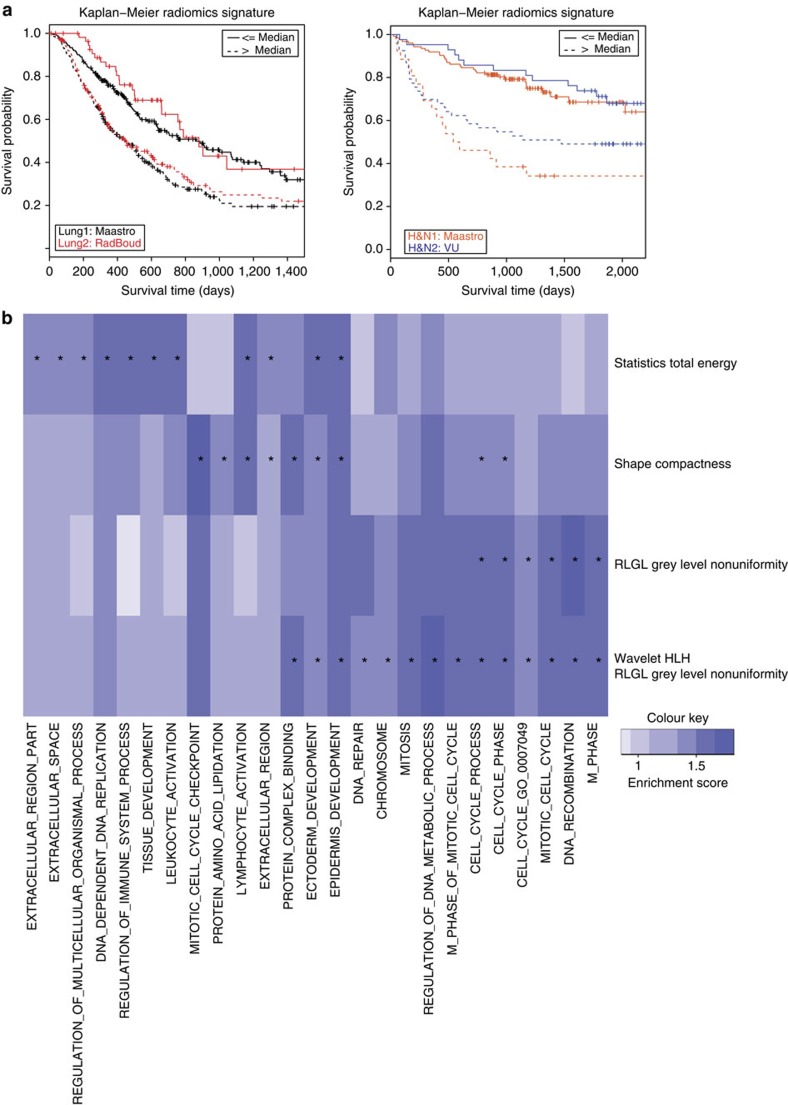
Human cancers exhibit strong phenotypic differences that can be visualized noninvasively by medical imaging. Radiomics refers to the comprehensive quantification of tumour phenotypes by applying a large number of quantitative image features. Here we present a radiomic analysis of 440 features quantifying tumour image intensity, shape and texture, which are extracted from computed tomography data of 1,019 patients with lung or head-and-neck cancer. We find that a large number of radiomic features have prognostic power in independent data sets of lung and head-and-neck cancer patients, many of which were not identified as significant before. Radiogenomics analysis reveals that a prognostic radiomic signature, capturing intratumour heterogeneity, is associated with underlying gene-expression patterns. These data suggest that radiomics identifies a general prognostic phenotype existing in both lung and head-and-neck cancer. This may have a clinical impact as imaging is routinely used in clinical practice, providing an unprecedented opportunity to improve decision-support in cancer treatment at low cost.
Overview
The claims and statistics of this paper haven’t been checked yet.
Free: it reads the open-access text and checks the first 5 claims that cite a source we can check. Create a free account to check every claim.
Integrity signals
Registry
Cites
Statistics
Figures


Verification
Claims the paper makes
The claims and statistics of this paper haven’t been checked yet.
Free: it reads the open-access text and checks the first 5 claims that cite a source we can check. Create a free account to check every claim.
Claims other papers make about this one
Each is checked against this paper’s own text: does it say what the citing paper says it does?
The source backs part of the claim, not all of it — or backs it for a different population, condition or comparison.
In the citing paper
“Notably, the signature was comprised of the top features from four classes (size, shape, texture, and wavelets) that were prioritized from a database of 442 features by using test-retest reproducibility and intersubject range.”
From Radiomics: Images Are More than Pictures, They Are Data (2016) · cites this paper as [47]
Experimental — accuracy not yet measuredThe source backs part of the claim, not all of it — or backs it for a different population, condition or comparison.
In the citing paper
“Many studies have shown that imaging features are significantly associated with patterns of gene expression and genetic mutations, demonstrating that radiogenomic analysis can identify different biological mechanisms by means of mathematical and computational devices, enabling the decoding of disease phenotypes by noninvasive methods(48,49).”
From Artificial intelligence, machine learning, computer-aided diagnosis, and radiomics: advances in imaging towards to precision medicine (2019) · cites this paper as [49]
Experimental — accuracy not yet measuredThe cited source says what the claim attributes to it.
In the citing paper
“A study by Aerts et al (47) showed that a radiomic signature could be used to predict outcome in completely independent cohorts of patients with lung cancer from two separate institutions.”
From Radiomics: Images Are More than Pictures, They Are Data (2016) · cites this paper as [47]
The cited source says what the claim attributes to it.
In the citing paper
“Further, this same signature could be applied to cohorts of patients with head and neck cancer with equivalent prognostic power.”
From Radiomics: Images Are More than Pictures, They Are Data (2016) · cites this paper as [47]
In the citing paper
“We used scans from 26 patients from the RIDER dataset19, routinely used for test–retest robustness analysis in tumour imaging19–21.”
From Foundation Model for Cancer Imaging Biomarkers (2024) · cites this paper as [20]
3 more claims about this paper
Create a free account to see every claim other papers make about this one.
Self-check
Percentages, sums and reported differences re-computed from the paper’s own numbers.
The self-check needs the paper’s full text.
Citations
Cites
Subramanian, A., Tamayo, P., Mootha, V. K., Mukherjee, S., Ebert, B. L., Gillette, M. A., Paulovich, A., Pomeroy, S. L., Golub, T. R., Lander, E. S., et al. (2005) · Proceedings of the National Academy of Sciences · doi:10.1073/pnas.0506580102 · Cited by 53,625
Harrell, F. E. (2001) · Springer Series in Statistics · doi:10.1007/978-1-4757-3462-1 · Cited by 9,195
Intratumor Heterogeneity and Branched Evolution Revealed by Multiregion Sequencing
Gerlinger, M., Rowan, A. J., Horswell, S., Larkin, J., Endesfelder, D., Gronroos, E., Martinez, P., Matthews, N., Stewart, A., Tarpey, P., et al. (2012) · New England Journal of Medicine · doi:10.1056/nejmoa1113205 · Cited by 7,774 · cited 2×
“It is known that multiple subclonal populations coexist within tumours, reflecting extensive intratumoral ‘somatic evolution’ 15,16 .”
BackgroundMolecular signatures database (MSigDB) 3.0
Liberzon, A., Subramanian, A., Pinchback, R., Thorvaldsdóttir, H., Tamayo, P., & Mesirov, J. P. (2011) · Bioinformatics · doi:10.1093/bioinformatics/btr260 · Cited by 7,111
Harrell (2015) · Springer Series in Statistics · doi:10.1007/978-3-319-19425-7 · Cited by 6,878
Radiomics: extracting more information from medical images using advanced feature analysis
Lambin, P., Rios-Velazquez, E., Leijenaar, R., Carvalho, S., van Stiphout, R. G. P. M., Granton, P., Zegers, C. M. L., Gillies, R., Boellard, R., Dekker, A., et al. (2012) · European Journal of Cancer · doi:10.1016/j.ejca.2011.11.036 · Cited by 6,084
Self-citationDistant metastasis occurs late during the genetic evolution of pancreatic cancer
Yachida, S., Jones, S., Bozic, I., Antal, T., Leary, R., Fu, B., Kamiyama, M., Hruban, R. H., Eshleman, J. R., Nowak, M. A., et al. (2010) · Nature · doi:10.1038/nature09515 · Cited by 2,502 · cited 1×
“It is known that multiple subclonal populations coexist within tumours, reflecting extensive intratumoral ‘somatic evolution’ 15,16 .”
BackgroundRadiomics: the process and the challenges
Kumar, V., Gu, Y., Basu, S., Berglund, A., Eschrich, S. A., Schabath, M. B., Forster, K., Aerts, H. J. W. L., Dekker, A., Fenstermacher, D., et al. (2012) · Magnetic Resonance Imaging · doi:10.1016/j.mri.2012.06.010 · Cited by 2,258
Self-citationTixier, F., Le Rest, C. C., Hatt, M., Albarghach, N., Pradier, O., Metges, J.-P., Corcos, L., & Visvikis, D. (2011) · Journal of Nuclear Medicine · doi:10.2967/jnumed.110.082404 · Cited by 696
Decoding global gene expression programs in liver cancer by noninvasive imaging
Segal, E., Sirlin, C. B., Ooi, C., Adler, A. S., Gollub, J., Chen, X., Chan, B. K., Matcuk, G. R., Barry, C. T., Chang, H. Y., et al. (2007) · Nature Biotechnology · doi:10.1038/nbt1306 · Cited by 629
Cited by
Items 201–300 of 1,023
Background, current role, and potential applications of radiogenomics
Pinker, K., Shitano, F., Sala, E., Do, R. K., Young, R. J., Wibmer, A. G., Hricak, H., Sutton, E. J., & Morris, E. A. (2018) · Journal of Magnetic Resonance Imaging · doi:10.1002/jmri.25870 · Cited by 184
Jiang, Y., Chen, C., Xie, J., Wang, W., Zha, X., Lv, W., Chen, H., Hu, Y., Li, T., Yu, J., et al. (2018) · EBioMedicine · doi:10.1016/j.ebiom.2018.09.007 · Cited by 184
“[1,4,8,13,37] Recent advances in radiomics have provided insights for personalized medicine in oncological practice associated with tumor detection, prognosis, subtype classification, lymph nodemetastasis, distant metastasis, and therapeutic response evaluation.”
BackgroundResultInfluentialRadiomics in Glioblastoma: Current Status and Challenges Facing Clinical Implementation
Chaddad, A., Kucharczyk, M. J., Daniel, P., Sabri, S., Jean-Claude, B. J., Niazi, T., & Abdulkarim, B. (2019) · Frontiers in Oncology · doi:10.3389/fonc.2019.00374 · Cited by 184
“quantifier function then evaluates the texture of the images, using the resultant value as an input for a classifier model (42, 55).”
BackgroundMethodPET/MRI Radiomics in Patients With Brain Metastases
Lohmann, P., Kocher, M., Ruge, M. I., Visser-Vandewalle, V., Shah, N. J., Fink, G. R., Langen, K.-J., & Galldiks, N. (2020) · Frontiers in Neurology · doi:10.3389/fneur.2020.00001 · Cited by 184
Bogowicz, M., Riesterer, O., Ikenberg, K., Stieb, S., Moch, H., Studer, G., Guckenberger, M., & Tanadini-Lang, S. (2017) · International Journal of Radiation Oncology*Biology*Physics · doi:10.1016/j.ijrobp.2017.06.002 · Cited by 179
Kirienko, M., Cozzi, L., Antunovic, L., Lozza, L., Fogliata, A., Voulaz, E., Rossi, A., Chiti, A., & Sollini, M. (2018) · European Journal of Nuclear Medicine and Molecular Imaging · doi:10.1007/s00259-017-3837-7 · Cited by 179
Hepatology Unit and Department of Infectious Diseases, N. H., Peng, J., Zhang, J., Hepatology Unit and Department of Infectious Diseases, N. H., Zhang, Q., Department of Hepatobiliary Surgery, N. H., Xu, Y., Department of Medical Imaging Center, N. H., Zhou, J., Department of Hepatobiliary Surgery, N. H., et al. (2018) · Diagnostic and Interventional Radiology · doi:10.5152/dir.2018.17467 · Cited by 179
“In this regard, radiomics—a quantitative high-throughput extraction method used for converting medical images into high-dimensional extractable data—has attracted increasing attention in recent years (17, 18).”
Liang, B., Yan, H., Tian, Y., Chen, X., Yan, L., Zhang, T., Zhou, Z., Wang, L., & Dai, J. (2019) · Frontiers in Oncology · doi:10.3389/fonc.2019.00269 · Cited by 178
Xie, C., Yang, P., Zhang, X., Xu, L., Wang, X., Li, X., Zhang, L., Xie, R., Yang, L., Jing, Z., et al. (2019) · eBioMedicine · doi:10.1016/j.ebiom.2019.05.023 · Cited by 176
“al suggested that radiomic signature, capturing intratumor heterogeneity, is associated with underlying gene-expression patterns in lung cancer [30].”
BackgroundWang, X., Zhao, X., Li, Q., Xia, W., Peng, Z., Zhang, R., Li, Q., Jian, J., Wang, W., Tang, Y., et al. (2019) · European Radiology · doi:10.1007/s00330-019-06084-0 · Cited by 177
Feng, Z., Li, H., Liu, Q., Duan, J., Zhou, W., Yu, X., Chen, Q., Liu, Z., Wang, W., & Rong, P. (2023) · Radiology · doi:10.1148/radiol.221291 · Cited by 175
Huang, P., Park, S., Yan, R., Lee, J., Chu, L. C., Lin, C. T., Hussien, A., Rathmell, J., Thomas, B., Chen, C., et al. (2018) · Radiology · doi:10.1148/radiol.2017162725 · Cited by 173
Lung cancer prediction using machine learning and advanced imaging techniques
Kadir, T., & Gleeson, F. (2018) · Translational Lung Cancer Research · doi:10.21037/tlcr.2018.05.15 · Cited by 171
“The term Radiomics refers to the automatic extraction of quantitative features from medical images (15,16) and has been the subject of a great deal of investigation with applications including automated lesion classification, response assessment and therapy planning.”
BackgroundWang, S., Liu, Z., Rong, Y., Zhou, B., Bai, Y., Wei, W., Wei, W., Wang, M., Guo, Y., & Tian, J. (2019) · Radiotherapy and Oncology · doi:10.1016/j.radonc.2018.10.019 · Cited by 172
Jia, T.-Y., Xiong, J.-F., Li, X.-Y., Yu, W., Xu, Z.-Y., Cai, X.-W., Ma, J.-C., Ren, Y.-C., Larsson, R., Zhang, J., et al. (2019) · European Radiology · doi:10.1007/s00330-019-06024-y · Cited by 172
Fave, X., Mackin, D., Yang, J., Zhang, J., Fried, D., Balter, P., Followill, D., Gomez, D., Kyle Jones, A., Stingo, F., et al. (2015) · Medical Physics · doi:10.1118/1.4934826 · Cited by 171
Wu, J., Aguilera, T., Shultz, D., Gudur, M., Rubin, D. L., Loo, B. W., Diehn, M., & Li, R. (2016) · Radiology · doi:10.1148/radiol.2016151829 · Cited by 171
Liang, C., Huang, Y., He, L., Chen, X., Ma, Z., Dong, D., Tian, J., Liang, C., & Liu, Z. (2016) · Oncotarget · doi:10.18632/oncotarget.8919 · Cited by 169
“Similarly, radiomics signature was demonstrated to have prognostic capacity for overall survival in patients with lung and head-and-neck cancer, with an AUC of 0.65 for lung cancer and 0.69 for head-and-neck cancer [27].”
InfluentialVisvikis, D., Cheze Le Rest, C., Jaouen, V., & Hatt, M. (2019) · European Journal of Nuclear Medicine and Molecular Imaging · doi:10.1007/s00259-019-04373-w · Cited by 168
Multiplexed imaging for diagnosis and therapy
Heinzmann, K., Carter, L. M., Lewis, J. S., & Aboagye, E. O. (2017) · Nature Biomedical Engineering · doi:10.1038/s41551-017-0131-8 · Cited by 168
A Deep Learning-Based Radiomics Model for Differentiating Benign and Malignant Renal Tumors
Zhou, L., Zhang, Z., Chen, Y.-C., Zhao, Z.-Y., Yin, X.-D., & Jiang, H.-B. (2019) · Translational Oncology · doi:10.1016/j.tranon.2018.10.012 · Cited by 168
Challenges and Promises of PET Radiomics
Cook, G. J. R., Azad, G., Owczarczyk, K., Siddique, M., & Goh, V. (2018) · International Journal of Radiation Oncology*Biology*Physics · doi:10.1016/j.ijrobp.2017.12.268 · Cited by 167
“Radiomics is a relatively new and evolving field in medical imaging in which a large number of features are extracted from medical images for analysis and interpretation using bioinformatic approaches (1-4).”
BackgroundRepeatability and reproducibility of MRI-based radiomic features in cervical cancer
Fiset, S., Welch, M. L., Weiss, J., Pintilie, M., Conway, J. L., Milosevic, M., Fyles, A., Traverso, A., Jaffray, D., Metser, U., et al. (2019) · Radiotherapy and Oncology · doi:10.1016/j.radonc.2019.03.001 · Cited by 167
Texture analysis of medical images for radiotherapy applications
Scalco, E., & Rizzo, G. (2017) · The British Journal of Radiology · doi:10.1259/bjr.20160642 · Cited by 165
CT radiomics nomogram for the preoperative prediction of lymph node metastasis in gastric cancer
Wang, Y., Liu, W., Yu, Y., Liu, J.-J., Xue, H.-D., Qi, Y.-F., Lei, J., Yu, J.-C., & Jin, Z.-Y. (2020) · European Radiology · doi:10.1007/s00330-019-06398-z · Cited by 165
“8 were considered stable and selected for model construction [33, 34].”
BackgroundQuantification of Heterogeneity as a Biomarker in Tumor Imaging: A Systematic Review
Alic, L., Niessen, W. J., & Veenland, J. F. (2014) · PLoS ONE · doi:10.1371/journal.pone.0110300 · Cited by 164
“Also for computed tomography (CT), image heterogeneity has prognostic value [6].”
BackgroundDifferentiation between glioblastoma, brain metastasis and subtypes using radiomics analysis
Artzi, M., Bressler, I., & Ben Bashat, D. (2019) · Journal of Magnetic Resonance Imaging · doi:10.1002/jmri.26643 · Cited by 165
“Radiomics analysis has been shown to improve diagnosis, prognosis, and decision-making in treatment of patients over standard radiological assessment.(22,31) We initially extracted 760 features, followed by feature selection and dimensional reduction in order to select a subset of features that are most likely to diff…”
MethodDecision Support Systems in Oncology
Walsh, S., de Jong, E. E. C., van Timmeren, J. E., Ibrahim, A., Compter, I., Peerlings, J., Sanduleanu, S., Refaee, T., Keek, S., Larue, R. T. H. M., et al. (2019) · JCO Clinical Cancer Informatics · doi:10.1200/cci.18.00001 · Cited by 160
Self-citationCT radiomics may predict the grade of pancreatic neuroendocrine tumors: a multicenter study
Gu, D., Hu, Y., Ding, H., Wei, J., Chen, K., Liu, H., Zeng, M., & Tian, J. (2019) · European Radiology · doi:10.1007/s00330-019-06176-x · Cited by 164
Zhu, Y., Li, H., Guo, W., Drukker, K., Lan, L., Giger, M. L., & Ji, Y. (2015) · Scientific Reports · doi:10.1038/srep17787 · Cited by 165
“Among the many novel findings, we discovered highly specific associations of radiogenomic features, which are potentially useful for (1) the imaging based diagnosis that can inform the genetic progress of tumor and (2) the discovery of genetic mechanisms that regulate the development of tumor phenotype.”
BackgroundWei, L., Niraula, D., Gates, E. D. H., Fu, J., Luo, Y., Nyflot, M. J., Bowen, S. R., El Naqa, I. M., & Cui, S. (2023) · The British Journal of Radiology · doi:10.1259/bjr.20230211 · Cited by 162
Fan, L., Fang, M., Li, Z., Tu, W., Wang, S., Chen, W., Tian, J., Dong, D., & Liu, S. (2019) · European Radiology · doi:10.1007/s00330-018-5530-z · Cited by 162
A review of original articles published in the emerging field of radiomics
Song, J., Yin, Y., Wang, H., Chang, Z., Liu, Z., & Cui, L. (2020) · European Journal of Radiology · doi:10.1016/j.ejrad.2020.108991 · Cited by 162
Zhang, Z., Yang, J., Ho, A., Jiang, W., Logan, J., Wang, X., Brown, P. D., McGovern, S. L., Guha-Thakurta, N., Ferguson, S. D., et al. (2018) · European Radiology · doi:10.1007/s00330-017-5154-8 · Cited by 160
Yip, S. S. F., Kim, J., Coroller, T. P., Parmar, C., Velazquez, E. R., Huynh, E., Mak, R. H., & Aerts, H. J. W. L. (2017) · Journal of Nuclear Medicine · doi:10.2967/jnumed.116.181826 · Cited by 161
“In total, 68 radiomic features were extracted from the PET images, including 7 shape features (29), 13 histogram-based features (29), and 48 texture features.”
BackgroundMethodSelf-citationData Analysis Strategies in Medical Imaging
Parmar, C., Barry, J. D., Hosny, A., Quackenbush, J., & Aerts, H. J. W. L. (2018) · Clinical Cancer Research · doi:10.1158/1078-0432.ccr-18-0385 · Cited by 161
“Similarly, it has been demonstrated that different radiomic features based on the shape, texture, and regional heterogeneity of the diseased tissues are associated with several clinical endpoints in oncology (4, 10, 11, 13, 25 – 32) and in other domains such as cardiology (14).”
BackgroundSelf-citationHarmonization strategies for multicenter radiomics investigations
Da-Ano, R., Visvikis, D., & Hatt, M. (2020) · Physics in Medicine & Biology · doi:10.1088/1361-6560/aba798 · Cited by 161
“Finding intrinsic dependencies of radiomic features on number of voxels is exemplified by the fact that some of these features have been suggested as potential imaging biomarkers in recent studies (Cook et al 2013), (Yu et al 2009, Aerts et al 2014, Li et al 2017a).”
BackgroundResultPredictive radiogenomics modeling of EGFR mutation status in lung cancer
Gevaert, O., Echegaray, S., Khuong, A., Hoang, C. D., Shrager, J. B., Jensen, K. C., Berry, G. J., Guo, H. H., Lau, C., Plevritis, S. K., et al. (2017) · Scientific Reports · doi:10.1038/srep41674 · Cited by 160
Desseroit, M.-C., Tixier, F., Weber, W. A., Siegel, B. A., Cheze Le Rest, C., Visvikis, D., & Hatt, M. (2017) · Journal of Nuclear Medicine · doi:10.2967/jnumed.116.180919 · Cited by 160
“3D shape descriptors were included, such as sphericity, irregularity or major axis (4,28) .”
Radiomic features analysis in computed tomography images of lung nodule classification
Chen, C.-H., Chang, C.-K., Tu, C.-Y., Liao, W.-C., Wu, B.-R., Chou, K.-T., Chiou, Y.-R., Yang, S.-N., Zhang, G., & Huang, T.-C. (2018) · PLOS ONE · doi:10.1371/journal.pone.0192002 · Cited by 160
Distributed learning on 20 000+ lung cancer patients – The Personal Health Train
Deist, T. M., Dankers, F. J. W. M., Ojha, P., Scott Marshall, M., Janssen, T., Faivre-Finn, C., Masciocchi, C., Valentini, V., Wang, J., Chen, J., et al. (2020) · Radiotherapy and Oncology · doi:10.1016/j.radonc.2019.11.019 · Cited by 160
“, screening, radiomics [22]) and treatment sources (e.”
BackgroundSelf-citationKim, M., Jung, S. Y., Park, J. E., Jo, Y., Park, S. Y., Nam, S. J., Kim, J. H., & Kim, H. S. (2019) · European Radiology · doi:10.1007/s00330-019-06548-3 · Cited by 175
Assessing Agreement between Radiomic Features Computed for Multiple CT Imaging Settings
Lu, L., Ehmke, R. C., Schwartz, L. H., & Zhao, B. (2016) · PLOS ONE · doi:10.1371/journal.pone.0166550 · Cited by 159
Khalvati, F., Wong, A., & Haider, M. A. (2015) · BMC Medical Imaging · doi:10.1186/s12880-015-0069-9 · Cited by 159
The mechanical microenvironment in cancer: How physics affects tumours
Nagelkerke, A., Bussink, J., Rowan, A. E., & Span, P. N. (2015) · Seminars in Cancer Biology · doi:10.1016/j.semcancer.2015.09.001 · Cited by 158
Self-citationPET Radiomics in NSCLC: state of the art and a proposal for harmonization of methodology
Sollini, M., Cozzi, L., Antunovic, L., Chiti, A., & Kirienko, M. (2017) · Scientific Reports · doi:10.1038/s41598-017-00426-y · Cited by 158
Parekh, V. S., & Jacobs, M. A. (2017) · npj Breast Cancer · doi:10.1038/s41523-017-0045-3 · Cited by 158
Meng, X., Xia, W., Xie, P., Zhang, R., Li, W., Wang, M., Xiong, F., Liu, Y., Fan, X., Xie, Y., et al. (2019) · European Radiology · doi:10.1007/s00330-018-5763-x · Cited by 158
“Several studies also showed that wavelet features had strong prognostic abilities and were important components in building radiomic signatures [25, 35, 36].”
BackgroundUnderstanding Sources of Variation to Improve the Reproducibility of Radiomics
Zhao, B. (2021) · Frontiers in Oncology · doi:10.3389/fonc.2021.633176 · Cited by 158
Li, Z.-C., Bai, H., Sun, Q., Li, Q., Liu, L., Zou, Y., Chen, Y., Liang, C., & Zheng, H. (2018) · European Radiology · doi:10.1007/s00330-017-5302-1 · Cited by 158
“Many existing imaginggenomics studies built their classification models by selecting a set of non-redundant features with the best univariate predictive power [18, 20, 21].”
BackgroundInterpretation of radiomics features–A pictorial review
Ardakani, A. A., Bureau, N. J., Ciaccio, E. J., & Acharya, U. R. (2021) · Computer Methods and Programs in Biomedicine · doi:10.1016/j.cmpb.2021.106609 · Cited by 173
Wang, T., She, Y., Yang, Y., Liu, X., Chen, S., Zhong, Y., Deng, J., Zhao, M., Sun, X., Xie, D., et al. (2021) · Radiology · doi:10.1148/radiol.2021210109 · Cited by 173
Radiomics and Its Feature Selection: A Review
Zhang, W., Guo, Y. T., & Jin, Q. (2023) · Symmetry · doi:10.3390/sym15101834 · Cited by 191
2D and 3D CT Radiomics Features Prognostic Performance Comparison in Non-Small Cell Lung Cancer
Shen, C., Liu, Z., Guan, M., Song, J., Lian, Y., Wang, S., Tang, Z., Dong, D., Kong, L., Wang, M., et al. (2017) · Translational Oncology · doi:10.1016/j.tranon.2017.08.007 · Cited by 156
“As is known, the texture of the tumors has a deep association with tumor heterogeneity, as well as with the patients' prognosis [5,8,16].”
BackgroundMethodInfluentialPeng, L. C., Parekh, V. S., Huang, P., Lin, D. D. M., Sheikh, K., Baker, B. R., Kirschbaum, T., Silvestri, F., Son, J., Robinson, A., et al. (2018) · International Journal of Radiation Oncology*Biology*Physics · doi:10.1016/j.ijrobp.2018.05.041 · Cited by 155
“Similar nonuni-formity features were also top-performing features in a large, combined study of head and neck cancer and lung cancer radiomics (29); in that study, the authors found that these features, which measure intralesional heterogeneity, were predictive for both clinical prognosis and cell…”
BackgroundZhang, W., Fang, M., Dong, D., Wang, X., Ke, X., Zhang, L., Hu, C., Guo, L., Guan, X., Zhou, J., et al. (2019) · Radiotherapy and Oncology · doi:10.1016/j.radonc.2019.11.023 · Cited by 155
European Society of Radiology (ESR) (2015) · Insights into Imaging · doi:10.1007/s13244-015-0394-0 · Cited by 155
Oakden-Rayner, L., Carneiro, G., Bessen, T., Nascimento, J. C., Bradley, A. P., & Palmer, L. J. (2017) · Scientific Reports · doi:10.1038/s41598-017-01931-w · Cited by 154
Decision support systems for personalized and participative radiation oncology
Lambin, P., Zindler, J. D., Vanneste, B. G. L., Voorde, L. V. D., Eekers, D. B. P., Compter, I., Panth, K. M., Peerlings, J., Larue, R. T. H. M., Deist, T. M., et al. (2016) · Advanced Drug Delivery Reviews · doi:10.1016/j.addr.2016.01.006 · Cited by 173
“interchangeable information regarding tumor phenotype [207].”
Self-citationXi, Y.-B., Guo, F., Xu, Z., Li, C., Wei, W., Tian, P., Liu, T.-T., Liu, L., Chen, G., Ye, J., et al. (2018) · Journal of Magnetic Resonance Imaging · doi:10.1002/jmri.25860 · Cited by 145
Comparison of Transferred Deep Neural Networks in Ultrasonic Breast Masses Discrimination
Xiao, T., Liu, L., Li, K., Qin, W., Yu, S., & Li, Z. (2018) · BioMed Research International · doi:10.1155/2018/4605191 · Cited by 168
“Most extracted features are explicitly designed or handcrafted, including tumor shape, intensity statistics, and texture features [6].”
BackgroundTu, W., Sun, G., Fan, L., Wang, Y., Xia, Y., Guan, Y., Li, Q., Zhang, D., Liu, S., & Li, Z. (2019) · Lung Cancer · doi:10.1016/j.lungcan.2019.03.025 · Cited by 156
Hatt, M., Krizsan, A. K., Rahmim, A., Bradshaw, T., Costa, P. F., Forgács, A., Seifert, R., Zwanenburg, A., Naqa, I. E., Kinahan, P. E., et al. (2022) · European Journal of Nuclear Medicine and Molecular Imaging · doi:10.1007/s00259-022-06001-6 · Cited by 176
“Communications [15] in 2014 (despite its flaws that were later emphasized [16]), the term “radiomics” was quickly adopted and increasingly used in publications.”
BackgroundAggregation‐induced emission luminogens for in vivo molecular imaging and theranostics in cancer
Cen, P., Huang, J., Jin, C., Wang, J., Wei, Y., Zhang, H., & Tian, M. (2023) · Aggregate · doi:10.1002/agt2.352 · Cited by 153
Bogowicz, M., Riesterer, O., Stark, L. S., Studer, G., Unkelbach, J., Gückenberger, M., & Tanadini‐Lang, S. (2017) · Acta Oncologica · doi:10.1080/0284186x.2017.1346382 · Cited by 167
“This result is consistent with previously published studies investigating local control [12] and overall survival [13,15] as”
BackgroundResultPeritumoral radiomics features predict distant metastasis in locally advanced NSCLC
Dou, T. H., Coroller, T. P., van Griethuysen, J. J. M., Mak, R. H., & Aerts, H. J. W. L. (2018) · PLoS ONE · doi:10.1371/journal.pone.0206108 · Cited by 165
Self-citationA deep learning radiomics model for preoperative grading in meningioma
Zhu, Y., Man, C., Gong, L., Dong, D., Yu, X., Wang, S., Fang, M., Wang, S., Fang, X., Chen, X., et al. (2019) · European Journal of Radiology · doi:10.1016/j.ejrad.2019.04.022 · Cited by 159
High-throughput proteomics and AI for cancer biomarker discovery
Xiao, Q., Zhang, F., Xu, L., Yue, L., Kon, O. L., Zhu, Y., & Guo, T. (2021) · Advanced Drug Delivery Reviews · doi:10.1016/j.addr.2021.113844 · Cited by 160
Guo, Y., Hu, Y., Qiao, M., Wang, Y., Yu, J., Li, J., & Chang, C. (2017) · Clinical Breast Cancer · doi:10.1016/j.clbc.2017.08.002 · Cited by 154
Radiographic prediction of meningioma grade by semantic and radiomic features
Coroller, T. P., Bi, W. L., Huynh, E., Abedalthagafi, M., Aizer, A. A., Greenwald, N. F., Parmar, C., Narayan, V., Wu, W. W., Miranda de Moura, S., et al. (2017) · PLOS ONE · doi:10.1371/journal.pone.0187908 · Cited by 151
Self-citationRadiomics analysis of pulmonary nodules in low‐dose CT for early detection of lung cancer
Choi, W., Oh, J. H., Riyahi, S., Liu, C., Jiang, F., Chen, W., White, C., Rimner, A., Mechalakos, J. G., Deasy, J. O., et al. (2018) · Medical Physics · doi:10.1002/mp.12820 · Cited by 152
“Third, we extracted 103 radiomic features from each PN to quantify its intensity, shape, and texture (spatial variations).(23,27,41) Finally, we performed a univariate analysis using Wilcoxon rank-sum test and the area under the receiver operating characteristic curve (AUC) to evaluate the significance of each feature.”
MethodPlasma HPV cell-free DNA monitoring in advanced HPV-associated oropharyngeal cancer
Hanna, G. J., Supplee, J., Kuang, Y., Mahmood, U., Lau, C. J., Haddad, R. I., Janne, P. A., & Paweletz, C. P. (2018) · Annals of Oncology · doi:10.1093/annonc/mdy251 · Cited by 155
Label-Free Segmentation of COVID-19 Lesions in Lung CT
Yao, Q., Xiao, L., Liu, P., & Zhou, S. K. (2021) · IEEE Transactions on Medical Imaging · doi:10.1109/tmi.2021.3066161 · Cited by 176
Le, N. Q. K., Kha, Q. H., Hiệp, N. V., Chen, Y.-C., Cheng, S., & Chen, C. (2021) · International Journal of Molecular Sciences · doi:10.3390/ijms22179254 · Cited by 172
Nan, Y., Ser, J. D., Walsh, S., Schönlieb, C., Roberts, M., Selby, I., Howard, K., Owen, J., Neville, J., Guiot, J., et al. (2022) · Information Fusion · doi:10.1016/j.inffus.2022.01.001 · Cited by 152
“29 from medical images obtained by CT, PET, MRI, and other imaging modalities [164].”
BackgroundSelf-citationMaleki, F., Ovens, K., Gupta, R., Reinhold, C., Spatz, A., & Forghani, R. (2023) · Radiology: Artificial Intelligence · doi:10.1148/ryai.220028 · Cited by 150
“We used a CT dataset of 137 head and neck squamous cell carcinoma (HNSCC) patients treated by radiotherapy.(15,16) Hereafter, we refer to this dataset as the “HNSCC” dataset.”
MethodMedical image super-resolution for smart healthcare applications: A comprehensive survey
Umirzakova, S., Ahmad, S., Khan, L. U., & Whangbo, T. K. (2023) · Information Fusion · doi:10.1016/j.inffus.2023.102075 · Cited by 183
Yang, L., Yang, J., Zhou, X., Huang, L., Zhao, W., Wang, T., Zhuang, J., & Tian, J. (2018) · European Radiology · doi:10.1007/s00330-018-5770-y · Cited by 161
Radiomics and artificial intelligence in lung cancer screening
Binczyk, F., Prazuch, W., Bozek, P., & Polańska, J. (2021) · Translational Lung Cancer Research · doi:10.21037/tlcr-20-708 · Cited by 163
“Lambin and Kumar’s initial papers (45) utilized only a limited number of image-derived features, whereas Aerst’s 2014 study (46) proposed a well-defined set of features that are used in almost all radiomics applications.”
BackgroundJochems, A., Deist, T. M., El Naqa, I., Kessler, M., Mayo, C., Reeves, J., Jolly, S., Matuszak, M., Ten Haken, R., van Soest, J., et al. (2017) · International Journal of Radiation Oncology*Biology*Physics · doi:10.1016/j.ijrobp.2017.04.021 · Cited by 150
Self-citationNew live screening of plant-nematode interactions in the rhizosphere
O’Callaghan, F. E., Braga, R. A., Neilson, R., MacFarlane, S. A., & Dupuy, L. X. (2018) · Scientific Reports · doi:10.1038/s41598-017-18797-7 · Cited by 153
“Live imaging is achieving far higher resolutions and speed, and allowing deeper imaging within samples 90–92 .”
Emerging role of MRI in radiation therapy
Chandarana, H., Wang, H., Tijssen, R. H. N., & Das, I. J. (2018) · Journal of Magnetic Resonance Imaging · doi:10.1002/jmri.26271 · Cited by 163
Acidosis and cancer: from mechanism to neutralization
Ibrahim‐Hashim, A., & Estrella, V. C. (2019) · Cancer and Metastasis Reviews · doi:10.1007/s10555-019-09787-4 · Cited by 166
Huang, P., Lin, C. T., Li, Y., Tammemagi, M. C., Brock, M. V., Atkar-Khattra, S., Xu, Y., Hu, P., Mayo, J. R., Schmidt, H., et al. (2019) · The Lancet Digital Health · doi:10.1016/s2589-7500(19)30159-1 · Cited by 148
Radiomics in neuro-oncology: Basics, workflow, and applications
Lohmann, P., Galldiks, N., Köcher, M., Heinzel, A., Filß, C., Stegmayr, C., Mottaghy, F. M., Fink, G. R., Shah, N. J., & Langen, K. (2020) · Methods · doi:10.1016/j.ymeth.2020.06.003 · Cited by 171
Pattern recognition for predictive, preventive, and personalized medicine in cancer
Cheng, T., & Zhan, X. (2017) · The EPMA Journal · doi:10.1007/s13167-017-0083-9 · Cited by 158
Zheng, B.-H., Liu, L., Zhang, Z.-Z., Shi, J.-Y., Dong, L., Tian, L., Ding, Z., Ji, Y., Rao, S., Zhou, J., et al. (2018) · BMC Cancer · doi:10.1186/s12885-018-5024-z · Cited by 157
Guo, W., Li, H., Zhu, Y., Lan, L., Yang, S., Drukker, K., Morris, E. A., Burnside, E. S., Whitman, G. J., Giger, M. L., et al. (2015) · Journal of Medical Imaging · doi:10.1117/1.jmi.2.4.041007 · Cited by 148
“1 Introduction Radiogenomics integrates genomic and radiomic imaging profiles and has become an increasingly important research direction, especially in cancer, due to its potential to improve disease diagnosis, prognosis, and treatment choice.(1,2) Radiological imaging uses noninvasive procedures, such as x-ray compu…”
BackgroundBektaş, C. T., Koçak, B., Yardımcı, A. H., Türkcanoğlu, M. H., Yücetaş, U., Koca, S. B., Erdim, Ç., & Kılıçkesmez, Ö. (2018) · European Radiology · doi:10.1007/s00330-018-5698-2 · Cited by 159
“Texture analysis based on pixel distribution and pattern has been emerged as a practical quantitative method for the detection of some differences in tissues that cannot be depicted by a subjective visual assessment [18, 19].”
MethodDual-branch residual network for lung nodule segmentation
Cao, H., Liu, H., Song, E., Hung, C., Ma, G., Xu, X., Jin, R., & Lü, J. (2019) · Applied Soft Computing · doi:10.1016/j.asoc.2019.105934 · Cited by 165
Sun, Q., Chen, Y., Liang, C., Zhao, Y., Lv, X., Zou, Y., Yan, K., Zheng, H., Liang, D., & Li, Z. (2021) · Radiology · doi:10.1148/radiol.2021203281 · Cited by 149
Automated detection and segmentation of non-small cell lung cancer computed tomography images
Primakov, S. P., Ibrahim, A., van Timmeren, J. E., Wu, G., Keek, S. A., Beuque, M. P. L., Granzier, R. W. Y., Lavrova, E., Scrivener, M., Sanduleanu, S., et al. (2022) · Nature Communications · doi:10.1038/s41467-022-30841-3 · Cited by 181
Self-citationKirienko, M., Cozzi, L., Rossi, A., Voulaz, E., Antunovic, L., Fogliata, A., Chiti, A., & Sollini, M. (2018) · European Journal of Nuclear Medicine and Molecular Imaging · doi:10.1007/s00259-018-3987-2 · Cited by 148
Wang, X., Xie, T., Luo, J., Zhou, Z., Yu, X., & Guo, X. (2022) · Breast Cancer Research · doi:10.1186/s13058-022-01516-0 · Cited by 162
Lung Nodule Classification via Deep Transfer Learning in CT Lung Images
da Nóbrega, R. V. M., Peixoto, S. A., da Silva, S. P. P., & Filho, P. P. R. (2018) · Proceedings - IEEE Symposium on Computer-Based Medical Systems · doi:10.1109/cbms.2018.00050 · Cited by 162
“62% from the [43] approach.”
Recent advances in radiation oncology
Garibaldi, C., Jereczek‐Fossa, B. A., Marvaso, G., Dicuonzo, S., Rojas, D. P., Cattani, F., Starzyńska, A., Ciardo, D., Surgo, A., Leonardi, M. C., et al. (2017) · ecancermedicalscience · doi:10.3332/ecancer.2017.785 · Cited by 170
“Radiomics analyses numerous medical imaging features, to which are added critical and interchangeable information regarding tumour phenotype [145].”
BackgroundLeijenaar, R. T. H., Bogowicz, M., Jochems, A., Hoebers, F. J. P., Wesseling, F. W. R., Huang, S., Chan, B., Waldron, J. N., O’Sullivan, B., Rietveld, D. H. F., et al. (2018) · British Journal of Radiology · doi:10.1259/bjr.20170498 · Cited by 150
Self-citationKim, H., Park, C. M., Lee, M., Park, S. J., Song, Y. S., Lee, J. H., Hwang, E. J., & Goo, J. M. (2016) · PLOS ONE · doi:10.1371/journal.pone.0164924 · Cited by 143
Radiomics-based features for pattern recognition of lung cancer histopathology and metastases
Ferreira, J. R., Santos, M. K., Cipriano, F. E. G., Fabro, A. T., & de Azevedo‐Marques, P. M. (2018) · Computer Methods and Programs in Biomedicine · doi:10.1016/j.cmpb.2018.02.015 · Cited by 145
Mannil, M., von Spiczak, J., Manka, R., & Alkadhi, H. (2018) · Investigative Radiology · doi:10.1097/rli.0000000000000448 · Cited by 143
“Current advances in Radiomics enabled the translation of medical images into multidimensional data points.(8) In this regard, texture analysis (TA) objectively quantifies texture of radiological images by exploiting interpixel relationships.”
Background
Metadata
- Authors
- Aerts, H. J. W. L., Velazquez, E. R., Leijenaar, R. T. H., Parmar, C., Grossmann, P., Carvalho, S., Bussink, J., Monshouwer, R., Haibe-Kains, B., Rietveld, D., Hoebers, F., Rietbergen, M. M., Leemans, C. R., Dekker, A., Quackenbush, J., Gillies, R. J., & Lambin, P.
- Affiliations
- Brigham and Women's Hospital (US)
- Maastricht University (NL)
- Radboud University Medical Center (NL)
- Amsterdam UMC Location Vrije Universiteit Amsterdam (NL)
- Dana-Farber Cancer Institute (US)
- Moffitt Cancer Center (US)
- Corresponding author
- Aerts, Hugo J. W. L.
- ORCID
- Venue
- Nature Communications
- Published
- 2014-06-03
- Volume
- 5
- Issue
- 1
- Pages
- 4006-4006
- ISSN
- 2041-1723 (ISSN-L)
- PMC
- PMC4059926
- OpenAlex
- W2103004421
- Semantic Scholar
- 3b002068646831a6f59fabb6daeb0209ed54049d
- Cited by
- 5,132
- References
- 29
- Citations by year
- 2026: 415 · 2025: 460 · 2024: 458 · 2023: 510 · 2022: 567 · 2021: 638 · 2020: 587 · 2019: 552 · 2018: 388 · 2017: 283 · 2016: 175 · 2015: 82 · 2014: 11
- FWCI
- 142.84
- Type
- journal article
- Language
- en
- Update notices
- correction (2014-08-07)
- Open access
- hybrid
- doi.org
- Licence
- Locations
- Nature Communications (publishedVersion, cc-by-nc-nd)
- PubMed Central (publishedVersion, cc-by-nc-nd)
- PubMed (publishedVersion)
- Pure Amsterdam UMC (publishedVersion)
- Amsterdam UMC (VU Amsterdam) - Institutional Repository (publishedVersion)
- Radboud Repository (Radboud University) (submittedVersion)
- Digital Access to Scholarship at Harvard (DASH) (Harvard University) (submittedVersion, cc-by)
- RePEc: Research Papers in Economics (submittedVersion)
- Research Publications (Maastricht University) (submittedVersion, cc-by-nc-nd)
- Radboud Repository (Radboud University) (submittedVersion, other-oa)
- Research Publications (Maastricht University) (submittedVersion, other-oa)
- Data Archiving and Networked Services (DANS) (submittedVersion)
- Funders
- European Federation of Pharmaceutical Industries and Associations
- KWF Kankerbestrijding (UM 2009-4454, 2011-5020, KWF UM 2009-4454, KWF UM 2011-5020, 2009-4454)
- Center for Translational Molecular Medicine (grant 030-103, 030-103)
- Innovative Medicines Initiative (115151)
- National Institutes of Health (U01 CA)
- National Cancer Institute (NIH-USA U01CA 143062-01, U01CA143062)
- Interreg
- Topics
- Health Sciences › Medicine › Radiology, Nuclear Medicine and Imaging › Radiomics and Machine Learning in Medical Imaging
- Physical Sciences › Computer Science › Computer Vision and Pattern Recognition › Image Retrieval and Classification Techniques
- Health Sciences › Medicine › Radiology, Nuclear Medicine and Imaging › Medical Imaging Techniques and Applications
- Keywords
- radiomics, tumor phenotype, lung cancer, head and neck cancer, radiogenomics, intratumoral heterogeneity, computed tomography, image texture features, gene expression, non-invasive imaging, treatment decision support
- MeSH terms
- Adenocarcinoma, Carcinoma, Non-Small-Cell Lung, Carcinoma, Squamous Cell, Female, Head and Neck Neoplasms, Humans, Lung Neoplasms, Male, Phenotype, Prognosis, Tomography, X-Ray Computed, Tumor Burden, Positron-Emission Tomography, Multimodal Imaging
About these checks
Registry, retraction, Cites and statistics results are computed, not judged, with one exception: a printed reference that no index lists is read once by a model before it counts as a citation error. Claims are extracted by a model and kept only when their quote appears verbatim in the text; each cited source is then checked, with a model’s help, for whether it says what the claim relies on. Those verdicts can be wrong — read the claim’s quote and the cited source before relying on one.
Statistics and arithmetic are recomputed, not judged.
Confidence bands are shown only for fields calibrated on our annotated test set. None is calibrated yet, so no band is shown.
What counts as a claim ›How we measure confidence ›How we check this ›
Are you an author, or do you see a problem with this page? Request a review
Data sources
Bibliographic data: Semantic Scholar, OpenAlex, Crossref.
Contains information from the Semantic Scholar Academic Graph Datasets, made available under the ODC Attribution License (ODC-BY 1.0).
Semantic Scholar’s data is described in: Kinney, R., et al. (2023). The Semantic Scholar Open Data Platform. arXiv:2301.10140.
