

The DOI matches its Crossref record; 10 of the 10 references it cites were found in a registry or an index.
Targeted deletion of miR-132/-212 impairs memory and alters the hippocampal transcriptome
Abstract
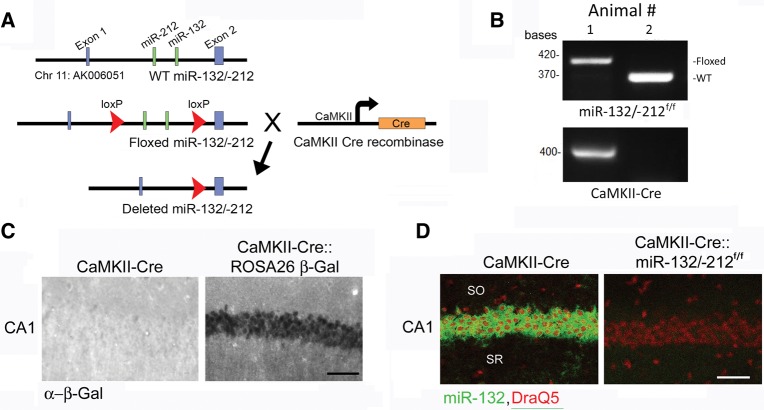
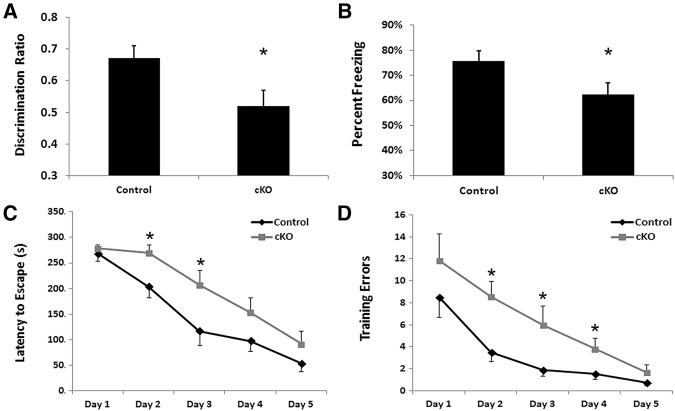
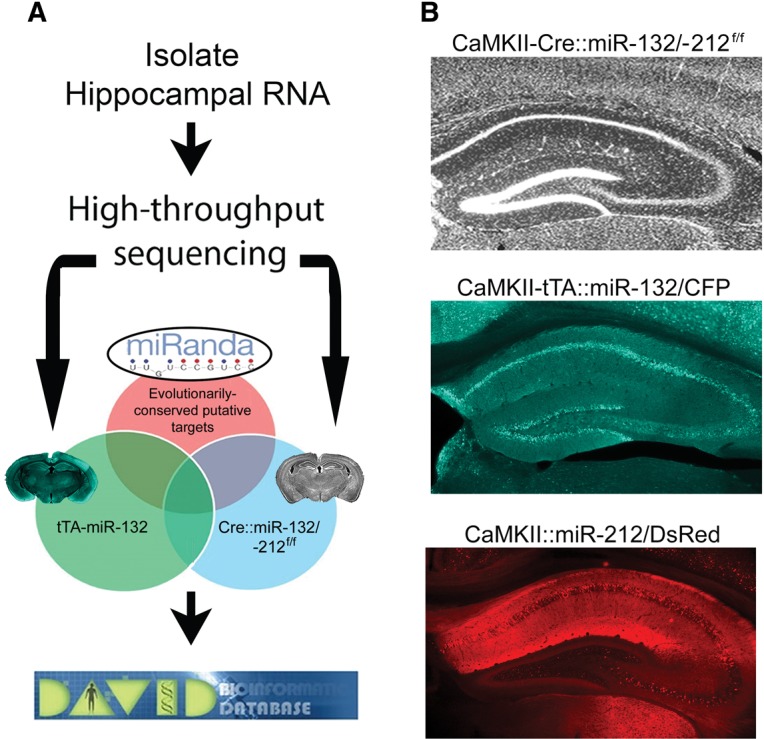
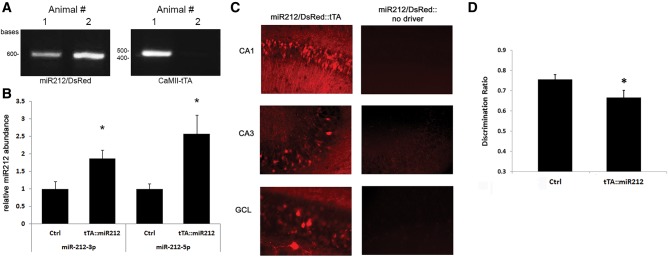
miR-132 and miR-212 are structurally related microRNAs that have been found to exert powerful modulatory effects within the central nervous system (CNS). Notably, these microRNAs are tandomly processed from the same noncoding transcript, and share a common seed sequence: thus it has been difficult to assess the distinct contribution of each microRNA to gene expression within the CNS. Here, we employed a combination of conditional knockout and transgenic mouse models to examine the contribution of the miR-132/-212 gene locus to learning and memory, and then to assess the distinct effects that each microRNA has on hippocampal gene expression. Using a conditional deletion approach, we show that miR-132/-212 double-knockout mice exhibit significant cognitive deficits in spatial memory, recognition memory, and in tests of novel object recognition. Next, we utilized transgenic miR-132 and miR-212 overexpression mouse lines and the miR-132/-212 double-knockout line to explore the distinct effects of these two miRNAs on the transcriptional profile of the hippocampus. Illumina sequencing revealed that miR-132/-212 deletion increased the expression of 1138 genes; Venn analysis showed that 96 of these genes were also downregulated in mice overexpressing miR-132. Of the 58 genes that were decreased in animals overexpressing miR-212, only four of them were also increased in the knockout line. Functional gene ontology analysis of downregulated genes revealed significant enrichment of genes related to synaptic transmission, neuronal proliferation, and morphogenesis, processes known for their roles in learning, and memory formation. These data, coupled with previous studies, firmly establish a role for the miR-132/-212 gene locus as a key regulator of cognitive capacity. Further, although miR-132 and miR-212 share a seed sequence, these data indicate that these miRNAs do not exhibit strongly overlapping mRNA targeting profiles, thus indicating that these two genes may function in a complex, nonredundant manner to shape the transcriptional profile of the CNS. The dysregulation of miR-132/-212 expression could contribute to signaling mechanisms that are involved in an array of cognitive disorders.
Overview
The claims and statistics of this paper haven’t been checked yet.
Run the check — free, no account needed. It reads the open-access text and checks the sources it cites.
Integrity signals
Registry
Cites
Statistics
Figures
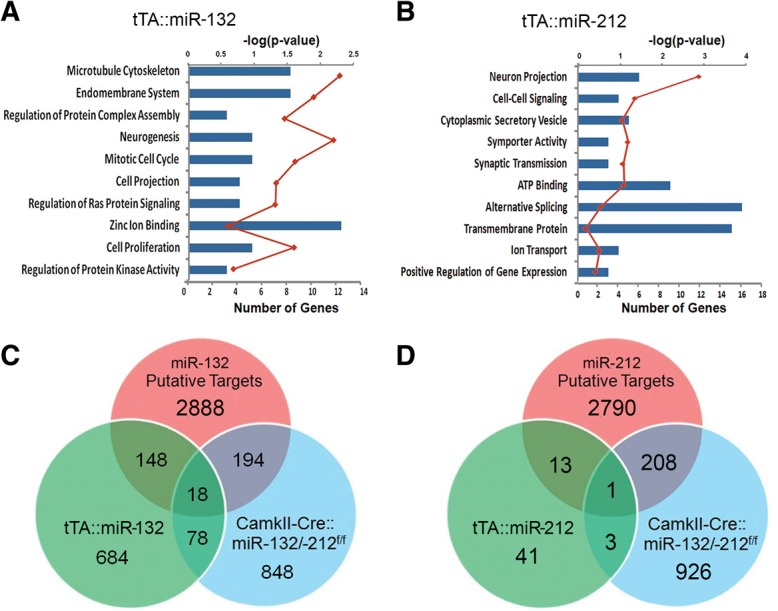
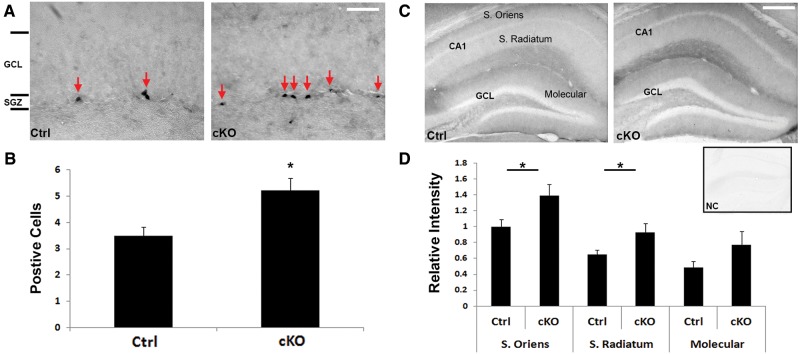
Verification
Claims the paper makes
The claims and statistics of this paper haven’t been checked yet.
Run the check — free, no account needed. It reads the open-access text and checks the sources it cites.
Claims other papers make about this one
Each is checked against this paper’s own text: does it say what the citing paper says it does?
The source backs part of the claim, not all of it — or backs it for a different population, condition or comparison.
In the citing paper
“Deletion of the miR-132/212 cluster impairs synaptic plasticity and memory consolidation in mice [34, 61, 68], suggesting that the decrease of miR-212-5p likely contributes to FTD pathology.”
From A role for astrocytic miR-129-5p in frontotemporal dementia (2025) · cites this paper as [68]
Experimental — accuracy not yet measuredThe source backs part of the claim, not all of it — or backs it for a different population, condition or comparison.
In the citing paper
“miR-132 can ameliorate AD pathology at multiple levels, through its involvement in TAU metabolism and hyperphosphorylation, amyloidosis, neuronal survival, adult neurogenesis and memory formation [18, 20–34].”
From microRNA-132 attenuates inflammation in induced pluripotent stem cell-derived microglia from Alzheimer’s disease patients (2026) · cites this paper as [21]
Experimental — accuracy not yet measured
Self-check
Percentages, sums and reported differences re-computed from the paper’s own numbers.
The self-check needs the paper’s full text.
Citations
Cites
Most mammalian mRNAs are conserved targets of microRNAs
Friedman, R. C., Farh, K. K.-H., Burge, C. B., & Bartel, D. P. (2009) · Genome Research · doi:10.1101/gr.082701.108 · Cited by 8,462
A brain-specific microRNA regulates dendritic spine development
Schratt, G. M., Tuebing, F., Nigh, E. A., Kane, C. G., Sabatini, M. E., Kiebler, M., & Greenberg, M. E. (2006) · Nature · doi:10.1038/nature04367 · Cited by 1,786
The essential role of hippocampal CA1 NMDA receptor-dependent synaptic plasticity in spatial memory.
Tsien, J. Z., Huerta, P. T., & Tonegawa, S. (1996) · Cell · doi:10.1016/s0092-8674(00)81827-9 · Cited by 1,782
A novel pathway regulates memory and plasticity via SIRT1 and miR-134
Gao, J., Wang, W.-Y., Mao, Y.-W., Gräff, J., Guan, J.-S., Pan, L., Mak, G., Kim, D., Su, S. C., & Tsai, L.-H. (2010) · Nature · doi:10.1038/nature09271 · Cited by 975
Cogswell, J. P., Ward, J., Taylor, I. A., Waters, M., Shi, Y., Cannon, B., Kelnar, K., Kemppainen, J., Brown, D., Chen, C., et al. (2008) · Journal of Alzheimer s Disease · doi:10.3233/jad-2008-14103 · Cited by 943
Packer, A. N., Xing, Y., Harper, S. Q., Jones, L., & Davidson, B. L. (2008) · The Journal of Neuroscience · doi:10.1523/jneurosci.2390-08.2008 · Cited by 679
Homeostatic regulation of MeCP2 expression by a CREB-induced microRNA
Klein, M. E., Lioy, D. T., Ma, L., Impey, S., Mandel, G., & Goodman, R. H. (2007) · Nature Neuroscience · doi:10.1038/nn2010 · Cited by 444
Self-citationmiR-132 Mediates the Integration of Newborn Neurons into the Adult Dentate Gyrus
Luikart, B. W., Bensen, A. L., Washburn, E. K., Perederiy, J. V., Su, K. G., Li, Y., Kernie, S. G., Parada, L. F., & Westbrook, G. L. (2011) · PLoS ONE · doi:10.1371/journal.pone.0019077 · Cited by 160
Lesiak, A., Zhu, M., Chen, H., Appleyard, S. M., Impey, S., Lein, P. J., & Wayman, G. A. (2014) · The Journal of Neuroscience · doi:10.1523/jneurosci.2884-13.2014 · Cited by 88 · cited 1×
“…signaling via p250GAP, which in turn affects synaptic plasticity (Wayman et al. 2008; Impey et al. 2010; Lambert et al. 2010; Dhar et al. 2014; Lesiak et al. 2014). miR-132 has also been shown to be localized to axons and to regulate their extension via Rasa1 and p250GAP (Hancock et al. 2014;…”
BackgroundSelf-citationGao, M. C., Bellugi, U., Dai, L., Mills, D. L., Sobel, E. M., Lange, K., & Korenberg, J. R. (2010) · PLoS ONE · doi:10.1371/journal.pone.0010292 · Cited by 42
Research works printed but not linked: 86
- 10.1128/MCB.00316-10 · DOI · Paper page
- 10.1083/jcb.200311141 · DOI
- 10.1186/gb-2010-11-10-r106 · DOI · Paper page
- 10.1126/science.1321498 · DOI · Paper page
- 10.1093/nar/gkm995 · DOI
- 10.1038/nprot.2006.205 · DOI
- 10.1016/j.biocel.2009.09.016 · DOI
- 10.1371/journal.pone.0094839 · DOI · Paper page
- 10.1016/j.mcn.2008.07.017 · DOI
- 10.1186/1750-1326-4-52 · DOI
- 10.1073/pnas.1017576108 · DOI · Paper page
- 10.1523/JNEUROSCI.23-08-03547.2003 · DOI
- 10.1073/pnas.0801689105 · DOI
- 10.1523/JNEUROSCI.4815-07.2008 · DOI · Paper page
- 10.1210/me.2013-1332 · DOI
- 10.1186/2040-2392-5-14 · DOI
- 10.1016/S0168-0102(97)00050-3 · DOI
- 10.1126/science.1109020 · DOI · Paper page
- 10.1042/BJ20120578 · DOI
- 10.1046/j.0953-816x.2001.01531.x · DOI
- 10.1371/journal.pone.0015497 · DOI
- 10.1007/s00429-012-0431-4 · DOI · Paper page
- 10.1038/srep06930 · DOI
- 10.1016/j.bbr.2015.03.032 · DOI · Paper page
- 10.1038/nature09202 · DOI
- 10.1038/nprot.2008.211 · DOI · Paper page
- 10.1038/nn.2615 · DOI · Paper page
- 10.1038/2830 · DOI
- 10.1016/j.mcn.2009.10.005 · DOI · Paper page
- 10.1016/j.nbd.2007.11.001 · DOI · Paper page
- 10.1186/1750-1326-9-57 · DOI
- 10.1073/pnas.2333854100 · DOI
- 10.1523/JNEUROSCI.3178-07.2007 · DOI
- 10.1016/j.schres.2010.07.002 · DOI · Paper page
- 10.1371/journal.pone.0018472 · DOI
- 10.1093/eurheartj/ehu344 · DOI
- 10.1371/journal.pone.0024682 · DOI
- 10.1016/S0960-9822(02)00809-6 · DOI · Paper page
- 10.1371/journal.pone.0015182 · DOI · Paper page
- 10.1126/science.1178178 · DOI · Paper page
- 10.1007/s13238-014-0022-7 · DOI
- 10.1038/nature03315 · DOI · Paper page
- 10.1038/nn.2891 · DOI · Paper page
- 10.1073/pnas.1318445111 · DOI
- 10.1097/WNR.0b013e3280148e8b · DOI · Paper page
- 10.1073/pnas.1015691107 · DOI · Paper page
- 10.1523/JNEUROSCI.1910-13.2014 · DOI
- 10.1126/science.274.5293.1678 · DOI · Paper page
- 10.1038/nn.2909 · DOI · Paper page
- 10.1073/pnas.1113793109 · DOI · Paper page
- 10.1523/JNEUROSCI.2911-11.2012 · DOI
- 10.1016/j.neuropharm.2004.10.017 · DOI
- 10.1016/S0166-4328(01)00470-3 · DOI
- 10.1017/S1461145708009036 · DOI
- 10.1002/hipo.20646 · DOI
- 10.1016/j.ymeth.2010.08.009 · DOI
- 10.1038/nprot.2007.153 · DOI
- 10.1007/978-1-4939-2291-8_13 · DOI
- 10.1038/sj.emboj.7600447 · DOI
- 10.1101/lm.1094208 · DOI
- 10.1371/journal.pone.0062509 · DOI · Paper page
- 10.1111/j.1460-9568.1996.tb01548.x · DOI
- 10.1016/j.euroneuro.2012.07.014 · DOI
- 10.1111/j.1460-9568.2012.08220.x · DOI
- 10.1007/s00429-011-0376-z · DOI
- 2013, Plasma microRNA biomarkers for detection of mild cognitive impairment: biomarker validation study, Aging (Albany NY), 5, 925
- 10.1016/0092-8674(93)90376-2 · DOI
- 10.1038/362318a0 · DOI
- 10.1038/5007 · DOI
- 10.1093/nar/gkp870 · DOI
- 10.1038/nprot.2007.390 · DOI · Paper page
- 10.1016/j.mcn.2005.07.016 · DOI
- 10.1016/j.fob.2014.01.004 · DOI
- 10.1016/j.biocel.2011.10.015 · DOI
- 10.1038/nn.2920 · DOI · Paper page
- 10.1371/journal.pone.0074907 · DOI · Paper page
- 10.3389/fncel.2014.00412 · DOI
- 10.1101/lm.1220309 · DOI
- 10.1073/pnas.0508448102 · DOI · Paper page
- 2010, miR-212 is downregulated and suppresses methyl-CpG-binding protein MeCP2 in human gastric cancer, Int J Cancer, 127, 1106, 10.1002/ijc.25126 · DOI
- 10.1093/nar/gks151 · DOI
- 10.1007/s00401-010-0756-0 · DOI · Paper page
- 10.1002/hipo.22123 · DOI
- 10.1073/pnas.0803072105 · DOI · Paper page
- Wehner JM , Radcliffe RA . 2004. Cued and contextual fear conditioning in mice. Curr Protoc Neurosci Chapter 8: Unit 8.5C. · DOI
- 10.1007/978-94-007-5590-1_13 · DOI
Cited by
Sorted by citations
Profiling DNA break sites and transcriptional changes in response to contextual fear learning
Stott, R. T., Kritsky, O., & Tsai, L.-H. (2021) · PLOS ONE · doi:10.1371/journal.pone.0249691 · Cited by 62
Hippocampal MicroRNAs Respond to Administration of Antidepressant Fluoxetine in Adult Mice
Miao, N., Jin, J., Kim, S.-N., & Sun, T. (2018) · International Journal of Molecular Sciences · doi:10.3390/ijms19030671 · Cited by 19
A role for astrocytic miR-129-5p in frontotemporal dementia
Kaurani, L., Pradhan, R., Schröder, S., Burkhardt, S., Schuetz, A.-L., Krüger, D. M., Pena, T., Heutink, P., Sananbenesi, F., & Fischer, A. (2025) · Translational Psychiatry · doi:10.1038/s41398-025-03338-y · Cited by 10
Stojanovic, T., Velarde Gamez, D., Schuld, G. J., Bormann, D., Cabatic, M., Uhrin, P., Lubec, G., & Monje, F. J. (2022) · Cells · doi:10.3390/cells11020261 · Cited by 8
Penning, A., Snoeck, S., Ormaechea, O. R., Ayyildiz, D., Polzer, O., Buitrago-Arango, M., Capobianco, R., de Winter, F., Balusu, S., Verhaagen, J., et al. (2026) · Acta Neuropathologica Communications · doi:10.1186/s40478-026-02228-8 · Cited by 6
Metadata
- Authors
- Hansen, K. F., Sakamoto, K., Aten, S., Price, K. H., Loeser, J., Hesse, A. M., Page, C. E., Pelz, C., Arthur, J. S. C., Impey, S., & Obrietan, K.
- Venue
- Learning & Memory
- Publisher
- Cold Spring Harbor Laboratory
- Published
- 2016-01-15
- Volume
- 23
- Issue
- 2
- Pages
- 61-71
- ISSN
- 1549-5485
- PMC
- PMC4749831
- Cited by
- 100
- References
- 10
- Language
- en
- Funders
- National Institutes of Health (F31-MH096460, NS066345, NS091302, NS045758, MH103361)
- National Science Foundation (1354612)
About these checks
Registry, retraction, Cites and statistics results are computed, not judged, with one exception: a printed reference that no index lists is read once by a model before it counts as a citation error. Claims are extracted by a model and kept only when their quote appears verbatim in the text; each cited source is then checked, with a model’s help, for whether it says what the claim relies on. Those verdicts can be wrong — read the claim’s quote and the cited source before relying on one.
Statistics and arithmetic are recomputed, not judged.
Confidence bands are shown only for fields calibrated on our annotated test set. None is calibrated yet, so no band is shown.
What counts as a claim ›How we measure confidence ›How we check this ›
Are you an author, or do you see a problem with this page? Request a review
