

The DOI matches its Crossref record; 48 of the 48 references it cites were found in a registry or an index; 5 of the 57 sources its claims cite were checked for support.
A genome-wide screen for modifiers of transgene variegation identifies genes with critical roles in development
Open accessAbstract
Background: Some years ago we established an N-ethyl-N-nitrosourea screen for modifiers of transgene variegation in the mouse and a preliminary description of the first six mutant lines, named MommeD1-D6, has been published. We have reported the underlying genes in three cases: MommeD1 is a mutation in SMC hinge domain containing 1 (Smchd1), a novel modifier of epigenetic gene silencing; MommeD2 is a mutation in DNA methyltransferase 1 (Dnmt1); and MommeD4 is a mutation in Smarca 5 (Snf2h), a known chromatin remodeler. The identification of Dnmt1 and Smarca5 attest to the effectiveness of the screen design. Results: We have now extended the screen and have identified four new modifiers, MommeD7-D10. Here we show that all ten MommeD s link to unique sites in the genome, that homozygosity for the mutations is associated with severe developmental abnormalities and that heterozygosity results in phenotypic abnormalities and reduced reproductive fitness in some cases. In addition, we have now identified the underlying genes for MommeD5 and MommeD10. MommeD5 is a mutation in Hdac1, which encodes histone deacetylase 1, and MommeD10 is a mutation in Baz1b (also known as Williams syndrome transcription factor), which encodes a transcription factor containing a PHD-type zinc finger and a bromodomain. We show that reduction in the level of Baz1b in the mouse results in craniofacial features reminiscent of Williams syndrome. Conclusions: These results demonstrate the importance of dosage-dependent epigenetic reprogramming in the development of the embryo and the power of the screen to provide mouse models to study this process.
Overview
AI snapshot
Written from the paper’s full text.
TL;DR
An extended ENU screen in mice identified four new modifiers of GFP transgene variegation, MommeD7–D10, all semidominant and associated with homozygous embryonic or perinatal lethality. The study mapped the mutations, identified Hdac1 (MommeD5) and Baz1b (MommeD10) as causative genes, and linked reduced Baz1b to craniofacial features resembling Williams-Beuren syndrome.
Key findings
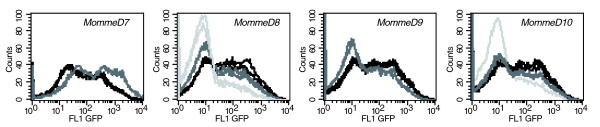
- Screening an additional 400 G1 offspring recovered MommeD7–D10, bringing the total to 1,000 G1 offspring screened. MommeD7 is a suppressor of variegation (heterozygotes: 80 ± 3% GFP-expressing erythrocytes vs wild-type 55 ± 7%, p ≤ 0.0001), while MommeD8, D9 and D10 are enhancers (e.g., MommeD8 heterozygotes 41 ± 4%, homozygotes 15 ± 4%; MommeD10 heterozygotes 44 ± 3%, homozygotes 22 ± 2%; p ≤ 0.0001).
- All ten MommeDs behave semidominantly, and homozygosity is associated with embryonic or perinatal lethality. Timing varied: MommeD5, D6 and D9 homozygotes arrested around 8–9 dpc; MommeD3 by or before 14.5 dpc; MommeD7 homozygotes died in the first few days after birth; most MommeD8 and MommeD10 homozygotes died between P1 and P21.
- MommeD5 carries a 7 bp deletion in exon 13 of Hdac1, and MommeD10 carries a T→G transversion in exon 7 of Baz1b causing L733R and reduced Baz1b protein. MommeD10 homozygotes were smaller and had craniofacial anomalies reminiscent of Williams-Beuren syndrome, with some features also in heterozygotes.
- DNA methylation at the transgene HS-40 enhancer was not significantly altered in MommeD5-/+ or MommeD10-/+ and MommeD10-/- mice compared with wild-type, suggesting these modifiers act through chromatin state rather than DNA methylation at this element.
Methods
- ENU mutagenesis was performed in an FVB/NJ transgenic line expressing GFP in a variegated manner in erythrocytes; 1,000 G1 offspring were screened at 3 weeks of age, and heritable mutations were confirmed over at least 5 generations using at least 30 litters.
- GFP expression was measured by flow cytometry with a positive gate set to exclude 99.9% of wild-type erythrocytes; mutants were mapped by linkage analysis using FVB/C57 backcrosses or F2 intercrosses, followed by candidate gene sequencing.
- Supporting analyses included western blotting, quantitative RT-PCR, bisulfite sequencing of the transgene HS-40 enhancer, reticulocyte staining/FACS, micro-computed tomography of skulls, and whole-mount in situ hybridization for Baz1b expression.
Limitations
- Stated: extensive phenotyping of heterozygous MommeD lines was not carried out, although heterozygous effects such as haematopoietic abnormalities in MommeD7-/+ and litter size reductions in MommeD9/D10 were noted.
- Stated/evident: the underlying genes were identified in only five of ten MommeDs; several mapped intervals still contained many genes (e.g., MommeD3 123 genes, MommeD6 32, MommeD8 54, MommeD9 80), so causality was not established for those lines.
- Evident: the GC-rich transgene promoter could not be analyzed by bisulfite sequencing because the cloned converted fragment was refractory to bacterial growth, so methylation analysis was limited to the HS-40 enhancer; some lethality timing relied on abnormal/resorbed embryos and limited genotyping.
Model-written summary. Check it against the paper before relying on it.
Integrity signals
Registry
Cites
Statistics
Figures
Verification
Claims the paper makes
72 Own result · 29 Not checked yet · 25 Own interpretation · 7 Own method · 7 No basis given · 1 Supported · 1 Supported so far · 1 Partly supported · accuracy not yet measured
A result the paper reports from its own data — it cites no other source for it, so there is none to check. The quote shows it is in the paper.
In the paper
“PCR using primers specific to the 3' end of the transgene construct in combination with degenerate random tagging primers (genome walking) revealed that the transgene had integrated into chromosome 1 at 47,747,486 bp (UCSC web browser, July 2007 assembly).”
§ A genome-wide screen for modifiers of transgene variegation identifies genes with critical roles in development > Results and discussion > Integration site of the GFP transgene
plainSingle case- Asserted: passes — The authors put it forward as true.
- Checkable: passes — It can be checked against evidence.
- Load-bearing: unclear — It is unclear whether the paper’s conclusions depend on it.
- Based: passes — The paper gives a reason why it holds.
A result the paper reports from its own data — it cites no other source for it, so there is none to check. The quote shows it is in the paper.
In the paper
“An extended ENU screen for modifiers of transgene variegation identified four new modifiers, MommeD7-D10.”
§ A genome-wide screen for modifiers of transgene variegation identifies genes with critical roles in development > Abstract
plaindirect- Asserted: passes — The authors put it forward as true.
- Checkable: passes — It can be checked against evidence.
- Load-bearing: passes — The paper’s conclusions depend on it.
- Based: passes — The paper gives a reason why it holds.
A result the paper reports from its own data — it cites no other source for it, so there is none to check. The quote shows it is in the paper.
In the paper
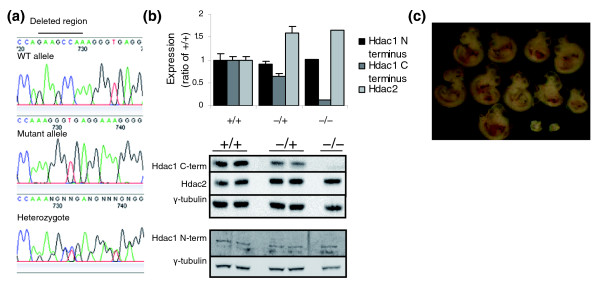
“Sequencing of all exons, including exon/intron boundaries, from two heterozygous and two wild-type individuals revealed a 7 bp deletion (GAAGCCA) in exon 13 in the mutants (Figure 5a).”
§ A genome-wide screen for modifiers of transgene variegation identifies genes with critical roles in development > Results and discussion > MommeD5 has a mutation in Histone deacetylase 1
plainn = 2- Asserted: passes — The authors put it forward as true.
- Checkable: passes — It can be checked against evidence.
- Load-bearing: passes — The paper’s conclusions depend on it.
- Based: passes — The paper gives a reason why it holds.
A result the paper reports from its own data — it cites no other source for it, so there is none to check. The quote shows it is in the paper.
In the paper
“These data show that each of the ten MommeD mutations maps to a unique region of the genome.”
§ A genome-wide screen for modifiers of transgene variegation identifies genes with critical roles in development > Results and discussion > Mapping
boostedn = 10- Asserted: passes — The authors put it forward as true.
- Checkable: passes — It can be checked against evidence.
- Load-bearing: passes — The paper’s conclusions depend on it.
- Based: passes — The paper gives a reason why it holds.
A result the paper reports from its own data — it cites no other source for it, so there is none to check. The quote shows it is in the paper.
In the paper
“MommeD8 homozygotes were significantly smaller (6.60 g ± 0.25 standard error of the mean (SEM)) than their wild-type (8.54 g ± 0.33 SEM, p < 0.001) and heterozygous (8.65 g ± 0.29 SEM, p < 0.0001) littermates.”
§ A genome-wide screen for modifiers of transgene variegation identifies genes with critical roles in development > Results and discussion > Homozygous lethality occurs at different stages of development
plain- Asserted: passes — The authors put it forward as true.
- Checkable: passes — It can be checked against evidence.
- Load-bearing: passes — The paper’s conclusions depend on it.
- Based: passes — The paper gives a reason why it holds.
A result the paper reports from its own data — it cites no other source for it, so there is none to check. The quote shows it is in the paper.
In the paper
“MommeD8 maps to a 4 Mb region on chromosome 4 between markers rs6337795 and D4Mit279 (using 234 phenotypically mutant and 177 phenotypically wild-type mice).”
§ A genome-wide screen for modifiers of transgene variegation identifies genes with critical roles in development > Results and discussion > Mapping
plainn = 177- Asserted: passes — The authors put it forward as true.
- Checkable: passes — It can be checked against evidence.
- Load-bearing: unclear — It is unclear whether the paper’s conclusions depend on it.
- Based: passes — The paper gives a reason why it holds.
A result the paper reports from its own data — it cites no other source for it, so there is none to check. The quote shows it is in the paper.
In the paper
“MommeD7 maps to a 0.25 Mb region on chromosome 7 between markers D7Mit220 and rs13479441 (using 134 phenotypically mutant and 135 phenotypically wild-type mice).”
§ A genome-wide screen for modifiers of transgene variegation identifies genes with critical roles in development > Results and discussion > Mapping
plainn = 135- Asserted: passes — The authors put it forward as true.
- Checkable: passes — It can be checked against evidence.
- Load-bearing: unclear — It is unclear whether the paper’s conclusions depend on it.
- Based: passes — The paper gives a reason why it holds.
A result the paper reports from its own data — it cites no other source for it, so there is none to check. The quote shows it is in the paper.
In the paper
“Following MommeD7-/+ intercrosses (genotypes determined by GFP fluorescence and progeny testing), a small but significant increase in abnormal embryos was detected at 14.5 dpc (Table 3).”
§ A genome-wide screen for modifiers of transgene variegation identifies genes with critical roles in development > Results and discussion > Homozygous lethality occurs at different stages of development
plaindirect- Asserted: passes — The authors put it forward as true.
- Checkable: passes — It can be checked against evidence.
- Load-bearing: passes — The paper’s conclusions depend on it.
- Based: passes — The paper gives a reason why it holds.
A result the paper reports from its own data — it cites no other source for it, so there is none to check. The quote shows it is in the paper.
In the paper
“Under these conditions, wild-type mice homozygous for the transgene express GFP in 55% of erythrocytes.”
§ A genome-wide screen for modifiers of transgene variegation identifies genes with critical roles in development > Results and discussion > The identification of MommeD7-D10
plain- Asserted: passes — The authors put it forward as true.
- Checkable: passes — It can be checked against evidence.
- Load-bearing: passes — The paper’s conclusions depend on it.
- Based: passes — The paper gives a reason why it holds.
A result the paper reports from its own data — it cites no other source for it, so there is none to check. The quote shows it is in the paper.
In the paper
“This region contains 80 genes.”
§ A genome-wide screen for modifiers of transgene variegation identifies genes with critical roles in development > Results and discussion > Mapping
plain- Asserted: passes — The authors put it forward as true.
- Checkable: passes — It can be checked against evidence.
- Load-bearing: unclear — It is unclear whether the paper’s conclusions depend on it.
- Based: passes — The paper gives a reason why it holds.
A result the paper reports from its own data — it cites no other source for it, so there is none to check. The quote shows it is in the paper.
In the paper
“Results obtained for MommeD6 (genotypes determined by GFP fluorescence and progeny testing) were similar (Table 3), suggesting MommeD6-/- embryos arrest around 8-9 dpc.”
§ A genome-wide screen for modifiers of transgene variegation identifies genes with critical roles in development > Results and discussion > Homozygous lethality occurs at different stages of development
hedged- Asserted: passes — The authors put it forward as true.
- Checkable: passes — It can be checked against evidence.
- Load-bearing: passes — The paper’s conclusions depend on it.
- Based: passes — The paper gives a reason why it holds.
A result the paper reports from its own data — it cites no other source for it, so there is none to check. The quote shows it is in the paper.
In the paper
“So in all ten MommeDs produced so far, homozygosity for the mutation is associated with embryonic or perinatal lethality (Tables 3 and 4).”
§ A genome-wide screen for modifiers of transgene variegation identifies genes with critical roles in development > Results and discussion > Homozygous lethality occurs at different stages of development
plaincorrelational- Asserted: passes — The authors put it forward as true.
- Checkable: passes — It can be checked against evidence.
- Load-bearing: passes — The paper’s conclusions depend on it.
- Based: passes — The paper gives a reason why it holds.
A result the paper reports from its own data — it cites no other source for it, so there is none to check. The quote shows it is in the paper.
In the paper
“These data suggest MommeD3-/- mice were dying at or before 14.5 dpc.”
§ A genome-wide screen for modifiers of transgene variegation identifies genes with critical roles in development > Results and discussion > Homozygous lethality occurs at different stages of development
hedged- Asserted: passes — The authors put it forward as true.
- Checkable: passes — It can be checked against evidence.
- Load-bearing: passes — The paper’s conclusions depend on it.
- Based: passes — The paper gives a reason why it holds.
A result the paper reports from its own data — it cites no other source for it, so there is none to check. The quote shows it is in the paper.
In the paper
“MommeD9 maps to a 3 Mb region on chromosome 7 between markers rs31712695 and rs6193818 (using 103 phenotypically mutant and 127 phenotypically wild-type mice).”
§ A genome-wide screen for modifiers of transgene variegation identifies genes with critical roles in development > Results and discussion > Mapping
plainn = 127- Asserted: passes — The authors put it forward as true.
- Checkable: passes — It can be checked against evidence.
- Load-bearing: unclear — It is unclear whether the paper’s conclusions depend on it.
- Based: passes — The paper gives a reason why it holds.
A result the paper reports from its own data — it cites no other source for it, so there is none to check. The quote shows it is in the paper.
In the paper
“This increase is not enough to account for all expected MommeD7-/- mice.”
§ A genome-wide screen for modifiers of transgene variegation identifies genes with critical roles in development > Results and discussion > Homozygous lethality occurs at different stages of development
plain- Asserted: passes — The authors put it forward as true.
- Checkable: passes — It can be checked against evidence.
- Load-bearing: passes — The paper’s conclusions depend on it.
- Based: passes — The paper gives a reason why it holds.
A result the paper reports from its own data — it cites no other source for it, so there is none to check. The quote shows it is in the paper.
In the paper
“These embryos were genotyped and found to be MommeD5-/- in all cases, indicating developmental arrest at around 8-9 dpc.”
§ A genome-wide screen for modifiers of transgene variegation identifies genes with critical roles in development > Results and discussion > Homozygous lethality occurs at different stages of development
hedged- Asserted: passes — The authors put it forward as true.
- Checkable: passes — It can be checked against evidence.
- Load-bearing: passes — The paper’s conclusions depend on it.
- Based: passes — The paper gives a reason why it holds.
A result the paper reports from its own data — it cites no other source for it, so there is none to check. The quote shows it is in the paper.
In the paper
“Following MommeD8-/+ intercrosses, dissections at 14.5 dpc showed no increase in the number of abnormal or resorbed embryos (Table 3).”
§ A genome-wide screen for modifiers of transgene variegation identifies genes with critical roles in development > Results and discussion > Homozygous lethality occurs at different stages of development
plain- Asserted: passes — The authors put it forward as true.
- Checkable: passes — It can be checked against evidence.
- Load-bearing: passes — The paper’s conclusions depend on it.
- Based: passes — The paper gives a reason why it holds.
A result the paper reports from its own data — it cites no other source for it, so there is none to check. The quote shows it is in the paper.
In the paper
“MommeD10 maps to a 4 Mb region between markers D5Mit165 and rs13478547 on chromosome 5.”
§ A genome-wide screen for modifiers of transgene variegation identifies genes with critical roles in development > Results and discussion > Mapping
plain- Asserted: passes — The authors put it forward as true.
- Checkable: passes — It can be checked against evidence.
- Load-bearing: unclear — It is unclear whether the paper’s conclusions depend on it.
- Based: passes — The paper gives a reason why it holds.
The paper states this without a source or data behind it here, so there is nothing to check it against. The quote shows it is in the paper.
In the paper
“In this case, the probability of a second point mutation occurring in the coding region is p < 0.0005.”
§ A genome-wide screen for modifiers of transgene variegation identifies genes with critical roles in development > Results and discussion > MommeD5 has a mutation in Histone deacetylase 1
plain- Asserted: passes — The authors put it forward as true.
- Checkable: passes — It can be checked against evidence.
- Load-bearing: passes — The paper’s conclusions depend on it.
- Based: passes — The paper gives a reason why it holds.
A result the paper reports from its own data — it cites no other source for it, so there is none to check. The quote shows it is in the paper.
In the paper
“This region contains 54 genes.”
§ A genome-wide screen for modifiers of transgene variegation identifies genes with critical roles in development > Results and discussion > Mapping
plainn = 177- Asserted: passes — The authors put it forward as true.
- Checkable: passes — It can be checked against evidence.
- Load-bearing: unclear — It is unclear whether the paper’s conclusions depend on it.
- Based: passes — The paper gives a reason why it holds.
A result the paper reports from its own data — it cites no other source for it, so there is none to check. The quote shows it is in the paper.
In the paper
“However, in the case of MommeD7 the level was more than double that seen in the wild-type littermates.”
§ A genome-wide screen for modifiers of transgene variegation identifies genes with critical roles in development > Results and discussion > The identification of MommeD7-D10
plaincorrelationalSingle case- Asserted: passes — The authors put it forward as true.
- Checkable: passes — It can be checked against evidence.
- Load-bearing: unclear — It is unclear whether the paper’s conclusions depend on it.
- Based: passes — The paper gives a reason why it holds.
A result the paper reports from its own data — it cites no other source for it, so there is none to check. The quote shows it is in the paper.
In the paper
“An antibody that recognizes the amino terminus of Hdac1 showed that the levels of the protein are not altered between mutant and wild-type mice (Figure 5b).”
§ A genome-wide screen for modifiers of transgene variegation identifies genes with critical roles in development > Results and discussion > MommeD5 has a mutation in Histone deacetylase 1
plain- Asserted: passes — The authors put it forward as true.
- Checkable: passes — It can be checked against evidence.
- Load-bearing: passes — The paper’s conclusions depend on it.
- Based: passes — The paper gives a reason why it holds.
The paper states this without a source or data behind it here, so there is nothing to check it against. The quote shows it is in the paper.
In the paper
“Dissections following MommeD9-/+ (determined by GFP fluorescence and progeny testing) intercrosses revealed a pattern similar to that seen for MommeD5 and MommeD6, suggesting MommeD9-/- embryos arrest before 9.5 dpc (Table 3).”
§ A genome-wide screen for modifiers of transgene variegation identifies genes with critical roles in development > Results and discussion > Homozygous lethality occurs at different stages of development
hedgeddirect- Asserted: passes — The authors put it forward as true.
- Checkable: passes — It can be checked against evidence.
- Load-bearing: passes — The paper’s conclusions depend on it.
- Based: passes — The paper gives a reason why it holds.
A result the paper reports from its own data — it cites no other source for it, so there is none to check. The quote shows it is in the paper.
In the paper
“We have now screened an additional 400 G1 offspring and recovered four more Mommes, MommeD7-D10 (Figure 1, Table 1).”
§ A genome-wide screen for modifiers of transgene variegation identifies genes with critical roles in development > Results and discussion > The identification of MommeD7-D10
plain- Asserted: passes — The authors put it forward as true.
- Checkable: passes — It can be checked against evidence.
- Load-bearing: unclear — It is unclear whether the paper’s conclusions depend on it.
- Based: passes — The paper gives a reason why it holds.
A result the paper reports from its own data — it cites no other source for it, so there is none to check. The quote shows it is in the paper.
In the paper
“MommeD10 was localized to a 4 Mb region on chromosome 5 flanked by the markers D5Mit165 and rs32250347 (Table 4).”
§ A genome-wide screen for modifiers of transgene variegation identifies genes with critical roles in development > Results and discussion > MommeD10 has a mutation in Baz1b
plaincorrelational- Asserted: passes — The authors put it forward as true.
- Checkable: passes — It can be checked against evidence.
- Load-bearing: passes — The paper’s conclusions depend on it.
- Based: passes — The paper gives a reason why it holds.
A result the paper reports from its own data — it cites no other source for it, so there is none to check. The quote shows it is in the paper.
In the paper
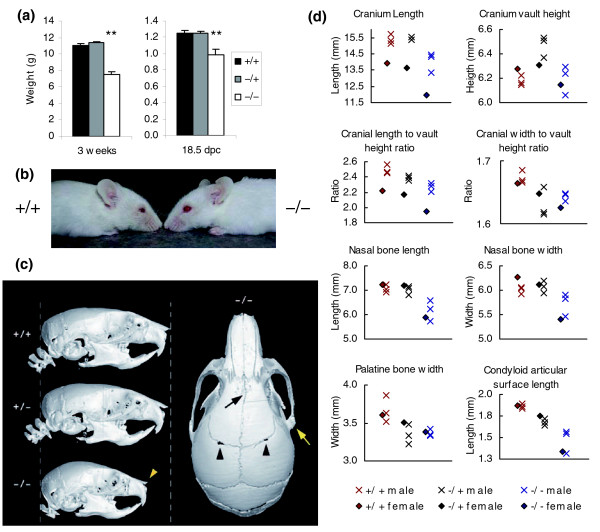
“Surviving MommeD10 homozygotes were significantly smaller than littermates at weaning (Student's t-test, p < 0.0001; Figure 8a).”
§ A genome-wide screen for modifiers of transgene variegation identifies genes with critical roles in development > Results and discussion > Craniofacial analysis of MommeD10 mice
plain- Asserted: passes — The authors put it forward as true.
- Checkable: passes — It can be checked against evidence.
- Load-bearing: unclear — It is unclear whether the paper’s conclusions depend on it.
- Based: passes — The paper gives a reason why it holds.
A result the paper reports from its own data — it cites no other source for it, so there is none to check. The quote shows it is in the paper.
In the paper
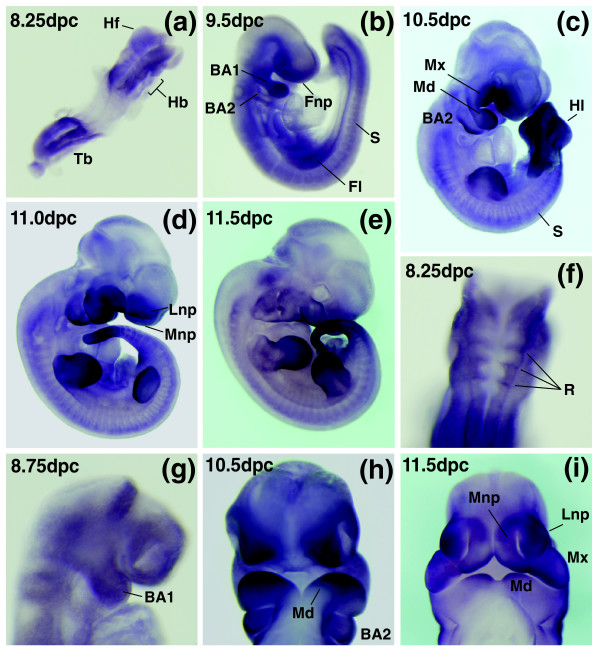
“Baz1b is expressed strongly in all the major facial primordia from early in embryogenesis.”
§ A genome-wide screen for modifiers of transgene variegation identifies genes with critical roles in development > Results and discussion > Expression of Baz1b during mouse embryogenesis
boosted- Asserted: passes — The authors put it forward as true.
- Checkable: passes — It can be checked against evidence.
- Load-bearing: unclear — It is unclear whether the paper’s conclusions depend on it.
- Based: passes — The paper gives a reason why it holds.
A result the paper reports from its own data — it cites no other source for it, so there is none to check. The quote shows it is in the paper.
In the paper
“Measurements of the lower jaw revealed relative mandibular hypoplasia in homozygotes that was most pronounced in the posterior region (approximately 20% reduction), encompassing the condyle, angle and coronoid processes (Figure 8d and Additional data file 1).”
§ A genome-wide screen for modifiers of transgene variegation identifies genes with critical roles in development > Results and discussion > Craniofacial analysis of MommeD10 mice
plain- Asserted: passes — The authors put it forward as true.
- Checkable: passes — It can be checked against evidence.
- Load-bearing: passes — The paper’s conclusions depend on it.
- Based: passes — The paper gives a reason why it holds.
A result the paper reports from its own data — it cites no other source for it, so there is none to check. The quote shows it is in the paper.
In the paper
“Baz1b is also expressed in the frontonasal process (Figure 9b) and later in the mesenchyme of both the medial and lateral nasal prominences as they elevate to surround the nasal pits (Figure 9c, d, h, i).”
§ A genome-wide screen for modifiers of transgene variegation identifies genes with critical roles in development > Results and discussion > Expression of Baz1b during mouse embryogenesis
plain- Asserted: passes — The authors put it forward as true.
- Checkable: passes — It can be checked against evidence.
- Load-bearing: unclear — It is unclear whether the paper’s conclusions depend on it.
- Based: passes — The paper gives a reason why it holds.
A result the paper reports from its own data — it cites no other source for it, so there is none to check. The quote shows it is in the paper.
In the paper
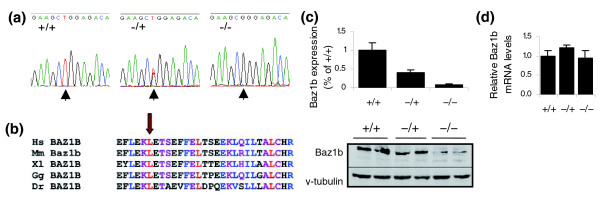
“Sequencing of all exons, including exon/intron boundaries, from two homozygous, one heterozygous and one wild-type individual revealed one point mutation (T → G transversion) in exon 7 in the mutants (Figure 6a).”
§ A genome-wide screen for modifiers of transgene variegation identifies genes with critical roles in development > Results and discussion > MommeD10 has a mutation in Baz1b
plain- Asserted: passes — The authors put it forward as true.
- Checkable: passes — It can be checked against evidence.
- Load-bearing: passes — The paper’s conclusions depend on it.
- Based: passes — The paper gives a reason why it holds.
A result the paper reports from its own data — it cites no other source for it, so there is none to check. The quote shows it is in the paper.
In the paper
“Quantitative real-time PCR performed on cDNA from 14.5 dpc embryos showed all three genotypes have similar levels of mRNA (Figure 6d).”
§ A genome-wide screen for modifiers of transgene variegation identifies genes with critical roles in development > Results and discussion > MommeD10 has a mutation in Baz1b
plain- Asserted: passes — The authors put it forward as true.
- Checkable: passes — It can be checked against evidence.
- Load-bearing: passes — The paper’s conclusions depend on it.
- Based: passes — The paper gives a reason why it holds.
A result the paper reports from its own data — it cites no other source for it, so there is none to check. The quote shows it is in the paper.
In the paper
“Heterozygotes also had a decreased cranium width:height ratio (Student's t-test, p < 0.05) and decreased length:height ratio (Student's t-test, p < 0.05) compared to wild-type skulls.”
§ A genome-wide screen for modifiers of transgene variegation identifies genes with critical roles in development > Results and discussion > Craniofacial analysis of MommeD10 mice
plaincorrelational- Asserted: passes — The authors put it forward as true.
- Checkable: passes — It can be checked against evidence.
- Load-bearing: unclear — It is unclear whether the paper’s conclusions depend on it.
- Based: passes — The paper gives a reason why it holds.
None of the sources cited for this claim have been checked yet.
In the paper
“The chance of a second point mutation occurring in a coding region in this linked interval is extremely small (p = 0.0008, based on a mutation rate of 1 in 1.82 Mb) [15-17].”
§ A genome-wide screen for modifiers of transgene variegation identifies genes with critical roles in development > Results and discussion > A possible role for Baz1b in Williams syndrome
What the sources say
- Not checked yetcites [15] Keays DA, Clark TG, Campbell TG, Broxholme J, Valdar W: Estimating the number of coding mutations in genotypic and phenotypic driven N-ethyl-N-nitrosourea (ENU) screens: revisited. Mamm Genome. 2007, 18: 123-124. 10.1007/s00335-006-0065-z. source
- Not checked yetcites [16] Keays DA, Clark TG, Flint J: Estimating the number of coding mutations in genotypic- and phenotypic-driven N-ethyl-N-nitrosourea (ENU) screens. Mamm Genome. 2006, 17: 230-238. 10.1007/s00335-005-0101-4. source
- Not checked yetcites [17] Estimating the probability of ENU-induced coding mutations. [http://www.well.ox.ac.uk/enuMutRat]
plain- Asserted: passes — The authors put it forward as true.
- Checkable: passes — It can be checked against evidence.
- Load-bearing: passes — The paper’s conclusions depend on it.
- Based: passes — The paper gives a reason why it holds.
A result the paper reports from its own data — it cites no other source for it, so there is none to check. The quote shows it is in the paper.
In the paper
“Much of this difference could be attributed to reduction of the parietal and nasal bones (both > 12.5% shorter in homozygotes compared to an overall mean length and width reduction of approximately 9%).”
§ A genome-wide screen for modifiers of transgene variegation identifies genes with critical roles in development > Results and discussion > Craniofacial analysis of MommeD10 mice
hedgedconditional- Asserted: passes — The authors put it forward as true.
- Checkable: passes — It can be checked against evidence.
- Load-bearing: unclear — It is unclear whether the paper’s conclusions depend on it.
- Based: passes — The paper gives a reason why it holds.
A result the paper reports from its own data — it cites no other source for it, so there is none to check. The quote shows it is in the paper.
In the paper
“MommeD10 homozygotes also appeared to have widened, bulbous foreheads and shortened snouts (Figure 8b).”
§ A genome-wide screen for modifiers of transgene variegation identifies genes with critical roles in development > Results and discussion > Craniofacial analysis of MommeD10 mice
hedged- Asserted: passes — The authors put it forward as true.
- Checkable: passes — It can be checked against evidence.
- Load-bearing: unclear — It is unclear whether the paper’s conclusions depend on it.
- Based: passes — The paper gives a reason why it holds.
A result the paper reports from its own data — it cites no other source for it, so there is none to check. The quote shows it is in the paper.
In the paper
“We have gone on to characterize the expression of Baz1b in more detail, and show that at 8.25 dpc Baz1b is expressed in the headfolds, the caudal tail bud region and the presumptive hindbrain in a pattern reminiscent of rhombomere staining (Figure 9a, f).”
§ A genome-wide screen for modifiers of transgene variegation identifies genes with critical roles in development > Results and discussion > Expression of Baz1b during mouse embryogenesis
plain- Asserted: passes — The authors put it forward as true.
- Checkable: passes — It can be checked against evidence.
- Load-bearing: unclear — It is unclear whether the paper’s conclusions depend on it.
- Based: passes — The paper gives a reason why it holds.
A result the paper reports from its own data — it cites no other source for it, so there is none to check. The quote shows it is in the paper.
In the paper
“The posterior aspects of the mandibles of heterozygotes were also reduced in size when compared to wild-type mandibles, albeit to a lesser degree than in the homozygotes.”
§ A genome-wide screen for modifiers of transgene variegation identifies genes with critical roles in development > Results and discussion > Craniofacial analysis of MommeD10 mice
plaincorrelational- Asserted: passes — The authors put it forward as true.
- Checkable: passes — It can be checked against evidence.
- Load-bearing: unclear — It is unclear whether the paper’s conclusions depend on it.
- Based: passes — The paper gives a reason why it holds.
A result the paper reports from its own data — it cites no other source for it, so there is none to check. The quote shows it is in the paper.
In the paper
“A similar size differential was evident in utero at 18.5dpc (Student's t-test, p < 0.01)”
§ A genome-wide screen for modifiers of transgene variegation identifies genes with critical roles in development > Results and discussion > Craniofacial analysis of MommeD10 mice
plain- Asserted: passes — The authors put it forward as true.
- Checkable: passes — It can be checked against evidence.
- Load-bearing: unclear — It is unclear whether the paper’s conclusions depend on it.
- Based: passes — The paper gives a reason why it holds.
A result the paper reports from its own data — it cites no other source for it, so there is none to check. The quote shows it is in the paper.
In the paper
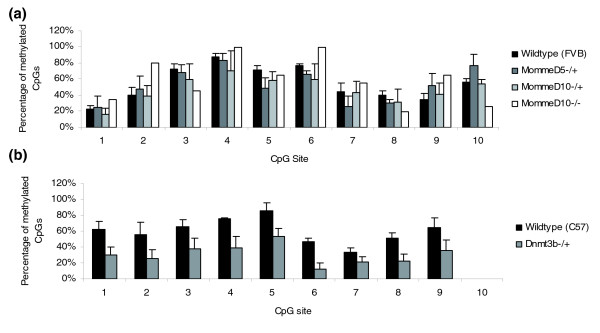
“The percentage of methylated CpGs in the HS-40 element was approximately 55% (averaged across all clones) in spleen from 4-week-old wild-type FVB/NJ mice (Figure 7a).”
§ A genome-wide screen for modifiers of transgene variegation identifies genes with critical roles in development > Results and discussion > Effects of MommeD5 and MommeD10 on DNA methylation at the transgene locus
plain- Asserted: passes — The authors put it forward as true.
- Checkable: passes — It can be checked against evidence.
- Load-bearing: unclear — It is unclear whether the paper’s conclusions depend on it.
- Based: passes — The paper gives a reason why it holds.
A result the paper reports from its own data — it cites no other source for it, so there is none to check. The quote shows it is in the paper.
In the paper
“Of note, heterozygotes showed a reduction in palatine bone width of similar magnitude to that seen in homozygotes”
§ A genome-wide screen for modifiers of transgene variegation identifies genes with critical roles in development > Results and discussion > Craniofacial analysis of MommeD10 mice
plaincorrelational- Asserted: passes — The authors put it forward as true.
- Checkable: passes — It can be checked against evidence.
- Load-bearing: passes — The paper’s conclusions depend on it.
- Based: passes — The paper gives a reason why it holds.
A result the paper reports from its own data — it cites no other source for it, so there is none to check. The quote shows it is in the paper.
In the paper
“The mutation results in a non-conservative amino acid change, L733R, in a highly conserved region of the protein (Figure 6b).”
§ A genome-wide screen for modifiers of transgene variegation identifies genes with critical roles in development > Results and discussion > MommeD10 has a mutation in Baz1b
plain- Asserted: passes — The authors put it forward as true.
- Checkable: passes — It can be checked against evidence.
- Load-bearing: unclear — It is unclear whether the paper’s conclusions depend on it.
- Based: passes — The paper gives a reason why it holds.
A result the paper reports from its own data — it cites no other source for it, so there is none to check. The quote shows it is in the paper.
In the paper
“Heterozygotes also had a decreased cranium width:height ratio (Student's t-test, p < 0.05) and decreased length:height ratio (Student's t-test, p < 0.05) compared to wild-type skulls.”
§ A genome-wide screen for modifiers of transgene variegation identifies genes with critical roles in development > Results and discussion > Craniofacial analysis of MommeD10 mice
plaincorrelational- Asserted: passes — The authors put it forward as true.
- Checkable: passes — It can be checked against evidence.
- Load-bearing: unclear — It is unclear whether the paper’s conclusions depend on it.
- Based: passes — The paper gives a reason why it holds.
A result the paper reports from its own data — it cites no other source for it, so there is none to check. The quote shows it is in the paper.
In the paper
“Interestingly, this interval encompasses the region syntenic with the Williams Beuren syndrome (WBS) critical region in humans.”
§ A genome-wide screen for modifiers of transgene variegation identifies genes with critical roles in development > Results and discussion > MommeD10 has a mutation in Baz1b
plaincorrelational- Asserted: passes — The authors put it forward as true.
- Checkable: passes — It can be checked against evidence.
- Load-bearing: unclear — It is unclear whether the paper’s conclusions depend on it.
- Based: passes — The paper gives a reason why it holds.
A result the paper reports from its own data — it cites no other source for it, so there is none to check. The quote shows it is in the paper.
In the paper
“Samples from MommeD5-/+, MommeD10-/+, and MommeD10-/- mice showed similar levels of CpG methylation (52%, 47%, 59% respectively; Figure 7a).”
§ A genome-wide screen for modifiers of transgene variegation identifies genes with critical roles in development > Results and discussion > Effects of MommeD5 and MommeD10 on DNA methylation at the transgene locus
plain- Asserted: passes — The authors put it forward as true.
- Checkable: passes — It can be checked against evidence.
- Load-bearing: passes — The paper’s conclusions depend on it.
- Based: passes — The paper gives a reason why it holds.
A result the paper reports from its own data — it cites no other source for it, so there is none to check. The quote shows it is in the paper.
In the paper
“Significantly, some craniofacial features are also apparent in heterozygotes.”
§ A genome-wide screen for modifiers of transgene variegation identifies genes with critical roles in development > Results and discussion > A possible role for Baz1b in Williams syndrome
plain- Asserted: passes — The authors put it forward as true.
- Checkable: passes — It can be checked against evidence.
- Load-bearing: passes — The paper’s conclusions depend on it.
- Based: passes — The paper gives a reason why it holds.
The paper states this without a source or data behind it here, so there is nothing to check it against. The quote shows it is in the paper.
In the paper
“In the case of Baz1b this is the first report of a mouse carrying a disrupted allele at this locus”
§ A genome-wide screen for modifiers of transgene variegation identifies genes with critical roles in development > Conclusion
plainSingle case- Asserted: passes — The authors put it forward as true.
- Checkable: passes — It can be checked against evidence.
- Load-bearing: unclear — It is unclear whether the paper’s conclusions depend on it.
- Based: passes — The paper gives a reason why it holds.
A result the paper reports from its own data — it cites no other source for it, so there is none to check. The quote shows it is in the paper.
In the paper
“Recombination events allowed the linked region to be localized to a small genomic interval.”
§ A genome-wide screen for modifiers of transgene variegation identifies genes with critical roles in development > Materials and methods > Linkage analysis
plaindirectn = 337- Asserted: passes — The authors put it forward as true.
- Checkable: passes — It can be checked against evidence.
- Load-bearing: passes — The paper’s conclusions depend on it.
- Based: passes — The paper gives a reason why it holds.
A result the paper reports from its own data — it cites no other source for it, so there is none to check. The quote shows it is in the paper.
In the paper
“Our studies show that the chromatin remodeler Baz1b is expressed strongly in cranial neural crest-derived mesenchyme that drives facial morphogenesis”
§ A genome-wide screen for modifiers of transgene variegation identifies genes with critical roles in development > Results and discussion > A possible role for Baz1b in Williams syndrome
boosted- Asserted: passes — The authors put it forward as true.
- Checkable: passes — It can be checked against evidence.
- Load-bearing: passes — The paper’s conclusions depend on it.
- Based: passes — The paper gives a reason why it holds.
A result the paper reports from its own data — it cites no other source for it, so there is none to check. The quote shows it is in the paper.
In the paper
“Since then we have identified the underlying mutation in three cases, MommeD1, MommeD2 and MommeD4.”
§ A genome-wide screen for modifiers of transgene variegation identifies genes with critical roles in development > Background
plainn = 3- Asserted: passes — The authors put it forward as true.
- Checkable: passes — It can be checked against evidence.
- Load-bearing: unclear — It is unclear whether the paper’s conclusions depend on it.
- Based: passes — The paper gives a reason why it holds.
In the paper
“Recently, we established a similar screen in the mouse using a transgenic line that expresses green fluorescent protein (GFP) in a variegated manner in erythrocytes [10].”
§ A genome-wide screen for modifiers of transgene variegation identifies genes with critical roles in development > Background
What the sources say
- Not checked yetcites [10] Blewitt ME, Vickaryous NK, Hemley SJ, Ashe A, Bruxner TJ, Preis JI, Arkell R, Whitelaw E: An N-ethyl-N-nitrosourea screen for genes involved in variegation in the mouse. Proc Natl Acad Sci USA. 2005, 102: 7629-7634. 10.1073/pnas.0409375102. source
plain- Asserted: passes — The authors put it forward as true.
- Checkable: passes — It can be checked against evidence.
- Load-bearing: passes — The paper’s conclusions depend on it.
- Based: passes — The paper gives a reason why it holds.
In the paper
“We have previously reported that the GFP transgene used in this screen has integrated as an approximately 11 copy array on chromosome 1 [10].”
§ A genome-wide screen for modifiers of transgene variegation identifies genes with critical roles in development > Results and discussion > Integration site of the GFP transgene
What the sources say
- Not checked yetcites [10] Blewitt ME, Vickaryous NK, Hemley SJ, Ashe A, Bruxner TJ, Preis JI, Arkell R, Whitelaw E: An N-ethyl-N-nitrosourea screen for genes involved in variegation in the mouse. Proc Natl Acad Sci USA. 2005, 102: 7629-7634. 10.1073/pnas.0409375102. source
plainSingle case- Asserted: passes — The authors put it forward as true.
- Checkable: passes — It can be checked against evidence.
- Load-bearing: unclear — It is unclear whether the paper’s conclusions depend on it.
- Based: passes — The paper gives a reason why it holds.
A conclusion the paper draws from its own results — it cites no other source for it, so there is none to check. The quote shows it is in the paper.
In the paper
“The finding of Dnmt1 and Smarca5, both known to be involved in epigenetic reprogramming, validates the screen.”
§ A genome-wide screen for modifiers of transgene variegation identifies genes with critical roles in development > Background
boosteddirect- Asserted: passes — The authors put it forward as true.
- Checkable: passes — It can be checked against evidence.
- Load-bearing: passes — The paper’s conclusions depend on it.
- Based: passes — The paper gives a reason why it holds.
None of the sources cited for this claim have been checked yet.
In the paper
“The screens used a fly strain, called wv, that displays variegated expression of the white (w) locus resulting in red and white patches in the eye.”
§ A genome-wide screen for modifiers of transgene variegation identifies genes with critical roles in development > Background
What the sources say
- Not checked yetcites [1] Henikoff S: Position-effect variegation after 60 years. Trends Genet. 1990, 6: 422-426. 10.1016/0168-9525(90)90304-O. source
- Not checked yetcites [2] Spofford JB: Parental control of position-effect variegation. II. Effect of sex of parent contributing white-mottled rearrangement in Drosophila melanogaster. Genetics. 1961, 46: 1151-1167. source
plaindirect- Asserted: passes — The authors put it forward as true.
- Checkable: passes — It can be checked against evidence.
- Load-bearing: passes — The paper’s conclusions depend on it.
- Based: passes — The paper gives a reason why it holds.
A conclusion the paper draws from its own results — it cites no other source for it, so there is none to check. The quote shows it is in the paper.
In the paper
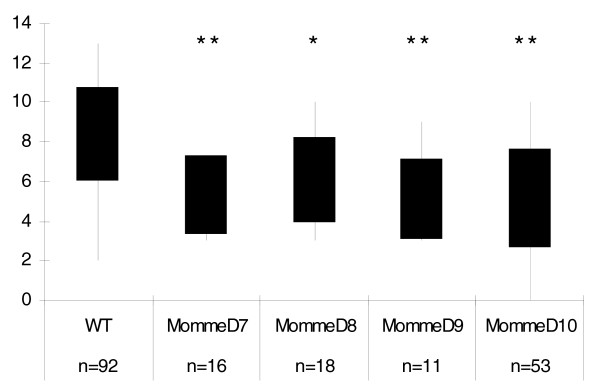
“Following heterozygous intercrosses, the proportion of expression types observed in the offspring at weaning was consistent with a semidominant homozygous lethal mutation in the cases of MommeD7 and MommeD9, since only two GFP expression profiles were observed (Figure 1, Tables 1 and 2) and there was a significant litter size reduction in both cases (Figure 2).”
§ A genome-wide screen for modifiers of transgene variegation identifies genes with critical roles in development > Results and discussion > Homozygous lethality
plaincorrelational- Asserted: passes — The authors put it forward as true.
- Checkable: passes — It can be checked against evidence.
- Load-bearing: passes — The paper’s conclusions depend on it.
- Based: passes — The paper gives a reason why it holds.
A conclusion the paper draws from its own results — it cites no other source for it, so there is none to check. The quote shows it is in the paper.
In the paper
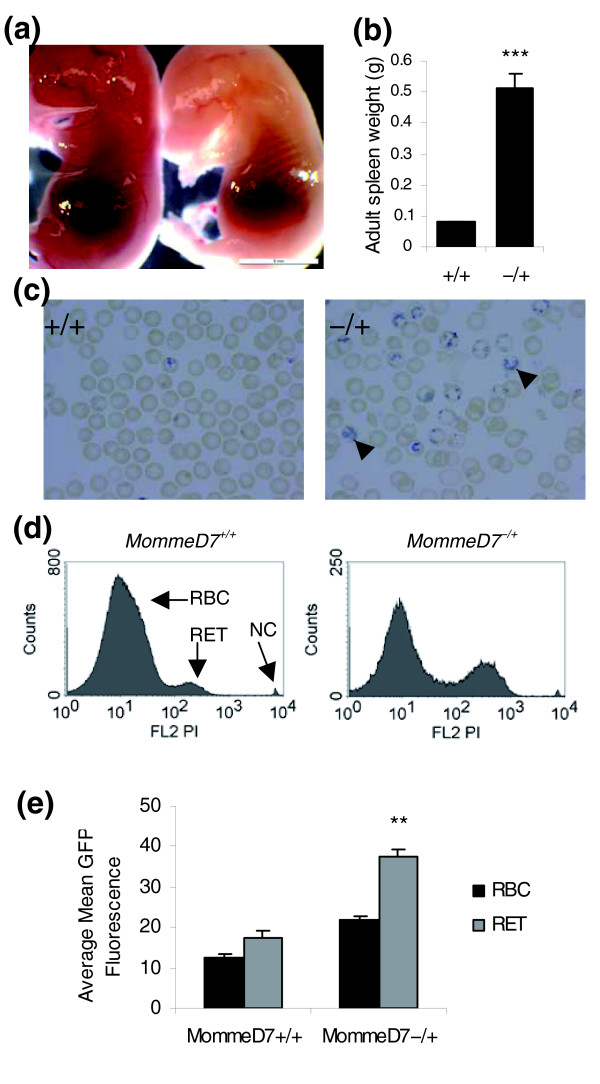
“This is consistent with the idea that a change in the erythroid cell populations contributes to the dramatic increase in the average fluorescence level of the GFP transgene in MommeD7-/+ mice.”
§ A genome-wide screen for modifiers of transgene variegation identifies genes with critical roles in development > Results and discussion > Homozygous lethality occurs at different stages of development
hedgedconditional- Asserted: passes — The authors put it forward as true.
- Checkable: passes — It can be checked against evidence.
- Load-bearing: passes — The paper’s conclusions depend on it.
- Based: passes — The paper gives a reason why it holds.
In the paper
“MommeD5 was localized to a 1.42 Mb region on chromosome 4 flanked by the markers rs27486641 and rs27541967 [10] (Table 4).”
§ A genome-wide screen for modifiers of transgene variegation identifies genes with critical roles in development > Results and discussion > MommeD5 has a mutation in Histone deacetylase 1
What the sources say
- Not checked yetcites [10] Blewitt ME, Vickaryous NK, Hemley SJ, Ashe A, Bruxner TJ, Preis JI, Arkell R, Whitelaw E: An N-ethyl-N-nitrosourea screen for genes involved in variegation in the mouse. Proc Natl Acad Sci USA. 2005, 102: 7629-7634. 10.1073/pnas.0409375102. source
plain- Asserted: passes — The authors put it forward as true.
- Checkable: passes — It can be checked against evidence.
- Load-bearing: passes — The paper’s conclusions depend on it.
- Based: passes — The paper gives a reason why it holds.
What the paper did — it cites no source for this, so there is none to check. The quote shows it is in the paper.
In the paper
“This mutation was subsequently verified in over 100 mice classified as mutants by GFP expression profiling.”
§ A genome-wide screen for modifiers of transgene variegation identifies genes with critical roles in development > Results and discussion > MommeD5 has a mutation in Histone deacetylase 1
plainn = 100- Asserted: passes — The authors put it forward as true.
- Checkable: passes — It can be checked against evidence.
- Load-bearing: passes — The paper’s conclusions depend on it.
- Based: passes — The paper gives a reason why it holds.
What the paper did — it cites no source for this, so there is none to check. The quote shows it is in the paper.
In the paper
“For each MommeD, the heritability of the mutation has been tested and confirmed over at least 5 generations by using at least 30 litters.”
§ A genome-wide screen for modifiers of transgene variegation identifies genes with critical roles in development > Results and discussion > The identification of MommeD7-D10
plain- Asserted: passes — The authors put it forward as true.
- Checkable: passes — It can be checked against evidence.
- Load-bearing: passes — The paper’s conclusions depend on it.
- Based: passes — The paper gives a reason why it holds.
In the paper
“Lysine 476 at the carboxyl terminus has been shown to be sumoylated and important for enzymatic function of the wild-type protein [20] and the absence of this amino acid in the MommeD5 mutant protein is likely to impair function.”
§ A genome-wide screen for modifiers of transgene variegation identifies genes with critical roles in development > Results and discussion > MommeD5 has a mutation in Histone deacetylase 1
What the sources say
- Not checked yetcites [20] David G, Neptune MA, DePinho RA: SUMO-1 modification of histone deacetylase 1 (HDAC1) modulates its biological activities. J Biol Chem. 2002, 277: 23658-23663. 10.1074/jbc.M203690200. source
hedgedconditional- Asserted: passes — The authors put it forward as true.
- Checkable: passes — It can be checked against evidence.
- Load-bearing: passes — The paper’s conclusions depend on it.
- Based: passes — The paper gives a reason why it holds.
A conclusion the paper draws from its own results — it cites no other source for it, so there is none to check. The quote shows it is in the paper.
In the paper
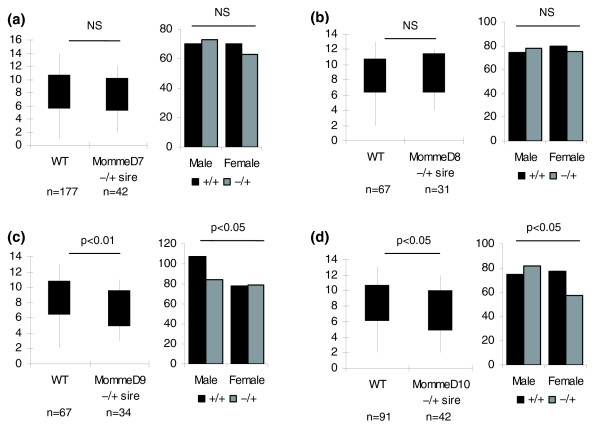
“These two cases of transmission ratio distortion have not been investigated further but they do suggest that heterozygosity for the MommeD mutations is associated with some level of disadvantage.”
§ A genome-wide screen for modifiers of transgene variegation identifies genes with critical roles in development > Results and discussion > Abnormal phenotypes associated with heterozygosity for MommeD7-D10
hedgedcorrelationaln = 2 ·- Asserted: passes — The authors put it forward as true.
- Checkable: passes — It can be checked against evidence.
- Load-bearing: unclear — It is unclear whether the paper’s conclusions depend on it.
- Based: passes — The paper gives a reason why it holds.
A conclusion the paper draws from its own results — it cites no other source for it, so there is none to check. The quote shows it is in the paper.
In the paper
“These data suggest that MommeD5 and MommeD10 mutants alter the expression of the transgene by changing the chromatin state rather than by altering DNA methylation levels.”
§ A genome-wide screen for modifiers of transgene variegation identifies genes with critical roles in development > Results and discussion > Effects of MommeD5 and MommeD10 on DNA methylation at the transgene locus
hedgeddirect- Asserted: passes — The authors put it forward as true.
- Checkable: passes — It can be checked against evidence.
- Load-bearing: passes — The paper’s conclusions depend on it.
- Based: passes — The paper gives a reason why it holds.
None of the sources cited for this claim have been checked yet.
In the paper
“The reduced parietal bone length and the reduction and upward angulation of the nasal bones in these mice (Figure 8c, d) are reminiscent of the decrease in the volume of the parieto-occipital region and the appearance of the nose in WBS patients [34,35].”
§ A genome-wide screen for modifiers of transgene variegation identifies genes with critical roles in development > Results and discussion > Craniofacial analysis of MommeD10 mice
What the sources say
- Not checked yetcites [34] Perez Jurado AL: Williams-Beuren syndrome: a model of recurrent genomic mutation. Horm Res. 2003, 59 (Suppl 1): 106-113. 10.1159/000067836. source
- Not checked yetcites [35] Schmitt JE, Eliez S, Bellugi U, Reiss AL: Analysis of cerebral shape in Williams syndrome. Arch Neurol. 2001, 58: 283-287. 10.1001/archneur.58.2.283. source
plaincorrelational- Asserted: passes — The authors put it forward as true.
- Checkable: passes — It can be checked against evidence.
- Load-bearing: unclear — It is unclear whether the paper’s conclusions depend on it.
- Based: passes — The paper gives a reason why it holds.
A conclusion the paper draws from its own results — it cites no other source for it, so there is none to check. The quote shows it is in the paper.
In the paper
“Together, these results argue that the mutation in Hdac1 is causative of the MommeD5 phenotype.”
§ A genome-wide screen for modifiers of transgene variegation identifies genes with critical roles in development > Results and discussion > MommeD5 has a mutation in Histone deacetylase 1
plaindirect- Asserted: passes — The authors put it forward as true.
- Checkable: passes — It can be checked against evidence.
- Load-bearing: passes — The paper’s conclusions depend on it.
- Based: passes — The paper gives a reason why it holds.
A conclusion the paper draws from its own results — it cites no other source for it, so there is none to check. The quote shows it is in the paper.
In the paper
“Indeed, this upregulation may explain why MommeD5 was identified as an enhancer, rather than a suppressor, of variegation.”
§ A genome-wide screen for modifiers of transgene variegation identifies genes with critical roles in development > Results and discussion > MommeD5 has a mutation in Histone deacetylase 1
hedgedconditional- Asserted: passes — The authors put it forward as true.
- Checkable: passes — It can be checked against evidence.
- Load-bearing: unclear — It is unclear whether the paper’s conclusions depend on it.
- Based: passes — The paper gives a reason why it holds.
What the paper did — it cites no source for this, so there is none to check. The quote shows it is in the paper.
In the paper
“This mutation was subsequently verified in over 100 mice classified as mutants by GFP expression profile.”
§ A genome-wide screen for modifiers of transgene variegation identifies genes with critical roles in development > Results and discussion > MommeD10 has a mutation in Baz1b
plainn = 100- Asserted: passes — The authors put it forward as true.
- Checkable: passes — It can be checked against evidence.
- Load-bearing: passes — The paper’s conclusions depend on it.
- Based: passes — The paper gives a reason why it holds.
A conclusion the paper draws from its own results — it cites no other source for it, so there is none to check. The quote shows it is in the paper.
In the paper
“suggesting a greater sensitivity of some parts of the skull to decreased Baz1b protein levels.”
§ A genome-wide screen for modifiers of transgene variegation identifies genes with critical roles in development > Results and discussion > Craniofacial analysis of MommeD10 mice
hedgedconditional- Asserted: passes — The authors put it forward as true.
- Checkable: passes — It can be checked against evidence.
- Load-bearing: passes — The paper’s conclusions depend on it.
- Based: passes — The paper gives a reason why it holds.
In the paper
“A targeted knockout of Gtf2ird1, produced by others, failed to find craniofacial dysmorphology or dental abnormalities [44].”
§ A genome-wide screen for modifiers of transgene variegation identifies genes with critical roles in development > Results and discussion > A possible role for Baz1b in Williams syndrome
What the sources say
- Not checked yetcites [44] Palmer SJ, Tay ES, Santucci N, Cuc Bach TT, Hook J, Lemckert FA, Jamieson RV, Gunnning PW, Hardeman EC: Expression of Gtf2ird1, the Williams syndrome-associated gene, during mouse development. Gene Expr Patterns. 2007, 7: 396-404. 10.1016/j.modgep.2006.11.008. source
plain- Asserted: passes — The authors put it forward as true.
- Checkable: passes — It can be checked against evidence.
- Load-bearing: passes — The paper’s conclusions depend on it.
- Based: passes — The paper gives a reason why it holds.
A conclusion the paper draws from its own results — it cites no other source for it, so there is none to check. The quote shows it is in the paper.
In the paper
“indicating that this is not simply due to poor post-natal feeding”
§ A genome-wide screen for modifiers of transgene variegation identifies genes with critical roles in development > Results and discussion > Craniofacial analysis of MommeD10 mice
hedged- Asserted: passes — The authors put it forward as true.
- Checkable: passes — It can be checked against evidence.
- Load-bearing: unclear — It is unclear whether the paper’s conclusions depend on it.
- Based: passes — The paper gives a reason why it holds.
A conclusion the paper draws from its own results — it cites no other source for it, so there is none to check. The quote shows it is in the paper.
In the paper
“homozygosity for a missense mutation in Baz1b produces an array of craniofacial features that are similar to those that characterize the typical WBS face.”
§ A genome-wide screen for modifiers of transgene variegation identifies genes with critical roles in development > Results and discussion > A possible role for Baz1b in Williams syndrome
plaindirect- Asserted: passes — The authors put it forward as true.
- Checkable: passes — It can be checked against evidence.
- Load-bearing: passes — The paper’s conclusions depend on it.
- Based: passes — The paper gives a reason why it holds.
A conclusion the paper draws from its own results — it cites no other source for it, so there is none to check. The quote shows it is in the paper.
In the paper
“and these studies re-emphasize the importance of probabilistic events during embryogenesis.”
§ A genome-wide screen for modifiers of transgene variegation identifies genes with critical roles in development > Conclusion
plain- Asserted: passes — The authors put it forward as true.
- Checkable: unclear — It is unclear whether it could be checked against evidence.
- Load-bearing: passes — The paper’s conclusions depend on it.
- Based: passes — The paper gives a reason why it holds.
A conclusion the paper draws from its own results — it cites no other source for it, so there is none to check. The quote shows it is in the paper.
In the paper
“Furthermore, the identification of heterozygous effects suggests that a reduction in the amount of protein product of less than 50% has effects on the health of the mouse.”
§ A genome-wide screen for modifiers of transgene variegation identifies genes with critical roles in development > Conclusion
hedgeddirect- Asserted: passes — The authors put it forward as true.
- Checkable: passes — It can be checked against evidence.
- Load-bearing: passes — The paper’s conclusions depend on it.
- Based: passes — The paper gives a reason why it holds.
A conclusion the paper draws from its own results — it cites no other source for it, so there is none to check. The quote shows it is in the paper.
In the paper
“The screen, designed primarily to identify genes involved in the epigenetic gene silencing of foreign DNA, such as transgenes, has revealed the critical role that such genes play in embryonic and fetal development.”
§ A genome-wide screen for modifiers of transgene variegation identifies genes with critical roles in development > Conclusion
boosteddirect- Asserted: passes — The authors put it forward as true.
- Checkable: passes — It can be checked against evidence.
- Load-bearing: passes — The paper’s conclusions depend on it.
- Based: passes — The paper gives a reason why it holds.
- Rests on an assumption: Hdac1 and Baz1b are known to be involved in epigenetic processes.
A conclusion the paper draws from its own results — it cites no other source for it, so there is none to check. The quote shows it is in the paper.
In the paper
“and that WBS is, at least in part, a chromatin-remodeling factor disease.”
§ A genome-wide screen for modifiers of transgene variegation identifies genes with critical roles in development > Results and discussion > A possible role for Baz1b in Williams syndrome
hedgedconditional- Asserted: passes — The authors put it forward as true.
- Checkable: passes — It can be checked against evidence.
- Load-bearing: passes — The paper’s conclusions depend on it.
- Based: passes — The paper gives a reason why it holds.
A conclusion the paper draws from its own results — it cites no other source for it, so there is none to check. The quote shows it is in the paper.
In the paper
“These results suggest that reduction in Baz1b protein levels contributes to the elfin facies characteristic of WBS”
§ A genome-wide screen for modifiers of transgene variegation identifies genes with critical roles in development > Results and discussion > A possible role for Baz1b in Williams syndrome
hedgedconditional- Asserted: passes — The authors put it forward as true.
- Checkable: passes — It can be checked against evidence.
- Load-bearing: passes — The paper’s conclusions depend on it.
- Based: passes — The paper gives a reason why it holds.
A conclusion the paper draws from its own results — it cites no other source for it, so there is none to check. The quote shows it is in the paper.
In the paper
“and we have shown a role for the protein in craniofacial development.”
§ A genome-wide screen for modifiers of transgene variegation identifies genes with critical roles in development > Conclusion
boosteddirectSingle case- Asserted: passes — The authors put it forward as true.
- Checkable: passes — It can be checked against evidence.
- Load-bearing: passes — The paper’s conclusions depend on it.
- Based: passes — The paper gives a reason why it holds.
- Probably not a substantial claim. 24
- It may state two separate claims as one. 49
- The quote only partly states this claim. 1
Every source the paper cites for this claim was checked and supports it.
In the paper
“A preliminary description of the first six heritable mutations, which we refer to as Modifiers of murine metastable epialleles or Mommes, following the screening of 608 G1 offspring, has been published [10].”
§ A genome-wide screen for modifiers of transgene variegation identifies genes with critical roles in development > Background
What the sources say
- Supportedcites [10] Blewitt ME, Vickaryous NK, Hemley SJ, Ashe A, Bruxner TJ, Preis JI, Arkell R, Whitelaw E: An N-ethyl-N-nitrosourea screen for genes involved in variegation in the mouse. Proc Natl Acad Sci USA. 2005, 102: 7629-7634. 10.1073/pnas.0409375102. source
The Results section states that the authors named the mutations Modifiers of Murine Metastable Epialleles (Mommes) and identified six dominant mutations, Momme D1–D6, after screening 608 G1 offspring. It also says that heritability was confirmed over at least three generations. (LLM, conf=0.95)
plain- Asserted: passes — The authors put it forward as true.
- Checkable: passes — It can be checked against evidence.
- Load-bearing: fails — The paper’s conclusions may not depend on it.
- Based: passes — The paper gives a reason why it holds.
Probably not a substantial claim. The paper’s conclusions may not depend on it.
- Supported
The sources with a verdict support this claim; the rest weren’t checked yet, have no full text we could read, or their verdicts aren’t rated yet.
In the paper
“In this case there is a correlation between DNA methylation at the promoter and silencing of the gene [5,6].”
§ A genome-wide screen for modifiers of transgene variegation identifies genes with critical roles in development > Background
What the sources say
- Supportedcites [5] Waterland RA, Jirtle RL: Transposable elements: targets for early nutritional effects on epigenetic gene regulation. Mol Cell Biol. 2003, 23: 5293-5300. 10.1128/MCB.23.15.5293-5300.2003. source
The paper’s Abstract states that ectopic agouti transcription in Avy mice begins at a cryptic promoter in the inserted IAP and that CpG methylation there is inversely correlated with ectopic agouti expression. This supports the claimed correlation between promoter methylation and gene silencing. (LLM, conf=0.94)
- Not checked yetcites [6] Morgan HD, Sutherland HG, Martin DI, Whitelaw E: Epigenetic inheritance at the agouti locus in the mouse. Nat Genet. 1999, 23: 314-318. 10.1038/15490. source
plaincorrelational- Asserted: passes — The authors put it forward as true.
- Checkable: passes — It can be checked against evidence.
- Load-bearing: fails — The paper’s conclusions may not depend on it.
- Based: passes — The paper gives a reason why it holds.
Probably not a substantial claim. The paper’s conclusions may not depend on it.
- Supported
The cited sources support only part of this claim — read each source’s verdict below.
In the paper
“People with atypical deletions, and varying degrees of craniofacial abnormalities, implicate both proximal and distal ends of the deletion, suggesting that more than one gene is responsible [36-41].”
§ A genome-wide screen for modifiers of transgene variegation identifies genes with critical roles in development > Results and discussion > A possible role for Baz1b in Williams syndrome
What the sources say
- Not checked yetcites [36] Botta A, Novelli G, Mari A, Novelli A, Sabani M, Korenberg J, Osborne LR, Digilio MC, Giannotti A, Dallapiccola B: Detection of an atypical 7q11.23 deletion in Williams syndrome patients which does not include the STX1A and FZD3 genes. J Med Genet. 1999, 36: 478-480.
- Not checked yetcites [37] Duba HC, Doll A, Neyer M, Erdel M, Mann C, Hammerer I, Utermann G, Grzeschik KH: The elastin gene is disrupted in a family with a balanced translocation t(7;16)(q11.23;q13) associated with a variable expression of the Williams-Beuren syndrome. Eur J Hum Genet. 2002, 10: 351-361. 10.1038/sj.ejhg.5200812. source
- Partly supportedcites [38] Edelmann L, Prosnitz A, Pardo S, Bhatt J, Cohen N, Lauriat T, Ouchanov L, González PJ, Manghi ER, Bondy P, Esquivel M, Monge S, Delgado MF, Splendore A, Francke U, Burton BK, McInnes LA: An atypical deletion of the Williams-Beuren syndrome interval implicates genes associated with defective visuospatial processing and autism. J Med Genet. 2007, 44: 136-143. 10.1136/jmg.2006.044537. sourceExperimental — accuracy not yet measured
The Patient 41A section describes an atypical distal deletion and a mix of facial findings: widely spaced teeth, a wide mouth and prominent lips, but not several other typical Williams–Beuren facial features. The paper does not use these findings to implicate both ends of the deletion or conclude that more than one gene is responsible for craniofacial abnormalities. No page number was available in our indexed copy. (LLM, conf=0.83)
- Not checked yetcites [39] Hirota H, Matsuoka R, Chen XN, Salandanan LS, Lincoln A, Rose FE, Sunahara M, Osawa M, Bellugi U, Korenberg JR: Williams syndrome deficits in visual spatial processing linked to GTF2IRD1 and GTF2I on chromosome 7q11.23. Genet Med. 2003, 5: 311-321. source
- Partly supportedcites [40] Howald C, Merla G, Digilio MC, Amenta S, Lyle R, Deutsch S, Choudhury U, Bottani A, Antonarakis SE, Fryssira H, Dallapiccola B, Reymond A: Two high throughput technologies to detect segmental aneuploidies identify new Williams-Beuren syndrome patients with atypical deletions. J Med Genet. 2006, 43: 266-273. 10.1136/jmg.2005.034009. sourceExperimental — accuracy not yet measured
The Results (Atypical deletions; page unavailable) map two patients’ deletions while showing that telomeric genes were preserved. The Discussion (page unavailable) reports differing facial features among patients with partial deletions and suggests that genes at the telomeric end may be involved. It does not establish that both ends contribute to craniofacial abnormalities or conclude that more than one gene is responsible. (LLM, conf=0.82)
- Could not verifycites [41] Osborne LR, Li M, Pober B, Chitayat D, Bodurtha J, Mandel A, Costa T, Grebe T, Cox S, Tsui LC, Scherer SW: A 1.5 million-base pair inversion polymorphism in families with Williams-Beuren syndrome. Nat Genet. 2001, 29: 321-325. 10.1038/ng753. sourceExperimental — accuracy not yet measured
The paper reports WBS-like facial features in some individuals with atypical WBS (patient table, page unavailable). It does not link varying craniofacial abnormalities in people with atypical deletions to both the proximal and distal ends of the deletion, or infer from them that multiple genes are responsible. Searches for atypical deletions, facial features, and deletion breakpoints found no passage making that argument. (LLM, conf=0.72)
hedgeddirect- Asserted: passes — The authors put it forward as true.
- Checkable: passes — It can be checked against evidence.
- Load-bearing: unclear — It is unclear whether the paper’s conclusions depend on it.
- Based: passes — The paper gives a reason why it holds.
It may state two separate claims as one.
A result the paper reports from its own data — it cites no other source for it, so there is none to check. The quote shows it is in the paper.
In the paper
“The integration site does not disrupt any annotated genes, and is approximately 1 Mb from the closest annotated transcript.”
§ A genome-wide screen for modifiers of transgene variegation identifies genes with critical roles in development > Results and discussion > Integration site of the GFP transgene
plainSingle case- Asserted: passes — The authors put it forward as true.
- Checkable: passes — It can be checked against evidence.
- Load-bearing: unclear — It is unclear whether the paper’s conclusions depend on it.
- Based: passes — The paper gives a reason why it holds.
It may state two separate claims as one.
A result the paper reports from its own data — it cites no other source for it, so there is none to check. The quote shows it is in the paper.
In the paper
“An antibody that recognizes the carboxyl terminus of Hdac1 showed a 50% reduction of binding in 10.5 dpc MommeD5-/+ embryos, and negligible binding in MommeD5-/- embryos (Figure 5b), confirming that this region of the protein has been altered in the MommeD5 line.”
§ A genome-wide screen for modifiers of transgene variegation identifies genes with critical roles in development > Results and discussion > MommeD5 has a mutation in Histone deacetylase 1
plaindirect- Asserted: passes — The authors put it forward as true.
- Checkable: passes — It can be checked against evidence.
- Load-bearing: passes — The paper’s conclusions depend on it.
- Based: passes — The paper gives a reason why it holds.
It may state two separate claims as one.
A result the paper reports from its own data — it cites no other source for it, so there is none to check. The quote shows it is in the paper.
In the paper
“Further analysis of adult heterozygous individuals revealed severe splenomegaly (Figure 3b) and a marked increase in reticulocytes in peripheral blood (Figure 3c).”
§ A genome-wide screen for modifiers of transgene variegation identifies genes with critical roles in development > Results and discussion > Homozygous lethality occurs at different stages of development
plaincorrelational- Asserted: passes — The authors put it forward as true.
- Checkable: passes — It can be checked against evidence.
- Load-bearing: unclear — It is unclear whether the paper’s conclusions depend on it.
- Based: passes — The paper gives a reason why it holds.
It may state two separate claims as one.
A result the paper reports from its own data — it cites no other source for it, so there is none to check. The quote shows it is in the paper.
In the paper
“MommeD8, D9 and D10 are enhancers of variegation, that is, the percentages of expressing cells were significantly lower than they were in wild-type individuals (Table 1).”
§ A genome-wide screen for modifiers of transgene variegation identifies genes with critical roles in development > Results and discussion > The identification of MommeD7-D10
plaindirect- Asserted: passes — The authors put it forward as true.
- Checkable: passes — It can be checked against evidence.
- Load-bearing: passes — The paper’s conclusions depend on it.
- Based: passes — The paper gives a reason why it holds.
It may state two separate claims as one.
A result the paper reports from its own data — it cites no other source for it, so there is none to check. The quote shows it is in the paper.
In the paper
“In the case of MommeD10 the data suggest that death of homozygotes occurred after birth (Table 3), and preliminary data collected at P7 indicated death in the first week of life (data not shown).”
§ A genome-wide screen for modifiers of transgene variegation identifies genes with critical roles in development > Results and discussion > Homozygous lethality occurs at different stages of development
hedgedSingle case- Asserted: passes — The authors put it forward as true.
- Checkable: passes — It can be checked against evidence.
- Load-bearing: unclear — It is unclear whether the paper’s conclusions depend on it.
- Based: passes — The paper gives a reason why it holds.
It may state two separate claims as one.
A result the paper reports from its own data — it cites no other source for it, so there is none to check. The quote shows it is in the paper.
In the paper
“This deletion alters the reading frame, changing the last 12 amino acids and adding 25 extra amino acids.”
§ A genome-wide screen for modifiers of transgene variegation identifies genes with critical roles in development > Results and discussion > MommeD5 has a mutation in Histone deacetylase 1
plaindirectSingle case- Asserted: passes — The authors put it forward as true.
- Checkable: passes — It can be checked against evidence.
- Load-bearing: passes — The paper’s conclusions depend on it.
- Based: passes — The paper gives a reason why it holds.
It may state two separate claims as one.
A result the paper reports from its own data — it cites no other source for it, so there is none to check. The quote shows it is in the paper.
In the paper
“Each mutant line has a significantly different expression profile to that of wild-type littermates, reproducible over many generations.”
§ A genome-wide screen for modifiers of transgene variegation identifies genes with critical roles in development > Results and discussion > The identification of MommeD7-D10
plaincorrelationaln = 4 ·- Asserted: passes — The authors put it forward as true.
- Checkable: passes — It can be checked against evidence.
- Load-bearing: passes — The paper’s conclusions depend on it.
- Based: passes — The paper gives a reason why it holds.
It may state two separate claims as one.
A result the paper reports from its own data — it cites no other source for it, so there is none to check. The quote shows it is in the paper.
In the paper
“A breakdown of the offspring by sex and genotype revealed that for MommeD9 and MommeD10, the litter size reduction was associated with a deviation from Mendelian patterns of inheritance (p < 0.05 in both cases) and a reduction in the number of mutants (Figure 4).”
§ A genome-wide screen for modifiers of transgene variegation identifies genes with critical roles in development > Results and discussion > Abnormal phenotypes associated with heterozygosity for MommeD7-D10
plaincorrelationaln = 2 ·- Asserted: passes — The authors put it forward as true.
- Checkable: passes — It can be checked against evidence.
- Load-bearing: unclear — It is unclear whether the paper’s conclusions depend on it.
- Based: passes — The paper gives a reason why it holds.
It may state two separate claims as one.
A result the paper reports from its own data — it cites no other source for it, so there is none to check. The quote shows it is in the paper.
In the paper
“Some MommeD8-/- mice (classified by their GFP expression profile and progeny testing) were viable at weaning but they were rare (Figure 1, Table 2).”
§ A genome-wide screen for modifiers of transgene variegation identifies genes with critical roles in development > Results and discussion > Homozygous lethality occurs at different stages of development
plain- Asserted: passes — The authors put it forward as true.
- Checkable: passes — It can be checked against evidence.
- Load-bearing: unclear — It is unclear whether the paper’s conclusions depend on it.
- Based: passes — The paper gives a reason why it holds.
It may state two separate claims as one.
A result the paper reports from its own data — it cites no other source for it, so there is none to check. The quote shows it is in the paper.
In the paper
“Homozygous MommeD7 mutants were never seen at weaning (Table 2), and preliminary observations suggest that they die in the first few days after birth.”
§ A genome-wide screen for modifiers of transgene variegation identifies genes with critical roles in development > Results and discussion > Homozygous lethality occurs at different stages of development
hedged- Asserted: passes — The authors put it forward as true.
- Checkable: passes — It can be checked against evidence.
- Load-bearing: passes — The paper’s conclusions depend on it.
- Based: passes — The paper gives a reason why it holds.
It may state two separate claims as one.
A result the paper reports from its own data — it cites no other source for it, so there is none to check. The quote shows it is in the paper.
In the paper
“The mean fluorescence level in expressing cells also changed.”
§ A genome-wide screen for modifiers of transgene variegation identifies genes with critical roles in development > Results and discussion > The identification of MommeD7-D10
plaincorrelational- Asserted: passes — The authors put it forward as true.
- Checkable: passes — It can be checked against evidence.
- Load-bearing: unclear — It is unclear whether the paper’s conclusions depend on it.
- Based: passes — The paper gives a reason why it holds.
The quote only partly states this claim.
A result the paper reports from its own data — it cites no other source for it, so there is none to check. The quote shows it is in the paper.
In the paper
“There is also a suggestion of some heterozygous death in the case of MommeD8 and, to a lesser extent, MommeD10 but this is not statistically significant.”
§ A genome-wide screen for modifiers of transgene variegation identifies genes with critical roles in development > Results and discussion > Homozygous lethality
hedged- Asserted: passes — The authors put it forward as true.
- Checkable: passes — It can be checked against evidence.
- Load-bearing: fails — The paper’s conclusions may not depend on it.
- Based: passes — The paper gives a reason why it holds.
Probably not a substantial claim. The paper’s conclusions may not depend on it. It may state two separate claims as one.
A result the paper reports from its own data — it cites no other source for it, so there is none to check. The quote shows it is in the paper.
In the paper
“As expected, MommeD7-/+ mice had a threefold increase in the percentage of reticulocytes compared to MommeD7+/+ mice (Figure 3d), and the percentage of GFP fluorescence in both MommeD7-/+ and MommeD7+/+ was higher in reticulocytes than mature red cells (Figure 3e).”
§ A genome-wide screen for modifiers of transgene variegation identifies genes with critical roles in development > Results and discussion > Homozygous lethality occurs at different stages of development
plaincorrelational- Asserted: passes — The authors put it forward as true.
- Checkable: passes — It can be checked against evidence.
- Load-bearing: passes — The paper’s conclusions depend on it.
- Based: passes — The paper gives a reason why it holds.
It may state two separate claims as one.
A result the paper reports from its own data — it cites no other source for it, so there is none to check. The quote shows it is in the paper.
In the paper
“MommeD7 is a suppressor of variegation, that is, the percentage of cells expressing the transgene was significantly higher than it was in wild-type individuals (Table 1).”
§ A genome-wide screen for modifiers of transgene variegation identifies genes with critical roles in development > Results and discussion > The identification of MommeD7-D10
plaindirect- Asserted: passes — The authors put it forward as true.
- Checkable: passes — It can be checked against evidence.
- Load-bearing: passes — The paper’s conclusions depend on it.
- Based: passes — The paper gives a reason why it holds.
It may state two separate claims as one.
A result the paper reports from its own data — it cites no other source for it, so there is none to check. The quote shows it is in the paper.
In the paper
“Some MommeD10-/- individuals survived to weaning but they were extremely rare.”
§ A genome-wide screen for modifiers of transgene variegation identifies genes with critical roles in development > Results and discussion > Homozygous lethality occurs at different stages of development
plain- Asserted: passes — The authors put it forward as true.
- Checkable: passes — It can be checked against evidence.
- Load-bearing: unclear — It is unclear whether the paper’s conclusions depend on it.
- Based: passes — The paper gives a reason why it holds.
It may state two separate claims as one.
In the paper
“The frequency with which we found these mutations, 1 in 100 G1 offspring, was similar to our previous results [10].”
§ A genome-wide screen for modifiers of transgene variegation identifies genes with critical roles in development > Results and discussion > The identification of MommeD7-D10
What the sources say
- Not checked yetcites [10] Blewitt ME, Vickaryous NK, Hemley SJ, Ashe A, Bruxner TJ, Preis JI, Arkell R, Whitelaw E: An N-ethyl-N-nitrosourea screen for genes involved in variegation in the mouse. Proc Natl Acad Sci USA. 2005, 102: 7629-7634. 10.1073/pnas.0409375102. source
plain- Asserted: passes — The authors put it forward as true.
- Checkable: passes — It can be checked against evidence.
- Load-bearing: fails — The paper’s conclusions may not depend on it.
- Based: passes — The paper gives a reason why it holds.
Probably not a substantial claim. The paper’s conclusions may not depend on it.
A result the paper reports from its own data — it cites no other source for it, so there is none to check. The quote shows it is in the paper.
In the paper
“This region contains 10 genes.”
§ A genome-wide screen for modifiers of transgene variegation identifies genes with critical roles in development > Results and discussion > Mapping
plain- Asserted: passes — The authors put it forward as true.
- Checkable: passes — It can be checked against evidence.
- Load-bearing: fails — The paper’s conclusions may not depend on it.
- Based: passes — The paper gives a reason why it holds.
Probably not a substantial claim. The paper’s conclusions may not depend on it.
A result the paper reports from its own data — it cites no other source for it, so there is none to check. The quote shows it is in the paper.
In the paper
“Following crosses between heterozygous males and wild-type females in the FVB strain, we found significant litter size reductions in the cases of MommeD9 and MommeD10, but not in the cases of MommeD7 and MommeD8.”
§ A genome-wide screen for modifiers of transgene variegation identifies genes with critical roles in development > Results and discussion > Abnormal phenotypes associated with heterozygosity for MommeD7-D10
plaindirectn = 2- Asserted: passes — The authors put it forward as true.
- Checkable: passes — It can be checked against evidence.
- Load-bearing: unclear — It is unclear whether the paper’s conclusions depend on it.
- Based: passes — The paper gives a reason why it holds.
It may state two separate claims as one.
A result the paper reports from its own data — it cites no other source for it, so there is none to check. The quote shows it is in the paper.
In the paper
“From 9.5 dpc expression is evident in the somites and in the forelimb bud as it emerges from the lateral plate mesoderm (Figure 9b).”
§ A genome-wide screen for modifiers of transgene variegation identifies genes with critical roles in development > Results and discussion > Expression of Baz1b during mouse embryogenesis
plain- Asserted: passes — The authors put it forward as true.
- Checkable: passes — It can be checked against evidence.
- Load-bearing: unclear — It is unclear whether the paper’s conclusions depend on it.
- Based: passes — The paper gives a reason why it holds.
It may state two separate claims as one.
A result the paper reports from its own data — it cites no other source for it, so there is none to check. The quote shows it is in the paper.
In the paper
“In the facial primordia, Baz1b is expressed in branchial arch 1 as it first emerges (Figure 9g), and continues later in development in both the maxillary and mandibular components of branchial arch 1 and branchial arch 2 (Figure 9c-e, h, i).”
§ A genome-wide screen for modifiers of transgene variegation identifies genes with critical roles in development > Results and discussion > Expression of Baz1b during mouse embryogenesis
plain- Asserted: passes — The authors put it forward as true.
- Checkable: passes — It can be checked against evidence.
- Load-bearing: unclear — It is unclear whether the paper’s conclusions depend on it.
- Based: passes — The paper gives a reason why it holds.
It may state two separate claims as one.
A result the paper reports from its own data — it cites no other source for it, so there is none to check. The quote shows it is in the paper.
In the paper
“Western blot analysis showed reduced levels of Baz1b protein in both embryonic and adult MommeD10-/- tissue, with MommeD10-/+ tissue showing intermediate levels (Figure 6c and data not shown), suggesting that the mutant protein is much less stable than its wild-type counterpart.”
§ A genome-wide screen for modifiers of transgene variegation identifies genes with critical roles in development > Results and discussion > MommeD10 has a mutation in Baz1b
plaincorrelational- Asserted: passes — The authors put it forward as true.
- Checkable: passes — It can be checked against evidence.
- Load-bearing: passes — The paper’s conclusions depend on it.
- Based: passes — The paper gives a reason why it holds.
It may state two separate claims as one.
A result the paper reports from its own data — it cites no other source for it, so there is none to check. The quote shows it is in the paper.
In the paper
“Diffuse mesenchymal expression in both the forelimb and hindlimb continues until 12.5 dpc when it is restricted to the interdigital mesenchyme (data not shown).”
§ A genome-wide screen for modifiers of transgene variegation identifies genes with critical roles in development > Results and discussion > Expression of Baz1b during mouse embryogenesis
plain- Asserted: passes — The authors put it forward as true.
- Checkable: passes — It can be checked against evidence.
- Load-bearing: fails — The paper’s conclusions may not depend on it.
- Based: passes — The paper gives a reason why it holds.
Probably not a substantial claim. The paper’s conclusions may not depend on it.
A result the paper reports from its own data — it cites no other source for it, so there is none to check. The quote shows it is in the paper.
In the paper
“Homozygote skulls were significantly different to wild type (Student's t-test, length:height ratio, p < 0.01; width:height ratio, p < 0.01; length:width ratio, p < 0.05)”
§ A genome-wide screen for modifiers of transgene variegation identifies genes with critical roles in development > Results and discussion > Craniofacial analysis of MommeD10 mice
plain- Asserted: passes — The authors put it forward as true.
- Checkable: passes — It can be checked against evidence.
- Load-bearing: passes — The paper’s conclusions depend on it.
- Based: passes — The paper gives a reason why it holds.
It may state two separate claims as one.
A result the paper reports from its own data — it cites no other source for it, so there is none to check. The quote shows it is in the paper.
In the paper
“Visual inspection of the three-dimensional reconstructions confirmed the original observation that homozygote's skulls were more bulbous and showed a flattening of the nasal bone and upward curvature of the nasal tip (Figure 8c).”
§ A genome-wide screen for modifiers of transgene variegation identifies genes with critical roles in development > Results and discussion > Craniofacial analysis of MommeD10 mice
plain- Asserted: passes — The authors put it forward as true.
- Checkable: passes — It can be checked against evidence.
- Load-bearing: unclear — It is unclear whether the paper’s conclusions depend on it.
- Based: passes — The paper gives a reason why it holds.
It may state two separate claims as one.
A result the paper reports from its own data — it cites no other source for it, so there is none to check. The quote shows it is in the paper.
In the paper
“Mice heterozygous for a null allele of Dnmt3b, which showed an increase in expression of the GFP transgene from 37 ± 3% in the wild-type mice to 55.5 ± 2.5% in the Dnmt3b+/- mice (in both cases mice were hemizygous for the transgene; see Materials and methods), showed a decrease in CpG methylation at the HS-40 element (31%; Figure 7b) compared to that seen in the wild-type C57BL/6J mouse strain (6”
§ A genome-wide screen for modifiers of transgene variegation identifies genes with critical roles in development > Results and discussion > Effects of MommeD5 and MommeD10 on DNA methylation at the transgene locus
plaincorrelational- Asserted: passes — The authors put it forward as true.
- Checkable: passes — It can be checked against evidence.
- Load-bearing: passes — The paper’s conclusions depend on it.
- Based: passes — The paper gives a reason why it holds.
It may state two separate claims as one.
A result the paper reports from its own data — it cites no other source for it, so there is none to check. The quote shows it is in the paper.
In the paper
“Expression in the branchial arches is primarily mesenchymal, and is enriched in the rostral distal margin of the mandible, and the caudal distal margin of branchial arch 2 (Figure 9c-e, h).”
§ A genome-wide screen for modifiers of transgene variegation identifies genes with critical roles in development > Results and discussion > Expression of Baz1b during mouse embryogenesis
plaincorrelational- Asserted: passes — The authors put it forward as true.
- Checkable: passes — It can be checked against evidence.
- Load-bearing: unclear — It is unclear whether the paper’s conclusions depend on it.
- Based: passes — The paper gives a reason why it holds.
It may state two separate claims as one.
A result the paper reports from its own data — it cites no other source for it, so there is none to check. The quote shows it is in the paper.
In the paper
“We checked the sequence and expression of Gtf2ird1 in MommeD10 mutants and found no abnormalities (data not shown).”
§ A genome-wide screen for modifiers of transgene variegation identifies genes with critical roles in development > Results and discussion > A possible role for Baz1b in Williams syndrome
plain- Asserted: passes — The authors put it forward as true.
- Checkable: passes — It can be checked against evidence.
- Load-bearing: passes — The paper’s conclusions depend on it.
- Based: passes — The paper gives a reason why it holds.
It may state two separate claims as one.
The paper states this without a source or data behind it here, so there is nothing to check it against. The quote shows it is in the paper.
In the paper
“The AciI site is created by the MommeD10 point mutation.”
§ A genome-wide screen for modifiers of transgene variegation identifies genes with critical roles in development > Materials and methods > Genotyping assay
plaindirect- Asserted: passes — The authors put it forward as true.
- Checkable: passes — It can be checked against evidence.
- Load-bearing: fails — The paper’s conclusions may not depend on it.
- Based: passes — The paper gives a reason why it holds.
Probably not a substantial claim. The paper’s conclusions may not depend on it.
A result the paper reports from its own data — it cites no other source for it, so there is none to check. The quote shows it is in the paper.
In the paper
“We have now identified the underlying genes in five of the ten cases, two of which, Hdac1 and Baz1b, we report here.”
§ A genome-wide screen for modifiers of transgene variegation identifies genes with critical roles in development > Conclusion
plainn = 5- Asserted: passes — The authors put it forward as true.
- Checkable: passes — It can be checked against evidence.
- Load-bearing: passes — The paper’s conclusions depend on it.
- Based: passes — The paper gives a reason why it holds.
It may state two separate claims as one.
The paper states this without a source or data behind it here, so there is nothing to check it against. The quote shows it is in the paper.
In the paper
“It is interesting that at least half of the MommeDs are important during gastrulation.”
§ A genome-wide screen for modifiers of transgene variegation identifies genes with critical roles in development > Conclusion
plain- Asserted: passes — The authors put it forward as true.
- Checkable: passes — It can be checked against evidence.
- Load-bearing: fails — The paper’s conclusions may not depend on it.
- Based: fails — The paper may give no reason why it holds.
Probably not a substantial claim. The paper’s conclusions may not depend on it. The paper may give no reason why it holds.
In the paper
“Extension of the screen has produced four new MommeDs, MommeD7-D10, all of which behave in a semidominant fashion, as do the six previously reported [10].”
§ A genome-wide screen for modifiers of transgene variegation identifies genes with critical roles in development > Conclusion
What the sources say
- Not checked yetcites [10] Blewitt ME, Vickaryous NK, Hemley SJ, Ashe A, Bruxner TJ, Preis JI, Arkell R, Whitelaw E: An N-ethyl-N-nitrosourea screen for genes involved in variegation in the mouse. Proc Natl Acad Sci USA. 2005, 102: 7629-7634. 10.1073/pnas.0409375102. source
plain- Asserted: passes — The authors put it forward as true.
- Checkable: passes — It can be checked against evidence.
- Load-bearing: passes — The paper’s conclusions depend on it.
- Based: passes — The paper gives a reason why it holds.
It may state two separate claims as one.
The paper states this without a source or data behind it here, so there is nothing to check it against. The quote shows it is in the paper.
In the paper
“A total of 1,000 G1 offspring were screened at 3 weeks of age, from which ten heritable dominant mutations were identified.”
§ A genome-wide screen for modifiers of transgene variegation identifies genes with critical roles in development > Materials and methods > Mouse strains
plain- Asserted: passes — The authors put it forward as true.
- Checkable: passes — It can be checked against evidence.
- Load-bearing: passes — The paper’s conclusions depend on it.
- Based: passes — The paper gives a reason why it holds.
It may state two separate claims as one.
In the paper
“MommeD2 is a mutation in DNA methyltransferase 1, Dnmt1, encoding a DNA methyltransferase, and MommeD4 is a mutation in Smarca5, encoding Snf2h, a chromatin-remodeling enzyme [12].”
§ A genome-wide screen for modifiers of transgene variegation identifies genes with critical roles in development > Background
What the sources say
- Not checked yetcites [12] Chong S, Vickaryous N, Ashe A, Zamudio N, Youngson N, Hemley S, Stopka T, Skoultchi A, Matthews J, Scott HS, de Kretser D, O'Bryan M, Blewitt M, Whitelaw E: Modifiers of epigenetic reprogramming show paternal effects in the mouse. Nat Genet. 2007, 39: 614-622. 10.1038/ng2031. source
plain- Asserted: passes — The authors put it forward as true.
- Checkable: passes — It can be checked against evidence.
- Load-bearing: passes — The paper’s conclusions depend on it.
- Based: passes — The paper gives a reason why it holds.
It may state two separate claims as one.
In the paper
“MommeD1 is a mutation in SMC hinge domain containing 1 (SmcHD1), encoding a previously uncharacterized protein containing a domain normally found in SMC proteins and we have gone on to show that this protein has a critical role in X inactivation [11].”
§ A genome-wide screen for modifiers of transgene variegation identifies genes with critical roles in development > Background
What the sources say
- Not checked yetcites [11] Blewitt ME, Gendrel AV, Pang Z, Sparrow DB, Whitelaw N, Craig JM, Apedaile A, Hilton DJ, Dunwoodie SL, Brockdorff N, Kay GF, Whitelaw E: SmcHD1, containing a structural-maintenance-of-chromosomes hinge domain, has a critical role in X inactivation. Nat Genet. 2008, 40: 663-669. 10.1038/ng.142. source
boosteddirect- Asserted: passes — The authors put it forward as true.
- Checkable: passes — It can be checked against evidence.
- Load-bearing: unclear — It is unclear whether the paper’s conclusions depend on it.
- Based: passes — The paper gives a reason why it holds.
It may state two separate claims as one.
In the paper
“We reported that all six were dosage-effect genes and five of the six were homozygous lethal, with loss of homozygotes apparent at weaning, but no knowledge of when death occurred.”
§ A genome-wide screen for modifiers of transgene variegation identifies genes with critical roles in development > Background
What the sources say
- Not checked yetcites [10] Blewitt ME, Vickaryous NK, Hemley SJ, Ashe A, Bruxner TJ, Preis JI, Arkell R, Whitelaw E: An N-ethyl-N-nitrosourea screen for genes involved in variegation in the mouse. Proc Natl Acad Sci USA. 2005, 102: 7629-7634. 10.1073/pnas.0409375102. source
plain- Asserted: passes — The authors put it forward as true.
- Checkable: passes — It can be checked against evidence.
- Load-bearing: fails — The paper’s conclusions may not depend on it.
- Based: passes — The paper gives a reason why it holds.
Probably not a substantial claim. The paper’s conclusions may not depend on it. It may state two separate claims as one.
None of the sources cited for this claim have been checked yet.
In the paper
“Approximately one-third of these have been identified and, as expected, most turn out to play critical roles in epigenetic gene silencing [1,9].”
§ A genome-wide screen for modifiers of transgene variegation identifies genes with critical roles in development > Background
What the sources say
- Not checked yetcites [1] Henikoff S: Position-effect variegation after 60 years. Trends Genet. 1990, 6: 422-426. 10.1016/0168-9525(90)90304-O. source
- Not checked yetcites [9] Dorn R, Krauss V, Reuter G, Saumweber H: The enhancer of position-effect variegation of Drosophila, E(var)3-93D, codes for a chromatin protein containing a conserved domain common to several transcriptional regulators. Proc Natl Acad Sci USA. 1993, 90: 11376-11380. 10.1073/pnas.90.23.11376. source
plaincorrelational- Asserted: passes — The authors put it forward as true.
- Checkable: passes — It can be checked against evidence.
- Load-bearing: fails — The paper’s conclusions may not depend on it.
- Based: passes — The paper gives a reason why it holds.
Probably not a substantial claim. The paper’s conclusions may not depend on it. It may state two separate claims as one.
In the paper
“These include genes encoding proteins involved in heterochromatin formation, for example, HP1 and histone methyltransferases [8].”
§ A genome-wide screen for modifiers of transgene variegation identifies genes with critical roles in development > Background
What the sources say
- Not checked yetcites [8] Schotta G, Ebert A, Dorn R, Reuter G: Position-effect variegation and the genetic dissection of chromatin regulation in Drosophila. Semin Cell Dev Biol. 2003, 14: 67-75. 10.1016/S1084-9521(02)00138-6. source
plaincorrelational- Asserted: passes — The authors put it forward as true.
- Checkable: passes — It can be checked against evidence.
- Load-bearing: fails — The paper’s conclusions may not depend on it.
- Based: passes — The paper gives a reason why it holds.
Probably not a substantial claim. The paper’s conclusions may not depend on it.
The paper states this without a source or data behind it here, so there is nothing to check it against. The quote shows it is in the paper.
In the paper
“The extent of the variegation at the wv locus, that is, the ratio of red to white patches in the eye, was known to be sensitive to strain background, suggesting the existence of genetic modifiers.”
§ A genome-wide screen for modifiers of transgene variegation identifies genes with critical roles in development > Background
hedgedcorrelational- Asserted: passes — The authors put it forward as true.
- Checkable: passes — It can be checked against evidence.
- Load-bearing: passes — The paper’s conclusions depend on it.
- Based: passes — The paper gives a reason why it holds.
It may state two separate claims as one.
None of the sources cited for this claim have been checked yet.
In the paper
“The best characterized example of variegation in mammals is the coat color of mice carrying the Avy allele [3,4].”
§ A genome-wide screen for modifiers of transgene variegation identifies genes with critical roles in development > Background
What the sources say
- Not checked yetcites [3] Wolff GL: Influence of maternal phenotype on metabolic differentiation of agouti locus mutants in the mouse. Genetics. 1978, 88: 529-539. source
- Not checked yetcites [4] Rakyan VK, Blewitt ME, Druker R, Preis JI, Whitelaw E: Metastable epialleles in mammals. Trends Genet. 2002, 18: 348-351. 10.1016/S0168-9525(02)02709-9. source
plain- Asserted: passes — The authors put it forward as true.
- Checkable: passes — It can be checked against evidence.
- Load-bearing: fails — The paper’s conclusions may not depend on it.
- Based: passes — The paper gives a reason why it holds.
Probably not a substantial claim. The paper’s conclusions may not depend on it.
None of the sources cited for this claim have been checked yet.
In the paper
“These screens have been continued to saturation and the results suggest that there are between 100 and 150 such genes [7,8].”
§ A genome-wide screen for modifiers of transgene variegation identifies genes with critical roles in development > Background
What the sources say
- Not checked yetcites [7] Reuter G, Spierer P: Position effect variegation and chromatin proteins. Bioessays. 1992, 14: 605-612. 10.1002/bies.950140907. source
- Not checked yetcites [8] Schotta G, Ebert A, Dorn R, Reuter G: Position-effect variegation and the genetic dissection of chromatin regulation in Drosophila. Semin Cell Dev Biol. 2003, 14: 67-75. 10.1016/S1084-9521(02)00138-6. source
hedged- Asserted: passes — The authors put it forward as true.
- Checkable: passes — It can be checked against evidence.
- Load-bearing: fails — The paper’s conclusions may not depend on it.
- Based: passes — The paper gives a reason why it holds.
Probably not a substantial claim. The paper’s conclusions may not depend on it.
A conclusion the paper draws from its own results — it cites no other source for it, so there is none to check. The quote shows it is in the paper.
In the paper
“We presume that since the mice are homozygous for the GFP transgene, this is mainly due to an increase in the proportion of expressing cells with two active GFP alleles.”
§ A genome-wide screen for modifiers of transgene variegation identifies genes with critical roles in development > Results and discussion > The identification of MommeD7-D10
hedgeddirect- Asserted: passes — The authors put it forward as true.
- Checkable: passes — It can be checked against evidence.
- Load-bearing: fails — The paper’s conclusions may not depend on it.
- Based: fails — The paper may give no reason why it holds.
Probably not a substantial claim. The paper’s conclusions may not depend on it. The paper may give no reason why it holds.
A conclusion the paper draws from its own results — it cites no other source for it, so there is none to check. The quote shows it is in the paper.
In the paper
“In the cases of MommeD8, D9 and D10 the mean fluorescence levels were slightly lower than that seen in the wild-type littermates, consistent with a presumed reduction in the proportion of cells with two active GFP alleles.”
§ A genome-wide screen for modifiers of transgene variegation identifies genes with critical roles in development > Results and discussion > The identification of MommeD7-D10
hedgedcorrelational- Asserted: passes — The authors put it forward as true.
- Checkable: passes — It can be checked against evidence.
- Load-bearing: unclear — It is unclear whether the paper’s conclusions depend on it.
- Based: passes — The paper gives a reason why it holds.
It may state two separate claims as one.
None of the sources cited for this claim have been checked yet.
In the paper
“MommeD1 is homozygous lethal in females only, with death occurring around mid-gestation [10,11].”
§ A genome-wide screen for modifiers of transgene variegation identifies genes with critical roles in development > Results and discussion > Homozygous lethality occurs at different stages of development
What the sources say
- Not checked yetcites [10] Blewitt ME, Vickaryous NK, Hemley SJ, Ashe A, Bruxner TJ, Preis JI, Arkell R, Whitelaw E: An N-ethyl-N-nitrosourea screen for genes involved in variegation in the mouse. Proc Natl Acad Sci USA. 2005, 102: 7629-7634. 10.1073/pnas.0409375102. source
- Not checked yetcites [11] Blewitt ME, Gendrel AV, Pang Z, Sparrow DB, Whitelaw N, Craig JM, Apedaile A, Hilton DJ, Dunwoodie SL, Brockdorff N, Kay GF, Whitelaw E: SmcHD1, containing a structural-maintenance-of-chromosomes hinge domain, has a critical role in X inactivation. Nat Genet. 2008, 40: 663-669. 10.1038/ng.142. source
plaindirect- Asserted: passes — The authors put it forward as true.
- Checkable: passes — It can be checked against evidence.
- Load-bearing: unclear — It is unclear whether the paper’s conclusions depend on it.
- Based: passes — The paper gives a reason why it holds.
It may state two separate claims as one.
A conclusion the paper draws from its own results — it cites no other source for it, so there is none to check. The quote shows it is in the paper.
In the paper
“During the breeding of each mutant line, the expression profiles remained constant, consistent with the idea that we were following a single mutation in each case.”
§ A genome-wide screen for modifiers of transgene variegation identifies genes with critical roles in development > Results and discussion > The identification of MommeD7-D10
hedgedn = 4- Asserted: passes — The authors put it forward as true.
- Checkable: passes — It can be checked against evidence.
- Load-bearing: passes — The paper’s conclusions depend on it.
- Based: passes — The paper gives a reason why it holds.
It may state two separate claims as one.
A conclusion the paper draws from its own results — it cites no other source for it, so there is none to check. The quote shows it is in the paper.
In the paper
“Litter size at birth was not significantly different from that seen in wild-type litters (data not shown), suggesting that the death of most MommeD8-/- individuals occurred after birth and before weaning.”
§ A genome-wide screen for modifiers of transgene variegation identifies genes with critical roles in development > Results and discussion > Homozygous lethality occurs at different stages of development
hedged- Asserted: passes — The authors put it forward as true.
- Checkable: passes — It can be checked against evidence.
- Load-bearing: passes — The paper’s conclusions depend on it.
- Based: passes — The paper gives a reason why it holds.
It may state two separate claims as one.
None of the sources cited for this claim have been checked yet.
In the paper
“This site of integration is neither centromeric nor telomeric, and so presumably the silencing is related to the multicopy nature of the transgene array [13,14].”
§ A genome-wide screen for modifiers of transgene variegation identifies genes with critical roles in development > Results and discussion > Integration site of the GFP transgene
What the sources say
- Not checked yetcites [13] Garrick D, Fiering S, Martin DI, Whitelaw E: Repeat-induced gene silencing in mammals. Nat Genet. 1998, 18: 56-59. 10.1038/ng0198-56. source
- Not checked yetcites [14] Preis JI, Downes M, Oates NA, Rasko JE, Whitelaw E: Sensitive flow cytometric analysis reveals a novel type of parent-of-origin effect in the mouse genome. Curr Biol. 2003, 13: 955-959. 10.1016/S0960-9822(03)00335-X. source
hedgedconditionalSingle case- Asserted: passes — The authors put it forward as true.
- Checkable: passes — It can be checked against evidence.
- Load-bearing: unclear — It is unclear whether the paper’s conclusions depend on it.
- Based: passes — The paper gives a reason why it holds.
It may state two separate claims as one.
None of the sources cited for this claim have been checked yet.
In the paper
“MommeD2 and MommeD4 are homozygous lethal at 8.5 days post-coitus (dpc) and 17.5 dpc, respectively [10,12].”
§ A genome-wide screen for modifiers of transgene variegation identifies genes with critical roles in development > Results and discussion > Homozygous lethality occurs at different stages of development
What the sources say
- Not checked yetcites [10] Blewitt ME, Vickaryous NK, Hemley SJ, Ashe A, Bruxner TJ, Preis JI, Arkell R, Whitelaw E: An N-ethyl-N-nitrosourea screen for genes involved in variegation in the mouse. Proc Natl Acad Sci USA. 2005, 102: 7629-7634. 10.1073/pnas.0409375102. source
- Not checked yetcites [12] Chong S, Vickaryous N, Ashe A, Zamudio N, Youngson N, Hemley S, Stopka T, Skoultchi A, Matthews J, Scott HS, de Kretser D, O'Bryan M, Blewitt M, Whitelaw E: Modifiers of epigenetic reprogramming show paternal effects in the mouse. Nat Genet. 2007, 39: 614-622. 10.1038/ng2031. source
plain- Asserted: passes — The authors put it forward as true.
- Checkable: passes — It can be checked against evidence.
- Load-bearing: unclear — It is unclear whether the paper’s conclusions depend on it.
- Based: passes — The paper gives a reason why it holds.
It may state two separate claims as one.
In the paper
“We have previously published examples of paternal effects resulting from haploinsufficiency of modifiers of epigenetic gene silencing in the mouse [12].”
§ A genome-wide screen for modifiers of transgene variegation identifies genes with critical roles in development > Results and discussion > Abnormal phenotypes associated with heterozygosity for MommeD7-D10
What the sources say
- Not checked yetcites [12] Chong S, Vickaryous N, Ashe A, Zamudio N, Youngson N, Hemley S, Stopka T, Skoultchi A, Matthews J, Scott HS, de Kretser D, O'Bryan M, Blewitt M, Whitelaw E: Modifiers of epigenetic reprogramming show paternal effects in the mouse. Nat Genet. 2007, 39: 614-622. 10.1038/ng2031. source
plaindirect- Asserted: passes — The authors put it forward as true.
- Checkable: passes — It can be checked against evidence.
- Load-bearing: fails — The paper’s conclusions may not depend on it.
- Based: passes — The paper gives a reason why it holds.
Probably not a substantial claim. The paper’s conclusions may not depend on it.
A conclusion the paper draws from its own results — it cites no other source for it, so there is none to check. The quote shows it is in the paper.
In the paper
“There also appears to be a skewed sex ratio in the wild-type offspring of MommeD9 sires, suggesting the phenotype of the father can affect his wild-type offspring.”
§ A genome-wide screen for modifiers of transgene variegation identifies genes with critical roles in development > Results and discussion > Abnormal phenotypes associated with heterozygosity for MommeD7-D10
hedgedconditionalSingle case- Asserted: passes — The authors put it forward as true.
- Checkable: passes — It can be checked against evidence.
- Load-bearing: fails — The paper’s conclusions may not depend on it.
- Based: passes — The paper gives a reason why it holds.
Probably not a substantial claim. The paper’s conclusions may not depend on it.
A conclusion the paper draws from its own results — it cites no other source for it, so there is none to check. The quote shows it is in the paper.
In the paper
“In both cases, fewer individuals with the severe phenotypes were observed than predicted by Mendelian inheritance, suggesting reduced viability of the homozygotes (Table 2).”
§ A genome-wide screen for modifiers of transgene variegation identifies genes with critical roles in development > Results and discussion > Homozygous lethality
hedgedconditional- Asserted: passes — The authors put it forward as true.
- Checkable: passes — It can be checked against evidence.
- Load-bearing: passes — The paper’s conclusions depend on it.
- Based: passes — The paper gives a reason why it holds.
It may state two separate claims as one.
In the paper
“We have reported previously that as the percentage of expressing cells increases, the mean fluorescence of the expressing cells increases [10].”
§ A genome-wide screen for modifiers of transgene variegation identifies genes with critical roles in development > Results and discussion > The identification of MommeD7-D10
What the sources say
- Not checked yetcites [10] Blewitt ME, Vickaryous NK, Hemley SJ, Ashe A, Bruxner TJ, Preis JI, Arkell R, Whitelaw E: An N-ethyl-N-nitrosourea screen for genes involved in variegation in the mouse. Proc Natl Acad Sci USA. 2005, 102: 7629-7634. 10.1073/pnas.0409375102. source
plaindirect- Asserted: passes — The authors put it forward as true.
- Checkable: passes — It can be checked against evidence.
- Load-bearing: passes — The paper’s conclusions depend on it.
- Based: passes — The paper gives a reason why it holds.
Probably not a substantial claim.
In the paper
“A knockout of Hdac1 has been reported and the homozygous embryos died around 9.5 dpc [21], similar to the time of death observed in MommeD5-/- embryos (Figure 5c).”
§ A genome-wide screen for modifiers of transgene variegation identifies genes with critical roles in development > Results and discussion > MommeD5 has a mutation in Histone deacetylase 1
What the sources say
- Not checked yetcites [21] Lagger G, O'Carroll D, Rembold M, Khier H, Tischler J, Weitzer G, Schuettengruber B, Hauser C, Brunmeir R, Jenuwein T, Seiser C: Essential function of histone deacetylase 1 in proliferation control and CDK inhibitor repression. EMBO J. 2002, 21: 2672-2681. 10.1093/emboj/21.11.2672. source
plain- Asserted: passes — The authors put it forward as true.
- Checkable: passes — It can be checked against evidence.
- Load-bearing: passes — The paper’s conclusions depend on it.
- Based: passes — The paper gives a reason why it holds.
It may state two separate claims as one.
A conclusion the paper draws from its own results — it cites no other source for it, so there is none to check. The quote shows it is in the paper.
In the paper
“In the cases of MommeD8 and MommeD10, three expression profiles were observed, suggesting viability of some homozygotes (Figure 1, Tables 1 and 2) and in the case of MommeD10 this was later confirmed by genotyping for the point mutation.”
§ A genome-wide screen for modifiers of transgene variegation identifies genes with critical roles in development > Results and discussion > Homozygous lethality
hedgedcorrelational- Asserted: passes — The authors put it forward as true.
- Checkable: passes — It can be checked against evidence.
- Load-bearing: passes — The paper’s conclusions depend on it.
- Based: passes — The paper gives a reason why it holds.
It may state two separate claims as one.
A conclusion the paper draws from its own results — it cites no other source for it, so there is none to check. The quote shows it is in the paper.
In the paper
“At 17.5 dpc, approximately one-quarter of the embryos were pale (Table 3, Figure 3a), suggesting a red cell defect in the homozygotes.”
§ A genome-wide screen for modifiers of transgene variegation identifies genes with critical roles in development > Results and discussion > Homozygous lethality occurs at different stages of development
hedgedcorrelational- Asserted: passes — The authors put it forward as true.
- Checkable: passes — It can be checked against evidence.
- Load-bearing: passes — The paper’s conclusions depend on it.
- Based: passes — The paper gives a reason why it holds.
It may state two separate claims as one.
- The authors state this as an assumption: Abnormal pale embryos at 17.5 dpc from MommeD7 intercrosses are homozygous for MommeD7.
In the paper
“Overall, the skull shape in mutant animals is reminiscent of the head shape seen in WBS, including a small upturned nose with flat nasal bridge, micrognathia (or mandibular hypoplasia), malocclusion, bi-temporal narrowing and prominent forehead [34].”
§ A genome-wide screen for modifiers of transgene variegation identifies genes with critical roles in development > Results and discussion > A possible role for Baz1b in Williams syndrome
What the sources say
- Not checked yetcites [34] Perez Jurado AL: Williams-Beuren syndrome: a model of recurrent genomic mutation. Horm Res. 2003, 59 (Suppl 1): 106-113. 10.1159/000067836. source
plaincorrelational- Asserted: passes — The authors put it forward as true.
- Checkable: passes — It can be checked against evidence.
- Load-bearing: passes — The paper’s conclusions depend on it.
- Based: passes — The paper gives a reason why it holds.
It may state two separate claims as one.
In the paper
“It has previously been shown that Baz1b is expressed in the mouse embryo from around 9.5 dpc and whole mount in situ at 11.5 dpc showed expression in limb buds, tail and brain [24].”
§ A genome-wide screen for modifiers of transgene variegation identifies genes with critical roles in development > Results and discussion > Expression of Baz1b during mouse embryogenesis
What the sources say
- Not checked yetcites [24] Kitagawa H, Fujiki R, Yoshimura K, Mezaki Y, Uematsu Y, Matsui D, Ogawa S, Unno K, Okubo M, Tokita A, Nakagawa T, Ito T, Ishimi Y, Nagasawa H, Matsumoto T, Yanagisawa J, Kato S: The chromatin-remodeling complex WINAC targets a nuclear receptor to promoters and is impaired in Williams syndrome. Cell. 2003, 113: 905-917. 10.1016/S0092-8674(03)00436-7. source
plain- Asserted: passes — The authors put it forward as true.
- Checkable: passes — It can be checked against evidence.
- Load-bearing: fails — The paper’s conclusions may not depend on it.
- Based: passes — The paper gives a reason why it holds.
Probably not a substantial claim. The paper’s conclusions may not depend on it. It may state two separate claims as one.
None of the sources cited for this claim have been checked yet.
In the paper
“The linked interval for MommeD10 contains 52 genes and Baz1b was chosen as the best candidate because it contains a bromodomain (a domain commonly associated with chromatin remodelers) and has recently been shown to form at least two chromatin remodeling complexes and associate with replication foci and promoters [23-25].”
§ A genome-wide screen for modifiers of transgene variegation identifies genes with critical roles in development > Results and discussion > MommeD10 has a mutation in Baz1b
What the sources say
- Not checked yetcites [23] Bozhenok L, Wade PA, Varga-Weisz P: WSTF-ISWI chromatin remodeling complex targets heterochromatic replication foci. EMBO J. 2002, 21: 2231-2241. 10.1093/emboj/21.9.2231. source
- Not checked yetcites [24] Kitagawa H, Fujiki R, Yoshimura K, Mezaki Y, Uematsu Y, Matsui D, Ogawa S, Unno K, Okubo M, Tokita A, Nakagawa T, Ito T, Ishimi Y, Nagasawa H, Matsumoto T, Yanagisawa J, Kato S: The chromatin-remodeling complex WINAC targets a nuclear receptor to promoters and is impaired in Williams syndrome. Cell. 2003, 113: 905-917. 10.1016/S0092-8674(03)00436-7. source
- Not checked yetcites [25] Percipalle P, Fomproix N, Cavellan E, Voit R, Reimer G, Kruger T, Thyberg J, Scheer U, Grummt I, Farrants AK: The chromatin remodelling complex WSTF-SNF2h interacts with nuclear myosin 1 and has a role in RNA polymerase I transcription. EMBO Rep. 2006, 7: 525-530. source
plaindirect- Asserted: passes — The authors put it forward as true.
- Checkable: passes — It can be checked against evidence.
- Load-bearing: passes — The paper’s conclusions depend on it.
- Based: passes — The paper gives a reason why it holds.
It may state two separate claims as one.
A conclusion the paper draws from its own results — it cites no other source for it, so there is none to check. The quote shows it is in the paper.
In the paper
“Modifiers identified in this screen include DNA methyltransferases, chromatin remodelers and genes involved in histone modification, all of which have wide-ranging effects in the genome, making it difficult to unravel direct and indirect effects at any particular locus.”
§ A genome-wide screen for modifiers of transgene variegation identifies genes with critical roles in development > Results and discussion > Effects of MommeD5 and MommeD10 on DNA methylation at the transgene locus
plain- Asserted: passes — The authors put it forward as true.
- Checkable: passes — It can be checked against evidence.
- Load-bearing: unclear — It is unclear whether the paper’s conclusions depend on it.
- Based: passes — The paper gives a reason why it holds.
It may state two separate claims as one.
None of the sources cited for this claim have been checked yet.
In the paper
“This is consistent with the fact that both genes encode proteins involved in histone modification and chromatin remodeling [21,23-25,30-33].”
§ A genome-wide screen for modifiers of transgene variegation identifies genes with critical roles in development > Results and discussion > Effects of MommeD5 and MommeD10 on DNA methylation at the transgene locus
What the sources say
- Not checked yetcites [21] Lagger G, O'Carroll D, Rembold M, Khier H, Tischler J, Weitzer G, Schuettengruber B, Hauser C, Brunmeir R, Jenuwein T, Seiser C: Essential function of histone deacetylase 1 in proliferation control and CDK inhibitor repression. EMBO J. 2002, 21: 2672-2681. 10.1093/emboj/21.11.2672. source
- Not checked yetcites [23] Bozhenok L, Wade PA, Varga-Weisz P: WSTF-ISWI chromatin remodeling complex targets heterochromatic replication foci. EMBO J. 2002, 21: 2231-2241. 10.1093/emboj/21.9.2231. source
- Not checked yetcites [24] Kitagawa H, Fujiki R, Yoshimura K, Mezaki Y, Uematsu Y, Matsui D, Ogawa S, Unno K, Okubo M, Tokita A, Nakagawa T, Ito T, Ishimi Y, Nagasawa H, Matsumoto T, Yanagisawa J, Kato S: The chromatin-remodeling complex WINAC targets a nuclear receptor to promoters and is impaired in Williams syndrome. Cell. 2003, 113: 905-917. 10.1016/S0092-8674(03)00436-7. source
- Not checked yetcites [25] Percipalle P, Fomproix N, Cavellan E, Voit R, Reimer G, Kruger T, Thyberg J, Scheer U, Grummt I, Farrants AK: The chromatin remodelling complex WSTF-SNF2h interacts with nuclear myosin 1 and has a role in RNA polymerase I transcription. EMBO Rep. 2006, 7: 525-530. source
- Not checked yetcites [30] Ahringer J: NuRD and SIN3 histone deacetylase complexes in development. Trends Genet. 2000, 16: 351-356. 10.1016/S0168-9525(00)02066-7. source
- Not checked yetcites [31] Taunton J, Hassig CA, Schreiber SL: A mammalian histone deacetylase related to the yeast transcriptional regulator Rpd3p. Science. 1996, 272: 408-411. 10.1126/science.272.5260.408. source
- Not checked yetcites [32] Fujiki R, Kim MS, Sasaki Y, Yoshimura K, Kitagawa H, Kato S: Ligand-induced transrepression by VDR through association of WSTF with acetylated histones. EMBO J. 2005, 24: 3881-3894. 10.1038/sj.emboj.7600853. source
- Not checked yetcites [33] Poot RA, Bozhenok L, Berg van den DL, Hawkes N, Varga-Weisz PD: Chromatin remodeling by WSTF-ISWI at the replication site: opening a window of opportunity for epigenetic inheritance?. Cell Cycle. 2005, 4: 543-546. source
plaincorrelational- Asserted: passes — The authors put it forward as true.
- Checkable: passes — It can be checked against evidence.
- Load-bearing: passes — The paper’s conclusions depend on it.
- Based: passes — The paper gives a reason why it holds.
It may state two separate claims as one.
What the paper did — it cites no source for this, so there is none to check. The quote shows it is in the paper.
In the paper
“Procedures were approved by the Animal Ethics Committee of the University of Sydney and the Animal Ethics Committee of the Queensland Institute of Medical Research.”
§ A genome-wide screen for modifiers of transgene variegation identifies genes with critical roles in development > Materials and methods > Mouse strains
plain- Asserted: passes — The authors put it forward as true.
- Checkable: passes — It can be checked against evidence.
- Load-bearing: fails — The paper’s conclusions may not depend on it.
- Based: passes — The paper gives a reason why it holds.
Probably not a substantial claim. The paper’s conclusions may not depend on it. It may state two separate claims as one.
What the paper did — it cites no source for this, so there is none to check. The quote shows it is in the paper.
In the paper
“A peptide blocking experiment was carried out for the Hdac1 amino terminus using sc-6299P (Santa Cruz Biotechnology).”
§ A genome-wide screen for modifiers of transgene variegation identifies genes with critical roles in development > Materials and methods > Protein analysis
plain- Asserted: passes — The authors put it forward as true.
- Checkable: passes — It can be checked against evidence.
- Load-bearing: fails — The paper’s conclusions may not depend on it.
- Based: passes — The paper gives a reason why it holds.
Probably not a substantial claim. The paper’s conclusions may not depend on it.
In the paper
“One of the hallmarks of epigenetic gene silencing across all multicellular organisms from plants to humans is the stochastic nature by which they operate [45]”
§ A genome-wide screen for modifiers of transgene variegation identifies genes with critical roles in development > Conclusion
What the sources say
- Not checked yetcites [45] Martin DI, Whitelaw E: The vagaries of variegating transgenes. Bioessays. 1996, 18: 919-923. 10.1002/bies.950181111. source
plain- Asserted: passes — The authors put it forward as true.
- Checkable: passes — It can be checked against evidence.
- Load-bearing: fails — The paper’s conclusions may not depend on it.
- Based: passes — The paper gives a reason why it holds.
Probably not a substantial claim. The paper’s conclusions may not depend on it.
In the paper
“All reactions were performed in triplicate and normalized to both GAPDH and ribosomal highly basic 23-kDa protein (Rpl13A) [47].”
§ A genome-wide screen for modifiers of transgene variegation identifies genes with critical roles in development > Materials and methods > RNA preparation and quantitative RT-PCR
What the sources say
- Not checked yetcites [47] Mogal A, Abdulkadir SA: Effects of histone deacetylase inhibitor (HDACi); Trichostatin-A (TSA) on the expression of housekeeping genes. Mol Cell Probes. 2006, 20: 81-86. 10.1016/j.mcp.2005.09.008. source
plain- Asserted: passes — The authors put it forward as true.
- Checkable: passes — It can be checked against evidence.
- Load-bearing: fails — The paper’s conclusions may not depend on it.
- Based: passes — The paper gives a reason why it holds.
Probably not a substantial claim. The paper’s conclusions may not depend on it. It may state two separate claims as one.
What the paper did — it cites no source for this, so there is none to check. The quote shows it is in the paper.
In the paper
“To verify accuracy of the measurements, any landmarks showing marked differences between genotype groups were re-located on a separate day and the measurement repeated.”
§ A genome-wide screen for modifiers of transgene variegation identifies genes with critical roles in development > Materials and methods > Micro-CT analysis
plain- Asserted: passes — The authors put it forward as true.
- Checkable: passes — It can be checked against evidence.
- Load-bearing: fails — The paper’s conclusions may not depend on it.
- Based: passes — The paper gives a reason why it holds.
Probably not a substantial claim. The paper’s conclusions may not depend on it.
What the paper did — it cites no source for this, so there is none to check. The quote shows it is in the paper.
In the paper
“A sense probe was used in earlier experiments to confirm specificity of the antisense probe.”
§ A genome-wide screen for modifiers of transgene variegation identifies genes with critical roles in development > Materials and methods > RNA probes and whole-mount in situ hybridization
plain- Asserted: passes — The authors put it forward as true.
- Checkable: passes — It can be checked against evidence.
- Load-bearing: fails — The paper’s conclusions may not depend on it.
- Based: passes — The paper gives a reason why it holds.
Probably not a substantial claim. The paper’s conclusions may not depend on it.
The authors state this as an assumption.
Abnormal pale embryos at 17.5 dpc from MommeD7 intercrosses are homozygous for MommeD7.
“Abnormal embryos are assumed to be homozygous for MommeD7.”
The paper relies on this without support.
WBS is associated with a hemizygous deletion of approximately 28 genes in humans.
“WBS is known to be associated with a hemizygous deletion of approximately 28 genes in humans”
The paper relies on this without support.
Hdac1 and Baz1b are known to be involved in epigenetic processes.
“Both are already known to be involved in epigenetic processes”
Claims other papers make about this one
Each is checked against this paper’s own text: does it say what the citing paper says it does?
In the citing paper
“(i) its established role in NC maintenance and migration in Xenopus laevis and the craniofacial defects observed in knockout mice (10, 11);”
From Dosage analysis of the 7q11.23 Williams region identifies BAZ1B as a major human gene patterning the modern human face and underlying self-domestication (2019) · cites this paper as [11]
In the citing paper
“Mild NC deficits have been put forth as a unifying explanatory framework for the defining features of the so-called domestication syndrome, with BAZ1B listed among the putative underlying genes because of its previously reported role in the NC of model organisms (5, 10, 11).”
From Dosage analysis of the 7q11.23 Williams region identifies BAZ1B as a major human gene patterning the modern human face and underlying self-domestication (2019) · cites this paper as [11]
Self-check
Percentages, sums and reported differences re-computed from the paper’s own numbers.
Each contradiction between two passages listed here was confirmed by an independent check.
Rated minor: it would not touch a result — a value no result rests on, a p-value that stays on the same side of the significance level, or a conflict that is clerical, resolved elsewhere in the paper, or outside its own findings.
In the paper
§ A genome-wide screen for modifiers of transgene variegation identifies genes with critical roles in development > Results and discussion > Mapping
“MommeD10 maps to a 4 Mb region between markers D5Mit165 and rs13478547 on chromosome 5.”
§ A genome-wide screen for modifiers of transgene variegation identifies genes with critical roles in development > Results and discussion > MommeD10 has a mutation in Baz1b
“MommeD10 was localized to a 4 Mb region on chromosome 5 flanked by the markers D5Mit165 and rs32250347 (Table 4).”
Rated minor: it would not touch a result — a value no result rests on, a p-value that stays on the same side of the significance level, or a conflict that is clerical, resolved elsewhere in the paper, or outside its own findings.
In the paper
§ A genome-wide screen for modifiers of transgene variegation identifies genes with critical roles in development > Results and discussion > Mapping
“MommeD9 maps to a 3 Mb region on chromosome 7 between markers rs31712695 and rs6193818”
§ A genome-wide screen for modifiers of transgene variegation identifies genes with critical roles in development > Results and discussion > Homozygous lethality occurs at different stages of development
“| MommeD9 | Enhancer | Chr 7 (4) | 80 | E9 |”
Citations
Cites
2 retracted
Kitagawa, H., Fujiki, R., Yoshimura, K., Mezaki, Y., Uematsu, Y., Matsui, D., Ogawa, S., Unno, K., Okubo, M., Tokita, A., et al. (2003) · Cell · doi:10.1016/s0092-8674(03)00436-7 · Cited by 268 · cited 3×
“The linked interval for MommeD10 contains 52 genes and Baz1b was chosen as the best candidate because it contains a bromodomain (a domain commonly associated with chromatin remodelers) and has recently been shown to form at least two chromatin remodeling complexes and associate with replication foci and promoters [23-…”
RetractedFujiki, R., Kim, M., Sasaki, Y., Yoshimura, K., Kitagawa, H., & Kato, S. (2005) · The EMBO Journal · doi:10.1038/sj.emboj.7600853 · Cited by 109
RetractedTransposable elements: targets for early nutritional effects on epigenetic gene regulation
Waterland, R. A., & Jirtle, R. L. (2003) · Molecular and Cellular Biology · doi:10.1128/mcb.23.15.5293-5300.2003 · Cited by 2,019 · cited 1×
“In this case there is a correlation between DNA methylation at the promoter and silencing of the gene [5,6].”
BackgroundA Mammalian Histone Deacetylase Related to the Yeast Transcriptional Regulator Rpd3p
Taunton, J., Hassig, C. A., & Schreiber, S. L. (1996) · Science · doi:10.1126/science.272.5260.408 · Cited by 1,829
Epigenetic inheritance at the agouti locus in the mouse
Morgan, H. D., Sutherland, H. G. E., Martin, D. I. K., & Whitelaw, E. (1999) · Nature Genetics · doi:10.1038/15490 · Cited by 1,476
Self-citationRepeat-induced gene silencing in mammals
Garrick, D., Fiering, S., Martin, D. I. K., & Whitelaw, E. (1998) · Nature Genetics · doi:10.1038/ng0198-56 · Cited by 887 · cited 1×
“This site of integration is neither centromeric nor telomeric, and so presumably the silencing is related to the multicopy nature of the transgene array [13,14].”
BackgroundSelf-citationEssential function of histone deacetylase 1 in proliferation control and CDK inhibitor repression
Lagger, G., O'Carroll, D., Rembold, M., Khier, H., Tischler, J., Weitzer, G., Schuettengruber, B., Hauser, C., Brunmeir, R., Jenuwein, T., et al. (2002) · The EMBO Journal · doi:10.1093/emboj/21.11.2672 · Cited by 760
Structural Snapshots of Human HDAC8 Provide Insights into the Class I Histone Deacetylases
Somoza, J. R., Skene, R. J., Katz, B. A., Mol, C., Ho, J. D., Jennings, A. J., Luong, C., Arvai, A., Buggy, J. J., Chi, E., et al. (2004) · Structure · doi:10.1016/j.str.2004.04.012 · Cited by 710 · cited 1×
“Protein modeling predictions based on human HDAC8, for which the crystal structure has been solved [18,19], suggest that the carboxyl terminus of Hdac1 is relatively unstructured and so the mutation is unlikely to affect the stability of the protein (J Matthews, personal communication).”
BackgroundRakyan, V. K., Chong, S., Blewitt, M. E., Cuthbert, P. C., Morgan, H. D., Luu, K. V. K., & Whitelaw, E. (2003) · Proceedings of the National Academy of Sciences · doi:10.1073/pnas.0436776100 · Cited by 642
Self-citationVannini, A., Volpari, C., Filocamo, G., Casavola, E. C., Brunetti, M., Renzoni, D., Chakravarty, P., Paolini, C., De Francesco, R., Gallinari, P., et al. (2004) · Proceedings of the National Academy of Sciences · doi:10.1073/pnas.0404603101 · Cited by 638
Cited by
Sorted by citations
Child Health, Developmental Plasticity, and Epigenetic Programming
Hochberg, Z., Feil, R., Constância, M., Fraga, M. F., Junien, C., Carel, J., Boileau, P., Bouc, Y. L., Deal, C., Lillycrop, K. A., et al. (2010) · Endocrine Reviews · doi:10.1210/er.2009-0039 · Cited by 657
Self-citationEpigenetic mechanisms in neurological diseases: genes, syndromes, and therapies
Urdinguio, R. G., Sanchez-Mut, J. V., & Esteller, M. (2009) · The Lancet Neurology · doi:10.1016/s1474-4422(09)70262-5 · Cited by 598
ATP-dependent chromatin remodeling during mammalian development
Hota, S. K., & Bruneau, B. G. (2016) · Development · doi:10.1242/dev.128892 · Cited by 253
Histone deacetylase HDAC1/HDAC2-controlled embryonic development and cell differentiation
Brunmeir, R., Lagger, S., & Seiser, C. (2009) · The International Journal of Developmental Biology · doi:10.1387/ijdb.082649rb · Cited by 198
Transcriptional Silencing and Reactivation in Transgenic Zebrafish
Goll, M. G., Anderson, R. M., Stainier, D. Y. R., Spradling, A. C., & Halpern, M. E. (2009) · Genetics · doi:10.1534/genetics.109.102079 · Cited by 155
Metadata
- Authors
- Ashe, A., Morgan, D. K., Whitelaw, N. C., Bruxner, T. J., Vickaryous, N. K., Cox, L. L., Butterfield, N. C., Wicking, C., Blewitt, M. E., Wilkins, S. J., Anderson, G. J., Cox, T. C., & Whitelaw, E.
- Affiliations
- QIMR Berghofer Medical Research Institute (AU)
- The University of Queensland (AU)
- University of Washington (US)
- Walter and Eliza Hall Institute of Medical Research (AU)
- Corresponding author
- Whitelaw, Emma
- ORCID
- Venue
- Genome Biology
- Published
- 2008-12-19
- Volume
- 9
- Issue
- 12
- Pages
- R182-R182
- ISSN
- 1465-6906 (ISSN-L)
- 1474-760X
- PMC
- PMC2646286
- OpenAlex
- W2142568242
- Cited by
- 117
- References
- 48
- Citations by year
- 2026: 2 · 2025: 1 · 2024: 8 · 2023: 3 · 2022: 7 · 2021: 7 · 2020: 4 · 2019: 6 · 2018: 5 · 2017: 5 · 2016: 7 · 2015: 6 · 2014: 10 · 2013: 12 · 2012: 14
- FWCI
- 2.75
- Type
- journal article
- Language
- en
- Open access
- gold
- doi.org
- Locations
- Genome biology (publishedVersion, cc-by)
- PubMed Central (publishedVersion, cc-by)
- PubMed (publishedVersion)
- Minerva Access (University of Melbourne) (submittedVersion, cc-by)
- Funders
- University of Sydney
- National Health and Medical Research Council
- Topics
- Life Sciences › Biochemistry, Genetics and Molecular Biology › Molecular Biology › Epigenetics and DNA Methylation
- Life Sciences › Biochemistry, Genetics and Molecular Biology › Molecular Biology › Genomics and Chromatin Dynamics
- Life Sciences › Biochemistry, Genetics and Molecular Biology › Genetics › Genetics and Neurodevelopmental Disorders
- Keywords
- epigenetic silencing, modifier screen, N-ethyl-N-nitrosourea mutagenesis, SMCHD1, DNMT1, SNF2H, HDAC1, BAZ1B, Williams syndrome, developmental abnormalities, reproductive fitness, chromatin remodeling, histone deacetylase, mouse model
- MeSH terms
- Bromodomain Containing Proteins, Animals, Female, Genes, Lethal, Heterozygote, Histone Deacetylases, Male, Mice, Inbred C57BL, Mice, Inbred Strains, Mice, Transgenic, Transcription Factors, Genome, Williams Syndrome, Epigenesis, Genetic, Embryonic Development, Mice, Histone Deacetylase 1
About these checks
Registry, retraction, Cites and statistics results are computed, not judged, with one exception: a printed reference that no index lists is read once by a model before it counts as a citation error. Claims are extracted by a model and kept only when their quote appears verbatim in the text; each cited source is then checked, with a model’s help, for whether it says what the claim relies on. Those verdicts can be wrong — read the claim’s quote and the cited source before relying on one.
A language model drew the claims from the paper on 2026-10-10, under version 3 of the claim definition (model deepseek-v4.1-flash, prompt extract-v3).
A second model labelled each claim on 2026-10-10 (model jev-1.13-20260917, definition revision gold-guideline-v0.2).
Cited sources are checked with a language model’s help (gpt-6-sol).
Statistics and arithmetic are recomputed, not judged.
Confidence bands are shown only for fields calibrated on our annotated test set. None is calibrated yet, so no band is shown.
What counts as a claim ›How we measure confidence ›How we check this ›
Are you an author, or do you see a problem with this page? Request a review
