

The DOI matches its Crossref record; 109 of the 109 references it cites were found in a registry or an index; 3 of the 68 sources its claims cite were checked for support.
Reduction in parvalbumin expression not loss of the parvalbumin-expressing GABA interneuron subpopulation in genetic parvalbumin and shank mouse models of autism
Open accessAbstract
BACKGROUND: A reduction of the number of parvalbumin (PV)-immunoreactive (PV(+)) GABAergic interneurons or a decrease in PV immunoreactivity was reported in several mouse models of autism spectrum disorders (ASD). This includes Shank mutant mice, with SHANK being one of the most important gene families mutated in human ASD. Similar findings were obtained in heterozygous (PV+/-) mice for the Pvalb gene, which display a robust ASD-like phenotype. Here, we addressed the question whether the observed reduction in PV immunoreactivity was the result of a decrease in PV expression levels and/or loss of the PV-expressing GABA interneuron subpopulation hereafter called "Pvalb neurons". The two alternatives have important implications as they likely result in opposing effects on the excitation/inhibition balance, with decreased PV expression resulting in enhanced inhibition, but loss of the Pvalb neuron subpopulation in reduced inhibition. METHODS: Stereology was used to determine the number of Pvalb neurons in ASD-associated brain regions including the medial prefrontal cortex, somatosensory cortex and striatum of PV-/-, PV+/-, Shank1-/- and Shank3B-/- mice. As a second marker for the identification of Pvalb neurons, we used Vicia Villosa Agglutinin (VVA), a lectin recognizing the specific extracellular matrix enwrapping Pvalb neurons. PV protein and Pvalb mRNA levels were determined quantitatively by Western blot analyses and qRT-PCR, respectively. RESULTS: Our analyses of total cell numbers in different brain regions indicated that the observed "reduction of PV(+) neurons" was in all cases, i.e., in PV+/-, Shank1-/- and Shank3B-/- mice, due to a reduction in Pvalb mRNA and PV protein, without any indication of neuronal cell decrease/loss of Pvalb neurons evidenced by the unaltered numbers of VVA(+) neurons. CONCLUSIONS: Our findings suggest that the PV system might represent a convergent downstream endpoint for some forms of ASD, with the excitation/inhibition balance shifted towards enhanced inhibition due to the down-regulation of PV being a promising target for future pharmacological interventions. Testing whether approaches aimed at restoring normal PV protein expression levels and/or Pvalb neuron function might reverse ASD-relevant phenotypes in mice appears therefore warranted and may pave the way for novel therapeutic treatment strategies.
Overview
AI snapshot
Written from the paper’s full text.
TL;DR
In genetic mouse models of autism (PV+/-, PV-/-, Shank1-/-, Shank3B-/-), reduced PV immunoreactivity reflected lower Pvalb mRNA/PV protein rather than loss of Pvalb neurons, since VVA+ neuron numbers were unchanged. The authors conclude PV down-regulation may be a convergent ASD endpoint shifting excitation/inhibition balance toward enhanced inhibition.
Key findings
- In PV+/- mice, PV+ cells were reduced to ~60% of WT across mPFC, SSC, and striatum, while VVA+ cell numbers were unchanged (average 98% of WT); PV-/- mice had essentially no PV+ cells but VVA+ numbers averaged 99% of WT.
- In Shank1-/- SSC, PV+ cells were reduced to 62% of WT with unchanged VVA+ cells; in Shank3B-/- striatum, PV+ cells were reduced to ~58% of WT with unchanged VVA+ cells.
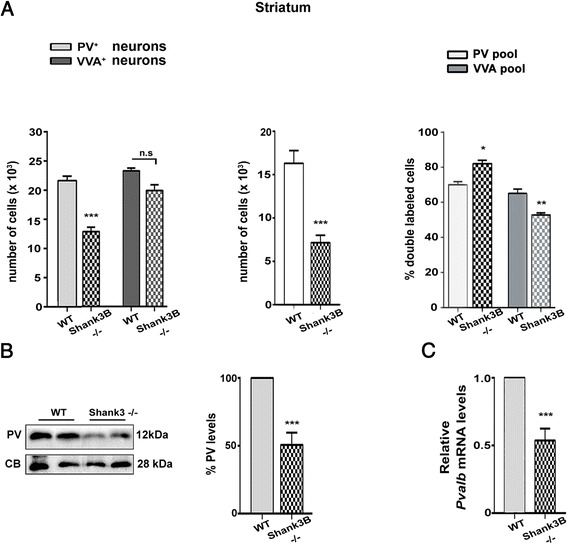
- PV protein and Pvalb mRNA were reduced by ~50% in PV+/- mice; in Shank3B-/- striatum, mRNA was 53 ± 8% and protein 50 ± 9% of WT, with similar transcriptional down-regulation in Shank1-/-.
- Co-localization showed ~70% double-labeled PV+/VVA+ cells in WT vs ~55% in PV+/-; ~75% of PV+ cells were VVA-surrounded in all regions with no WT vs PV+/- difference, while VVA+ cells expressing PV fell from ~68% in WT to ~45% in PV+/-.
Methods
- Stereology using the optical fractionator was used to estimate PV+ and VVA+ cell numbers in mPFC, SSC, and striatum of postnatal day 25 male PV+/+, PV+/-, PV-/-, Shank1-/-, and Shank3B-/- mice; an EGFP-Pvalb reporter line was also used.
- PV protein levels were measured by Western blot with calbindin D-28k, GAPDH, or Ponceau Red normalization; Pvalb mRNA was measured by qRT-PCR normalized to 18S rRNA.
- Five animals per genotype from heterozygous breedings were analyzed, including littermate controls; statistics used Student’s t-test for mRNA/protein and one-way ANOVA with Tukey’s post hoc test for stereology.
Limitations
- No dedicated limitations section is included; the authors note that VVA/PNN staining is developmentally and layer-dependent, activity-regulated, and altered under pathological conditions, and that PNN overlap with PV+ neurons is not absolute.
- Evident from the text: only male mice were used, all analyses were at PND25, and stereological quantification focused on selected regions (mPFC, SSC, striatum), with some regional comparisons assessed only qualitatively.
- Evident from the text: the study reports correlational down-regulation of PV and does not test whether restoring PV expression or Pvalb neuron function reverses ASD-relevant phenotypes.
Model-written summary. Check it against the paper before relying on it.
Integrity signals
Registry
Cites
Statistics
Figures
Verification
Claims the paper makes
40 Not checked yet · 35 Own result · 17 Own interpretation · 5 No basis given · 2 Own method · 1 Supported so far
The sources with a verdict support this claim; the rest weren’t checked yet, have no full text we could read, or their verdicts aren’t rated yet.
In the paper
“As already reported in several studies [47, 72–74] canonical ASD mouse models were shown to display a reduction in the number of PV-immunoreactive cells in various brain regions.”
§ Reduction in parvalbumin expression not loss of the parvalbumin-expressing GABA interneuron subpopulation in genetic parvalbumin and shank mouse models of autism > Results > PV expression levels are reduced in two canonical ASD models, Shank1-/- and Shank3B-/-, while VVA+ Pvalb neuron numbers are unaltered
What the sources say
- Supportedcites [47] Gogolla N, Leblanc JJ, Quast KB, Sudhof TC, Fagiolini M, Hensch TK. Common circuit defect of excitatory-inhibitory balance in mouse models of autism. J Neurodev Disord. 2009;1(2):172–81. doi: 10.1007/s11689-009-9023-x . source
The section “Common disruption of parvalbumin-positive GABA circuits in ASD models” reports reduced PV-positive cell numbers in VPA-exposed and NL-3 mutant mice. It describes affected neocortical areas, including parts of the primary somatosensory and secondary visual cortices; the reported deficit is neocortical, not present in hippocampal CA1. (LLM, conf=0.87)
- Supportedcites [72] Selby L, Zhang C, Sun QQ. Major defects in neocortical GABAergic inhibitory circuits in mice lacking the fragile X mental retardation protein. Neurosci Lett. 2007;412(3):227–32. doi: 10.1016/j.neulet.2006.11.062 . source
The Materials and Methods passage reports significantly fewer PV-positive neurons in the somatosensory cortex of FMR1KO mice than in wild-type mice (205 ± 20 versus 251 ± 16 cells/mm²). This paper supports the FMR1KO example within the multi-citation statement; it does not itself establish reductions across multiple models or brain regions. (LLM, conf=0.89)
- Supportedcites [73] Sadakata T, Washida M, Iwayama Y, Shoji S, Sato Y, Ohkura T, et al. Autistic-like phenotypes in Cadps2-knockout mice and aberrant CADPS2 splicing in autistic patients. J Clin Invest. 2007;117(4):931–43. doi: 10.1172/JCI29031 . source
The Results (Figures 5 and 6) report fewer parvalbumin-positive interneurons in P17 Cadps2-knockout mice than in wild-type mice in both the neocortex and hippocampus. This paper supports the cited sentence by providing one ASD mouse model with reductions in two brain regions; the other cited studies are not needed to assess this source's contribution. (LLM, conf=0.92)
- Not checked yetcites [74] Tripathi PP, Sgado P, Scali M, Viaggi C, Casarosa S, Simon HH, et al. Increased susceptibility to kainic acid-induced seizures in Engrailed-2 knockout mice. Neuroscience. 2009;159(2):842–9. doi: 10.1016/j.neuroscience.2009.01.007 . source
plaincorrelational- Asserted: passes — The authors put it forward as true.
- Checkable: passes — It can be checked against evidence.
- Load-bearing: passes — The paper’s conclusions depend on it.
- Based: passes — The paper gives a reason why it holds.
- Supported
A result the paper reports from its own data — it cites no other source for it, so there is none to check. The quote shows it is in the paper.
In the paper
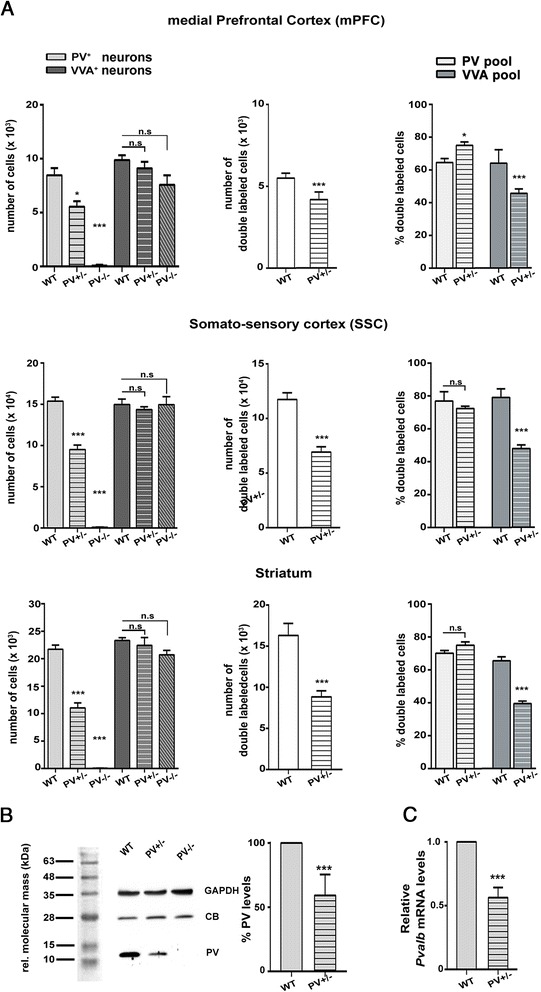
“An average of the three regions resulted in values of 98 % and 99 % of WT control for PV+/- and PV-/-, respectively”
§ Reduction in parvalbumin expression not loss of the parvalbumin-expressing GABA interneuron subpopulation in genetic parvalbumin and shank mouse models of autism > Results > The numbers of PV+ (Pvalb) interneurons are not changed in PV-reduced (PV+/-) and in PV-deficient (PV-/-) mice
plain- Asserted: passes — The authors put it forward as true.
- Checkable: passes — It can be checked against evidence.
- Load-bearing: passes — The paper’s conclusions depend on it.
- Based: passes — The paper gives a reason why it holds.
A result the paper reports from its own data — it cites no other source for it, so there is none to check. The quote shows it is in the paper.
In the paper
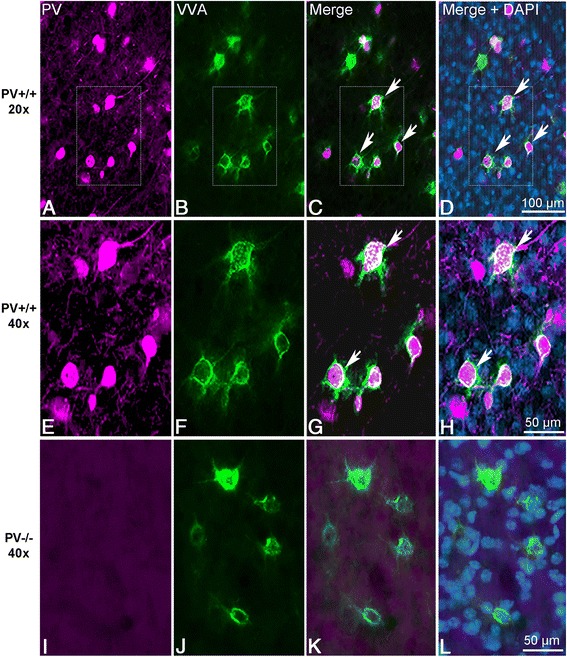
“Values were clearly lower in PV+/- mice, on average 45 %, i.e., approximately one third fewer double-labeled cells compared to WT (Fig. 3a, right).”
§ Reduction in parvalbumin expression not loss of the parvalbumin-expressing GABA interneuron subpopulation in genetic parvalbumin and shank mouse models of autism > Results > The numbers of PV+ (Pvalb) interneurons are not changed in PV-reduced (PV+/-) and in PV-deficient (PV-/-) mice
boostedcorrelational- Asserted: passes — The authors put it forward as true.
- Checkable: passes — It can be checked against evidence.
- Load-bearing: passes — The paper’s conclusions depend on it.
- Based: passes — The paper gives a reason why it holds.
A result the paper reports from its own data — it cites no other source for it, so there is none to check. The quote shows it is in the paper.
In the paper
“no positive staining for PV was detectable in the sections from PV-/- mice (Fig. 1).”
§ Reduction in parvalbumin expression not loss of the parvalbumin-expressing GABA interneuron subpopulation in genetic parvalbumin and shank mouse models of autism > Results > The numbers of PV+ (Pvalb) interneurons are not changed in PV-reduced (PV+/-) and in PV-deficient (PV-/-) mice
plain- Asserted: passes — The authors put it forward as true.
- Checkable: passes — It can be checked against evidence.
- Load-bearing: passes — The paper’s conclusions depend on it.
- Based: passes — The paper gives a reason why it holds.
A result the paper reports from its own data — it cites no other source for it, so there is none to check. The quote shows it is in the paper.
In the paper
“On average, PV+ cells in PV+/- mice were reduced to 60 % of PV+/+ controls”
§ Reduction in parvalbumin expression not loss of the parvalbumin-expressing GABA interneuron subpopulation in genetic parvalbumin and shank mouse models of autism > Results > The numbers of PV+ (Pvalb) interneurons are not changed in PV-reduced (PV+/-) and in PV-deficient (PV-/-) mice
plaindirect- Asserted: passes — The authors put it forward as true.
- Checkable: passes — It can be checked against evidence.
- Load-bearing: unclear — It is unclear whether the paper’s conclusions depend on it.
- Based: passes — The paper gives a reason why it holds.
A result the paper reports from its own data — it cites no other source for it, so there is none to check. The quote shows it is in the paper.
In the paper
“We observed a significant reduction in the number of PV+ interneurons in PV+/- and PV-/- mice compared to PV+/+ in all ROIs.”
§ Reduction in parvalbumin expression not loss of the parvalbumin-expressing GABA interneuron subpopulation in genetic parvalbumin and shank mouse models of autism > Results > The numbers of PV+ (Pvalb) interneurons are not changed in PV-reduced (PV+/-) and in PV-deficient (PV-/-) mice
plaindirect- Asserted: passes — The authors put it forward as true.
- Checkable: passes — It can be checked against evidence.
- Load-bearing: unclear — It is unclear whether the paper’s conclusions depend on it.
- Based: passes — The paper gives a reason why it holds.
A result the paper reports from its own data — it cites no other source for it, so there is none to check. The quote shows it is in the paper.
In the paper
“Evidently, the count in PV-/- cells was essentially zero.”
§ Reduction in parvalbumin expression not loss of the parvalbumin-expressing GABA interneuron subpopulation in genetic parvalbumin and shank mouse models of autism > Results > The numbers of PV+ (Pvalb) interneurons are not changed in PV-reduced (PV+/-) and in PV-deficient (PV-/-) mice
plain- Asserted: passes — The authors put it forward as true.
- Checkable: passes — It can be checked against evidence.
- Load-bearing: passes — The paper’s conclusions depend on it.
- Based: passes — The paper gives a reason why it holds.
A result the paper reports from its own data — it cites no other source for it, so there is none to check. The quote shows it is in the paper.
In the paper
“Vice versa, VVA+ cells that also showed PV staining accounted for around 68 % in PV+/+ mice for all the three ROIs.”
§ Reduction in parvalbumin expression not loss of the parvalbumin-expressing GABA interneuron subpopulation in genetic parvalbumin and shank mouse models of autism > Results > The numbers of PV+ (Pvalb) interneurons are not changed in PV-reduced (PV+/-) and in PV-deficient (PV-/-) mice
plain- Asserted: passes — The authors put it forward as true.
- Checkable: passes — It can be checked against evidence.
- Load-bearing: unclear — It is unclear whether the paper’s conclusions depend on it.
- Based: passes — The paper gives a reason why it holds.
A result the paper reports from its own data — it cites no other source for it, so there is none to check. The quote shows it is in the paper.
In the paper
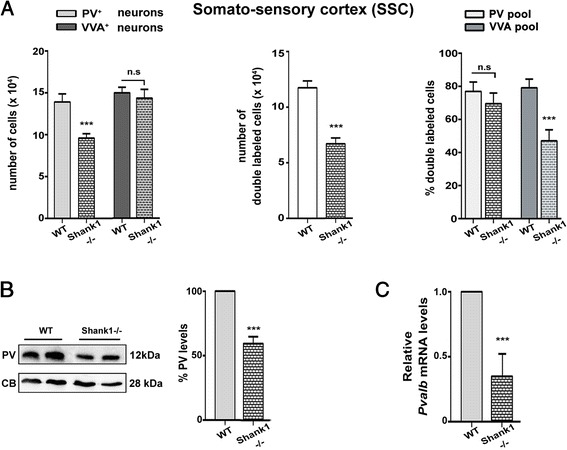
“Interestingly, in the Shank3B-/- mice, the number of PV+ cells also expressing VVA was even slightly increased (Fig. 6a, right).”
§ Reduction in parvalbumin expression not loss of the parvalbumin-expressing GABA interneuron subpopulation in genetic parvalbumin and shank mouse models of autism > Results > PV expression levels are reduced in two canonical ASD models, Shank1-/- and Shank3B-/-, while VVA+ Pvalb neuron numbers are unaltered
plain- Asserted: passes — The authors put it forward as true.
- Checkable: passes — It can be checked against evidence.
- Load-bearing: unclear — It is unclear whether the paper’s conclusions depend on it.
- Based: passes — The paper gives a reason why it holds.
A result the paper reports from its own data — it cites no other source for it, so there is none to check. The quote shows it is in the paper.
In the paper
“The percentage of double-labeled cells was rather homogeneous among brain regions and in the order of 70 % in PV+/+ and 55 % in PV+/- brains (Fig. 3a, middle).”
§ Reduction in parvalbumin expression not loss of the parvalbumin-expressing GABA interneuron subpopulation in genetic parvalbumin and shank mouse models of autism > Results > The numbers of PV+ (Pvalb) interneurons are not changed in PV-reduced (PV+/-) and in PV-deficient (PV-/-) mice
plain- Asserted: passes — The authors put it forward as true.
- Checkable: passes — It can be checked against evidence.
- Load-bearing: passes — The paper’s conclusions depend on it.
- Based: passes — The paper gives a reason why it holds.
- It may state two separate claims as one. 22
- Probably not a substantial claim. 29
A result the paper reports from its own data — it cites no other source for it, so there is none to check. The quote shows it is in the paper.
In the paper
“This percentage was found to be ~75 % in all the ROIs and there were no significant differences between PV+/+ and PV+/- mice (Fig. 3a, right).”
§ Reduction in parvalbumin expression not loss of the parvalbumin-expressing GABA interneuron subpopulation in genetic parvalbumin and shank mouse models of autism > Results > The numbers of PV+ (Pvalb) interneurons are not changed in PV-reduced (PV+/-) and in PV-deficient (PV-/-) mice
plain- Asserted: passes — The authors put it forward as true.
- Checkable: passes — It can be checked against evidence.
- Load-bearing: passes — The paper’s conclusions depend on it.
- Based: passes — The paper gives a reason why it holds.
It may state two separate claims as one.
A result the paper reports from its own data — it cites no other source for it, so there is none to check. The quote shows it is in the paper.
In the paper
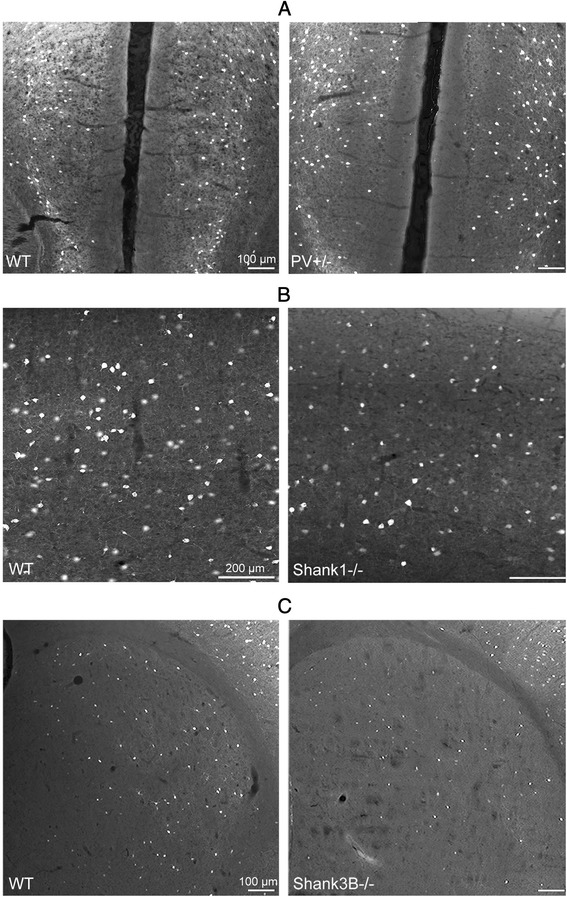
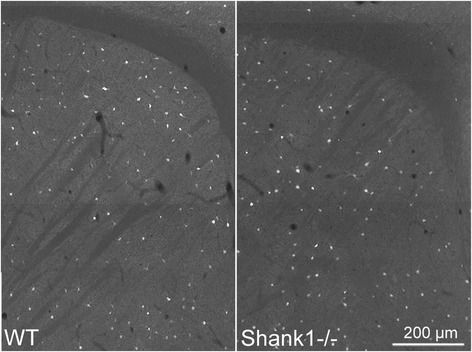
“Qualitatively, immunofluorescence images revealed no prominent differences with respect to staining intensity and PV+ neuron density between WT and Shank1-/- mice in the striatum (Fig. 5).”
§ Reduction in parvalbumin expression not loss of the parvalbumin-expressing GABA interneuron subpopulation in genetic parvalbumin and shank mouse models of autism > Results > PV expression levels are reduced in two canonical ASD models, Shank1-/- and Shank3B-/-, while VVA+ Pvalb neuron numbers are unaltered
plain- Asserted: passes — The authors put it forward as true.
- Checkable: passes — It can be checked against evidence.
- Load-bearing: unclear — It is unclear whether the paper’s conclusions depend on it.
- Based: passes — The paper gives a reason why it holds.
It may state two separate claims as one.
A result the paper reports from its own data — it cites no other source for it, so there is none to check. The quote shows it is in the paper.
In the paper
“The number of PV+ cells was significantly reduced to 62 % of PV+/+ in Shank1-/- mice, while the number of VVA+ cells was unaltered (Fig. 4a, left & Table 4)”
§ Reduction in parvalbumin expression not loss of the parvalbumin-expressing GABA interneuron subpopulation in genetic parvalbumin and shank mouse models of autism > Results > PV expression levels are reduced in two canonical ASD models, Shank1-/- and Shank3B-/-, while VVA+ Pvalb neuron numbers are unaltered
plain- Asserted: passes — The authors put it forward as true.
- Checkable: passes — It can be checked against evidence.
- Load-bearing: passes — The paper’s conclusions depend on it.
- Based: passes — The paper gives a reason why it holds.
It may state two separate claims as one.
A result the paper reports from its own data — it cites no other source for it, so there is none to check. The quote shows it is in the paper.
In the paper
“While the number of VVA+ cells was unchanged, the number of PV+ cells was reduced to approximately 58 % (Fig. 6a, left & Table 4).”
§ Reduction in parvalbumin expression not loss of the parvalbumin-expressing GABA interneuron subpopulation in genetic parvalbumin and shank mouse models of autism > Results > PV expression levels are reduced in two canonical ASD models, Shank1-/- and Shank3B-/-, while VVA+ Pvalb neuron numbers are unaltered
plain- Asserted: passes — The authors put it forward as true.
- Checkable: passes — It can be checked against evidence.
- Load-bearing: passes — The paper’s conclusions depend on it.
- Based: passes — The paper gives a reason why it holds.
It may state two separate claims as one.
A result the paper reports from its own data — it cites no other source for it, so there is none to check. The quote shows it is in the paper.
In the paper
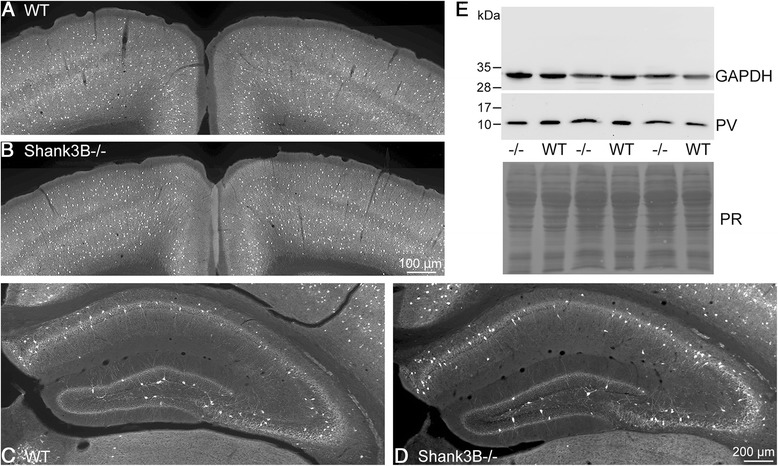
“quantitative RT-PCR results and moreover Western blots showed that both PV mRNA level and protein levels, respectively (Fig. 4b, c), were significantly decreased”
§ Reduction in parvalbumin expression not loss of the parvalbumin-expressing GABA interneuron subpopulation in genetic parvalbumin and shank mouse models of autism > Results > PV expression levels are reduced in two canonical ASD models, Shank1-/- and Shank3B-/-, while VVA+ Pvalb neuron numbers are unaltered
boosted- Asserted: passes — The authors put it forward as true.
- Checkable: passes — It can be checked against evidence.
- Load-bearing: passes — The paper’s conclusions depend on it.
- Based: passes — The paper gives a reason why it holds.
It may state two separate claims as one.
A result the paper reports from its own data — it cites no other source for it, so there is none to check. The quote shows it is in the paper.
In the paper
“as the result of decreased PV protein expression levels in PV+/- mice, both the total number of PV+ cells, as well as the percentage of VVA+ cells expressing PV was significantly decreased in all regions analyzed in our study.”
§ Reduction in parvalbumin expression not loss of the parvalbumin-expressing GABA interneuron subpopulation in genetic parvalbumin and shank mouse models of autism > Discussion
plaindirect- Asserted: passes — The authors put it forward as true.
- Checkable: passes — It can be checked against evidence.
- Load-bearing: passes — The paper’s conclusions depend on it.
- Based: passes — The paper gives a reason why it holds.
It may state two separate claims as one.
A conclusion the paper draws from its own results — it cites no other source for it, so there is none to check. The quote shows it is in the paper.
In the paper
“This indicates that all identified PV+ cells were highly likely to show VVA staining, while in a fraction of VVA+ cells, PV expression levels, more prominently in PV+/- mice were below the predefined PV expression threshold and were thus not considered as double-labeled cells.”
§ Reduction in parvalbumin expression not loss of the parvalbumin-expressing GABA interneuron subpopulation in genetic parvalbumin and shank mouse models of autism > Results > The numbers of PV+ (Pvalb) interneurons are not changed in PV-reduced (PV+/-) and in PV-deficient (PV-/-) mice
hedgedcorrelational- Asserted: passes — The authors put it forward as true.
- Checkable: passes — It can be checked against evidence.
- Load-bearing: passes — The paper’s conclusions depend on it.
- Based: passes — The paper gives a reason why it holds.
It may state two separate claims as one.
None of the sources cited for this claim have been checked yet.
In the paper
“a quantitative and systematic analysis of Pvalb neurons by unbiased stereology in different brain regions including ASD-implicated regions such as the medial prefrontal cortex (mPFC), somatosensory cortex (SSC) and striatum was still missing.”
§ Reduction in parvalbumin expression not loss of the parvalbumin-expressing GABA interneuron subpopulation in genetic parvalbumin and shank mouse models of autism > Background
What the sources say
- Not checked yetcites [55] Vreugdenhil M, Jefferys JG, Celio MR, Schwaller B. Parvalbumin-deficiency facilitates repetitive IPSCs and gamma oscillations in the hippocampus. J Neurophysiol. 2003;89(3):1414–22. source
- Not checked yetcites [57] Schwaller B, Tetko IV, Tandon P, Silveira DC, Vreugdenhil M, Henzi T, et al. Parvalbumin deficiency affects network properties resulting in increased susceptibility to epileptic seizures. Mol Cell Neurosci. 2004;25(4):650–63. source
plain- Asserted: passes — The authors put it forward as true.
- Checkable: passes — It can be checked against evidence.
- Load-bearing: passes — The paper’s conclusions depend on it.
- Based: passes — The paper gives a reason why it holds.
Probably not a substantial claim.
The paper states this without a source or data behind it here, so there is nothing to check it against. The quote shows it is in the paper.
In the paper
“genetic Shank mouse models display behavioral alterations with relevance to all human ASD core symptoms.”
§ Reduction in parvalbumin expression not loss of the parvalbumin-expressing GABA interneuron subpopulation in genetic parvalbumin and shank mouse models of autism > Background
plaindirect- Asserted: passes — The authors put it forward as true.
- Checkable: passes — It can be checked against evidence.
- Load-bearing: fails — The paper’s conclusions may not depend on it.
- Based: passes — The paper gives a reason why it holds.
Probably not a substantial claim. The paper’s conclusions may not depend on it.
In the paper
“all together provide evidence that PV plays a key role in the regulation of local inhibitory effects on pyramidal neurons, as well as on other interneurons (for more details, see [56]).”
§ Reduction in parvalbumin expression not loss of the parvalbumin-expressing GABA interneuron subpopulation in genetic parvalbumin and shank mouse models of autism > Background
What the sources say
- Not checked yetcites [56] Schwaller B. The use of transgenic mouse models to reveal the functions of Ca2+ buffer proteins in excitable cells. Biochim Biophys Acta. 2012;1820(8):1294–303. doi: 10.1016/j.bbagen.2011.11.008 . source
plaindirect- Asserted: passes — The authors put it forward as true.
- Checkable: passes — It can be checked against evidence.
- Load-bearing: passes — The paper’s conclusions depend on it.
- Based: passes — The paper gives a reason why it holds.
Probably not a substantial claim.
None of the sources cited for this claim have been checked yet.
In the paper
“a reduction in the order of 20–25 % in the number of PV-immunoreactive (PV+) neurons has been reported in ASD individuals [46] and mouse ASD models [47]”
§ Reduction in parvalbumin expression not loss of the parvalbumin-expressing GABA interneuron subpopulation in genetic parvalbumin and shank mouse models of autism > Background
What the sources say
- Not checked yetcites [46] Zikopoulos B, Barbas H. Altered neural connectivity in excitatory and inhibitory cortical circuits in autism. Front Hum Neurosci. 2013;7:609. doi: 10.3389/fnhum.2013.00609 . source
- Not checked yetcites [47] Gogolla N, Leblanc JJ, Quast KB, Sudhof TC, Fagiolini M, Hensch TK. Common circuit defect of excitatory-inhibitory balance in mouse models of autism. J Neurodev Disord. 2009;1(2):172–81. doi: 10.1007/s11689-009-9023-x . source
plaincorrelational- Asserted: passes — The authors put it forward as true.
- Checkable: passes — It can be checked against evidence.
- Load-bearing: passes — The paper’s conclusions depend on it.
- Based: passes — The paper gives a reason why it holds.
Probably not a substantial claim.
None of the sources cited for this claim have been checked yet.
In the paper
“high mRNA levels of Shank1 in cortex and hippocampus and of Shank3 in striatum and cortex [36, 77]”
§ Reduction in parvalbumin expression not loss of the parvalbumin-expressing GABA interneuron subpopulation in genetic parvalbumin and shank mouse models of autism > Results > PV expression levels are reduced in two canonical ASD models, Shank1-/- and Shank3B-/-, while VVA+ Pvalb neuron numbers are unaltered
What the sources say
- Not checked yetcites [36] Peca J, Feliciano C, Ting JT, Wang W, Wells MF, Venkatraman TN, et al. Shank3 mutant mice display autistic-like behaviours and striatal dysfunction. Nature. 2011;472(7344):437–42. doi: 10.1038/nature09965 . source
- Not checked yetcites [77] Bockers TM, Segger-Junius M, Iglauer P, Bockmann J, Gundelfinger ED, Kreutz MR, et al. Differential expression and dendritic transcript localization of Shank family members: identification of a dendritic targeting element in the 3’ untranslated region of Shank1 mRNA. Mol Cell Neurosci. 2004;26(1):182–90. doi: 10.1016/j.mcn.2004.01.009 . source
plain- Asserted: passes — The authors put it forward as true.
- Checkable: passes — It can be checked against evidence.
- Load-bearing: passes — The paper’s conclusions depend on it.
- Based: passes — The paper gives a reason why it holds.
It may state two separate claims as one.
A conclusion the paper draws from its own results — it cites no other source for it, so there is none to check. The quote shows it is in the paper.
In the paper
“indicating that while PV expression levels were decreased, the number of Pvalb cells was unchanged (Table 3).”
§ Reduction in parvalbumin expression not loss of the parvalbumin-expressing GABA interneuron subpopulation in genetic parvalbumin and shank mouse models of autism > Results > The numbers of PV+ (Pvalb) interneurons are not changed in PV-reduced (PV+/-) and in PV-deficient (PV-/-) mice
hedged- Asserted: passes — The authors put it forward as true.
- Checkable: passes — It can be checked against evidence.
- Load-bearing: passes — The paper’s conclusions depend on it.
- Based: passes — The paper gives a reason why it holds.
It may state two separate claims as one.
In the paper
“One of the most important gene families mutated in ASD is the SHANK gene family [9]”
§ Reduction in parvalbumin expression not loss of the parvalbumin-expressing GABA interneuron subpopulation in genetic parvalbumin and shank mouse models of autism > Background
What the sources say
- Not checked yetcites [9] Leblond CS, Nava C, Polge A, Gauthier J, Huguet G, Lumbroso S, et al. Meta-analysis of SHANK mutations in autism spectrum disorders: a gradient of severity in cognitive impairments. PLoS Genet. 2014;10(9), e1004580. doi: 10.1371/journal.pgen.1004580 . source
plain- Asserted: passes — The authors put it forward as true.
- Checkable: passes — It can be checked against evidence.
- Load-bearing: fails — The paper’s conclusions may not depend on it.
- Based: passes — The paper gives a reason why it holds.
Probably not a substantial claim. The paper’s conclusions may not depend on it.
In the paper
“Among these specific subpopulations, PV-expressing interneurons seem to be highly impacted in several neuropsychiatric disorders including schizophrenia, bipolar disorder and ASD [45].”
§ Reduction in parvalbumin expression not loss of the parvalbumin-expressing GABA interneuron subpopulation in genetic parvalbumin and shank mouse models of autism > Background
What the sources say
- Not checked yetcites [45] Marin O. Interneuron dysfunction in psychiatric disorders. Nat Rev Neurosci. 2012;13(2):107–20. doi: 10.1038/nrn3155 . source
hedgedcorrelational- Asserted: passes — The authors put it forward as true.
- Checkable: passes — It can be checked against evidence.
- Load-bearing: fails — The paper’s conclusions may not depend on it.
- Based: passes — The paper gives a reason why it holds.
Probably not a substantial claim. The paper’s conclusions may not depend on it.
In the paper
“Shank1-/- and Shank3B-/- mice, covering the extremes of the spectrum with a gradient in severity in mental retardation.”
- Also stated in: § PV expression levels are reduced in two canonical ASD models, Shank1-/- and Shank3B-/-, while VVA+ Pvalb neuron numbers are unaltered · plain
“cover the extremes of the spectrum with a gradient in severity in mental retardation [9].”
§ Reduction in parvalbumin expression not loss of the parvalbumin-expressing GABA interneuron subpopulation in genetic parvalbumin and shank mouse models of autism > Background
What the sources say
- Not checked yetcites [9] Leblond CS, Nava C, Polge A, Gauthier J, Huguet G, Lumbroso S, et al. Meta-analysis of SHANK mutations in autism spectrum disorders: a gradient of severity in cognitive impairments. PLoS Genet. 2014;10(9), e1004580. doi: 10.1371/journal.pgen.1004580 . source
plaincorrelational- Asserted: passes — The authors put it forward as true.
- Checkable: passes — It can be checked against evidence.
- Load-bearing: passes — The paper’s conclusions depend on it.
- Based: passes — The paper gives a reason why it holds.
Probably not a substantial claim.
- Also stated in: § PV expression levels are reduced in two canonical ASD models, Shank1-/- and Shank3B-/-, while VVA+ Pvalb neuron numbers are unaltered · plain
A conclusion the paper draws from its own results — it cites no other source for it, so there is none to check. The quote shows it is in the paper.
In the paper
“However, counting and co-localization results show globally similar results as for PV+/- and Shank1-/- mice, i.e., a reduction of PV expression in the unchanged number of striatal VVA+ cells.”
§ Reduction in parvalbumin expression not loss of the parvalbumin-expressing GABA interneuron subpopulation in genetic parvalbumin and shank mouse models of autism > Results > PV expression levels are reduced in two canonical ASD models, Shank1-/- and Shank3B-/-, while VVA+ Pvalb neuron numbers are unaltered
plain- Asserted: passes — The authors put it forward as true.
- Checkable: passes — It can be checked against evidence.
- Load-bearing: passes — The paper’s conclusions depend on it.
- Based: passes — The paper gives a reason why it holds.
It may state two separate claims as one.
In the paper
“CE values ranged from 0.06 to 0.10 (Table 1) indicating a sufficient precision of the estimates for both cell populations [63].”
§ Reduction in parvalbumin expression not loss of the parvalbumin-expressing GABA interneuron subpopulation in genetic parvalbumin and shank mouse models of autism > Results > The numbers of PV+ (Pvalb) interneurons are not changed in PV-reduced (PV+/-) and in PV-deficient (PV-/-) mice
What the sources say
- Not checked yetcites [63] Gundersen HJ, Jensen EB, Kieu K, Nielsen J. The efficiency of systematic sampling in stereology--reconsidered. J Microsc. 1999;193(Pt 3):199–211. source
hedged- Asserted: passes — The authors put it forward as true.
- Checkable: passes — It can be checked against evidence.
- Load-bearing: fails — The paper’s conclusions may not depend on it.
- Based: passes — The paper gives a reason why it holds.
Probably not a substantial claim. The paper’s conclusions may not depend on it.
The paper states this without a source or data behind it here, so there is nothing to check it against. The quote shows it is in the paper.
In the paper
“Global PV expression levels as well as the ones in PV+ neurons in various brain regions are currently unknown in these two mouse mutants”
§ Reduction in parvalbumin expression not loss of the parvalbumin-expressing GABA interneuron subpopulation in genetic parvalbumin and shank mouse models of autism > Results > PV expression levels are reduced in two canonical ASD models, Shank1-/- and Shank3B-/-, while VVA+ Pvalb neuron numbers are unaltered
plain- Asserted: passes — The authors put it forward as true.
- Checkable: passes — It can be checked against evidence.
- Load-bearing: passes — The paper’s conclusions depend on it.
- Based: passes — The paper gives a reason why it holds.
Probably not a substantial claim.
What the paper did — it cites no source for this, so there is none to check. The quote shows it is in the paper.
In the paper
“Since no differences were encountered when comparing the ROIs of the two hemispheres in the same animal, data were pooled together and analyzed.”
§ Reduction in parvalbumin expression not loss of the parvalbumin-expressing GABA interneuron subpopulation in genetic parvalbumin and shank mouse models of autism > Methods > Statistical analysis and cell number estimates
plain- Asserted: passes — The authors put it forward as true.
- Checkable: passes — It can be checked against evidence.
- Load-bearing: fails — The paper’s conclusions may not depend on it.
- Based: passes — The paper gives a reason why it holds.
Probably not a substantial claim. The paper’s conclusions may not depend on it.
None of the sources cited for this claim have been checked yet.
In the paper
“Since the fractionator method does not require a measurement of tissue volume or any other dimensional quality, the cell number estimate is valid, even if the tissue volume changes during processing.”
§ Reduction in parvalbumin expression not loss of the parvalbumin-expressing GABA interneuron subpopulation in genetic parvalbumin and shank mouse models of autism > Methods > Counting criteria
What the sources say
- Not checked yetcites [60] West MJ, Slomianka L, Gundersen HJ. Unbiased stereological estimation of the total number of neurons in thesubdivisions of the rat hippocampus using the optical fractionator. Anat Rec. 1991;231(4):482–97. doi: 10.1002/ar.1092310411 . source
- Not checked yetcites [62] West MJ, Ostergaard K, Andreassen OA, Finsen B. Estimation of the number of somatostatin neurons in the striatum: an in situ hybridization study using the optical fractionator method. J Comp Neurol. 1996;370(1):11–22. doi: 10.1002/(SICI)1096-9861(19960617)370:1<11::AID-CNE2>3.0.CO;2-O . source
plain- Asserted: passes — The authors put it forward as true.
- Checkable: passes — It can be checked against evidence.
- Load-bearing: passes — The paper’s conclusions depend on it.
- Based: passes — The paper gives a reason why it holds.
Probably not a substantial claim. It may state two separate claims as one.
None of the sources cited for this claim have been checked yet.
In the paper
“The absence of PV in PV-/- Pvalb neurons does not affect basal synaptic transmission, but enhances facilitation [49, 50] and shortens delayed transmitter release [51].”
§ Reduction in parvalbumin expression not loss of the parvalbumin-expressing GABA interneuron subpopulation in genetic parvalbumin and shank mouse models of autism > Background
What the sources say
- Not checked yetcites [49] Caillard O, Moreno H, Schwaller B, Llano I, Celio MR, Marty A. Role of the calcium-binding protein parvalbumin in short-term synaptic plasticity. Proc Natl Acad Sci U S A. 2000;97(24):13372–7. source
- Not checked yetcites [50] Muller M, Felmy F, Schwaller B, Schneggenburger R. Parvalbumin is a mobile presynaptic Ca2+ buffer in the calyx of held that accelerates the decay of Ca2+ and short-term facilitation. J Neurosci. 2007;27(9):2261–71. source
- Not checked yetcites [51] Collin T, Chat M, Lucas MG, Moreno H, Racay P, Schwaller B, et al. Developmental changes in parvalbumin regulate presynaptic Ca2+ signaling. J Neurosci. 2005;25(1):96–107. source
plaindirect- Asserted: passes — The authors put it forward as true.
- Checkable: passes — It can be checked against evidence.
- Load-bearing: passes — The paper’s conclusions depend on it.
- Based: passes — The paper gives a reason why it holds.
It may state two separate claims as one.
The paper states this without a source or data behind it here, so there is nothing to check it against. The quote shows it is in the paper.
In the paper
“while loss of the Pvalb neuron subpopulation is likely to result in reduced inhibition”
§ Reduction in parvalbumin expression not loss of the parvalbumin-expressing GABA interneuron subpopulation in genetic parvalbumin and shank mouse models of autism > Background
hedgedconditional- Asserted: passes — The authors put it forward as true.
- Checkable: passes — It can be checked against evidence.
- Load-bearing: passes — The paper’s conclusions depend on it.
- Based: fails — The paper may give no reason why it holds.
Probably not a substantial claim. The paper may give no reason why it holds.
None of the sources cited for this claim have been checked yet.
In the paper
“The levels of PV signals were normalized to calbindin D-28k (CB) signals, a protein previously shown to be unaltered in PV-/- mice [57, 66] to control for differences in loading. CB levels were found to be unaltered in Shank1-/- and Shank3B-/- brains (data not shown).”
§ Reduction in parvalbumin expression not loss of the parvalbumin-expressing GABA interneuron subpopulation in genetic parvalbumin and shank mouse models of autism > Methods > Western blot analyses
What the sources say
- Not checked yetcites [57] Schwaller B, Tetko IV, Tandon P, Silveira DC, Vreugdenhil M, Henzi T, et al. Parvalbumin deficiency affects network properties resulting in increased susceptibility to epileptic seizures. Mol Cell Neurosci. 2004;25(4):650–63. source
- Not checked yetcites [66] Chen G, Racay P, Bichet S, Celio MR, Eggli P, Schwaller B. Deficiency in parvalbumin, but not in calbindin D-28k upregulates mitochondrial volume and decreases smooth endoplasmic reticulum surface selectively in a peripheral, subplasmalemmal region in the soma of Purkinje cells. Neuroscience. 2006;142(1):97–105. source
plain- Asserted: passes — The authors put it forward as true.
- Checkable: passes — It can be checked against evidence.
- Load-bearing: passes — The paper’s conclusions depend on it.
- Based: passes — The paper gives a reason why it holds.
It may state two separate claims as one.
What the paper did — it cites no source for this, so there is none to check. The quote shows it is in the paper.
In the paper
“No significant differences existed between PV signals quantitatively evaluated by either normalization method (not shown).”
§ Reduction in parvalbumin expression not loss of the parvalbumin-expressing GABA interneuron subpopulation in genetic parvalbumin and shank mouse models of autism > Methods > Western blot analyses
plain- Asserted: passes — The authors put it forward as true.
- Checkable: passes — It can be checked against evidence.
- Load-bearing: fails — The paper’s conclusions may not depend on it.
- Based: passes — The paper gives a reason why it holds.
Probably not a substantial claim. The paper’s conclusions may not depend on it.
None of the sources cited for this claim have been checked yet.
In the paper
“The enfeebled GABAergic circuit function reported in Shank3B-/- [76] and Shank1-/- mice [96] is likely to decrease somatic Ca2+ signals and subsequently modify the Ca2+ signaling components of Pvalb neurons”
§ Reduction in parvalbumin expression not loss of the parvalbumin-expressing GABA interneuron subpopulation in genetic parvalbumin and shank mouse models of autism > Discussion
What the sources say
- Not checked yetcites [76] Gogolla N, Takesian AE, Feng G, Fagiolini M, Hensch TK. Sensory integration in mouse insular cortex reflects GABA circuit maturation. Neuron. 2014;83(4):894–905. doi: 10.1016/j.neuron.2014.06.033 . source
- Not checked yetcites [96] Mao W, Watanabe T, Cho S, Frost JL, Truong T, Zhao X, et al. Shank1 regulates excitatory synaptic transmission in mouse hippocampal parvalbumin-expressing inhibitory interneurons. Eur J Neurosci. 2015;41(8):1025–35. doi: 10.1111/ejn.12877 . source
hedgedconditional- Asserted: passes — The authors put it forward as true.
- Checkable: passes — It can be checked against evidence.
- Load-bearing: passes — The paper’s conclusions depend on it.
- Based: passes — The paper gives a reason why it holds.
It may state two separate claims as one.
In the paper
“a neuronal activity-related Ca2+-dependent transcriptional regulation of PV expression was proposed before [100].”
§ Reduction in parvalbumin expression not loss of the parvalbumin-expressing GABA interneuron subpopulation in genetic parvalbumin and shank mouse models of autism > Discussion
What the sources say
- Not checked yetcites [100] Berridge MJ. Calcium signalling and psychiatric disease: bipolar disorder and schizophrenia. Cell Tissue Res. 2014;357(2):477–92. doi: 10.1007/s00441-014-1806-z . source
plain- Asserted: passes — The authors put it forward as true.
- Checkable: passes — It can be checked against evidence.
- Load-bearing: passes — The paper’s conclusions depend on it.
- Based: passes — The paper gives a reason why it holds.
Probably not a substantial claim.
None of the sources cited for this claim have been checked yet.
In the paper
“A further link exists between Shank protein expression and Pvalb neurons [76, 96].”
§ Reduction in parvalbumin expression not loss of the parvalbumin-expressing GABA interneuron subpopulation in genetic parvalbumin and shank mouse models of autism > Discussion
What the sources say
- Not checked yetcites [76] Gogolla N, Takesian AE, Feng G, Fagiolini M, Hensch TK. Sensory integration in mouse insular cortex reflects GABA circuit maturation. Neuron. 2014;83(4):894–905. doi: 10.1016/j.neuron.2014.06.033 . source
- Not checked yetcites [96] Mao W, Watanabe T, Cho S, Frost JL, Truong T, Zhao X, et al. Shank1 regulates excitatory synaptic transmission in mouse hippocampal parvalbumin-expressing inhibitory interneurons. Eur J Neurosci. 2015;41(8):1025–35. doi: 10.1111/ejn.12877 . source
plaincorrelational- Asserted: passes — The authors put it forward as true.
- Checkable: passes — It can be checked against evidence.
- Load-bearing: fails — The paper’s conclusions may not depend on it.
- Based: passes — The paper gives a reason why it holds.
Probably not a substantial claim. The paper’s conclusions may not depend on it.
None of the sources cited for this claim have been checked yet.
In the paper
“Also in the few human studies, a decrease in PV+ cells and/or PVALB mRNA was reported [46, 86].”
§ Reduction in parvalbumin expression not loss of the parvalbumin-expressing GABA interneuron subpopulation in genetic parvalbumin and shank mouse models of autism > Discussion
What the sources say
- Not checked yetcites [46] Zikopoulos B, Barbas H. Altered neural connectivity in excitatory and inhibitory cortical circuits in autism. Front Hum Neurosci. 2013;7:609. doi: 10.3389/fnhum.2013.00609 . source
- Not checked yetcites [86] Stoner R, Chow ML, Boyle MP, Sunkin SM, Mouton PR, Roy S, et al. Patches of disorganization in the neocortex of children with autism. N Engl J Med. 2014;370(13):1209–19. doi: 10.1056/NEJMoa1307491 . source
plain- Asserted: passes — The authors put it forward as true.
- Checkable: passes — It can be checked against evidence.
- Load-bearing: fails — The paper’s conclusions may not depend on it.
- Based: passes — The paper gives a reason why it holds.
Probably not a substantial claim. The paper’s conclusions may not depend on it.
In the paper
“Absence/down-regulation of PV in PV-/- and PV+/- mice, respectively, not only affects the properties of the Pvalb neurons, but also of neurons impacting on Pvalb cells, and leads to a robust ASD-like behavioral phenotype characterized by impaired social interaction behavior, reduced pro-social ultrasonic vocalizations and deficits in reversal learning [48].”
§ Reduction in parvalbumin expression not loss of the parvalbumin-expressing GABA interneuron subpopulation in genetic parvalbumin and shank mouse models of autism > Discussion
What the sources say
- Not checked yetcites [48] Wohr M, Orduz D, Gregory P, Moreno H, Khan U, Vorckel KJ, et al. Lack of parvalbumin in mice leads to behavioral deficits relevant to all human autism core symptoms and related neural morphofunctional abnormalities. Translat Psychiatry. 2015;5, e525. doi: 10.1038/tp.2015.19 . source
boosteddirect- Asserted: passes — The authors put it forward as true.
- Checkable: passes — It can be checked against evidence.
- Load-bearing: passes — The paper’s conclusions depend on it.
- Based: passes — The paper gives a reason why it holds.
It may state two separate claims as one.
None of the sources cited for this claim have been checked yet.
In the paper
“Alterations in other genes implicated in E/T coupling have been observed before in ASD individuals and include Ca2+ signaling components such as the voltage-dependent channels Cav1.2 (CACNA1C), Cav1.3 (CACNA1D) and the α-δ auxiliary subunit of L-type voltage-gated Ca2+ channels (CACNA2D3) [102, 103].”
§ Reduction in parvalbumin expression not loss of the parvalbumin-expressing GABA interneuron subpopulation in genetic parvalbumin and shank mouse models of autism > Discussion
What the sources say
- Not checked yetcites [102] De Rubeis S, He X, Goldberg AP, Poultney CS, Samocha K, Cicek AE, et al. Synaptic, transcriptional and chromatin genes disrupted in autism. Nature. 2014;515(7526):209–15. doi: 10.1038/nature13772 . source
- Not checked yetcites [103] Cross-Disorder Group of the Psychiatric Genomics Consortium. Identification of risk loci with shared effects on five major psychiatric disorders: a genome-wide analysis. Lancet. 2013;381(9875):1371–9. doi: 10.1016/S0140-6736(12)62129-1 . source
plaincorrelational- Asserted: passes — The authors put it forward as true.
- Checkable: passes — It can be checked against evidence.
- Load-bearing: fails — The paper’s conclusions may not depend on it.
- Based: passes — The paper gives a reason why it holds.
Probably not a substantial claim. The paper’s conclusions may not depend on it.
None of the sources cited for this claim have been checked yet.
In the paper
“In striatal PV+ FSI the increased facilitation (increased inhibition) between FSI and medium spiny neurons (MSN) caused by the absence of PV in PV-/-mice [53] is partly compensated by a decrease in the excitatory synaptic input from cortical pyramidal cells, a mechanism hypothesized to compensate for the increased output of PV-/- neurons [48].”
§ Reduction in parvalbumin expression not loss of the parvalbumin-expressing GABA interneuron subpopulation in genetic parvalbumin and shank mouse models of autism > Discussion
What the sources say
- Not checked yetcites [53] Orduz D, Bischop DP, Schwaller B, Schiffmann SN, Gall D. Parvalbumin tunes spike-timing and efferent short-term plasticity in striatal fast spiking interneurons. J Physiol. 2013;591(Pt 13):3215–32. doi: 10.1113/jphysiol.2012.250795 . source
- Not checked yetcites [48] Wohr M, Orduz D, Gregory P, Moreno H, Khan U, Vorckel KJ, et al. Lack of parvalbumin in mice leads to behavioral deficits relevant to all human autism core symptoms and related neural morphofunctional abnormalities. Translat Psychiatry. 2015;5, e525. doi: 10.1038/tp.2015.19 . source
hedgeddirect- Asserted: passes — The authors put it forward as true.
- Checkable: passes — It can be checked against evidence.
- Load-bearing: fails — The paper’s conclusions may not depend on it.
- Based: passes — The paper gives a reason why it holds.
Probably not a substantial claim. The paper’s conclusions may not depend on it.
In the paper
“Thus, the networks containing Pvalb neurons were hypothesized to be strongly implicated in ASD [45].”
§ Reduction in parvalbumin expression not loss of the parvalbumin-expressing GABA interneuron subpopulation in genetic parvalbumin and shank mouse models of autism > Discussion
What the sources say
- Not checked yetcites [45] Marin O. Interneuron dysfunction in psychiatric disorders. Nat Rev Neurosci. 2012;13(2):107–20. doi: 10.1038/nrn3155 . source
boostedcorrelational- Asserted: fails — The authors may not put it forward as true.
- Checkable: passes — It can be checked against evidence.
- Load-bearing: fails — The paper’s conclusions may not depend on it.
- Based: passes — The paper gives a reason why it holds.
Probably not a substantial claim. The authors may not put it forward as true. The paper’s conclusions may not depend on it.
The paper states this without a source or data behind it here, so there is nothing to check it against. The quote shows it is in the paper.
In the paper
“In most studies this was assumed to result from a cell loss of the PV+ subpopulation.”
§ Reduction in parvalbumin expression not loss of the parvalbumin-expressing GABA interneuron subpopulation in genetic parvalbumin and shank mouse models of autism > Results > PV expression levels are reduced in two canonical ASD models, Shank1-/- and Shank3B-/-, while VVA+ Pvalb neuron numbers are unaltered
plaindirect- Asserted: passes — The authors put it forward as true.
- Checkable: passes — It can be checked against evidence.
- Load-bearing: passes — The paper’s conclusions depend on it.
- Based: passes — The paper gives a reason why it holds.
Probably not a substantial claim.
In the paper
“The selection among the many ASD mouse models available was based on the fact that more than 900 patients with genetic alterations in SHANK genes were identified, with the SHANK gene family being the primary gene family implicated in ASD [9].”
§ Reduction in parvalbumin expression not loss of the parvalbumin-expressing GABA interneuron subpopulation in genetic parvalbumin and shank mouse models of autism > Discussion
What the sources say
- Not checked yetcites [9] Leblond CS, Nava C, Polge A, Gauthier J, Huguet G, Lumbroso S, et al. Meta-analysis of SHANK mutations in autism spectrum disorders: a gradient of severity in cognitive impairments. PLoS Genet. 2014;10(9), e1004580. doi: 10.1371/journal.pgen.1004580 . source
plaincorrelationaln = 900- Asserted: passes — The authors put it forward as true.
- Checkable: passes — It can be checked against evidence.
- Load-bearing: passes — The paper’s conclusions depend on it.
- Based: passes — The paper gives a reason why it holds.
Probably not a substantial claim. It may state two separate claims as one.
None of the sources cited for this claim have been checked yet.
In the paper
“Similar to the most consistent finding in humans [94, 95], an increase in the frontal and parieto-temporal lobes and decreased volume of the cerebellar cortex were observed in one of the three subgroups (“group 1”) identified among the 26 investigated models [75].”
§ Reduction in parvalbumin expression not loss of the parvalbumin-expressing GABA interneuron subpopulation in genetic parvalbumin and shank mouse models of autism > Discussion
What the sources say
- Not checked yetcites [75] Ellegood J, Anagnostou E, Babineau BA, Crawley JN, Lin L, Genestine M, et al. Clustering autism: using neuroanatomical differences in 26 mouse models to gain insight into the heterogeneity. Mol Psychiatry. 2014;20(1):118–25. doi: 10.1038/mp.2014.98 . source
- Not checked yetcites [94] Palmen SJ, van Engeland H, Hof PR, Schmitz C. Neuropathological findings in autism. Brain. 2004;127(Pt 12):2572–83. doi: 10.1093/brain/awh287 . source
- Not checked yetcites [95] Amaral DG, Schumann CM, Nordahl CW. Neuroanatomy of autism. Trends Neurosci. 2008;31(3):137–45. doi: 10.1016/j.tins.2007.12.005 . source
plaincorrelational- Asserted: passes — The authors put it forward as true.
- Checkable: passes — It can be checked against evidence.
- Load-bearing: unclear — It is unclear whether the paper’s conclusions depend on it.
- Based: passes — The paper gives a reason why it holds.
It may state two separate claims as one.
In the paper
“a decrease in the number of PV+ cells has been reported in many genetic ASD mouse models in various brain regions including mPFC, SSC and striatum; (see Table S1 in [48])”
§ Reduction in parvalbumin expression not loss of the parvalbumin-expressing GABA interneuron subpopulation in genetic parvalbumin and shank mouse models of autism > Discussion
What the sources say
- Not checked yetcites [48] Wohr M, Orduz D, Gregory P, Moreno H, Khan U, Vorckel KJ, et al. Lack of parvalbumin in mice leads to behavioral deficits relevant to all human autism core symptoms and related neural morphofunctional abnormalities. Translat Psychiatry. 2015;5, e525. doi: 10.1038/tp.2015.19 . source
plain- Asserted: passes — The authors put it forward as true.
- Checkable: passes — It can be checked against evidence.
- Load-bearing: passes — The paper’s conclusions depend on it.
- Based: passes — The paper gives a reason why it holds.
Probably not a substantial claim.
In the paper
“In Shank1-/- hippocampal PV+ FSI the absence of Shank1 functionally leads to a decrease in excitatory synaptic inputs and inhibitory synaptic outputs to pyramidal neurons and furthermore to molecular changes including the down-regulation of the postsynaptic proteins GKAP, PSD-95 and gephyrin [96].”
§ Reduction in parvalbumin expression not loss of the parvalbumin-expressing GABA interneuron subpopulation in genetic parvalbumin and shank mouse models of autism > Discussion
What the sources say
- Not checked yetcites [96] Mao W, Watanabe T, Cho S, Frost JL, Truong T, Zhao X, et al. Shank1 regulates excitatory synaptic transmission in mouse hippocampal parvalbumin-expressing inhibitory interneurons. Eur J Neurosci. 2015;41(8):1025–35. doi: 10.1111/ejn.12877 . source
plaindirect- Asserted: passes — The authors put it forward as true.
- Checkable: passes — It can be checked against evidence.
- Load-bearing: passes — The paper’s conclusions depend on it.
- Based: passes — The paper gives a reason why it holds.
It may state two separate claims as one.
In the paper
“Similar neuroanatomical changes are present in PV-/- (Pvalb) mice, i.e., a transient cortical hypertrophy and a decrease in cerebellar volume at young age [48]”
§ Reduction in parvalbumin expression not loss of the parvalbumin-expressing GABA interneuron subpopulation in genetic parvalbumin and shank mouse models of autism > Results > PV expression levels are reduced in two canonical ASD models, Shank1-/- and Shank3B-/-, while VVA+ Pvalb neuron numbers are unaltered
What the sources say
- Not checked yetcites [48] Wohr M, Orduz D, Gregory P, Moreno H, Khan U, Vorckel KJ, et al. Lack of parvalbumin in mice leads to behavioral deficits relevant to all human autism core symptoms and related neural morphofunctional abnormalities. Translat Psychiatry. 2015;5, e525. doi: 10.1038/tp.2015.19 . source
plaincorrelational- Asserted: passes — The authors put it forward as true.
- Checkable: passes — It can be checked against evidence.
- Load-bearing: passes — The paper’s conclusions depend on it.
- Based: passes — The paper gives a reason why it holds.
It may state two separate claims as one.
In the paper
“PV plays an important role in the Ca2+ homeostasis regulating many aspects of neuronal signaling (short-term plasticity, synchronization, precision of spike timing, etc.) in the subpopulation of PV+ interneurons [56].”
§ Reduction in parvalbumin expression not loss of the parvalbumin-expressing GABA interneuron subpopulation in genetic parvalbumin and shank mouse models of autism > Discussion
What the sources say
- Not checked yetcites [56] Schwaller B. The use of transgenic mouse models to reveal the functions of Ca2+ buffer proteins in excitable cells. Biochim Biophys Acta. 2012;1820(8):1294–303. doi: 10.1016/j.bbagen.2011.11.008 . source
plaindirect- Asserted: passes — The authors put it forward as true.
- Checkable: passes — It can be checked against evidence.
- Load-bearing: fails — The paper’s conclusions may not depend on it.
- Based: passes — The paper gives a reason why it holds.
Probably not a substantial claim. The paper’s conclusions may not depend on it.
In the paper
“Knockout mice in group 1 including null mutants for En2, Fmr1 and Shank3 show an increase in the frontal and parieto-temporal lobes and a volume decrease in the cerebellum, as well as a decrease in PV staining.”
§ Reduction in parvalbumin expression not loss of the parvalbumin-expressing GABA interneuron subpopulation in genetic parvalbumin and shank mouse models of autism > Results > PV expression levels are reduced in two canonical ASD models, Shank1-/- and Shank3B-/-, while VVA+ Pvalb neuron numbers are unaltered
What the sources say
- Not checked yetcites [75] Ellegood J, Anagnostou E, Babineau BA, Crawley JN, Lin L, Genestine M, et al. Clustering autism: using neuroanatomical differences in 26 mouse models to gain insight into the heterogeneity. Mol Psychiatry. 2014;20(1):118–25. doi: 10.1038/mp.2014.98 . source
plaindirect- Asserted: passes — The authors put it forward as true.
- Checkable: passes — It can be checked against evidence.
- Load-bearing: fails — The paper’s conclusions may not depend on it.
- Based: passes — The paper gives a reason why it holds.
Probably not a substantial claim. The paper’s conclusions may not depend on it. It may state two separate claims as one.
In the paper
“Similar numbers were reported in the mouse cortical V1 region, where 82 % of all VVA+ cells were found to also express PV [87].”
§ Reduction in parvalbumin expression not loss of the parvalbumin-expressing GABA interneuron subpopulation in genetic parvalbumin and shank mouse models of autism > Discussion
What the sources say
- Not checked yetcites [87] Ye Q, Miao QL. Experience-dependent development of perineuronal nets and chondroitin sulfate proteoglycan receptors in mouse visual cortex. Matrix Bio. 2013;32(6):352–63. doi: 10.1016/j.matbio.2013.04.001 . source
plaincorrelational- Asserted: passes — The authors put it forward as true.
- Checkable: passes — It can be checked against evidence.
- Load-bearing: fails — The paper’s conclusions may not depend on it.
- Based: passes — The paper gives a reason why it holds.
Probably not a substantial claim. The paper’s conclusions may not depend on it.
In the paper
“Shank1 and Shank3 mouse models were selected to cover both extremes of the spectrum, namely SHANK1 mutations found in individuals with ASD and normal intelligence and SHANK3 mutations associated with severe mental retardation [9].”
§ Reduction in parvalbumin expression not loss of the parvalbumin-expressing GABA interneuron subpopulation in genetic parvalbumin and shank mouse models of autism > Discussion
What the sources say
- Not checked yetcites [9] Leblond CS, Nava C, Polge A, Gauthier J, Huguet G, Lumbroso S, et al. Meta-analysis of SHANK mutations in autism spectrum disorders: a gradient of severity in cognitive impairments. PLoS Genet. 2014;10(9), e1004580. doi: 10.1371/journal.pgen.1004580 . source
plaincorrelational- Asserted: passes — The authors put it forward as true.
- Checkable: passes — It can be checked against evidence.
- Load-bearing: passes — The paper’s conclusions depend on it.
- Based: passes — The paper gives a reason why it holds.
It may state two separate claims as one.
None of the sources cited for this claim have been checked yet.
In the paper
“The modification of the E/I balance within the PV-circuitry in PV-/- mice is reminiscent of the situation in schizophrenia, where NMDA receptor hypofunction leads to the reduction of glutamic acid decarboxylase 67 (GAD67) levels and thus GABA synthesis.”
§ Reduction in parvalbumin expression not loss of the parvalbumin-expressing GABA interneuron subpopulation in genetic parvalbumin and shank mouse models of autism > Discussion
What the sources say
- Not checked yetcites [99] Gonzalez-Burgos G, Lewis DA. NMDA receptor hypofunction, parvalbumin-positive neurons, and cortical gamma oscillations in schizophrenia. Schizophr Bull. 2012;38(5):950–7. doi: 10.1093/schbul/sbs010 . source
- Not checked yetcites [100] Berridge MJ. Calcium signalling and psychiatric disease: bipolar disorder and schizophrenia. Cell Tissue Res. 2014;357(2):477–92. doi: 10.1007/s00441-014-1806-z . source
- Not checked yetcites [101] Lewis DA. Inhibitory neurons in human cortical circuits: substrate for cognitive dysfunction in schizophrenia. Curr Opin Neurobiol. 2014;26:22–6. doi: 10.1016/j.conb.2013.11.003 . source
hedgeddirect- Asserted: passes — The authors put it forward as true.
- Checkable: passes — It can be checked against evidence.
- Load-bearing: fails — The paper’s conclusions may not depend on it.
- Based: passes — The paper gives a reason why it holds.
Probably not a substantial claim. The paper’s conclusions may not depend on it.
In the paper
“Importantly, however, also the morphological changes in PV-/- mice follow the same pattern, as we recently demonstrated: increased neocortical volume and a decreased size of the cerebellum [48].”
§ Reduction in parvalbumin expression not loss of the parvalbumin-expressing GABA interneuron subpopulation in genetic parvalbumin and shank mouse models of autism > Discussion
What the sources say
- Not checked yetcites [48] Wohr M, Orduz D, Gregory P, Moreno H, Khan U, Vorckel KJ, et al. Lack of parvalbumin in mice leads to behavioral deficits relevant to all human autism core symptoms and related neural morphofunctional abnormalities. Translat Psychiatry. 2015;5, e525. doi: 10.1038/tp.2015.19 . source
boostedcorrelational- Asserted: passes — The authors put it forward as true.
- Checkable: passes — It can be checked against evidence.
- Load-bearing: unclear — It is unclear whether the paper’s conclusions depend on it.
- Based: passes — The paper gives a reason why it holds.
It may state two separate claims as one.
In the paper
“In summary, the observed decrease in PV expression in Shank mutant mice might be viewed as an adaptive or compensatory mechanism to possibly restore (increase) synaptic output according to the concept of the Ca2+ homeostasome [104].”
§ Reduction in parvalbumin expression not loss of the parvalbumin-expressing GABA interneuron subpopulation in genetic parvalbumin and shank mouse models of autism > Discussion
What the sources say
- Not checked yetcites [104] Schwaller B. The Regulation of a Cell’s Ca2+ Signaling Toolkit: The Ca2+ Homeostasome. Adv Exp Med Biol. 2012;740:1–25. doi: 10.1007/978-94-007-2888-2_1 . source
hedgedconditional- Asserted: passes — The authors put it forward as true.
- Checkable: fails — It may be too vague to check against evidence.
- Load-bearing: fails — The paper’s conclusions may not depend on it.
- Based: passes — The paper gives a reason why it holds.
Probably not a substantial claim. It may be too vague to check against evidence. The paper’s conclusions may not depend on it.
In the paper
“Evidence has accumulated that mutated ASD risk genes are critical components of activity-regulated signaling networks often controlling synapse development and morphology, as well as structural and functional plasticity [8].”
§ Reduction in parvalbumin expression not loss of the parvalbumin-expressing GABA interneuron subpopulation in genetic parvalbumin and shank mouse models of autism > Discussion
What the sources say
- Not checked yetcites [8] Ebert DH, Greenberg ME. Activity-dependent neuronal signalling and autism spectrum disorder. Nature. 2013;493(7432):327–37. doi: 10.1038/nature11860 . source
boosteddirect- Asserted: passes — The authors put it forward as true.
- Checkable: passes — It can be checked against evidence.
- Load-bearing: fails — The paper’s conclusions may not depend on it.
- Based: passes — The paper gives a reason why it holds.
Probably not a substantial claim. The paper’s conclusions may not depend on it.
A conclusion the paper draws from its own results — it cites no other source for it, so there is none to check. The quote shows it is in the paper.
In the paper
“Based on the similar magnitude in PV down-regulation and impairment in the E/I balance reported before in all three models we hypothesize that the PV system, in particular reduced PV expression levels, might represent a convergent downstream endpoint for some forms of ASD.”
§ Reduction in parvalbumin expression not loss of the parvalbumin-expressing GABA interneuron subpopulation in genetic parvalbumin and shank mouse models of autism > Conclusions
hedgedconditional- Asserted: passes — The authors put it forward as true.
- Checkable: passes — It can be checked against evidence.
- Load-bearing: passes — The paper’s conclusions depend on it.
- Based: passes — The paper gives a reason why it holds.
Probably not a substantial claim.
The paper relies on this without support.
CB expression levels were unchanged in Shank3B-/- mice.
“CB was used as loading control for the normalization of the PV signal, since CB expression levels were unchanged in Shank3B-/- mice (data not shown).”
Claims other papers make about this one
Each is checked against this paper’s own text: does it say what the citing paper says it does?
In the citing paper
“In other mouse models of ASD, a reduction in PV-INs or a decrease in PV immunoreactivity has been reported [20].”
From Parvalbumin interneuron vulnerability and brain disorders (2021) · cites this paper as [20]
In the citing paper
“Both increase and decrease in number of PV-IR cells are reported.”
From Oxidative stress-driven parvalbumin interneuron impairment as a common mechanism in models of schizophrenia (2017) · cites this paper as [27]
In the citing paper
“Moreover, Shank1 and Shank3B KO mice show a reduced number of PV-IR cells but no deficit in WFA-labeled PNN in the somatosensory cortex.27”
From Oxidative stress-driven parvalbumin interneuron impairment as a common mechanism in models of schizophrenia (2017) · cites this paper as [27]
In the citing paper
“Manipulations of other genes associated with intellectual disability and ASD (for example, MECP2, NLGN3, Shank3; CNTNAP2) reveal diverse abnormalities within cortical GABAergic circuits.27, 28, 113, 114, 115”
From Oxidative stress-driven parvalbumin interneuron impairment as a common mechanism in models of schizophrenia (2017) · cites this paper as [27]
Self-check
Percentages, sums and reported differences re-computed from the paper’s own numbers.
Each contradiction between two passages listed here was confirmed by an independent check.
Rated minor: it would not touch a result — a value no result rests on, a p-value that stays on the same side of the significance level, or a conflict that is clerical, resolved elsewhere in the paper, or outside its own findings.
In the paper
§ Reduction in parvalbumin expression not loss of the parvalbumin-expressing GABA interneuron subpopulation in genetic parvalbumin and shank mouse models of autism > Results > PV expression levels are reduced in two canonical ASD models, Shank1-/- and Shank3B-/-, while VVA+ Pvalb neuron numbers are unaltered
“Middle: estimation of double-labeled cells in SSC of PND25 WT and Shank3B-/- mice.”
§ Reduction in parvalbumin expression not loss of the parvalbumin-expressing GABA interneuron subpopulation in genetic parvalbumin and shank mouse models of autism > Results > PV expression levels are reduced in two canonical ASD models, Shank1-/- and Shank3B-/-, while VVA+ Pvalb neuron numbers are unaltered
“For the Shank3B-/- mice we focused on the striatum, a region with high Shank3 expression levels”
Citations
Cites
Analysis of Relative Gene Expression Data Using Real-Time Quantitative PCR and the 2−ΔΔCT Method
Livak, K. J., & Schmittgen, T. D. (2001) · Methods · doi:10.1006/meth.2001.1262 · Cited by 180,860
The Mouse Brain in Stereotaxic Coordinates
Paxinos, G. (2001) · Cited by 12,859
Shrestha, S., & Offer, S. M. (2016) · Medical Epigenetics · doi:10.1159/000444713 · Cited by 8,951
Baio, J., Wiggins, L., Christensen, D. L., Maenner, M. J., Daniels, J., Warren, Z., Kurzius-Spencer, M., Zahorodny, W., Robinson, C., Rosenberg, et al. (2018) · MMWR. Surveillance Summaries · doi:10.15585/mmwr.ss6706a1 · Cited by 6,078
Mutation of the mouse klotho gene leads to a syndrome resembling ageing
Kuro-o, M., Matsumura, Y., Aizawa, H., Kawaguchi, H., Suga, T., Utsugi, T., Ohyama, Y., Kurabayashi, M., Kaname, T., Kume, E., et al. (1997) · Nature · doi:10.1038/36285 · Cited by 3,837
(2013) · The Lancet · doi:10.1016/s0140-6736(12)62129-1 · Cited by 3,010
West, M. J., Slomianka, L., & Gundersen, H. J. G. (1991) · The Anatomical Record · doi:10.1002/ar.1092310411 · Cited by 2,994 · cited 3×
“[60, 62] using the equation:”
BackgroundMethodStrong association of de novo copy number mutations with autism
Sebat, J., Lakshmi, B., Malhotra, D., Troge, J., Lese-Martin, C., Walsh, T., Yamrom, B., Yoon, S., Krasnitz, A., Kendall, J., et al. (2007) · Science · doi:10.1126/science.1138659 · Cited by 2,795
Model of autism: increased ratio of excitation/inhibition in key neural systems
Rubenstein, J. L. R., & Merzenich, M. M. (2003) · Genes, Brain and Behavior · doi:10.1034/j.1601-183x.2003.00037.x · Cited by 2,768
Synaptic, transcriptional and chromatin genes disrupted in autism
Study, T. D., De Rubeis, S., Autism, H. M. C. F., UK10K Consortium, The Autism Sequencing Consortium, He, X., Goldberg, A. P., Poultney, C. S., Samocha, K., Ercument Cicek, A., et al. (2014) · Nature · doi:10.1038/nature13772 · Cited by 2,746
Functional impact of global rare copy number variation in autism spectrum disorders
Pinto, D., Pagnamenta, A. T., Klei, L., Anney, R., Merico, D., Regan, R., Conroy, J., Magalhaes, T. R., Correia, C., Abrahams, B. S., et al. (2010) · Nature · doi:10.1038/nature09146 · Cited by 2,013 · cited 1×
“In individuals with ASD or schizophrenia patients with ASD traits, mutations were repeatedly reported for all SHANK gene family members [4, 9, 11, 12], namely SHANK1 [13], SHANK2 [14–16] and SHANK3 [17–21].”
BackgroundTranscriptomic Analysis of Autistic Brain Reveals Convergent Molecular Pathology
Voineagu, I., Wang, X., Johnston, P., Lowe, J. K., Tian, Y., Horvath, S., Mill, J., Cantor, R. M., Blencowe, B. J., & Geschwind, D. H. (2011) · Nature · doi:10.1038/nature10110 · Cited by 1,874 · cited 1×
“node in gene networks [4, 81, 82] to represent a convergence of mechanisms relating to ASD, in line with previous propositions [83–85].”
ResultAdvances in autism genetics: on the threshold of a new neurobiology
Abrahams, B. S., & Geschwind, D. H. (2008) · Nature Reviews Genetics · doi:10.1038/nrg2346 · Cited by 1,866
Neuroligins and neurexins link synaptic function to cognitive disease
Südhof, T. C. (2008) · Nature · doi:10.1038/nature07456 · Cited by 1,849 · cited 3×
“In individuals with ASD or schizophrenia patients with ASD traits, mutations were repeatedly reported for all SHANK gene family members [4, 9, 11, 12], namely SHANK1 [13], SHANK2 [14–16] and SHANK3 [17–21].”
BackgroundPDZ domain proteins of synapses
Kim, E., & Sheng, M. (2004) · Nature reviews. Neuroscience · doi:10.1038/nrn1517 · Cited by 1,630
Durand, C. M., Betancur, C., Boeckers, T. M., Bockmann, J., Chaste, P., Fauchereau, F., Nygren, G., Rastam, M., Gillberg, I. C., Anckarsäter, H., et al. (2007) · Nature Genetics · doi:10.1038/ng1933 · Cited by 1,602
Shank3 mutant mice display autistic-like behaviours and striatal dysfunction
Peça, J., Feliciano, C., Ting, J. T., Wang, W., Wells, M. F., Venkatraman, T. N., Lascola, C. D., Fu, Z., & Feng, G. (2011) · Nature · doi:10.1038/nature09965 · Cited by 1,570
Amaral, D. G., Schumann, C. M., & Nordahl, C. W. (2008) · Trends in Neurosciences · doi:10.1016/j.tins.2007.12.005 · Cited by 1,492
Naarden Braun, K. V., Lopez, M., White, T., et al. (2023) · Carolina Digital Repository (University of North Carolina at Chapel Hill) · doi:10.17615/y3kk-5x30 · Cited by 1,381
The efficiency of systematic sampling in stereology—reconsidered
GUNDERSEN, H. J. G., JENSEN, E. B. V., KIÊU, K., & NIELSEN, J. (1999) · Journal of Microscopy · doi:10.1046/j.1365-2818.1999.00457.x · Cited by 1,317
Interneuron dysfunction in psychiatric disorders
Marín, O. (2012) · Nature Reviews Neuroscience · doi:10.1038/nrn3155 · Cited by 1,190
Defined types of cortical interneurone structure space and spike timing in the hippocampus
Somogyi, P., & Klausberger, T. (2005) · The Journal of Physiology · doi:10.1113/jphysiol.2004.078915 · Cited by 927
Zoghbi, H. Y., & Bear, M. F. (2012) · Cold Spring Harbor Perspectives in Biology · doi:10.1101/cshperspect.a009886 · Cited by 797
Patches of Disorganization in the Neocortex of Children with Autism
Stoner, R., Chow, M. L., Boyle, M. P., Sunkin, S. M., Mouton, P. R., Roy, S., Wynshaw-Boris, A., Colamarino, S. A., Lein, E. S., & Courchesne, E. (2014) · New England Journal of Medicine · doi:10.1056/nejmoa1307491 · Cited by 722
Autistic-like social behaviour in Shank2-mutant mice improved by restoring NMDA receptor function
Won, H., Lee, H.-R., Gee, H. Y., Mah, W., Kim, J.-I., Lee, J., Ha, S., Chung, C., Jung, E. S., Cho, Y. S., et al. (2012) · Nature · doi:10.1038/nature11208 · Cited by 695
Contribution of SHANK3 Mutations to Autism Spectrum Disorder
Moessner, R., Marshall, C. R., Sutcliffe, J. S., Skaug, J., Pinto, D., Vincent, J., Zwaigenbaum, L., Fernandez, B., Roberts, W., Szatmari, P., et al. (2007) · The American Journal of Human Genetics · doi:10.1086/522590 · Cited by 681
Activity-dependent neuronal signalling and autism spectrum disorder
Ebert, D. H., & Greenberg, M. E. (2013) · Nature · doi:10.1038/nature11860 · Cited by 666
Autistic-like behaviours and hyperactivity in mice lacking ProSAP1/Shank2
Schmeisser, M. J., Ey, E., Wegener, S., Bockmann, J., Stempel, A. V., Kuebler, A., Janssen, A.-L., Udvardi, P. T., Shiban, E., Spilker, C., et al. (2012) · Nature · doi:10.1038/nature11015 · Cited by 638
Leblond, C. S., Nava, C., Polge, A., Gauthier, J., Huguet, G., Lumbroso, S., Giuliano, F., Stordeur, C., Depienne, C., Mouzat, K., et al. (2014) · PLoS Genetics · doi:10.1371/journal.pgen.1004580 · Cited by 630
Common circuit defect of excitatory-inhibitory balance in mouse models of autism
Gogolla, N., LeBlanc, J. J., Quast, K. B., Südhof, T. C., Fagiolini, M., & Hensch, T. K. (2009) · Journal of Neurodevelopmental Disorders · doi:10.1007/s11689-009-9023-x · Cited by 610
Bozdagi, O., Sakurai, T., Papapetrou, D., Wang, X., Dickstein, D. L., Takahashi, N., Kajiwara, Y., Yang, M., Katz, A. M., Scattoni, M. L., et al. (2010) · Molecular Autism · doi:10.1186/2040-2392-1-15 · Cited by 584
Mutations in the SHANK2 synaptic scaffolding gene in autism spectrum disorder and mental retardation
Berkel, S., Marshall, C. R., Weiss, B., Howe, J., Roeth, R., Moog, U., Endris, V., Roberts, W., Szatmari, P., Pinto, D., et al. (2010) · Nature Genetics · doi:10.1038/ng.589 · Cited by 563
Synaptic dysfunction and abnormal behaviors in mice lacking major isoforms of Shank3
Wang, X., McCoy, P. A., Rodriguiz, R. M., Pan, Y., Je, H. S., Roberts, A. C., Kim, C. J., Berrios, J., Colvin, J. S., Bousquet-Moore, D., et al. (2011) · Human Molecular Genetics · doi:10.1093/hmg/ddr212 · Cited by 537
Neuropathological findings in autism
Palmen, S. J. M. C. (2004) · Brain · doi:10.1093/brain/awh287 · Cited by 527
Pardo, C. A., & Eberhart, C. G. (2007) · Brain Pathology · doi:10.1111/j.1750-3639.2007.00102.x · Cited by 514
Perineuronal nets protect fast-spiking interneurons against oxidative stress
Cabungcal, J.-H., Steullet, P., Morishita, H., Kraftsik, R., Cuenod, M., Hensch, T. K., & Do, K. Q. (2013) · Proceedings of the National Academy of Sciences · doi:10.1073/pnas.1300454110 · Cited by 512
Modeling Autism by SHANK Gene Mutations in Mice
Jiang, Y.-H., & Ehlers, M. D. (2013) · Neuron · doi:10.1016/j.neuron.2013.03.016 · Cited by 488
Gonzalez-Burgos, G., & Lewis, D. A. (2012) · Schizophrenia Bulletin · doi:10.1093/schbul/sbs010 · Cited by 478
GABA system dysfunction in autism and related disorders: From synapse to symptoms
Coghlan, S., Horder, J., Inkster, B., Méndez, M. A., Murphy, D., & Nutt, D. (2012) · Neuroscience & Biobehavioral Reviews · doi:10.1016/j.neubiorev.2012.07.005 · Cited by 459
Wisteria floribunda agglutinin-labelled nets surround parvalbumin-containing neurons
Härtig, W., Brauer, K., & Brückner, G. (1992) · NeuroReport · doi:10.1097/00001756-199210000-00012 · Cited by 440
Leblond, C. S., Heinrich, J., Delorme, R., Proepper, C., Betancur, C., Huguet, G., Konyukh, M., Chaste, P., Ey, E., Rastam, M., et al. (2012) · PLoS Genetics · doi:10.1371/journal.pgen.1002521 · Cited by 429
Role of the calcium-binding protein parvalbumin in short-term synaptic plasticity
Caillard, O., Moreno, H., Schwaller, B., Llano, I., Celio, M. R., & Marty, A. (2000) · Proceedings of the National Academy of Sciences · doi:10.1073/pnas.230362997 · Cited by 406
Self-citationPerineuronal nets — a specialized form of extracellular matrix in the adult nervous system
Celio, M. R., & Blümcke, I. (1994) · Brain Research Reviews · doi:10.1016/0165-0173(94)90006-x · Cited by 386
Wilson, H. L., Wong, A. C. C., Shaw, S. R., Tse, W.-Y., Stapleton, G. A., Phelan, M. C., Hu, S., Marshall, J., & McDermid, H. E. (2003) · Journal of Medical Genetics · doi:10.1136/jmg.40.8.575 · Cited by 377
Yang, M., Bozdagi, O., Scattoni, M. L., Wöhr, M., Roullet, F. I., Katz, A. M., Abrams, D. N., Kalikhman, D., Simon, H., Woldeyohannes, L., et al. (2012) · The Journal of Neuroscience · doi:10.1523/jneurosci.6107-11.2012 · Cited by 369
Self-citationChanges in Prefrontal Axons May Disrupt the Network in Autism
Zikopoulos, B., & Barbas, H. (2010) · The Journal of Neuroscience · doi:10.1523/jneurosci.2257-10.2010 · Cited by 357
Hung, A. Y., Futai, K., Sala, C., Valtschanoff, J. G., Ryu, J., Woodworth, M. A., Kidd, F. L., Sung, C. C., Miyakawa, T., Bear, M. F., et al. (2008) · The Journal of Neuroscience · doi:10.1523/jneurosci.3032-07.2008 · Cited by 350
Novel de novo SHANK3 mutation in autistic patients
Gauthier, J., Spiegelman, D., Piton, A., Lafrenière, R. G., Laurent, S., St‐Onge, J., Lapointe, L., Hamdan, F. F., Cossette, P., Mottron, L., et al. (2009) · American Journal of Medical Genetics Part B: Neuropsychiatric Genetics · doi:10.1002/ajmg.b.30822 · Cited by 321
SHANK1 Deletions in Males with Autism Spectrum Disorder
Sato, D., Lionel, A. C., Leblond, C. S., Prasad, A., Pinto, D., Walker, S., O'Connor, I., Russell, C., Drmic, I. E., Hamdan, F. F., et al. (2012) · The American Journal of Human Genetics · doi:10.1016/j.ajhg.2012.03.017 · Cited by 318
Altered neural connectivity in excitatory and inhibitory cortical circuits in autism
Zikopoulos, B., & Barbas, H. (2013) · Frontiers in Human Neuroscience · doi:10.3389/fnhum.2013.00609 · Cited by 313
Sensory Integration in Mouse Insular Cortex Reflects GABA Circuit Maturation
Gogolla, N., Takesian, A. E., Feng, G., Fagiolini, M., & Hensch, T. K. (2014) · Neuron · doi:10.1016/j.neuron.2014.06.033 · Cited by 310
Bonaglia, M. C., Giorda, R., Borgatti, R., Felisari, G., Gagliardi, C., Selicorni, A., & Zuffardi, O. (2001) · The American Journal of Human Genetics · doi:10.1086/321293 · Cited by 309
Autism: A “Critical Period” Disorder?
LeBlanc, J. J., & Fagiolini, M. (2011) · Neural Plasticity · doi:10.1155/2011/921680 · Cited by 301
Kouser, M., Speed, H. E., Dewey, C. M., Reimers, J. M., Widman, A. J., Gupta, N., Liu, S., Jaramillo, T. C., Bangash, M. A., Xiao, B., et al. (2013) · Journal of Neuroscience · doi:10.1523/jneurosci.3017-13.2013 · Cited by 297
Ellegood, J., Anagnostou, E., Babineau, B. A., Crawley, J. N., Lin, L., Genestine, M., DiCicco-Bloom, E., Lai, J. K. Y., Foster, J. A., Peñagarikano, O., et al. (2015) · Molecular Psychiatry · doi:10.1038/mp.2014.98 · Cited by 288
Meyer, A. H., Katona, I., Blatow, M., Rozov, A. V., & Monyer, H. (2002) · Journal of Neuroscience · doi:10.1523/jneurosci.22-16-07055.2002 · Cited by 288
Wöhr, M., Orduz, D., Gregory, P., Moreno, H., Khan, U., Vörckel, K. J., Wolfer, D. P., Welzl, H., Gall, D., Schiffmann, S. N., et al. (2015) · Translational Psychiatry · doi:10.1038/tp.2015.19 · Cited by 258
Self-citationSelby, L., Zhang, C., & Sun, Q.-Q. (2007) · Neuroscience Letters · doi:10.1016/j.neulet.2006.11.062 · Cited by 245
The emerging role of SHANK genes in neuropsychiatric disorders
Guilmatre, A., Huguet, G., Delorme, R., & Bourgeron, T. (2014) · Developmental Neurobiology · doi:10.1002/dneu.22128 · Cited by 237
Levitt, P., & Campbell, D. B. (2009) · Journal of Clinical Investigation · doi:10.1172/jci37934 · Cited by 234 · cited 1×
“Core symptoms of ASD are deficits in social interaction and communication, together with restricted interests and repetitive behaviors [2–4].”
BackgroundPhelan, M. C. (2008) · Orphanet Journal of Rare Diseases · doi:10.1186/1750-1172-3-14 · Cited by 221
Wöhr, M., Roullet, F. I., Hung, A. Y., Sheng, M., & Crawley, J. N. (2011) · PLoS ONE · doi:10.1371/journal.pone.0020631 · Cited by 220
Self-citationParvalbumin-Deficiency Facilitates Repetitive IPSCs and Gamma Oscillations in the Hippocampus
Vreugdenhil, M., Jefferys, J. G. R., Celio, M. R., & Schwaller, B. (2003) · Journal of Neurophysiology · doi:10.1152/jn.00576.2002 · Cited by 219
Self-citationProgress toward treatments for synaptic defects in autism
Delorme, R., Ey, E., Toro, R., Leboyer, M., Gillberg, C., & Bourgeron, T. (2013) · Nature Medicine · doi:10.1038/nm.3193 · Cited by 218
Autistic-like phenotypes in Cadps2-knockout mice and aberrant CADPS2 splicing in autistic patients
Sadakata, T., Washida, M., Iwayama, Y., Shoji, S., Sato, Y., Ohkura, T., Katoh-Semba, R., Nakajima, M., Sekine, Y., Tanaka, M., et al. (2007) · Journal of Clinical Investigation · doi:10.1172/jci29031 · Cited by 218
Sociability and motor functions in Shank1 mutant mice
Silverman, J. L., Turner, S. M., Barkan, C. L., Tolu, S. S., Saxena, R., Hung, A. Y., Sheng, M., & Crawley, J. N. (2011) · Brain Research · doi:10.1016/j.brainres.2010.09.026 · Cited by 218
Inhibitory neurons in human cortical circuits: substrate for cognitive dysfunction in schizophrenia
Lewis, D. A. (2014) · Current Opinion in Neurobiology · doi:10.1016/j.conb.2013.11.003 · Cited by 217
Palmieri, L., Papaleo, V., Porcelli, V., Scarcia, P., Gaita, L., Sacco, R., Hager, J., Rousseau, F., Curatolo, P., Manzi, B., et al. (2008) · Molecular Psychiatry · doi:10.1038/mp.2008.63 · Cited by 210
Prolonged contraction-relaxation cycle of fast-twitch muscles in parvalbumin knockout mice
Schwaller, B., Dick, J. R. T., Dhoot, G. K., Carroll, S. L., Vrbovà, G., Nicotera, P., Pette, D., Wyss, A., Bluethmann, H., Hunziker, W. H., et al. (1999) · American Journal of Physiology-Cell Physiology · doi:10.1152/ajpcell.1999.276.2.c395 · Cited by 207
Self-citationDevelopmental Changes in Parvalbumin Regulate Presynaptic Ca2+Signaling
Collin, T., Chat, M., Lucas, M. G., Moreno, H., Racay, P., Schwaller, B., Marty, A., & Llano, I. (2005) · The Journal of Neuroscience · doi:10.1523/jneurosci.3748-04.2005 · Cited by 183
Self-citationCalcium signalling and psychiatric disease: bipolar disorder and schizophrenia
Berridge, M. J. (2014) · Cell and Tissue Research · doi:10.1007/s00441-014-1806-z · Cited by 181
Manning, M. A., Cassidy, S. B., Clericuzio, C. L., Cherry, A. M., Schwartz, S., Hudgins, L., Enns, G. M., & Hoyme, H. E. (2004) · PEDIATRICS · doi:10.1542/peds.114.2.451 · Cited by 171
Schwaller, B., Tetko, I. V., Tandon, P., Silveira, D. C., Vreugdenhil, M., Henzi, T., Potier, M.-C., Celio, M. R., & Villa, A. E. P. (2004) · Molecular and Cellular Neuroscience · doi:10.1016/j.mcn.2003.12.006 · Cited by 169
Self-citationMolecular mechanisms of autism: a possible role for Ca2+ signaling
Krey, J. F., & Dolmetsch, R. E. (2007) · Current Opinion in Neurobiology · doi:10.1016/j.conb.2007.01.010 · Cited by 169
Hays, S. A., Huber, K. M., & Gibson, J. R. (2011) · Journal of Neuroscience · doi:10.1523/jneurosci.3157-11.2011 · Cited by 163
Genetic aspects of autism spectrum disorders: insights from animal models
Banerjee, S., Riordan, M., & Bhat, M. A. (2014) · Frontiers in Cellular Neuroscience · doi:10.3389/fncel.2014.00058 · Cited by 156
Müller, M., Felmy, F., Schwaller, B., & Schneggenburger, R. (2007) · The Journal of Neuroscience · doi:10.1523/jneurosci.5582-06.2007 · Cited by 155
Self-citationBöckers, T. M., Segger-Junius, M., Iglauer, P., Bockmann, J., Gundelfinger, E. D., Kreutz, M. R., Richter, D., Kindler, S., & Kreienkamp, H.-J. (2004) · Molecular and Cellular Neuroscience · doi:10.1016/j.mcn.2004.01.009 · Cited by 149
Ye, Q., & Miao, Q.-L. (2013) · Matrix Biology · doi:10.1016/j.matbio.2013.04.001 · Cited by 146
Ey, E., Torquet, N., Sourd, A. L., Leblond, C. S., Boeckers, T. M., Fauré, P., & Bourgeron, T. (2013) · Behavioural Brain Research · doi:10.1016/j.bbr.2013.08.031 · Cited by 143
Wagner, C. K., & Morrell, J. I. (1996) · The Journal of Comparative Neurology · doi:10.1002/(sici)1096-9861(19960617)370:1 · Cited by 127
How the 'slow' Ca2+ buffer parvalbumin affects transmitter release in nanodomain-coupling regimes
Eggermann, E., & Jonas, P. (2012) · Nature Neuroscience · doi:10.1038/nn.3002 · Cited by 119
GABAergic Circuit Dysfunctions in Neurodevelopmental Disorders
Chattopadhyaya, B., & Cristo, G. D. (2012) · Frontiers in Psychiatry · doi:10.3389/fpsyt.2012.00051 · Cited by 115
Toledo‐Rodriguez, M., Goodman, P. H., Illic, M., Wu, C., & Markram, H. (2005) · The Journal of Physiology · doi:10.1113/jphysiol.2005.089250 · Cited by 113
Nowicka, D., Soulsby, S., Skangiel‐Kramska, J., & Glazewski, S. (2009) · European Journal of Neuroscience · doi:10.1111/j.1460-9568.2009.06996.x · Cited by 110
Ting, J. T., Peça, J., & Feng, G. (2012) · Annual Review of Neuroscience · doi:10.1146/annurev-neuro-062111-150442 · Cited by 110
Impaired inhibitory control of cortical synchronization in fragile X syndrome
Paluszkiewicz, S. M., Olmos-Serrano, J. L., Corbin, J. G., & Huntsman, M. M. (2011) · Journal of Neurophysiology · doi:10.1152/jn.00421.2011 · Cited by 107
Wöhr, M. (2014) · Neuroscience & Biobehavioral Reviews · doi:10.1016/j.neubiorev.2014.03.021 · Cited by 107
Self-citationPerineuronal nets and schizophrenia: The importance of neuronal coatings
Bitanihirwe, B. K. Y., & Woo, T.-U. W. (2014) · Neuroscience & Biobehavioral Reviews · doi:10.1016/j.neubiorev.2014.03.018 · Cited by 95
Manseau, F., Marinelli, S., Méndez, P., Schwaller, B., Prince, D. A., Huguenard, J. R., & Bacci, A. (2010) · PLoS Biology · doi:10.1371/journal.pbio.1000492 · Cited by 89
Self-citationOrduz, D., Bischop, D. P., Schwaller, B., Schiffmann, S. N., & Gall, D. (2013) · The Journal of Physiology · doi:10.1113/jphysiol.2012.250795 · Cited by 88
Self-citationBelichenko, P. V., Judith Miklossy, A., Belser, B., Budka, H., & Celio, M. R. (1999) · Neurobiology of Disease · doi:10.1006/nbdi.1999.0245 · Cited by 83
Sungur, A. Ö., Vörckel, K. J., Schwarting, R. K. W., & Wöhr, M. (2014) · Journal of Neuroscience Methods · doi:10.1016/j.jneumeth.2014.05.003 · Cited by 76
Self-citationSchwaller, B. (2012) · Biochimica et Biophysica Acta (BBA) - General Subjects · doi:10.1016/j.bbagen.2011.11.008 · Cited by 75
Self-citationIncreased susceptibility to kainic acid–induced seizures in Engrailed-2 knockout mice
Tripathi, P. P., Sgadò, P., Scali, M., Viaggi, C., Casarosa, S., Simon, H. H., Vaglini, F., Corsini, G. U., & Bozzi, Y. (2009) · Neuroscience · doi:10.1016/j.neuroscience.2009.01.007 · Cited by 74
Zeidán‐Chuliá, F., Rybarczyk-Filho, J. L., Salmina, A. B., de Oliveira, B. H. N., Noda, M., & Moreira, J. C. F. (2013) · NeuroMolecular Medicine · doi:10.1007/s12017-013-8224-3 · Cited by 74
Servais, L., Bearzatto, B., Schwaller, B., Dumont, M., Saedeleer, C. D., Dan, B., Barski, J. J., Schiffmann, S. N., & Cheron, G. A. (2005) · European Journal of Neuroscience · doi:10.1111/j.1460-9568.2005.04275.x · Cited by 71
Self-citationMorphology of perineuronal nets in tenascin-R and parvalbumin single and double knockout mice
Haunsø, A., Ibrahim, M., Bartsch, U., Letiembre, M., Celio, M. R., & Menoud, P.-A. (2000) · Brain Research · doi:10.1016/s0006-8993(00)02173-9 · Cited by 61
Converging Evidence for an Association of ATP2B2 Allelic Variants with Autism in Male Subjects
Carayol, J., Sacco, R., Tores, F., Rousseau, F., Lewin, P., Hager, J., & Persico, A. M. (2011) · Biological Psychiatry · doi:10.1016/j.biopsych.2011.05.020 · Cited by 59
Mao, W., Watanabe, T., Cho, S., Frost, J. L., Truong, T., Zhao, X., & Futai, K. (2015) · European Journal of Neuroscience · doi:10.1111/ejn.12877 · Cited by 59
The Regulation of a Cell’s Ca2+ Signaling Toolkit: The Ca2+ Homeostasome
Schwaller, B. (2012) · Advances in Experimental Medicine and Biology · doi:10.1007/978-94-007-2888-2_1 · Cited by 54
Self-citationSHANK3,the Synapse, and Autism
Herbert, M. R. (2011) · New England Journal of Medicine · doi:10.1056/nejmcibr1104261 · Cited by 50
Albéri, L., Lintas, A., Kretz, R., Schwaller, B., & Villa, A. E. P. (2013) · Journal of Neurophysiology · doi:10.1152/jn.00375.2012 · Cited by 49 · cited 1×
“In addition, the demonstration that PV levels are decreased may indicate a shift in the E/I balance towards an increased inhibition, taking into account the proven role of PV in synaptic transmission [52, 53, 55, 97, 98].”
BackgroundSelf-citationChen, G., Racay, P., Bichet, S., Celio, M. R., Eggli, P., & Schwaller, B. (2006) · Neuroscience · doi:10.1016/j.neuroscience.2006.06.008 · Cited by 47
Self-citationMoreno, H., Burghardt, N. S., Vela‐Duarte, D., Masciotti, J. M., Hua, F., Fenton, A. A., Schwaller, B., & Small, S. A. (2011) · Hippocampus · doi:10.1002/hipo.20957 · Cited by 39
Self-citationThe promising trajectory of autism therapeutics discovery
Silverman, J. L., & Crawley, J. N. (2013) · Drug Discovery Today · doi:10.1016/j.drudis.2013.12.007 · Cited by 35
Maetzler, W., Stünitz, H., Bendfeldt, K., Vollenweider, F., Schwaller, B., & Nitsch, C. (2008) · Neuropathology and Applied Neurobiology · doi:10.1111/j.1365-2990.2008.00970.x · Cited by 18
Self-citationPlaja, A., Mir�, R., Fuster, C., Perez, C., Sarret, E., Esteve, P., & Egozcue, J. (2001) · American Journal of Medical Genetics · doi:10.1002/1096-8628(20010615)101:2 · Cited by 3
Cited by
Sorted by citations
Hippocampal GABAergic Inhibitory Interneurons
Pelkey, K. A., Chittajallu, R., Craig, M. T., Tricoire, L., Wester, J. C., & McBain, C. J. (2017) · Physiological Reviews · doi:10.1152/physrev.00007.2017 · Cited by 889
The Inositol Trisphosphate/Calcium Signaling Pathway in Health and Disease
Berridge, M. J. (2016) · Physiological Reviews · doi:10.1152/physrev.00006.2016 · Cited by 779
SHANK proteins: roles at the synapse and in autism spectrum disorder
Monteiro, P., & Feng, G. (2017) · Nature Reviews Neuroscience · doi:10.1038/nrn.2016.183 · Cited by 681
Antoine, M. W., Langberg, T., Schnepel, P., & Feldman, D. E. (2019) · Neuron · doi:10.1016/j.neuron.2018.12.026 · Cited by 413
Steullet, P., Cabungcal, J.-H., Coyle, J., Didriksen, M., Gill, K., Grace, A. A., Hensch, T. K., LaMantia, A.-S., Lindemann, L., Maynard, T. M., et al. (2017) · Molecular Psychiatry · doi:10.1038/mp.2017.47 · Cited by 360
Metadata
- Authors
- Filice, F., Vörckel, K. J., Sungur, A. Ö., Wöhr, M., & Schwaller, B.
- Affiliations
- University of Fribourg (CH)
- Philipps University of Marburg (DE)
- Corresponding author
- Schwaller, Beat
- Venue
- Molecular Brain
- Published
- 2016-01-27
- Volume
- 9
- Issue
- 1
- Pages
- 10-10
- ISSN
- 1756-6606 (ISSN-L)
- PMC
- PMC4729132
- OpenAlex
- W2276586942
- Cited by
- 240
- References
- 109
- Citations by year
- 2026: 15 · 2025: 22 · 2024: 24 · 2023: 30 · 2022: 24 · 2021: 25 · 2020: 26 · 2019: 27 · 2018: 22 · 2017: 19 · 2016: 6
- FWCI
- 15.70
- Type
- journal article
- Language
- en
- Open access
- gold
- doi.org
- Licence
- cc-by
- Locations
- Molecular Brain (publishedVersion, cc-by)
- PubMed Central (publishedVersion, cc-by)
- PubMed (publishedVersion)
- reroDoc Digital Library (submittedVersion)
- Lirias (submittedVersion, other-oa)
- Funders
- Schweizerischer Nationalfonds zur Förderung der Wissenschaftlichen Forschung (155952, 130680)
- Deutsche Forschungsgemeinschaft (DFG) (DFG WO 17327/1-1)
- Topics
- Life Sciences › Neuroscience › Cognitive Neuroscience › Autism Spectrum Disorder Research
- Life Sciences › Biochemistry, Genetics and Molecular Biology › Genetics › Genetics and Neurodevelopmental Disorders
- Life Sciences › Neuroscience › Cellular and Molecular Neuroscience › Neuroscience and Neuropharmacology Research
- Keywords
- parvalbumin, autism spectrum disorder, Shank1, Shank3B, GABAergic interneurons, excitation-inhibition balance, medial prefrontal cortex, somatosensory cortex, striatum, mouse models of autism
- MeSH terms
- Animals, Autistic Disorder, Cell Count, Cerebral Cortex, Disease Models, Animal, Fluorescent Antibody Technique, Interneurons, Mice, Inbred C57BL, Mice, Mutant Strains, Microfilament Proteins, Nerve Tissue Proteins, Parvalbumins, Prefrontal Cortex, GABAergic Neurons
About these checks
Registry, retraction, Cites and statistics results are computed, not judged, with one exception: a printed reference that no index lists is read once by a model before it counts as a citation error. Claims are extracted by a model and kept only when their quote appears verbatim in the text; each cited source is then checked, with a model’s help, for whether it says what the claim relies on. Those verdicts can be wrong — read the claim’s quote and the cited source before relying on one.
A language model drew the claims from the paper on 2026-10-07, under version 3 of the claim definition (model deepseek-v4.1-flash, prompt extract-v3).
A second model labelled each claim on 2026-10-07 (model jev-1.13-20260917, definition revision gold-guideline-v0.2).
Cited sources are checked with a language model’s help (gpt-6-sol).
Statistics and arithmetic are recomputed, not judged.
Confidence bands are shown only for fields calibrated on our annotated test set. None is calibrated yet, so no band is shown.
What counts as a claim ›How we measure confidence ›How we check this ›
Are you an author, or do you see a problem with this page? Request a review
