

The DOI matches its Crossref record; 26 of the 27 references it cites were found in a registry or an index.
Interim results of a multicenter trial with the new electronic subretinal implant Alpha AMS in 15 Patients blind from inherited retinal degenerations.
Open accessAbstract
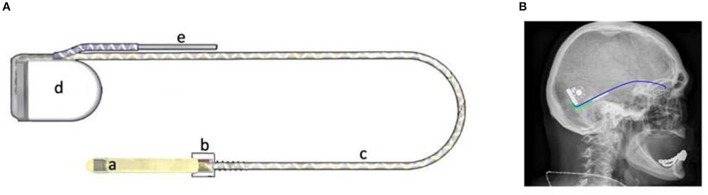
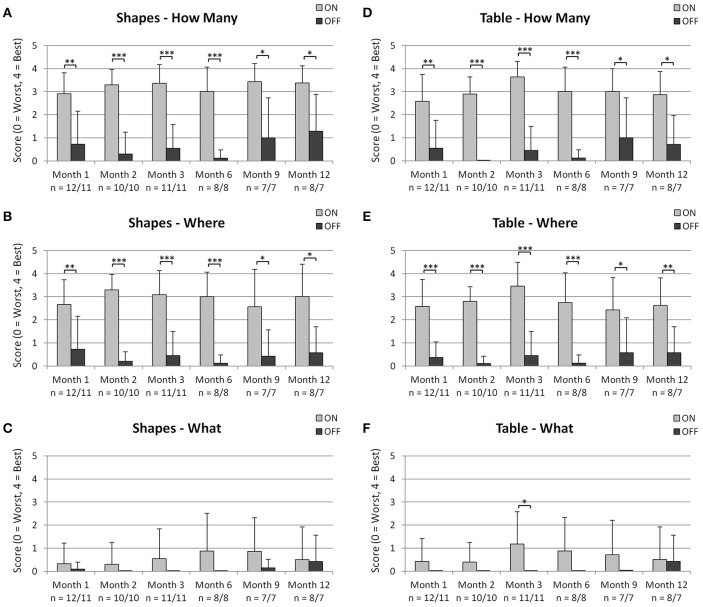
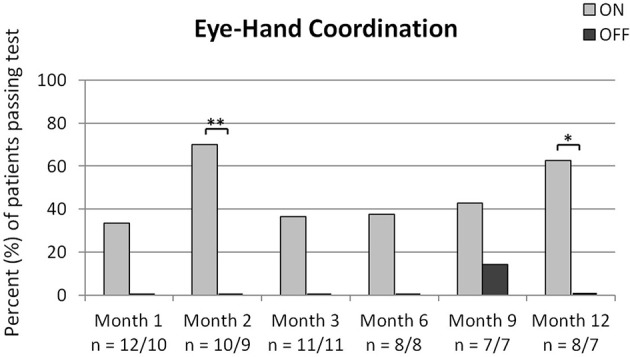
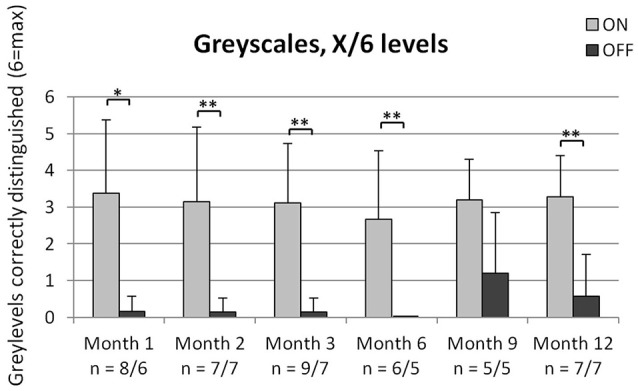
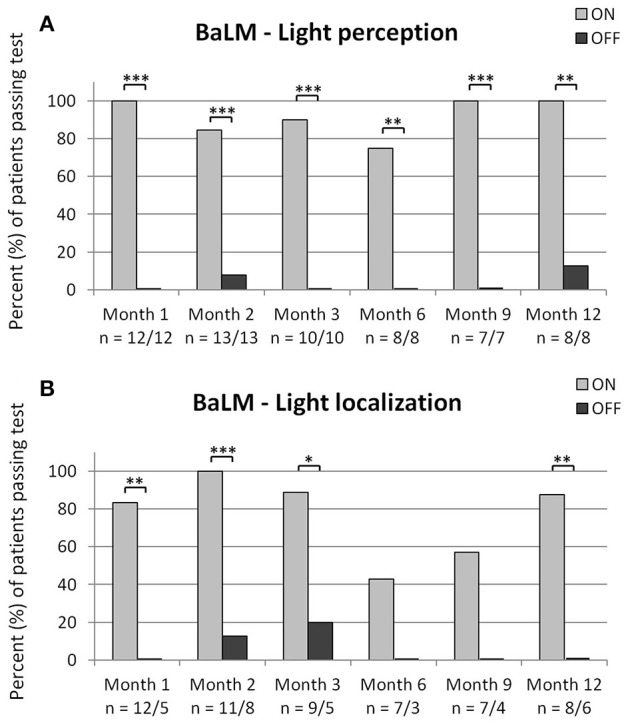
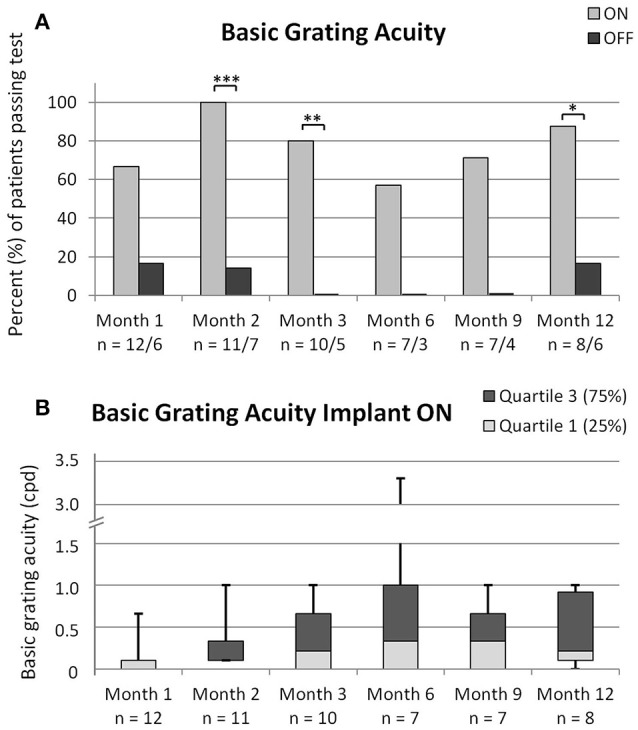
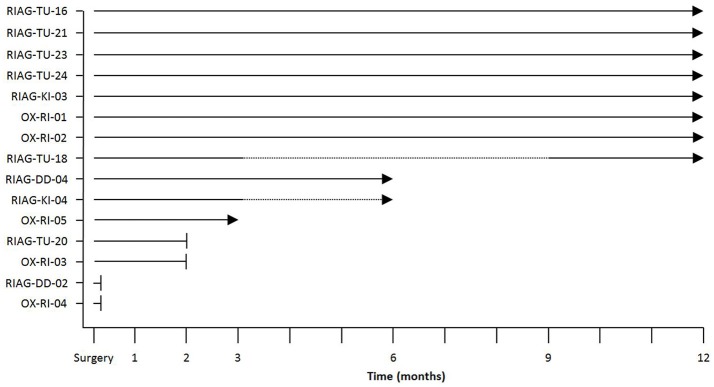
Purpose: We assessed the safety and efficacy of a technically advanced subretinal electronic implant, RETINA IMPLANT Alpha AMS, in end stage retinal degeneration in an interim analysis of two ongoing prospective clinical trials. Methods: The subretinal visual prosthesis RETINA IMPLANT Alpha AMS (Retina Implant AG, Reutlingen, Germany) was implanted in 15 blind patients with hereditary retinal degenerations at four study sites with a follow-up period of 12 months (www.clinicaltrials.gov NCT01024803 and NCT02720640). Functional outcome measures included 1) screen-based standardized 2- or 4-alternative forced-choice tests of light perception, light localization, grating detection (basic grating acuity (BaGA) test) and Landolt C-rings; 2) grey level discrimination; 3) performance during activities of daily living (ADL-table tasks). Results: Implant-mediated light perception was observed in 13/15 patients. During the observation period implant mediated localization of visual targets was possible in 13/15 patients. Correct grating detection was achieved for spatial frequencies of 0.1 cpd (cycles per degree) in 4/15; 0.33 cpd in 3/15; 0.66 cpd in 2/15; 1.0 cpd in 2/15 and 3.3 cpd in 1/15 patients. In two patients visual acuity assessed with Landolt C- rings was 20/546 and 20/1111. Of 6 possible grey levels on average 4.6 +/-0.8 (mean +/- SD, n=10) were discerned. Improvements (power ON vs. OFF) of ADL table tasks were measured in 13/15 patients. Overall, results were stable during the observation period. Serious adverse events were reported in 4 patients: 2 movements of the implant, readjusted in a second surgery; 4 conjunctival erosion/dehiscence, successfully treated; 1 pain event around the coil, successfully treated; 1 partial reduction of silicone oil tamponade leading to distorted vision (silicon oil successfully refilled). The majority of adverse events were transient and mostly of mild to moderate intensity. Conclusions: Psychophysical and subjective data show that RETINA IMPLANT Alpha AMS is reliable, well tolerated and can restore limited visual functions in blind patients with degenerations of the outer retina. Compared with the previous implant Alpha IMS, longevity of the new implant Alpha AMS has been considerably improved. Alpha AMS has meanwhile been certified as a commercially available medical device, reimbursed in Germany by the public health system.
Overview
The claims and statistics of this paper haven’t been checked yet.
Run the check — free, no account needed. It reads the open-access text and checks the sources it cites.
Integrity signals
Registry
Cites
Statistics
Figures
Verification
Claims the paper makes
The claims and statistics of this paper haven’t been checked yet.
Run the check — free, no account needed. It reads the open-access text and checks the sources it cites.
Claims other papers make about this one
Each is checked against this paper’s own text: does it say what the citing paper says it does?
In the citing paper
“At present, retinal prostheses are the most successful approach in this field, and several retinal devices have already been approved for patients with retinal dystrophies (Da Cruz et al., 2016; Stingl et al., 2017).”
From Toward Long-Term Communication With the Brain in the Blind by Intracortical Stimulation: Challenges and Future Prospects (2020) · cites this paper as Stingl et al., 2017
In the citing paper
“several research groups are focusing their efforts on the development of new approaches for artificial vision based on electric stimulation of the retina”
From Toward Long-Term Communication With the Brain in the Blind by Intracortical Stimulation: Challenges and Future Prospects (2020) · cites this paper as Stingl et al., 2017
In the citing paper
“At present, retinal prostheses are the most successful approach in this field, and several retinal devices have already been approved for patients with retinal dystrophies (Da Cruz et al., 2016; Stingl et al., 2017).”
From Toward Long-Term Communication With the Brain in the Blind by Intracortical Stimulation: Challenges and Future Prospects (2020) · cites this paper as Stingl et al., 2017
In the citing paper
“The best documented grating visual acuity with Alpha AMS has been equivalent to around 0.95 logMAR (6/60 Snellen), although significant variations exist over time and between patients [Stingl 2017; Edwards 2018].”
From Correcting visual loss by genetics and prosthetics (2020) · cites this paper as Stingl 2017
Self-check
Percentages, sums and reported differences re-computed from the paper’s own numbers.
The self-check needs the paper’s full text.
Citations
Cites
Effect of gene therapy on visual function in Leber’s congenital amaurosis
Bainbridge, J. W. B., Smith, A. J., Barker, S. S., Robbie, S., Henderson, R., Balaggan, K., Viswanathan, A., Holder, G. E., Stockman, A., Tyler, N., et al. (2008) · New England Journal of Medicine · doi:10.1056/nejmoa0802268 · Cited by 1,924
Subretinal electronic chips allow blind patients to read letters and combine them to words
Zrenner, E., Bartz-Schmidt, K. U., Benav, H., Besch, D., Bruckmann, A., Gabel, V.-P., Gekeler, F., Greppmaier, U., Harscher, A., Kibbel, S., et al. (2011) · Proceedings of the Royal Society B: Biological Sciences · doi:10.1098/rspb.2010.1747 · Cited by 819
MacLaren, R. E., Groppe, M., Barnard, A. R., Cottriall, C. L., Tolmachova, T., Seymour, L., Clark, K. R., During, M. J., Cremers, F. P. M., Black, G. C. M., et al. (2014) · The Lancet · doi:10.1016/s0140-6736(13)62117-0 · Cited by 796
Self-citationInterim results from the international trial of Second Sight's visual prosthesis
Humayun, M. S., Dorn, J. D., da Cruz, L., Dagnelie, G., Sahel, J.-A., Stanga, P. E., Cideciyan, A. V., Duncan, J. L., Eliott, D., Filley, E., et al. (2012) · Ophthalmology · doi:10.1016/j.ophtha.2011.09.028 · Cited by 700
Retinitis Pigmentosa: Genes and Disease Mechanisms
Parmeggiani, F., Sorrentino, F. S., Ponzin, D., Barbaro, V., Ferrari, S., & Iorio, E. D. (2011) · Current Genomics · doi:10.2174/138920211795860107 · Cited by 663
Artificial vision with wirelessly powered subretinal electronic implant alpha-IMS
Stingl, K., Bartz-Schmidt, K. U., Besch, D., Braun, A., Bruckmann, A., Gekeler, F., Greppmaier, U., Hipp, S., Hörtdörfer, G., Kernstock, C., et al. (2013) · Proceedings of the Royal Society B: Biological Sciences · doi:10.1098/rspb.2013.0077 · Cited by 473
Bennett, J., Wellman, J., Marshall, K. A., McCague, S., Ashtari, M., DiStefano-Pappas, J., Elci, O. U., Chung, D. C., Sun, J., Wright, J. F., et al. (2016) · The Lancet · doi:10.1016/s0140-6736(16)30371-3 · Cited by 461
Subretinal visual implant alpha IMS - clinical trial interim report
Stingl, K., Bartz-Schmidt, K. U., Besch, D., Chee, C. K., Cottriall, C. L., Gekeler, F., Groppe, M., Jackson, T. L., MacLaren, R. E., Koitschev, A., et al. (2015) · Vision Research · doi:10.1016/j.visres.2015.03.001 · Cited by 387
First-in-human trial of a novel suprachoroidal retinal prosthesis
Ayton, L. N., Blamey, P. J., Guymer, R. H., Luu, C. D., Nayagam, D. A. X., Sinclair, N. C., Shivdasani, M. N., Yeoh, J., McCombe, M. F., Briggs, R. J., et al. (2014) · PLoS ONE · doi:10.1371/journal.pone.0115239 · Cited by 333
Long-Term Results from an Epiretinal Prosthesis to Restore Sight to the Blind
Ho, A. C., Humayun, M. S., Dorn, J. D., da Cruz, L., Dagnelie, G., Handa, J. T., Barale, P. O., Sahel, J., Stanga, P. E., Hafezi, F., et al. (2015) · Ophthalmology · doi:10.1016/j.ophtha.2015.04.032 · Cited by 262
Research works printed but not linked: 2
- Kernstock, 2011, 3D-visualisation of power supply cable of subretinal electronic implants during eye movement. [Abstract], Invest. Ophthalmol. Vis. Sci., 52, 1341
- Sachs, 2010, Subretinal implant: the intraocular implantation technique, Nova Acta Leopoldina NF III, 379, 217
Cited by
Sorted by citations
Age-related macular degeneration
Mitchell, P., Liew, G., Gopinath, B., & Wong, T. Y. (2018) · The Lancet · doi:10.1016/s0140-6736(18)31550-2 · Cited by 1,511
Non-syndromic retinitis pigmentosa
Verbakel, S. K., van Huet, R. A. C., Boon, C. J. F., den Hollander, A. I., Collin, R. W. J., Klaver, C. C. W., Hoyng, C. B., Roepman, R., & Klevering, B. J. (2018) · Progress in Retinal and Eye Research · doi:10.1016/j.preteyeres.2018.03.005 · Cited by 973
The Argus® II Retinal Prosthesis System
Luo, Y. H.-L., & da Cruz, L. (2016) · Progress in Retinal and Eye Research · doi:10.1016/j.preteyeres.2015.09.003 · Cited by 351
Photovoltaic Restoration of Central Vision in Atrophic Age-Related Macular Degeneration
Palanker, D., Le Mer, Y., Mohand-Said, S., Muqit, M., & Sahel, J. A. (2020) · Ophthalmology · doi:10.1016/j.ophtha.2020.02.024 · Cited by 227
An update on retinal prostheses
Ayton, L. N., Barnes, N., Dagnelie, G., Fujikado, T., Goetz, G., Hornig, R., Jones, B. W., Muqit, M. M. K., Rathbun, D. L., Stingl, K., et al. (2020) · Clinical Neurophysiology · doi:10.1016/j.clinph.2019.11.029 · Cited by 223
Advances in retinal prosthesis systems
Bloch, E., Luo, Y., & da Cruz, L. (2019) · Therapeutic Advances in Ophthalmology · doi:10.1177/2515841418817501 · Cited by 201
Persistent remodeling and neurodegeneration in late-stage retinal degeneration
Pfeiffer, R. L., Marc, R. E., & Jones, B. W. (2019) · Progress in Retinal and Eye Research · doi:10.1016/j.preteyeres.2019.07.004 · Cited by 184
Roska, B., & Sahel, J.-A. (2018) · Nature · doi:10.1038/s41586-018-0076-4 · Cited by 161
Gauvain, G., Akolkar, H., Chaffiol, A., Arcizet, F., Khoei, M. A., Desrosiers, M., Jaillard, C., Caplette, R., Marre, O., Bertin, S., et al. (2021) · Communications Biology · doi:10.1038/s42003-020-01594-w · Cited by 131
Development of visual Neuroprostheses: trends and challenges.
Fernandez, E. (2018) · Bioelectronic Medicine · doi:10.1186/s42234-018-0013-8 · Cited by 114
The primate model for understanding and restoring vision
Picaud, S. A., Dalkara, D., Marazova, K., Goureau, O., Roska, B., & Sahel, J. (2019) · Proceedings of the National Academy of Sciences · doi:10.1073/pnas.1902292116 · Cited by 115
Regenerative and restorative medicine for eye disease
Gelder, R. N. V., Chiang, M. F., Dyer, M. A., Greenwell, T. N., Levin, L. A., Wong, R., & Svendsen, C. N. (2022) · Nature Medicine · doi:10.1038/s41591-022-01862-8 · Cited by 111
Erickson-Davis, C., & Korzybska, H. (2021) · PLoS ONE · doi:10.1371/journal.pone.0229189 · Cited by 83
Bioengineering strategies for restoring vision
Cehajic-Kapetanovic, J., Singh, M. S., Zrenner, E., & MacLaren, R. E. (2022) · Nature Biomedical Engineering · doi:10.1038/s41551-021-00836-4 · Cited by 79
Retinitis Pigmentosa: Review of Current Treatment
Wang, A. L., Knight, D. K., Vu, T.-T. T., & Mehta, M. C. (2018) · International Ophthalmology Clinics · doi:10.1097/iio.0000000000000256 · Cited by 73
Stimulation strategies for improving the resolution of retinal prostheses
Tong, W., Meffin, H., Garrett, D. J., & Ibbotson, M. R. (2020) · Frontiers in Neuroscience · doi:10.3389/fnins.2020.00262 · Cited by 66
Behavioural responses to a photovoltaic subretinal prosthesis implanted in non-human primates
Prévot, P.-H., Gehere, K., Arcizet, F., Akolkar, H., Khoei, M. A., Blaize, K., Oubari, O., Daye, P. M., Lanoë, M., Valet, M., et al. (2019) · Nature Biomedical Engineering · doi:10.1038/s41551-019-0484-2 · Cited by 69
Characteristics of prosthetic vision in rats with subretinal flat and pillar electrode arrays
Ho, E., Lei, X., Flores, T., Lorach, H., Huang, T., Galambos, L., Kamins, T., Harris, J., Mathieson, K., & Palanker, D. (2019) · Journal of Neural Engineering · doi:10.1088/1741-2552/ab34b3 · Cited by 65
“Although the retinal circuitry undergoes drastic remodeling during the end-stage of degeneration, when all photoreceptors are lost, as in Retinitis Pigmentosa [40, 41], recent clinical trials have demonstrated shape perception with subretinal electrical stimulation in RP patients [22].”
Retinal Prostheses: Engineering and Clinical Perspectives for Vision Restoration
Wu, K. Y., Mina, M., Sahyoun, J.-Y., Kalevar, A., & Tran, S. D. (2023) · Sensors · doi:10.3390/s23135782 · Cited by 75
A Second-Generation (44-Channel) Suprachoroidal Retinal Prosthesis: Interim Clinical Trial Results
Petoe, M. A., Titchener, S. A., Kolic, M., Kentler, W. G., Abbott, C. J., Nayagam, D. A. X., Baglin, E. K., Kvansakul, J., Barnes, N., Walker, J. G., et al. (2021) · Translational Vision Science & Technology · doi:10.1167/tvst.10.10.12 · Cited by 63
Honeycomb-shaped electro-neural interface enables cellular-scale pixels in subretinal prosthesis
Flores, T. A., Huang, T., Bhuckory, M. B., Ho, E., Chen, Z., Dalal, R., Galambos, L., Kamins, T. I., Mathieson, K., & Palanker, D. (2019) · Scientific Reports · doi:10.1038/s41598-019-47082-y · Cited by 61
Augmented reality powers a cognitive assistant for the blind
Liu, Y., Stiles, N. R. B., & Meister, M. (2018) · eLife · doi:10.7554/elife.37841 · Cited by 66
Inherited retinal disease in Norway – a characterization of current clinical and genetic knowledge
Holtan, J. P., Selmer, K. K., Heimdal, K., & Bragadóttir, R. (2019) · Acta Ophthalmologica · doi:10.1111/aos.14218 · Cited by 64
Contemporary approaches to visual prostheses
Mirochnik, R. M., & Pezaris, J. S. (2019) · Military Medical Research · doi:10.1186/s40779-019-0206-9 · Cited by 58
Yang, R., Zhao, P., Wang, L., Feng, C., Chen, P., Wang, Z., Zhang, Y., Shen, M., Shi, K., Weng, S.-J., et al. (2023) · Nature Biomedical Engineering · doi:10.1038/s41551-023-01137-8 · Cited by 57
Muqit, M. M. K., Mer, Y. L., de Koo, L. C. O., Holz, F. G., Sahel, J., & Palanker, D. (2024) · Ophthalmology Science · doi:10.1016/j.xops.2024.100510 · Cited by 50
Muqit, M. M. K., Velikay-Parel, M., Weber, M., Dupeyron, G., Audemard, D., Corcostegui, B., Sahel, J., & Le Mer, Y. (2019) · Ophthalmology · doi:10.1016/j.ophtha.2018.11.010 · Cited by 46
Subretinal Photovoltaic Implant to Restore Vision in Geographic Atrophy Due to AMD
Holz, F. G., Mer, Y. L., Muqit, M. M. K., Kuhli-Hattenbach, C., Cusumano, A., Grisanti, S., Kodjikian, L., Pileri, M., Matonti, F., Souied, E. H., et al. (2025) · New England Journal of Medicine · doi:10.1056/nejmoa2501396 · Cited by 53
Advances in visual prostheses: engineering and biological challenges
Borda, E., & Ghezzi, D. (2022) · Progress in Biomedical Engineering · doi:10.1088/2516-1091/ac812c · Cited by 44
Implantation of electronic visual prosthesis for blindness restoration
Jang, J., Kim, H., Song, Y. M., & Park, J. (2019) · Optical Materials Express · doi:10.1364/ome.9.003878 · Cited by 43
Fernández, E., Alfaro, A., & González-López, P. (2020) · Frontiers in Neuroscience · doi:10.3389/fnins.2020.00681 · Cited by 35
Joseph, E., Ciocca, M., Wu, H., Marcozzi, S., Ucci, M. A., Keremane, K. S., Zheng, L., Poudel, B., Wu, C., Camaioni, A., et al. (2024) · npj Biosensing · doi:10.1038/s44328-024-00015-w · Cited by 41
Paraskevoudi, N., & Pezaris, J. S. (2019) · Frontiers in Systems Neuroscience · doi:10.3389/fnsys.2018.00073 · Cited by 39
Abdullaeva, O. S., Balzer, F., Schulz, M., Parisi, J., Lützen, A., Dedek, K., & Schiek, M. (2018) · Advanced Functional Materials · doi:10.1002/adfm.201805177 · Cited by 39
Retinal Organoids and Retinal Prostheses: An Overview
Bellapianta, A., Cetkovic, A., Bolz, M., & Salti, A. (2022) · International Journal of Molecular Sciences · doi:10.3390/ijms23062922 · Cited by 40
Neural Prosthetics: A Review of Empirical vs. Systems Engineering Strategies
Loeb, G. E. (2018) · Applied Bionics and Biomechanics · doi:10.1155/2018/1435030 · Cited by 38
Novel graphene electrode for retinal implants: an in vivo biocompatibility study
Nguyen, D., Valet, M., Dégardin, J., Boucherit, L., Illa, X., de la Cruz, J., del Corro, E., Bousquet, J., Garrido, J. A., Hébert, C., et al. (2021) · Frontiers in Neuroscience · doi:10.3389/fnins.2021.615256 · Cited by 36
Sahel, J., Grieve, K. F., Pagot, C., Authié, C., Mohand‐Saïd, S., Pâques, M., Audo, I. S., Becker, K., Chaumet-Riffaud, A.-E., Azoulay-Sebban, L., et al. (2021) · American Journal of Ophthalmology · doi:10.1016/j.ajo.2021.04.013 · Cited by 36
Thorn, J. T., Migliorini, E., & Ghezzi, D. (2020) · Journal of Neural Engineering · doi:10.1088/1741-2552/abb5bc · Cited by 34
Retinal Prosthetic Approaches to Enhance Visual Perception for Blind Patients
Shim, S., Eom, K., Jeong, J., & Kim, S. J. (2020) · Micromachines · doi:10.3390/mi11050535 · Cited by 35
The argus ii retinal prosthesis system
Bloch, E., & da Cruz, L. (2020) · Prosthesis · doi:10.5772/intechopen.84947 · Cited by 31
Gekeler, K., Bartz‐Schmidt, K. U., Sachs, H. G., MacLaren, R. E., Štingl, K., Zrenner, E., & Gekeler, F. (2018) · Current Opinion in Ophthalmology · doi:10.1097/icu.0000000000000467 · Cited by 31
Vision Processing for Assistive Vision: A Deep Reinforcement Learning Approach
White, J., Kameneva, T., & McCarthy, C. D. (2021) · IEEE Transactions on Human-Machine Systems · doi:10.1109/thms.2021.3121661 · Cited by 29
Varela, M. D., Bellingham, J., Motta, F. L., Jurkutė, N., Ellingford, J. M., Quinodoz, M., Oprych, K., Niblock, M., Janeschitz‐Kriegl, L., Kamińska, K., et al. (2022) · Human Molecular Genetics · doi:10.1093/hmg/ddac227 · Cited by 29
Interfacing with the nervous system: a review of current bioelectric technologies
Sahyouni, R., Mahmoodi, A., Chen, J. W., Chang, D. T., Moshtaghi, O., Djalilian, H. R., & Lin, H. W. (2017) · Neurosurgical Review · doi:10.1007/s10143-017-0920-2 · Cited by 28
Yue, L., Wuyyuru, V., Gonzalez-Calle, A., Dorn, J. D., & Humayun, M. S. (2020) · Journal of Neural Engineering · doi:10.1088/1741-2552/ab7c8f · Cited by 27
Electronic Retinal ProsthesesPreprint
Palanker, D. (2020) · Cold Spring Harbor Perspectives in Medicine · doi:10.1016/b978-0-12-809324-5.24123-0 · Cited by 32
Highest reported visual acuity after electronic retinal implantation
Cehajic‐Kapetanovic, J., Troelenberg, N., Edwards, T. L., Xue, K., Ramsden, J. D., Stett, A., Zrenner, E., & MacLaren, R. E. (2020) · Acta Ophthalmologica · doi:10.1111/aos.14443 · Cited by 27
Chaffiol, A., Provansal, M., Joffrois, C., Blaize, K., Labernède, G., Goulet, R., Burban, E., Brazhnikova, E., Duebel, J., Pouget, P., et al. (2021) · Molecular Therapy — Methods & Clinical Development · doi:10.1016/j.omtm.2021.11.009 · Cited by 26
Petoe, M. A., Abbott, C. J., Titchener, S. A., Kolic, M., Kentler, W. G., Nayagam, D. A. X., Baglin, E. K., Kvansakul, J. G. S., Barnes, N. M., Walker, J. G., et al. (2024) · Ophthalmology Science · doi:10.1016/j.xops.2024.100525 · Cited by 27
Stingl, K. T., Kuehlewein, L., Weisschuh, N., Biskup, S., Cremers, F. P. M., Khan, M. I., Kelbsch, C., Peters, T. M., Ueffing, M., Wilhelm, B., et al. (2019) · Translational Vision Science & Technology · doi:10.1167/tvst.8.6.45 · Cited by 25
Optoelectronic Devices for Vision Restoration
Wang, V., & Kuriyan, A. E. (2020) · Current Ophthalmology Reports · doi:10.1007/s40135-020-00232-2 · Cited by 24
Pixel size limit of the PRIMA implants: from humans to rodents and back
Wang, B.-Y., Chen, Z., Bhuckory, M. B., Goldstein, A. K., & Palanker, D. (2022) · Journal of Neural Engineering · doi:10.1088/1741-2552/ac8e31 · Cited by 24
Barnea-Cramer, A. O., Singh, M. S., Fischer, D., Silva, S. R. D., McClements, M. E., Barnard, A. R., & MacLaren, R. E. (2020) · Molecular Therapy · doi:10.1016/j.ymthe.2020.01.023 · Cited by 24
Hallum, L. E., & Dakin, S. C. (2021) · Translational Vision Science & Technology · doi:10.1167/tvst.10.10.8 · Cited by 21
Haq, W., Dietter, J., & Zrenner, E. (2018) · Scientific Reports · doi:10.1038/s41598-018-35296-5 · Cited by 22
Im, M., & Kim, S. (2020) · Journal of Neural Engineering · doi:10.1088/1741-2552/ab8ca9 · Cited by 23
Antolík, J., Sabatier, Q., Galle, C., Frégnac, Y., & Benosman, R. B. (2021) · Scientific Reports · doi:10.1038/s41598-021-88960-8 · Cited by 19
In Vivo Photovoltaic Performance of a Silicon Nanowire Photodiode–Based Retinal Prosthesis
Bosse, B., Damle, S., Akinin, A., Jing, Y., Bartsch, D., Cheng, L., Oesch, N. W., Lo, Y., Cauwenberghs, G., & Freeman, W. R. (2018) · Investigative Ophthalmology & Visual Science · doi:10.1167/iovs.18-24554 · Cited by 20
Current perspective on retinal remodeling: Implications for therapeutics
Pfeiffer, R. L., & Jones, B. W. (2022) · Frontiers in Neuroanatomy · doi:10.3389/fnana.2022.1099348 · Cited by 19
Oculomotor Responses to Dynamic Stimuli in a 44-Channel Suprachoroidal Retinal Prosthesis
Titchener, S. A., Kvansakul, J. G. S., Shivdasani, M. N., Fallon, J. B., Nayagam, D. A. X., Epp, S. B., Williams, C. E., Barnes, N. M., Kentler, W. G., Kolic, M., et al. (2020) · Translational Vision Science & Technology · doi:10.1167/tvst.9.13.31 · Cited by 20
Corna, A., Ramesh, P., Jetter, F., Lee, M.-J., Macke, J. H., & Zeck, G. (2021) · Journal of Neural Engineering · doi:10.1088/1741-2552/ac0679 · Cited by 18
Nanotechnology for vision restoration
Lanzani, G., Chiaravalli, G., Colombo, E., Manfredi, G., Marco, S. D., Vurro, V., & Benfenati, F. (2024) · Nature Reviews Bioengineering · doi:10.1038/s44222-024-00210-4 · Cited by 18
Laser Driven Miniature Diamond Implant for Wireless Retinal Prostheses
Ahnood, A., Cheriton, R., Bruneau, A., Belcourt, J. A., Ndabakuranye, J. P., Lemaire, W., Hilkes, R., Fontaine, R., Cook, J. P. D., Hinzer, K., et al. (2020) · Advanced Biosystems · doi:10.1002/adbi.202000055 · Cited by 18
Chen, K.-S., Chan, H.-C., & Chan, C.-M. (2025) · Journal of Biological Engineering · doi:10.1186/s13036-025-00548-2 · Cited by 19
Matsuo, T., Uchida, T., Sakùrai, J., Yamashita, K., Matsuo, C., Araki, T., Yamashita, Y., & Kamikawa, K. (2018) · Artificial Organs · doi:10.1111/aor.13120 · Cited by 17
Neurosensory Prosthetics: An Integral Neuromodulation Part of Bioelectronic Device
Ezeokafor, I., Upadhya, A., & Shetty, S. R. (2021) · Frontiers in Neuroscience · doi:10.3389/fnins.2021.671767 · Cited by 19
Adaptive Interfacial Materials and Implants for Visual Restoration
Zhu, X., Wang, F., Zhao, Q., & Du, X. (2024) · Advanced Functional Materials · doi:10.1002/adfm.202314575 · Cited by 17
Feasibility of Intraocular Projection for Treatment of Intractable Corneal Opacity
Shim, S. Y., Gong, S., Rosenblatt, M. I., Palanker, D., Al-Qahtani, A. F., Sun, M. G., Zhou, Q., Kanu, L. N., Chau, F. Y., & Yu, C. Q. (2019) · Cornea · doi:10.1097/ico.0000000000001852 · Cited by 17
Paraskevoudi, N., & Pezaris, J. S. (2021) · Scientific Reports · doi:10.1038/s41598-021-86996-4 · Cited by 16
Aligning Visual Prosthetic Development With Implantee Needs
Nadolskis, L., Turkstra, L. M., Larnyo, E., & Beyeler, M. (2024) · Translational Vision Science & Technology · doi:10.1167/tvst.13.11.28 · Cited by 16
Human-in-the-loop optimization of visual prosthetic stimulation
Fauvel, T., & Chalk, M. (2022) · Journal of Neural Engineering · doi:10.1088/1741-2552/ac7615 · Cited by 15
Cha, S., Ahn, J., Jeong, Y., Lee, Y. H., Kim, H. K., Lee, D., Yoo, Y., & Goo, Y. S. (2022) · Frontiers in Cellular Neuroscience · doi:10.3389/fncel.2022.926096 · Cited by 15
Estimating Phosphene Locations Using Eye Movements of Suprachoroidal Retinal Prosthesis Users
Titchener, S. A., Goossens, J., Kvansakul, J. G. S., Nayagam, D. A. X., Kolic, M., Baglin, E. K., Ayton, L. N., Abbott, C. J., Luu, C. D., Barnes, N. M., et al. (2023) · Translational Vision Science & Technology · doi:10.1167/tvst.12.3.20 · Cited by 15
Allen, P. J., Kolic, M., Baglin, E. K., Titchener, S. A., Kvansakul, J. G. S., Nayagam, D. A. X., Yeoh, J., Briggs, R., Villalobos, J., Williams, C. E., et al. (2025) · Clinical and Experimental Ophthalmology · doi:10.1111/ceo.14502 · Cited by 15
Muqit, M. M. K., Mer, Y. L., Holz, F. G., & Sahel, J. (2022) · Journal of Neural Engineering · doi:10.1088/1741-2552/ac9645 · Cited by 13
Fabrication of Subretinal 3D Microelectrodes with Hexagonal Arrangement
Seo, H. W., Kim, N., & Kim, S. (2020) · Micromachines · doi:10.3390/mi11050467 · Cited by 14
Asymmetric Activation of ON and OFF Pathways in the Degenerated Retina
Carleton, M., & Oesch, N. W. (2024) · eNeuro · doi:10.1523/eneuro.0110-24.2024 · Cited by 13
Glow in the dark: Using a heat-sensitive camera for blind individuals with prosthetic vision
Sadeghi, R., Kartha, A., Barry, M. P., Bradley, C., Gibson, P., Caspi, A., Roy, A., & Dagnelie, G. (2021) · Vision Research · doi:10.1016/j.visres.2021.02.009 · Cited by 13
High‐Frequency Stimulation of Normal and Blind Mouse Retinas Using TiO2 Nanotubes
Ronzani, C., Cottineau, T., González‐Valls, I., Keller, V., Picaud, S. A., Keller, N., & Roux, M. J. (2018) · Advanced Functional Materials · doi:10.1002/adfm.201804639 · Cited by 13
Stupin, D. D., Abelit, A. A., Mereshchenko, A. S., Panov, M. S., & Ryazantsev, M. N. (2022) · Biosensors · doi:10.3390/bios12070527 · Cited by 11
Vu, Q. A., Seo, H. W., Choi, K.-E., Kim, N., Kang, Y. N., Lee, J., Park, S.-H., Kim, J. T., Kim, S., & Kim, S. (2022) · Frontiers in Neuroscience · doi:10.3389/fnins.2022.1010445 · Cited by 11
Gaillet, V., Borda, E., Zollinger, E. G., & Ghezzi, D. (2021) · Journal of Neural Engineering · doi:10.1088/1741-2552/abf523 · Cited by 10
The mechanism of human color vision and potential implanted devices for artificial color vision
Zhang, B., Zhang, R., Zhao, J., Yang, J., & Xu, S. (2024) · Frontiers in Neuroscience · doi:10.3389/fnins.2024.1408087 · Cited by 12
In vivo feasibility of epiretinal stimulation using ultrananocrystalline diamond electrodes
Shivdasani, M. N., Evans, M., Burns, O., Yeoh, J., Allen, P. J., Nayagam, D. A. X., Villalobos, J., Abbott, C. J., Luu, C. D., Opie, N. L., et al. (2020) · Journal of Neural Engineering · doi:10.1088/1741-2552/aba560 · Cited by 10
Gehlen, J., Esser, S., Schaffrath, K., Johnen, S., Walter, P., & Müller, F. U. (2020) · Investigative Ophthalmology & Visual Science · doi:10.1167/iovs.61.13.37 · Cited by 9
Restriction of eye motility in patients with RETINA IMPLANT Alpha AMS
Faber, H., Besch, D., Bartz‐Schmidt, K., Eisenstein, H., Roider, J. B., Sachs, H. G., Gekeler, F., Zrenner, E., & Štingl, K. (2020) · Acta Ophthalmologica · doi:10.1111/aos.14435 · Cited by 10
Advancing treatment of retinal disease through in silico trials
Hernandez, R. J., Roberts, P. A., & El‐Bouri, W. K. (2023) · Progress in Biomedical Engineering · doi:10.1088/2516-1091/acc8a9 · Cited by 11
McGregor, J. E. (2019) · Current Opinion in Behavioral Sciences · doi:10.1016/j.cobeha.2019.10.003 · Cited by 9
Neuromodulation using electroosmosis
Kare, S. S., Rountree, C. M., Troy, J. B., Finan, J. D., & Saggere, L. (2021) · Journal of Neural Engineering · doi:10.1088/1741-2552/ac00d3 · Cited by 9
Li, W., Ghaffari, D. H., Misra, R., & Weiland, J. D. (2022) · Frontiers in Cellular Neuroscience · doi:10.3389/fncel.2022.897146 · Cited by 11
Responsive Neural Activities in the Primary Visual Cortex of Retina-Degenerated Rats
Wang, Y., Chen, K., & Chan, L. L. H. (2018) · Neuroscience · doi:10.1016/j.neuroscience.2018.05.006 · Cited by 9
Hybrid Neural Autoencoders for Stimulus Encoding in Visual and Other Sensory Neuroprostheses.
Granley, J., Relic, L., & Beyeler, M. (2022) · PubMed · Cited by 8
Restoration of Sight with Electronic Retinal Prostheses
Palanker, D., Weiland, J. D., Rosin, B., & Sahel, J. (2025) · Annual Review of Vision Science · doi:10.1146/annurev-vision-110323-025244 · Cited by 12
Sputtered Iridium Oxide as Electrode Material for Subretinal Stimulation
Haas, J., Rudorf, R., Becker, M. T., Daschner, R., Drzyzga, A., Burkhardt, C. J., & Stett, A. (2020) · Sensors and Materials · doi:10.18494/sam.2020.2903 · Cited by 8
Cross-task perceptual learning of object recognition in simulated retinal implant perception
Wang, L., Sharifian, F., Napp, J., Nath, C., & Pollmann, S. (2018) · Journal of Vision · doi:10.1167/18.13.22 · Cited by 10
Ahn, S. M., Ahn, J., Cha, S., Yun, C., Park, T. K., Kim, Y., Goo, Y. S., & Kim, S. (2020) · Scientific Reports · doi:10.1038/s41598-020-60579-1 · Cited by 8
Activation of retinal ganglion cells using a biomimetic artificial retina
Greco, J. A., Wagner, N. L., Jensen, R. J., Lawrence, D. B., Ranaghan, M. J., Sandberg, M. N., Sandberg, D. J., & Birge, R. R. (2021) · Journal of Neural Engineering · doi:10.1088/1741-2552/ac395c · Cited by 8
Building resilience when neural implants are abandoned
Kouvas, G., Coenen, C., Hommrich, D., Stieglitz, T., Elger, B. S., & Jotterand, F. (2025) · Nature Medicine · doi:10.1038/s41591-025-03772-x · Cited by 7
Sheardown, H. D., Hicks, E. A., Taiyab, A., & Muirhead, B. B. (2020) · Elsevier eBooks · doi:10.1016/b978-0-12-816137-1.00072-6 · Cited by 7
Metadata
- Authors
- Stingl, K., Schippert, R., Bartz-Schmidt, K. U., Besch, D., Cottriall, C. L., Edwards, T. L., Gekeler, F., Greppmaier, U., Kiel, K., Koitschev, A., Kühlewein, L., MacLaren, R. E., Ramsden, J. D., Roider, J., Rothermel, A., Sachs, H., Schröder, G. S., Tode, J., Troelenberg, N., & Zrenner, E.
- Affiliations
- University of Tübingen (DE)
- University of Oxford (GB)
- Katharinenhospital (DE)
- Städtisches Klinikum Dresden (DE)
- Olgahospital (DE)
- Christian-Albrechts-Universität zu Kiel (DE)
- Universität Ulm (DE)
- Venue
- Frontiers in Neuroscience
- Publisher
- Frontiers Media SA
- Published
- 2017-08-23
- Volume
- 11
- Pages
- 445-445
- ISSN
- 1662-453X (ISSN-L)
- PMC
- PMC5572402
- OpenAlex
- W2748114767
- Cited by
- 198
- References
- 27
- Citations by year
- 2026: 21 · 2025: 15 · 2024: 17 · 2023: 21 · 2022: 22 · 2021: 28 · 2020: 29 · 2019: 23 · 2018: 20 · 2017: 1
- FWCI
- 9.76
- Type
- journal article
- Language
- en
- Open access
- gold
- doi.org
- Licence
- cc-by
- Locations
- Frontiers in Neuroscience (publishedVersion, cc-by)
- PubMed Central (publishedVersion, cc-by)
- PubMed (publishedVersion)
- DOAJ (DOAJ: Directory of Open Access Journals) (submittedVersion, cc-by-sa)
- Minerva Access (University of Melbourne) (submittedVersion, cc-by)
- Multimedialen Archiv und Publikationsserver der Christian-Albrechts-Universität zu Kiel (Christian-Albrechts-Universität zu Kiel) (submittedVersion, cc-by)
- OPen Access Repositorium der Universität Ulm (OPARU) (Ulm University) (submittedVersion, cc-by)
- Universität Ulm, Kommunikations- und Informationszentrum (kiz) (cc-by)
- Funders
- National Institute for Health and Care Research (II-C2-0713-20005)
- University of Oxford
- Bundesministerium für Bildung und Forschung (FKZ 01GQ1002, 01GQ1002)
- Oxford University Hospitals NHS Foundation Trust
- Invention for Innovation
- Topics
- Life Sciences › Neuroscience › Cellular and Molecular Neuroscience › Neuroscience and Neural Engineering
- Health Sciences › Medicine › Ophthalmology › Retinal Development and Disorders
- Health Sciences › Medicine › Ophthalmology › Retinal Diseases and Treatments
- Keywords
- inherited retinal degeneration, light perception, light localization, grating detection, Landolt C, activities of daily living, implant safety, conjunctival erosion, silicone oil tamponade
About these checks
Registry, retraction, Cites and statistics results are computed, not judged, with one exception: a printed reference that no index lists is read once by a model before it counts as a citation error. Claims are extracted by a model and kept only when their quote appears verbatim in the text; each cited source is then checked, with a model’s help, for whether it says what the claim relies on. Those verdicts can be wrong — read the claim’s quote and the cited source before relying on one.
Statistics and arithmetic are recomputed, not judged.
Confidence bands are shown only for fields calibrated on our annotated test set. None is calibrated yet, so no band is shown.
What counts as a claim ›How we measure confidence ›How we check this ›
Are you an author, or do you see a problem with this page? Request a review
