

The DOI matches its Crossref record; 75 of the 76 references it cites were found in a registry or an index; none of the 79 sources its claims cite is checked for support yet.
Oxytocin pathway gene networks in the human brain
Open accessPublished version of a preprint
Abstract
Oxytocin is a neuropeptide involved in animal and human reproductive and social behavior. Three oxytocin signaling genes have been frequently implicated in human social behavior: OXT (structural gene for oxytocin), OXTR (oxytocin receptor), and CD38 (oxytocin secretion). Here, we characterized the distribution of OXT , OXTR , and CD38 mRNA across the human brain by creating voxel-by-voxel volumetric expression maps, and identified putative gene pathway interactions by comparing gene expression patterns across 20,737 genes. Expression of the three selected oxytocin pathway genes was enriched in subcortical and olfactory regions and there was high co-expression with several dopaminergic and muscarinic acetylcholine genes, reflecting an anatomical basis for critical gene pathway interactions. fMRI meta-analysis revealed that the oxytocin pathway gene maps correspond with the processing of anticipatory, appetitive, and aversive cognitive states. The oxytocin signaling system may interact with dopaminergic and muscarinic acetylcholine signaling to modulate cognitive state processes involved in complex human behaviors.
Overview
AI snapshot
Written from the paper’s full text.
TL;DR
This study mapped mRNA expression of oxytocin pathway genes (OXT, OXTR, CD38) across the human brain and compared their spatial patterns with all 20,737 protein-coding genes, dopaminergic/cholinergic gene sets, and fMRI-derived cognitive state maps. It reports that OXTR and CD38 are enriched in subcortical/olfactory regions, co-express with dopaminergic and muscarinic acetylcholine genes, and correspond to anticipatory, appetitive, and aversive cognitive states.
Key findings
- OXTR and CD38 expression was enriched in subcortical and olfactory regions and lower in cerebellum. OXTR was significantly higher than average in olfactory bulbs (p = 0.048, d = 2.1); CD38 was higher in caudate (p = 0.004, d = 4.1), pallidum (p = 0.004, d = 4.6), olfactory bulbs (p = 0.01, d = 3.4), putamen (p = 0.02, d = 2.7), thalamus (p = 0.03, d = 2.1), and anterior cingulate (p = 0.03, d = 2). No brain regions showed significantly higher OXT expression after FDR correction.
- OXTR and CD38 clustered with DRD2, DRD5, COMT, CHRM4, and CHRM5. A WGCNA module containing OXTR and CD38 (28 genes total) was enriched for waist-hip ratio adjusted for BMI and smoking (p = 1.13 × 10⁻²), feeding behavior (p = 5.83 × 10⁻³), cognition (p = 7.44 × 10⁻³), and behavioral response to stimuli (p = 1.05 × 10⁻²). The OXTR–CD38 association was significant (p < 0.0001) and in the top 5% of correlations among all 20,737 protein-coding genes.
- NeuroSynth reverse inference across 14,371 fMRI studies found OXTR expression most correlated with “sexual,” “motivation,” “incentive,” and “anxiety” maps, ranking in the top 0.5% of all 20,737 gene maps (p < 0.001); “taste,” “stress,” “reward,” “monetary,” “fear,” and “emotional” maps were within the top 2.5% (p < 0.001). OXTR (p = 0.0002) and CD38 (p = 0.006) had greater expression in social versus non-social brain regions; OXT did not (p = 0.14).
- OXTR and CD38 showed high donor-to-donor reproducibility, with differential stability values in the top decile of all 20,737 genes and significant donor-to-donor associations (p < 0.0001). GTEx validation correlated with Allen data for OXTR (rs = 0.81, p = 0.01) and CD38 (rs = 0.67, p = 0.04), but not OXT (rs = 0.22, p = 0.54).
Methods
- Post-mortem mRNA data came from the Allen Human Brain Atlas: six donor brains (three Caucasian males, one Hispanic female, two African-American males; mean age 42.5 ± 11.2 years; mean post-mortem interval 22.3 ± 4.5 hours), sampled at 363–946 locations per brain. Analyses used left-hemisphere samples, 20,737 protein-coding genes, MNI152 nonlinear registration, and 54 AAL atlas regions; voxel-by-voxel maps were created by Delaunay triangulation and linear interpolation.
- Independent validation used GTEx data from 10 brain regions (mean sample size 131.7, range 88–173). Analyses included Spearman correlations, complete-linkage clustering, one-sample t-tests with FDR correction across 54 tests, FUMA hypergeometric enrichment, WGCNA (soft-thresholding power 10, scale-free topology R² = 0.828), and NeuroSynth reverse inference with Spearman correlation and 5,000 permutations via PALM.
- Cognitive state decoding used NeuroSynth release 0.7, extracting text and neuroimaging data from 14,371 fMRI studies; association Z maps were correlated with all 20,737 gene expression maps and ranked.
Limitations
- Stated: the human post-mortem sample was small and variable in age and ethnicity, with possible variability from brain size and morphology; only one female donor limited comprehensive sex-difference analysis; GTEx has fewer brain sampling sites than Allen; OXT expression was less stable donor-to-donor and not significantly related to GTEx, limiting generalizability for OXT; the study cannot show that increased OXTR transcript expression corresponds to receptor activation during specific cognitive states; several gene–psychiatric disorder links are single-report associations requiring replication.
- Evident from the design: the work is correlational and cross-sectional, using post-mortem mRNA maps and meta-analytic fMRI associations, so it cannot establish causal or temporal relationships between oxytocin pathway gene expression, dopaminergic/cholinergic signaling, and cognitive states.
Model-written summary. Check it against the paper before relying on it.
Integrity signals
Registry
Cites
Statistics
Figures
Verification
Claims the paper makes
53 Not checked yet · 36 Own result · 17 Own method · 9 Own interpretation
A result the paper reports from its own data — it cites no other source for it, so there is none to check. The quote shows it is in the paper.
In the paper
“fMRI meta-analysis revealed that the oxytocin pathway gene maps correspond with the processing of anticipatory, appetitive, and aversive cognitive states.”
- Also stated in: § Introduction · hedged
“The results from a large-scale fMRI meta-analysis suggest that oxytocin pathway gene expression maps correspond with the processing of anticipatory, appetitive, and aversive cognitive states.”
- Also stated in: § Cognitive state term correlates · plain
“Decoding cognitive states meta-analytically from voxel-by-voxel mRNA maps (Fig. 6) via quantitative reverse inference revealed that OXTR, CD38, and OXT mRNA expression maps were most highly correlated with functional imaging maps that can be broadly categorized as anticipatory, appetitive, and aversive”
§ Oxytocin pathway gene networks in the human brain > Abstract
plaincorrelational- Asserted: passes — The authors put it forward as true.
- Checkable: passes — It can be checked against evidence.
- Load-bearing: passes — The paper’s conclusions depend on it.
- Based: passes — The paper gives a reason why it holds.
- Rests on an assumption: The six donor brains in the Allen Human Brain Atlas are representative of the general human brain for gene expression mapping.
- Also stated in: § Introduction · hedged
A result the paper reports from its own data — it cites no other source for it, so there is none to check. The quote shows it is in the paper.
In the paper
“Expression of the three selected oxytocin pathway genes was enriched in subcortical and olfactory regions”
- Also stated in: § Introduction · plain
“Expression of critical oxytocin pathway genes are enriched in subcortical and olfactory regions”
- Also stated in: § Discussion · plain
“mRNA reflecting specific genes in the oxytocin pathway are highly expressed in subcortical and temporal brain structures, along with the olfactory region.”
§ Oxytocin pathway gene networks in the human brain > Abstract
plaincorrelational- Asserted: passes — The authors put it forward as true.
- Checkable: passes — It can be checked against evidence.
- Load-bearing: passes — The paper’s conclusions depend on it.
- Based: passes — The paper gives a reason why it holds.
- Rests on an assumption: The six donor brains in the Allen Human Brain Atlas are representative of the general human brain for gene expression mapping.
- Also stated in: § Introduction · plain
A result the paper reports from its own data — it cites no other source for it, so there is none to check. The quote shows it is in the paper.
In the paper
“there was high co-expression with several dopaminergic and muscarinic acetylcholine genes”
- Also stated in: § Introduction · plain
“these genes are highly co-expressed with several dopaminergic and muscarinic acetylcholine genes”
- Also stated in: § Discussion · plain
“OXTR and CD38 showed considerable co-expression with DRD2, DRD5, COMT, CHRM4, and CHRM5 genes”
§ Oxytocin pathway gene networks in the human brain > Abstract
plaincorrelational- Asserted: passes — The authors put it forward as true.
- Checkable: passes — It can be checked against evidence.
- Load-bearing: passes — The paper’s conclusions depend on it.
- Based: passes — The paper gives a reason why it holds.
- Rests on an assumption: The six donor brains in the Allen Human Brain Atlas are representative of the general human brain for gene expression mapping.
- Also stated in: § Introduction · plain
A result the paper reports from its own data — it cites no other source for it, so there is none to check. The quote shows it is in the paper.
In the paper
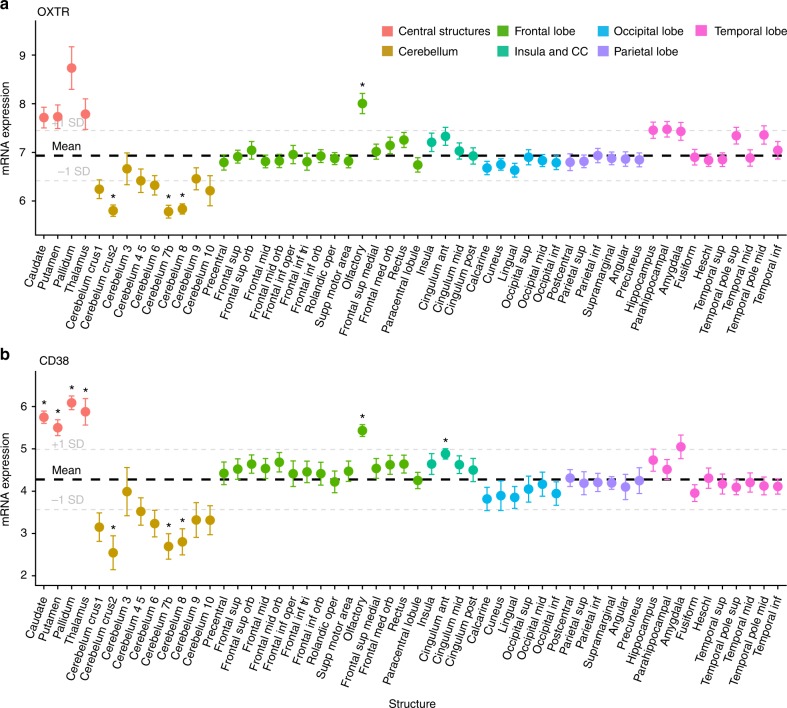
“Compared to average expression across the brain, statistically significant higher expression of OXTR mRNA levels was observed in the olfactory bulbs (p = 0.048, d = 2.1; Supplementary Data 1).”
§ Oxytocin pathway gene networks in the human brain > Results > Region-of-interest gene expression
plain- Asserted: passes — The authors put it forward as true.
- Checkable: passes — It can be checked against evidence.
- Load-bearing: unclear — It is unclear whether the paper’s conclusions depend on it.
- Based: passes — The paper gives a reason why it holds.
A result the paper reports from its own data — it cites no other source for it, so there is none to check. The quote shows it is in the paper.
In the paper
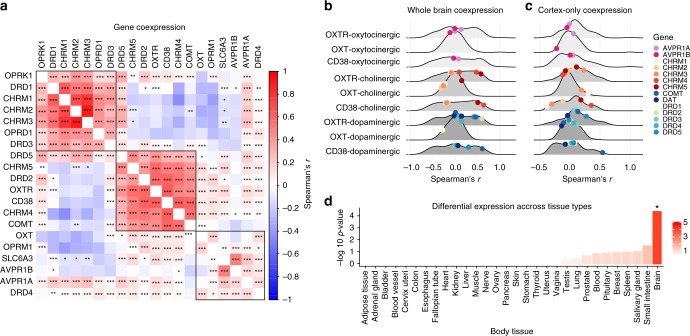
“In both datasets, OXTR, CD38, DRD2, and CHRM4 clustered together (Supplementary Fig. 8).”
§ Oxytocin pathway gene networks in the human brain > Results > Voxel-by-voxel gene expression associations
plaincorrelational- Asserted: passes — The authors put it forward as true.
- Checkable: passes — It can be checked against evidence.
- Load-bearing: passes — The paper’s conclusions depend on it.
- Based: passes — The paper gives a reason why it holds.
A result the paper reports from its own data — it cites no other source for it, so there is none to check. The quote shows it is in the paper.
In the paper
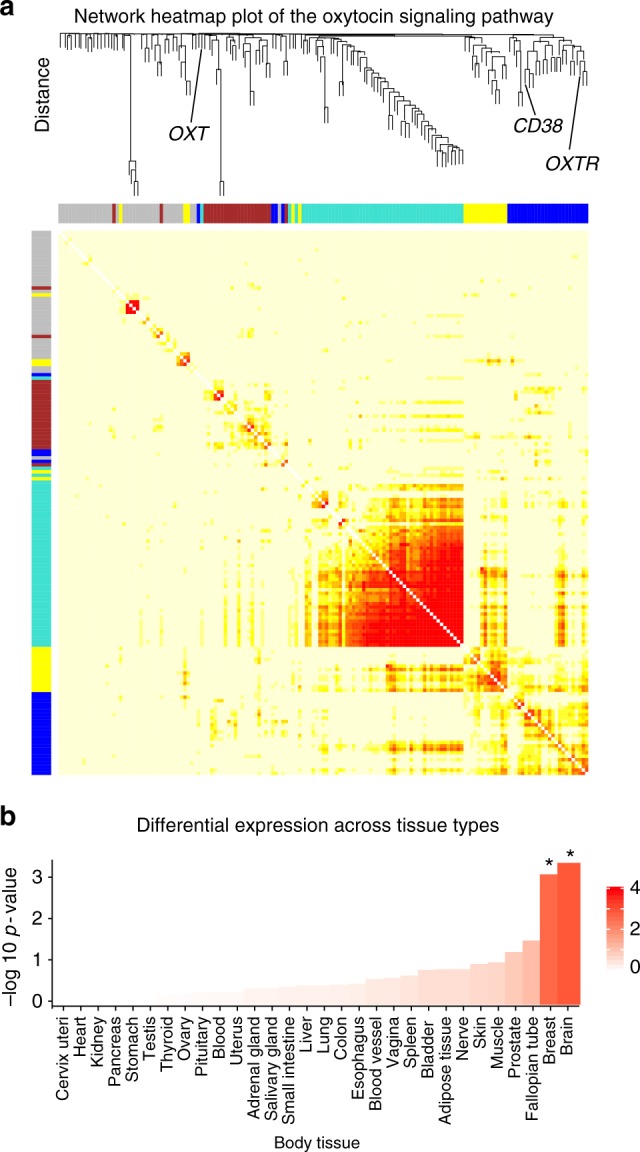
“This OXTR/CD38 module was also enriched in brain and breast tissue (Bonferroni corrected p-value < 0.05; Fig. 4b).”
§ Oxytocin pathway gene networks in the human brain > Results > Voxel-by-voxel gene expression associations
plaincorrelational- Asserted: passes — The authors put it forward as true.
- Checkable: passes — It can be checked against evidence.
- Load-bearing: passes — The paper’s conclusions depend on it.
- Based: passes — The paper gives a reason why it holds.
A result the paper reports from its own data — it cites no other source for it, so there is none to check. The quote shows it is in the paper.
In the paper
“This analysis identified a co-expression module containing both OXTR and CD38, among 28 genes in total (Fig. 4a, Supplementary Data 1; Supplementary Fig. 9).”
§ Oxytocin pathway gene networks in the human brain > Results > Voxel-by-voxel gene expression associations
plaincorrelational- Asserted: passes — The authors put it forward as true.
- Checkable: passes — It can be checked against evidence.
- Load-bearing: passes — The paper’s conclusions depend on it.
- Based: passes — The paper gives a reason why it holds.
A result the paper reports from its own data — it cites no other source for it, so there is none to check. The quote shows it is in the paper.
In the paper
“There were statistically significant relationships between the expression of the genes in this cluster (all FDR adjusted p-values < 0.05).”
§ Oxytocin pathway gene networks in the human brain > Results > Voxel-by-voxel gene expression associations
plaincorrelational- Asserted: passes — The authors put it forward as true.
- Checkable: passes — It can be checked against evidence.
- Load-bearing: passes — The paper’s conclusions depend on it.
- Based: passes — The paper gives a reason why it holds.
In the paper
“This OXTR/CD38 module was also enriched in genesets reported in the Molecular Signatures Database34 that are associated with several behavioral and cognitive state processes including feeding behavior (p = 5.83 × 10⁻³), cognition (p = 7.44 × 10⁻³), and behavioral response to stimuli (p = 1.05 × 10⁻²).”
§ Oxytocin pathway gene networks in the human brain > Results > Voxel-by-voxel gene expression associations
What the sources say
- Not checked yetcites [34] Liberzon, A. et al. Molecular signatures database (MSigDB) 3.0. Bioinformatics 27, 1739–1740 (2011). source
plaincorrelational- Asserted: passes — The authors put it forward as true.
- Checkable: passes — It can be checked against evidence.
- Load-bearing: passes — The paper’s conclusions depend on it.
- Based: passes — The paper gives a reason why it holds.
A result the paper reports from its own data — it cites no other source for it, so there is none to check. The quote shows it is in the paper.
In the paper
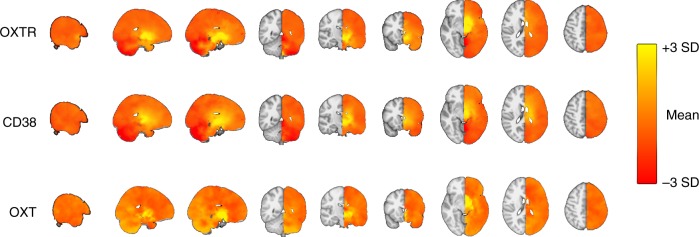
“There were no brain regions with significantly higher than average OXT expression after FDR correction (54 tests; Supplementary Fig. 2).”
§ Oxytocin pathway gene networks in the human brain > Results > Region-of-interest gene expression
plain- Asserted: passes — The authors put it forward as true.
- Checkable: passes — It can be checked against evidence.
- Load-bearing: unclear — It is unclear whether the paper’s conclusions depend on it.
- Based: passes — The paper gives a reason why it holds.
- It may state two separate claims as one. 28
- Probably not a substantial claim. 40
A result the paper reports from its own data — it cites no other source for it, so there is none to check. The quote shows it is in the paper.
In the paper
“There was significantly lower OXTR expression in the cerebral crus II (p = 0.01, d = 4), cerebellum 7b (p = 0.01, d = 3.6), and cerebellum 8 (p = 0.01, d = 4.3; Fig. 1a).”
§ Oxytocin pathway gene networks in the human brain > Results > Region-of-interest gene expression
plain- Asserted: passes — The authors put it forward as true.
- Checkable: passes — It can be checked against evidence.
- Load-bearing: passes — The paper’s conclusions depend on it.
- Based: passes — The paper gives a reason why it holds.
It may state two separate claims as one.
A result the paper reports from its own data — it cites no other source for it, so there is none to check. The quote shows it is in the paper.
In the paper
“Subcortical structures had higher than average expression of OXTR, associated with Cohen’s d values >1, but these did not reach FDR corrected (54 tests) thresholds of statistical significance (Pallidum: p = 0.1, d = 1.7; Caudate: p = 0.12, d = 1.5; Putamen: p = 0.13, d = 1.3; Thalamus, p = 0.18, d = 1.1).”
§ Oxytocin pathway gene networks in the human brain > Results > Region-of-interest gene expression
plaincorrelational- Asserted: passes — The authors put it forward as true.
- Checkable: passes — It can be checked against evidence.
- Load-bearing: unclear — It is unclear whether the paper’s conclusions depend on it.
- Based: passes — The paper gives a reason why it holds.
It may state two separate claims as one.
A result the paper reports from its own data — it cites no other source for it, so there is none to check. The quote shows it is in the paper.
In the paper
“There was lower CD38 expression in the cerebral crus II (p = 0.045, d = 1.8), cerebellum 7b (p = 0.03, d = 2.1), and cerebellum 8 (p = 0.03, d = 1.9).”
§ Oxytocin pathway gene networks in the human brain > Results > Region-of-interest gene expression
plain- Asserted: passes — The authors put it forward as true.
- Checkable: passes — It can be checked against evidence.
- Load-bearing: unclear — It is unclear whether the paper’s conclusions depend on it.
- Based: passes — The paper gives a reason why it holds.
It may state two separate claims as one.
A result the paper reports from its own data — it cites no other source for it, so there is none to check. The quote shows it is in the paper.
In the paper
“CD38 gene expression was statistically significantly higher than average in the caudate (p = 0.004, d = 4.1), pallidum (p = 0.004, d = 4.6), olfactory bulbs (p = 0.01, d = 3.4), putamen (p = 0.02, d = 2.7), thalamus (p = 0.03, d = 2.1), and cingulate anterior (p = 0.03, d = 2; Fig. 1b).”
§ Oxytocin pathway gene networks in the human brain > Results > Region-of-interest gene expression
plain- Asserted: passes — The authors put it forward as true.
- Checkable: passes — It can be checked against evidence.
- Load-bearing: passes — The paper’s conclusions depend on it.
- Based: passes — The paper gives a reason why it holds.
It may state two separate claims as one.
A result the paper reports from its own data — it cites no other source for it, so there is none to check. The quote shows it is in the paper.
In the paper
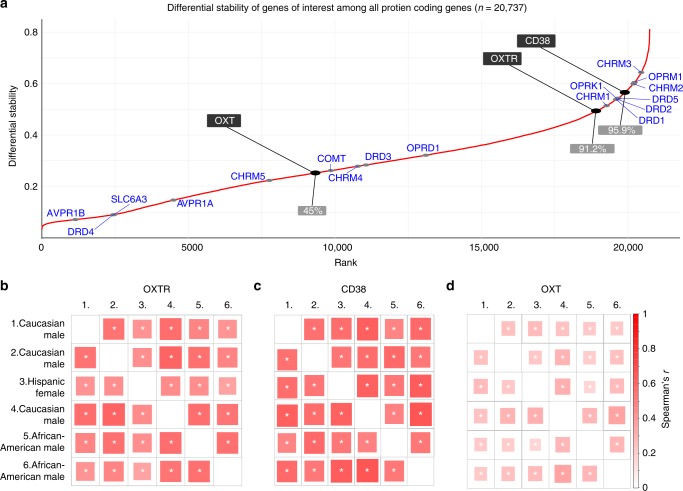
“Hierarchical clustering revealed that oxytocin pathway genes (OXTR, CD38) cluster with some elements of the dopaminergic (DRD2, DRD5, and COMT) and cholinergic (CHRM4, CHRM5) systems, but not all, indicating the relationship between oxytocin pathway genes and dopaminergic/cholinergic gene sets were not globally strong.”
§ Oxytocin pathway gene networks in the human brain > Results > Voxel-by-voxel gene expression associations
hedgedcorrelational- Asserted: passes — The authors put it forward as true.
- Checkable: passes — It can be checked against evidence.
- Load-bearing: passes — The paper’s conclusions depend on it.
- Based: passes — The paper gives a reason why it holds.
It may state two separate claims as one.
A result the paper reports from its own data — it cites no other source for it, so there is none to check. The quote shows it is in the paper.
In the paper
“the top ten most positive correlations with CD38 included NTSR2 (rs = 0.82), C12orf39 (Spexin; rs = 0.81), and GLUD1 (rs = 0.78).”
§ Oxytocin pathway gene networks in the human brain > Results > Voxel-by-voxel gene expression associations
plaincorrelational- Asserted: passes — The authors put it forward as true.
- Checkable: passes — It can be checked against evidence.
- Load-bearing: unclear — It is unclear whether the paper’s conclusions depend on it.
- Based: passes — The paper gives a reason why it holds.
It may state two separate claims as one.
A result the paper reports from its own data — it cites no other source for it, so there is none to check. The quote shows it is in the paper.
In the paper
“The association between OXTR and CD38 was statistically significant (p < 0.0001) and among the top 5% of correlations compared to all 20,737 protein coding genes.”
§ Oxytocin pathway gene networks in the human brain > Results > Voxel-by-voxel gene expression associations
plaincorrelational- Asserted: passes — The authors put it forward as true.
- Checkable: passes — It can be checked against evidence.
- Load-bearing: passes — The paper’s conclusions depend on it.
- Based: passes — The paper gives a reason why it holds.
It may state two separate claims as one.
A result the paper reports from its own data — it cites no other source for it, so there is none to check. The quote shows it is in the paper.
In the paper
“Among the top ten most positive mRNA map correlations for OXTR were Neurotensin Receptor 2 (NTSR2; rs = 0.78), Glutamate dehydrogenase 2 (GLUD2; rs = 0.78), and Glutamate dehydrogenase 1 (GLUD1; rs = 0.77)”
§ Oxytocin pathway gene networks in the human brain > Results > Voxel-by-voxel gene expression associations
plaincorrelational- Asserted: passes — The authors put it forward as true.
- Checkable: passes — It can be checked against evidence.
- Load-bearing: unclear — It is unclear whether the paper’s conclusions depend on it.
- Based: passes — The paper gives a reason why it holds.
It may state two separate claims as one.
A result the paper reports from its own data — it cites no other source for it, so there is none to check. The quote shows it is in the paper.
In the paper
“Additionally, the gene with the 6th strongest association with CD38 was PSAT1 (rs = 0.79), whose disruption has been linked to schizophrenia39.”
§ Oxytocin pathway gene networks in the human brain > Results > Voxel-by-voxel gene expression associations
plaincorrelational- Asserted: passes — The authors put it forward as true.
- Checkable: passes — It can be checked against evidence.
- Load-bearing: fails — The paper’s conclusions may not depend on it.
- Based: passes — The paper gives a reason why it holds.
Probably not a substantial claim. The paper’s conclusions may not depend on it.
A result the paper reports from its own data — it cites no other source for it, so there is none to check. The quote shows it is in the paper.
In the paper
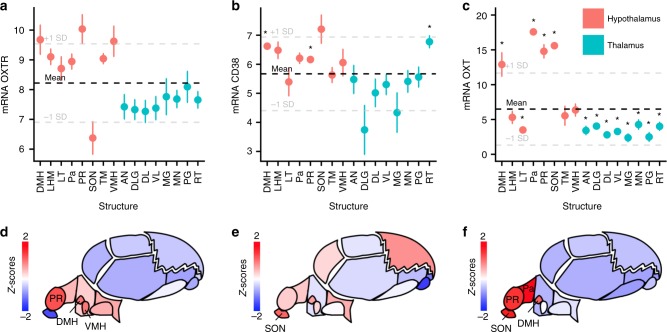
“There was significantly higher expression in the hypothalamic structures compared to the thalamic structures for OXTR (p < 0.001), CD38 (p = 0.002) and OXT (p < 0.001).”
§ Oxytocin pathway gene networks in the human brain > Results > Region-of-interest gene expression
plainn = 6- Asserted: passes — The authors put it forward as true.
- Checkable: passes — It can be checked against evidence.
- Load-bearing: passes — The paper’s conclusions depend on it.
- Based: passes — The paper gives a reason why it holds.
It may state two separate claims as one.
A result the paper reports from its own data — it cites no other source for it, so there is none to check. The quote shows it is in the paper.
In the paper
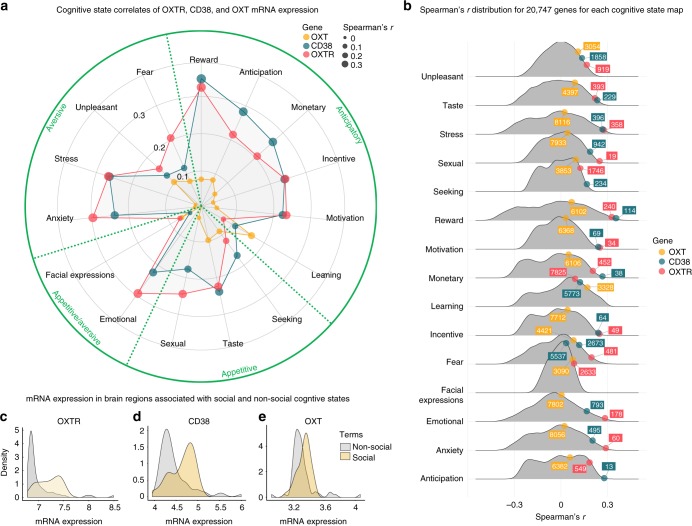
“Additionally, OXTR (p = 0.0002; Fig. 7c) and CD38 (p = 0.006; Fig. 7d), had significantly greater mRNA expression in brain regions associated with social behavior compared to brain regions associated with non-social cognitive states (Supplementary Data 1).”
§ Oxytocin pathway gene networks in the human brain > Results > Cognitive state term correlates
plaincorrelational- Asserted: passes — The authors put it forward as true.
- Checkable: passes — It can be checked against evidence.
- Load-bearing: passes — The paper’s conclusions depend on it.
- Based: passes — The paper gives a reason why it holds.
It may state two separate claims as one.
A result the paper reports from its own data — it cites no other source for it, so there is none to check. The quote shows it is in the paper.
In the paper
“The “taste”, “stress”, “reward”, “monetary”, “fear”, and “emotional” cognitive state maps were within the top 2.5% of all associations with OXTR expression and also statistically significant (p < 0.001; Fig. 7b; Supplementary Table 2).”
§ Oxytocin pathway gene networks in the human brain > Results > Cognitive state term correlates
plaincorrelational- Asserted: passes — The authors put it forward as true.
- Checkable: passes — It can be checked against evidence.
- Load-bearing: passes — The paper’s conclusions depend on it.
- Based: passes — The paper gives a reason why it holds.
It may state two separate claims as one.
A result the paper reports from its own data — it cites no other source for it, so there is none to check. The quote shows it is in the paper.
In the paper
“Notably, the OXTR map’s relationship with the cognitive state maps of “sexual”, “motivation”, “incentive”, and “anxiety” were all ranked among the top 0.5% strongest associations out of 20,737 genes and were statistically significant (p < 0.001; Fig. 7b; Supplementary Table 2)”
§ Oxytocin pathway gene networks in the human brain > Results > Cognitive state term correlates
plaincorrelational- Asserted: passes — The authors put it forward as true.
- Checkable: passes — It can be checked against evidence.
- Load-bearing: passes — The paper’s conclusions depend on it.
- Based: passes — The paper gives a reason why it holds.
It may state two separate claims as one.
In the paper
“Specifically, CD38 is involved in oxytocin secretion via Ca2+ release15”
§ Oxytocin pathway gene networks in the human brain > Introduction
What the sources say
- Not checked yetcites [15] Jin, D. et al. CD38 is critical for social behaviour by regulating oxytocin secretion. Nature 446, 41–45 (2007). source
plaindirect- Asserted: passes — The authors put it forward as true.
- Checkable: passes — It can be checked against evidence.
- Load-bearing: fails — The paper’s conclusions may not depend on it.
- Based: passes — The paper gives a reason why it holds.
Probably not a substantial claim. The paper’s conclusions may not depend on it.
None of the sources cited for this claim have been checked yet.
In the paper
“The interactions with the oxytocin system extend beyond the opioid pathway, including the dopaminergic17,18 and muscarinic acetylcholine12,19 circuits, with possible implications for social behavior and psychiatric disorders.”
§ Oxytocin pathway gene networks in the human brain > Introduction
What the sources say
- Not checked yetcites [17] Love, T. M. Oxytocin, motivation and the role of dopamine. Pharmacol. Biochem. Behav. 119, 49–60 (2014). source
- Not checked yetcites [18] Ebstein, R. P., Israel, S., Chew, S. H., Zhong, S. & Knafo, A. Genetics of human social behavior. Neuron 65, 831–844 (2010). source
- Not checked yetcites [12] Loup, F., Tribollet, E., Dubois-Dauphin, M. & Dreifuss, J. Localization of high-affinity binding sites for oxytocin and vasopressin in the human brain. An autoradiographic study. Brain Res 555, 220–232 (1991). source
- Not checked yetcites [19] Freeman, S. M. & Young, L. J. Comparative perspectives on oxytocin and vasopressin receptor research in rodents and primates: translational implications. J. Neuroendocrinol. 28, https://doi.org/10.1111/jne.12382 (2016). source
hedgedcorrelational- Asserted: passes — The authors put it forward as true.
- Checkable: passes — It can be checked against evidence.
- Load-bearing: passes — The paper’s conclusions depend on it.
- Based: passes — The paper gives a reason why it holds.
It may state two separate claims as one.
None of the sources cited for this claim have been checked yet.
In the paper
“While OXTR mRNA localization in the rodent brain is well-described11, its anatomical distribution across the human brain is poorly understood, as investigations have historically tended to sample very few brain regions12.”
§ Oxytocin pathway gene networks in the human brain > Introduction
What the sources say
- Not checked yetcites [11] Insel, T. R. & Shapiro, L. E. Oxytocin receptor distribution reflects social organization in monogamous and polygamous voles. Proc. Natl Acad. Sci. USA 89, 5981–5985 (1992). source
- Not checked yetcites [12] Loup, F., Tribollet, E., Dubois-Dauphin, M. & Dreifuss, J. Localization of high-affinity binding sites for oxytocin and vasopressin in the human brain. An autoradiographic study. Brain Res 555, 220–232 (1991). source
plain- Asserted: passes — The authors put it forward as true.
- Checkable: passes — It can be checked against evidence.
- Load-bearing: passes — The paper’s conclusions depend on it.
- Based: passes — The paper gives a reason why it holds.
It may state two separate claims as one.
In the paper
“oxytocin-neurophysin I (OXT) encodes the oxytocin prepropeptide containing the nonapeptide oxytocin and the carrier protein neurophysin-I16.”
§ Oxytocin pathway gene networks in the human brain > Introduction
What the sources say
- Not checked yetcites [16] Sausville, E., Carney, D. & Battey, J. The human vasopressin gene is linked to the oxytocin gene and is selectively expressed in a cultured lung cancer cell line. J. Biol. Chem. 260, 10236–10241 (1985). source
plain- Asserted: passes — The authors put it forward as true.
- Checkable: passes — It can be checked against evidence.
- Load-bearing: fails — The paper’s conclusions may not depend on it.
- Based: passes — The paper gives a reason why it holds.
Probably not a substantial claim. The paper’s conclusions may not depend on it.
In the paper
“OXT mRNA has been shown to be highly expressed in human paraventricular nucleus of the hypothalamus, the lateral hypothalamic area, and the supraoptic nucleus, and there is evidence of co-expression with OXTR mRNA and the μ and κ types opioid receptor mRNA13”
§ Oxytocin pathway gene networks in the human brain > Introduction
What the sources say
- Not checked yetcites [13] Dal Monte, O. et al. Oxytocin under opioid antagonism leads to supralinear enhancement of social attention. Proc. Natl Acad. Sci. USA 114, 5247–5252 (2017). source
plaincorrelational- Asserted: passes — The authors put it forward as true.
- Checkable: passes — It can be checked against evidence.
- Load-bearing: unclear — It is unclear whether the paper’s conclusions depend on it.
- Based: passes — The paper gives a reason why it holds.
It may state two separate claims as one.
None of the sources cited for this claim have been checked yet.
In the paper
“While more recent work has exclusively examined whole-brain distribution of OXTR genes against a limited set of genes13 and overexpression in broad functional brain networks (e.g., limbic network)14, researchers have yet to explore OXTR’s associations with all protein-coding genes or with gene expression patterns associated with specific cognitive states.”
§ Oxytocin pathway gene networks in the human brain > Introduction
What the sources say
- Not checked yetcites [13] Dal Monte, O. et al. Oxytocin under opioid antagonism leads to supralinear enhancement of social attention. Proc. Natl Acad. Sci. USA 114, 5247–5252 (2017). source
- Not checked yetcites [14] Anderson, K. M. et al. Gene expression links functional networks across cortex and striatum. Nat. Commun. 9, 1428 (2018). source
plain- Asserted: passes — The authors put it forward as true.
- Checkable: passes — It can be checked against evidence.
- Load-bearing: passes — The paper’s conclusions depend on it.
- Based: passes — The paper gives a reason why it holds.
It may state two separate claims as one.
A conclusion the paper draws from its own results — it cites no other source for it, so there is none to check. The quote shows it is in the paper.
In the paper
“suggesting a correspondence between the spatial distribution of OXTR mRNA, its functional neuroanatomy, and behavioral relevance.”
§ Oxytocin pathway gene networks in the human brain > Introduction
hedgedcorrelational- Asserted: passes — The authors put it forward as true.
- Checkable: passes — It can be checked against evidence.
- Load-bearing: passes — The paper’s conclusions depend on it.
- Based: passes — The paper gives a reason why it holds.
Probably not a substantial claim. It may state two separate claims as one.
None of the sources cited for this claim have been checked yet.
In the paper
“the muscarinic acetylcholine M4 receptor (CHRM4) has been associated with schizophrenia22 and implicated in cognitive flexibility23 and dopamine release24.”
§ Oxytocin pathway gene networks in the human brain > Introduction
What the sources say
- Not checked yetcites [22] Scarr, E., Sundram, S., Keriakous, D. & Dean, B. Altered hippocampal muscarinic M4, but not M1, receptor expression from subjects with schizophrenia. Biol. Psychiatry 61, 1161–1170 (2007). source
- Not checked yetcites [23] Okada, K. et al. Enhanced flexibility of place discrimination learning by targeting striatal cholinergic interneurons. Nat. Commun. 5, 3778 (2014). source
- Not checked yetcites [24] Grilli, M. et al. Release-enhancing pre-synaptic muscarinic and nicotinic receptors co-exist and interact on dopaminergic nerve endings of rat nucleus accumbens. J. Neurochem. 105, 2205–2213 (2008). source
plaincorrelational- Asserted: passes — The authors put it forward as true.
- Checkable: passes — It can be checked against evidence.
- Load-bearing: fails — The paper’s conclusions may not depend on it.
- Based: passes — The paper gives a reason why it holds.
Probably not a substantial claim. The paper’s conclusions may not depend on it. It may state two separate claims as one.
In the paper
“For instance, commonly observed increases in medial and lateral frontal region activity during emotion and pain processing seem to be better explained by more general sustained attention processes27.”
§ Oxytocin pathway gene networks in the human brain > Introduction
What the sources say
- Not checked yetcites [27] Yarkoni, T., Poldrack, R. A., Nichols, T. E., Van Essen, D. C. & Wager, T. D. Large-scale automated synthesis of human functional neuroimaging data. Nat. Methods 8, 665 (2011). source
hedgeddirect- Asserted: passes — The authors put it forward as true.
- Checkable: passes — It can be checked against evidence.
- Load-bearing: passes — The paper’s conclusions depend on it.
- Based: passes — The paper gives a reason why it holds.
Probably not a substantial claim.
None of the sources cited for this claim have been checked yet.
In the paper
“the dopamine D2-receptor subtype (DRD2), has been implicated in various putative intermediate phenotypes in psychiatric illness, including motivational processing20 and pair bonding in animal models21.”
§ Oxytocin pathway gene networks in the human brain > Introduction
What the sources say
- Not checked yetcites [20] Noble, E. P. D2 dopamine receptor gene in psychiatric and neurologic disorders and its phenotypes. Am. J. Med. Genet. B Neuropsychiatr. Genet. 116, 103–125 (2003). source
- Not checked yetcites [21] Aragona, B. J. et al. Nucleus accumbens dopamine differentially mediates the formation and maintenance of monogamous pair bonds. Nat. Neurosci. 9, 133–139 (2006). source
plaincorrelational- Asserted: passes — The authors put it forward as true.
- Checkable: passes — It can be checked against evidence.
- Load-bearing: fails — The paper’s conclusions may not depend on it.
- Based: passes — The paper gives a reason why it holds.
Probably not a substantial claim. The paper’s conclusions may not depend on it. It may state two separate claims as one.
None of the sources cited for this claim have been checked yet.
In the paper
“Finally, oxytocin can also bind to AVPR1A receptors25, which have also been linked to social functioning26.”
§ Oxytocin pathway gene networks in the human brain > Introduction
What the sources say
- Not checked yetcites [25] Cho, M. M., DeVries, A. C., Williams, J. R. & Carter, C. S. The effects of oxytocin and vasopressin on partner preferences in male and female prairie voles (Microtus ochrogaster). Behav. Neurosci. 113, 1071–1079 (1999). source
- Not checked yetcites [26] Bielsky, I. F., Hu, S.-B., Szegda, K. L., Westphal, H. & Young, L. J. Profound impairment in social recognition and reduction in anxiety-like behavior in vasopressin V1a receptor knockout mice. Neuropsychopharmacology 29, 483 (2004). source
plaincorrelational- Asserted: passes — The authors put it forward as true.
- Checkable: passes — It can be checked against evidence.
- Load-bearing: fails — The paper’s conclusions may not depend on it.
- Based: passes — The paper gives a reason why it holds.
Probably not a substantial claim. The paper’s conclusions may not depend on it. It may state two separate claims as one.
None of the sources cited for this claim have been checked yet.
In the paper
“While brain regions with high oxytocin pathway gene expression in humans have been identified12,13, inference of specific cognitive states from the activity of single brain regions is elusive.”
§ Oxytocin pathway gene networks in the human brain > Introduction
What the sources say
- Not checked yetcites [12] Loup, F., Tribollet, E., Dubois-Dauphin, M. & Dreifuss, J. Localization of high-affinity binding sites for oxytocin and vasopressin in the human brain. An autoradiographic study. Brain Res 555, 220–232 (1991). source
- Not checked yetcites [13] Dal Monte, O. et al. Oxytocin under opioid antagonism leads to supralinear enhancement of social attention. Proc. Natl Acad. Sci. USA 114, 5247–5252 (2017). source
plain- Asserted: passes — The authors put it forward as true.
- Checkable: passes — It can be checked against evidence.
- Load-bearing: passes — The paper’s conclusions depend on it.
- Based: passes — The paper gives a reason why it holds.
It may state two separate claims as one.
In the paper
“The NeuroSynth framework27 has extracted text and neuroimaging data from 14,371 fMRI studies (release 0.7).”
§ Oxytocin pathway gene networks in the human brain > Results > Cognitive state term correlates
What the sources say
- Not checked yetcites [27] Yarkoni, T., Poldrack, R. A., Nichols, T. E., Van Essen, D. C. & Wager, T. D. Large-scale automated synthesis of human functional neuroimaging data. Nat. Methods 8, 665 (2011). source
plain- Asserted: passes — The authors put it forward as true.
- Checkable: passes — It can be checked against evidence.
- Load-bearing: fails — The paper’s conclusions may not depend on it.
- Based: passes — The paper gives a reason why it holds.
Probably not a substantial claim. The paper’s conclusions may not depend on it.
What the paper did — it cites no source for this, so there is none to check. The quote shows it is in the paper.
In the paper
“We found that both OXTR and CD38 had differential stability values in the top decile of all 20,737 protein coding genes in the dataset (Fig. 5a), indicating that gene expression patterning is reproducible, regardless of individual differences, such as ethnicity and sex.”
§ Oxytocin pathway gene networks in the human brain > Results > Donor-to-donor reproducibility of gene expression patterns
hedgedn = 6- Asserted: passes — The authors put it forward as true.
- Checkable: passes — It can be checked against evidence.
- Load-bearing: passes — The paper’s conclusions depend on it.
- Based: passes — The paper gives a reason why it holds.
It may state two separate claims as one.
In the paper
“NTSR2, which has been found to regulate ethanol consumption in mice35”
§ Oxytocin pathway gene networks in the human brain > Discussion
What the sources say
- Not checked yetcites [35] Lee, M. R., Hinton, D. J., Unal, S. S., Richelson, E. & Choi, D. S. Increased ethanol consumption and preference in mice lacking neurotensin receptor type 2. Alcohol. Clin. Exp. Res. 35, 99–107 (2011). source
plaindirect- Asserted: passes — The authors put it forward as true.
- Checkable: passes — It can be checked against evidence.
- Load-bearing: fails — The paper’s conclusions may not depend on it.
- Based: passes — The paper gives a reason why it holds.
Probably not a substantial claim. The paper’s conclusions may not depend on it.
A conclusion the paper draws from its own results — it cites no other source for it, so there is none to check. The quote shows it is in the paper.
In the paper
“OXT expression did not demonstrate strong whole-brain correspondence with OXTR and CD38 expression, which was likely due to OXT transcripts only showing a strong presence in oxytocin producing cells within hypothalamic regions.”
§ Oxytocin pathway gene networks in the human brain > Discussion
hedged- Asserted: passes — The authors put it forward as true.
- Checkable: passes — It can be checked against evidence.
- Load-bearing: passes — The paper’s conclusions depend on it.
- Based: passes — The paper gives a reason why it holds.
It may state two separate claims as one.
A conclusion the paper draws from its own results — it cites no other source for it, so there is none to check. The quote shows it is in the paper.
In the paper
“OXTR and CD38 showed considerable co-expression with DRD2, DRD5, COMT, CHRM4, and CHRM5 genes, providing evidence for putative interactions between dopaminergic and muscarinic acetylcholine systems with oxytocin pathway signaling.”
§ Oxytocin pathway gene networks in the human brain > Discussion
hedgedcorrelational- Asserted: passes — The authors put it forward as true.
- Checkable: passes — It can be checked against evidence.
- Load-bearing: unclear — It is unclear whether the paper’s conclusions depend on it.
- Based: passes — The paper gives a reason why it holds.
It may state two separate claims as one.
- Rests on an assumption: Co-expression of genes across brain regions reflects functional interaction between their signaling systems.
None of the sources cited for this claim have been checked yet.
In the paper
“GLUD1 and GLUD2, which are involved in energy homeostasis36,37.”
§ Oxytocin pathway gene networks in the human brain > Discussion
What the sources say
- Not checked yetcites [36] Karaca, M. et al. GDH-dependent glutamate oxidation in the brain dictates peripheral energy substrate distribution. Cell Rep. 13, 365–375 (2015). source
- Not checked yetcites [37] Shashidharan, P. & Plaitakis, A. The discovery of human of GLUD2 glutamate dehydrogenase and its implications for cell function in health and disease. Neurochem. Res. 39, 460–470 (2014). source
plaincorrelational- Asserted: passes — The authors put it forward as true.
- Checkable: passes — It can be checked against evidence.
- Load-bearing: fails — The paper’s conclusions may not depend on it.
- Based: passes — The paper gives a reason why it holds.
Probably not a substantial claim. The paper’s conclusions may not depend on it.
In the paper
“whose disruption has been linked to schizophrenia39.”
§ Oxytocin pathway gene networks in the human brain > Results > Voxel-by-voxel gene expression associations
What the sources say
- Not checked yetcites [39] Ozeki, Y. et al. A novel balanced chromosomal translocation found in subjects with schizophrenia and schizotypal personality disorder: altered l-serine level associated with disruption of PSAT1 gene expression. Neurosci. Res. 69, 154–160 (2011). source
plaincorrelational- Asserted: passes — The authors put it forward as true.
- Checkable: passes — It can be checked against evidence.
- Load-bearing: fails — The paper’s conclusions may not depend on it.
- Based: passes — The paper gives a reason why it holds.
Probably not a substantial claim. The paper’s conclusions may not depend on it.
In the paper
“C12orf39 (Spexin), with the latter associated with weight regulation38.”
§ Oxytocin pathway gene networks in the human brain > Discussion
What the sources say
- Not checked yetcites [38] Walewski, J. L. et al. Spexin is a novel human peptide that reduces adipocyte uptake of long chain fatty acids and causes weight loss in rodents with diet-induced obesity. Obesity 22, 1643–1652 (2014). source
plaincorrelational- Asserted: passes — The authors put it forward as true.
- Checkable: passes — It can be checked against evidence.
- Load-bearing: fails — The paper’s conclusions may not depend on it.
- Based: passes — The paper gives a reason why it holds.
Probably not a substantial claim. The paper’s conclusions may not depend on it.
None of the sources cited for this claim have been checked yet.
In the paper
“Notably, research indicates that intranasal oxytocin administration improves appetite regulation in humans47,48.”
§ Oxytocin pathway gene networks in the human brain > Discussion
What the sources say
hedgeddirect- Asserted: passes — The authors put it forward as true.
- Checkable: passes — It can be checked against evidence.
- Load-bearing: fails — The paper’s conclusions may not depend on it.
- Based: passes — The paper gives a reason why it holds.
Probably not a substantial claim. The paper’s conclusions may not depend on it.
In the paper
“Emerging evidence also points to the oxytocin system’s role in energy metabolism, with relevance for metabolic functions5.”
§ Oxytocin pathway gene networks in the human brain > Introduction
What the sources say
- Not checked yetcites [5] Quintana, D. S., Dieset, I., Elvsåshagen, T., Westlye, L. T. & Andreassen, O. A. Oxytocin system dysfunction as a common mechanism underlying metabolic syndrome and psychiatric symptoms in schizophrenia and bipolar disorders. Front. Neuroendocrinol. 45, 1-–10 (2017). source
hedgedcorrelational- Asserted: passes — The authors put it forward as true.
- Checkable: passes — It can be checked against evidence.
- Load-bearing: fails — The paper’s conclusions may not depend on it.
- Based: passes — The paper gives a reason why it holds.
Probably not a substantial claim. The paper’s conclusions may not depend on it.
None of the sources cited for this claim have been checked yet.
In the paper
“Research on humans has shown beneficial effects of intranasal oxytocin on performance on tests assessing social cognition2 and gaze to the eye region3.”
§ Oxytocin pathway gene networks in the human brain > Introduction
What the sources say
- Not checked yetcites [2] Domes, G., Heinrichs, M., Michel, A., Berger, C. & Herpertz, S. C. Oxytocin improves “mind-reading” in humans. Biol. Psychiatry 61, 731–733 (2007). source
- Not checked yetcites [3] Guastella, A. J., Mitchell, P. B. & Dadds, M. R. Oxytocin increases gaze to the eye region of human faces. Biol. Psychiatry 63, 3–5 (2008). source
plaindirect- Asserted: passes — The authors put it forward as true.
- Checkable: passes — It can be checked against evidence.
- Load-bearing: fails — The paper’s conclusions may not depend on it.
- Based: passes — The paper gives a reason why it holds.
Probably not a substantial claim. The paper’s conclusions may not depend on it. It may state two separate claims as one.
In the paper
“single nucleotide polymorphisms in oxytocin pathway genes have been associated with social behavior and psychiatric disorders4.”
§ Oxytocin pathway gene networks in the human brain > Introduction
What the sources say
- Not checked yetcites [4] Feldman, R., Monakhov, M., Pratt, M. & Ebstein, R. P. Oxytocin pathway genes: evolutionary ancient system impacting on human affiliation, sociality, and psychopathology. Biol. Psychiatry 79, 174–184 (2016). source
plaincorrelational- Asserted: passes — The authors put it forward as true.
- Checkable: passes — It can be checked against evidence.
- Load-bearing: fails — The paper’s conclusions may not depend on it.
- Based: passes — The paper gives a reason why it holds.
Probably not a substantial claim. The paper’s conclusions may not depend on it.
None of the sources cited for this claim have been checked yet.
In the paper
“PAK7 and GABRD which have been associated with schizophrenia49–52.”
§ Oxytocin pathway gene networks in the human brain > Discussion
What the sources say
- Not checked yetcites [49] Morris, D. W. et al. An inherited duplication at the gene p21 Protein-Activated Kinase 7 (PAK7) is a risk factor for psychosis. Hum. Mol. Genet. 23, 3316–3326 (2014). source
- Not checked yetcites [50] Budel, S. et al. Genetic variants of Nogo-66 receptor with possible association to schizophrenia block myelin inhibition of axon growth. J. Neurosci. 28, 13161–13172 (2008). source
- Not checked yetcites [51] Consortium, I. S. Rare chromosomal deletions and duplications increase risk of schizophrenia. Nature 455, 237 (2008). source
- Not checked yetcites [52] Vawter, M. P. et al. Microarray analysis of gene expression in the prefrontal cortex in schizophrenia: a preliminary study. Schizophr. Res. 58, 11–20 (2002). source
plaincorrelational- Asserted: passes — The authors put it forward as true.
- Checkable: passes — It can be checked against evidence.
- Load-bearing: fails — The paper’s conclusions may not depend on it.
- Based: passes — The paper gives a reason why it holds.
Probably not a substantial claim. The paper’s conclusions may not depend on it.
In the paper
“In these animals, oxytocin receptors are located in regions that are crucial for social behavior and the processing of social cues11.”
§ Oxytocin pathway gene networks in the human brain > Discussion
What the sources say
- Not checked yetcites [11] Insel, T. R. & Shapiro, L. E. Oxytocin receptor distribution reflects social organization in monogamous and polygamous voles. Proc. Natl Acad. Sci. USA 89, 5981–5985 (1992). source
plaincorrelational- Asserted: passes — The authors put it forward as true.
- Checkable: passes — It can be checked against evidence.
- Load-bearing: fails — The paper’s conclusions may not depend on it.
- Based: passes — The paper gives a reason why it holds.
Probably not a substantial claim. The paper’s conclusions may not depend on it.
A conclusion the paper draws from its own results — it cites no other source for it, so there is none to check. The quote shows it is in the paper.
In the paper
“While these studies suggest intriguing links between specific genes and psychiatric illnesses, it is important to note that these are largely single report associations that require replication in independent samples.”
§ Oxytocin pathway gene networks in the human brain > Discussion
plaincorrelational- Asserted: passes — The authors put it forward as true.
- Checkable: passes — It can be checked against evidence.
- Load-bearing: fails — The paper’s conclusions may not depend on it.
- Based: passes — The paper gives a reason why it holds.
Probably not a substantial claim. The paper’s conclusions may not depend on it.
In the paper
“PSAT1, a gene that has been associated with schizophrenia39.”
§ Oxytocin pathway gene networks in the human brain > Discussion
What the sources say
- Not checked yetcites [39] Ozeki, Y. et al. A novel balanced chromosomal translocation found in subjects with schizophrenia and schizotypal personality disorder: altered l-serine level associated with disruption of PSAT1 gene expression. Neurosci. Res. 69, 154–160 (2011). source
plaincorrelational- Asserted: passes — The authors put it forward as true.
- Checkable: passes — It can be checked against evidence.
- Load-bearing: fails — The paper’s conclusions may not depend on it.
- Based: passes — The paper gives a reason why it holds.
Probably not a substantial claim. The paper’s conclusions may not depend on it.
In the paper
“reported deficits in dopaminergic signaling in schizophrenia60”
§ Oxytocin pathway gene networks in the human brain > Discussion
What the sources say
- Not checked yetcites [60] Stopper, C. M. & Floresco, S. B. Dopaminergic circuitry and risk/reward decision making: implications for schizophrenia. Schizophr. Bull. 41, 9–14 (2015). source
hedged- Asserted: passes — The authors put it forward as true.
- Checkable: passes — It can be checked against evidence.
- Load-bearing: fails — The paper’s conclusions may not depend on it.
- Based: passes — The paper gives a reason why it holds.
Probably not a substantial claim. The paper’s conclusions may not depend on it.
In the paper
“This is also congruous with reported deficits in dopaminergic signaling in schizophrenia60 and autism61.”
§ Oxytocin pathway gene networks in the human brain > Discussion
What the sources say
- Not checked yetcites [61] Hettinger, J. A. et al. DRD2 and PPP1R1B (DARPP-32) polymorphisms independently confer increased risk for autism spectrum disorders and additively predict affected status in male-only affected sib-pair families. Behav. Brain Funct. 8, 19 (2012). source
plain- Asserted: passes — The authors put it forward as true.
- Checkable: passes — It can be checked against evidence.
- Load-bearing: fails — The paper’s conclusions may not depend on it.
- Based: passes — The paper gives a reason why it holds.
Probably not a substantial claim. The paper’s conclusions may not depend on it.
In the paper
“the muscarinic acetylcholine system is thought to contribute to the cognitive dysfunction observed in schizophrenia64”
§ Oxytocin pathway gene networks in the human brain > Discussion
What the sources say
- Not checked yetcites [64] Carruthers, S. P., Gurvich, C. T. & Rossell, S. L. The muscarinic system, cognition and schizophrenia. Neurosci. Biobehav. Rev. 55, 393–402 (2015). source
hedgedconditional- Asserted: passes — The authors put it forward as true.
- Checkable: passes — It can be checked against evidence.
- Load-bearing: fails — The paper’s conclusions may not depend on it.
- Based: passes — The paper gives a reason why it holds.
Probably not a substantial claim. The paper’s conclusions may not depend on it.
In the paper
“and to assist with the release of oxytocin63”
§ Oxytocin pathway gene networks in the human brain > Discussion
What the sources say
- Not checked yetcites [63] Jankowski, M. et al. Oxytocin and its receptors are synthesized in the rat vasculature. Proc. Natl Acad. Sci. USA 97, 6207–6211 (2000). source
plainconditional- Asserted: passes — The authors put it forward as true.
- Checkable: passes — It can be checked against evidence.
- Load-bearing: fails — The paper’s conclusions may not depend on it.
- Based: passes — The paper gives a reason why it holds.
Probably not a substantial claim. The paper’s conclusions may not depend on it.
In the paper
“The muscarinic acetylcholine system may also work with the oxytocin system to boost attention62”
§ Oxytocin pathway gene networks in the human brain > Discussion
What the sources say
- Not checked yetcites [62] Demeter, E. & Sarter, M. Leveraging the cortical cholinergic system to enhance attention. Neuropharmacology 64, 294–304 (2013). source
hedgedconditional- Asserted: passes — The authors put it forward as true.
- Checkable: passes — It can be checked against evidence.
- Load-bearing: fails — The paper’s conclusions may not depend on it.
- Based: passes — The paper gives a reason why it holds.
Probably not a substantial claim. The paper’s conclusions may not depend on it.
In the paper
“central D2 receptors modulate social functioning in prairie voles57”
§ Oxytocin pathway gene networks in the human brain > Discussion
What the sources say
- Not checked yetcites [57] Gingrich, B., Liu, Y., Cascio, C., Wang, Z. & Insel, T. R. Dopamine D2 receptors in the nucleus accumbens are important for social attachment in female prairie voles (Microtus ochrogaster). Behav. Neurosci. 114, 173 (2000). source
plaindirect- Asserted: passes — The authors put it forward as true.
- Checkable: passes — It can be checked against evidence.
- Load-bearing: fails — The paper’s conclusions may not depend on it.
- Based: passes — The paper gives a reason why it holds.
Probably not a substantial claim. The paper’s conclusions may not depend on it.
In the paper
“The oxytocin and dopaminergic systems have been shown to work in concert to promote rodent maternal behaviors56”
§ Oxytocin pathway gene networks in the human brain > Discussion
What the sources say
- Not checked yetcites [56] Pedersen, C. A., Caldwell, J. D., Walker, C., Ayers, G. & Mason, G. A. Oxytocin activates the postpartum onset of rat maternal behavior in the ventral tegmental and medial preoptic areas. Behav. Neurosci. 108, 1163 (1994). source
boosteddirect- Asserted: passes — The authors put it forward as true.
- Checkable: passes — It can be checked against evidence.
- Load-bearing: fails — The paper’s conclusions may not depend on it.
- Based: passes — The paper gives a reason why it holds.
Probably not a substantial claim. The paper’s conclusions may not depend on it.
A conclusion the paper draws from its own results — it cites no other source for it, so there is none to check. The quote shows it is in the paper.
In the paper
“Increased mRNA in the human olfactory region may be vestigial, as olfaction is not as important for human conspecific identification compared to most other mammals due to species specialization”
§ Oxytocin pathway gene networks in the human brain > Discussion
hedged- Asserted: passes — The authors put it forward as true.
- Checkable: fails — It may be too vague to check against evidence.
- Load-bearing: fails — The paper’s conclusions may not depend on it.
- Based: passes — The paper gives a reason why it holds.
Probably not a substantial claim. It may be too vague to check against evidence. The paper’s conclusions may not depend on it.
- Rests on an assumption: Olfaction is not as important for human conspecific identification compared to most other mammals due to species specialization.
What the paper did — it cites no source for this, so there is none to check. The quote shows it is in the paper.
In the paper
“These issues, along with individual differences in brain sizes and morphological features, may have introduced variability in sampling.”
§ Oxytocin pathway gene networks in the human brain > Discussion
hedgedconditional- Asserted: passes — The authors put it forward as true.
- Checkable: passes — It can be checked against evidence.
- Load-bearing: fails — The paper’s conclusions may not depend on it.
- Based: passes — The paper gives a reason why it holds.
Probably not a substantial claim. The paper’s conclusions may not depend on it.
In the paper
“intranasal oxytocin has been shown to improve olfactory detection performance in schizophrenia68”
§ Oxytocin pathway gene networks in the human brain > Discussion
What the sources say
- Not checked yetcites [68] Lee, M. R. et al. Effects of adjunctive intranasal oxytocin on olfactory identification and clinical symptoms in schizophrenia: results from a randomized double blind placebo controlled pilot study. Schizophr. Res. 145, 110–115 (2013). source
plaindirect- Asserted: passes — The authors put it forward as true.
- Checkable: passes — It can be checked against evidence.
- Load-bearing: fails — The paper’s conclusions may not depend on it.
- Based: passes — The paper gives a reason why it holds.
Probably not a substantial claim. The paper’s conclusions may not depend on it.
What the paper did — it cites no source for this, so there is none to check. The quote shows it is in the paper.
In the paper
“the sample size was small and the donor group was variable in regards to age and ethnicity.”
§ Oxytocin pathway gene networks in the human brain > Discussion
plain- Asserted: passes — The authors put it forward as true.
- Checkable: passes — It can be checked against evidence.
- Load-bearing: unclear — It is unclear whether the paper’s conclusions depend on it.
- Based: passes — The paper gives a reason why it holds.
It may state two separate claims as one.
In the paper
“high differential stability appears to be a hallmark of genes with considerable biological relevance40.”
§ Oxytocin pathway gene networks in the human brain > Discussion
What the sources say
- Not checked yetcites [40] Hawrylycz, M. et al. Canonical genetic signatures of the adult human brain. Nat. Neurosci. 18, 1832 (2015). source
hedgedcorrelational- Asserted: passes — The authors put it forward as true.
- Checkable: passes — It can be checked against evidence.
- Load-bearing: fails — The paper’s conclusions may not depend on it.
- Based: passes — The paper gives a reason why it holds.
Probably not a substantial claim. The paper’s conclusions may not depend on it.
In the paper
“intranasal oxytocin is thought to enter the brain via the olfactory bulbs69”
§ Oxytocin pathway gene networks in the human brain > Discussion
What the sources say
- Not checked yetcites [69] Quintana, D. S., Guastella, A. J., Westlye, L. T. & Andreassen, O. A. The promise and pitfalls of intranasally administering psychopharmacological agents for the treatment of psychiatric disorders. Mol. Psychiatry 21, 29–38 (2016). source
hedgedconditional- Asserted: passes — The authors put it forward as true.
- Checkable: passes — It can be checked against evidence.
- Load-bearing: fails — The paper’s conclusions may not depend on it.
- Based: passes — The paper gives a reason why it holds.
Probably not a substantial claim. The paper’s conclusions may not depend on it.
What the paper did — it cites no source for this, so there is none to check. The quote shows it is in the paper.
In the paper
“The relatively small amount of measurement error for the mRNA probes is indicative of high precision and sufficient generalizability.”
§ Oxytocin pathway gene networks in the human brain > Discussion
hedgeddirect- Asserted: passes — The authors put it forward as true.
- Checkable: passes — It can be checked against evidence.
- Load-bearing: passes — The paper’s conclusions depend on it.
- Based: unclear — It is unclear why the paper says it holds.
It may state two separate claims as one.
What the paper did — it cites no source for this, so there is none to check. The quote shows it is in the paper.
In the paper
“Although this dataset offers less spatial resolution compared to the Allen dataset”
§ Oxytocin pathway gene networks in the human brain > Methods > Independent sample validation
plain- Asserted: passes — The authors put it forward as true.
- Checkable: passes — It can be checked against evidence.
- Load-bearing: fails — The paper’s conclusions may not depend on it.
- Based: passes — The paper gives a reason why it holds.
Probably not a substantial claim. The paper’s conclusions may not depend on it.
None of the sources cited for this claim have been checked yet.
In the paper
“and that increased OXTR gene expression is associated with increased oxytocin binding”
§ Oxytocin pathway gene networks in the human brain > Discussion
What the sources say
- Not checked yetcites [9] Keebaugh, A. C. & Young, L. J. Increasing oxytocin receptor expression in the nucleus accumbens of pre-pubertal female prairie voles enhances alloparental responsiveness and partner preference formation as adults. Horm. Behav. 60, 498–504 (2011). source
- Not checked yetcites [10] Keebaugh, A. C., Barrett, C. E., Laprairie, J. L., Jenkins, J. J. & Young, L. J. RNAi knockdown of oxytocin receptor in the nucleus accumbens inhibits social attachment and parental care in monogamous female prairie voles. Soc. Neurosci. 10, 561–570 (2015). source
plaincorrelational- Asserted: passes — The authors put it forward as true.
- Checkable: passes — It can be checked against evidence.
- Load-bearing: fails — The paper’s conclusions may not depend on it.
- Based: passes — The paper gives a reason why it holds.
Probably not a substantial claim. The paper’s conclusions may not depend on it.
None of the sources cited for this claim have been checked yet.
In the paper
“our study may help facilitate efforts to better understand oxytocin treatment efficacy as it identifies targets for oxytocin receptor engagement, which can facilitate dose-ranging studies69,70.”
§ Oxytocin pathway gene networks in the human brain > Discussion
What the sources say
- Not checked yetcites [69] Quintana, D. S., Guastella, A. J., Westlye, L. T. & Andreassen, O. A. The promise and pitfalls of intranasally administering psychopharmacological agents for the treatment of psychiatric disorders. Mol. Psychiatry 21, 29–38 (2016). source
- Not checked yetcites [70] Insel, T. R. Translating oxytocin neuroscience to the clinic: a National Institute of Mental Health perspective. Biol. Psychiatry 79, 153–154 (2016). source
hedgedconditional- Asserted: passes — The authors put it forward as true.
- Checkable: fails — It may be too vague to check against evidence.
- Load-bearing: passes — The paper’s conclusions depend on it.
- Based: passes — The paper gives a reason why it holds.
Probably not a substantial claim. It may be too vague to check against evidence.
- Rests on an assumption: Research has not yet demonstrated whether increased OXTR expression in humans is associated with activation of the receptor during specific cognitive states.
What the paper did — it cites no source for this, so there is none to check. The quote shows it is in the paper.
In the paper
“the data is derived from a larger dataset of donors (mean sample size for mRNA expression across brain regions = 131.7, range = 88 to 173).”
§ Oxytocin pathway gene networks in the human brain > Methods > Independent sample validation
plain- Asserted: passes — The authors put it forward as true.
- Checkable: passes — It can be checked against evidence.
- Load-bearing: fails — The paper’s conclusions may not depend on it.
- Based: passes — The paper gives a reason why it holds.
Probably not a substantial claim. The paper’s conclusions may not depend on it.
What the paper did — it cites no source for this, so there is none to check. The quote shows it is in the paper.
In the paper
“The collection of human data complied with relevant ethical regulations, with institutional review board approval obtained at each tissue bank and repository that provided tissue samples.”
§ Oxytocin pathway gene networks in the human brain > Methods > Post-mortem brain samples
plain- Asserted: passes — The authors put it forward as true.
- Checkable: passes — It can be checked against evidence.
- Load-bearing: fails — The paper’s conclusions may not depend on it.
- Based: passes — The paper gives a reason why it holds.
Probably not a substantial claim. The paper’s conclusions may not depend on it. It may state two separate claims as one.
None of the sources cited for this claim have been checked yet.
In the paper
“animal models demonstrating that OXTR expression levels directly modulate social behavior9,10”
§ Oxytocin pathway gene networks in the human brain > Discussion
What the sources say
- Not checked yetcites [9] Keebaugh, A. C. & Young, L. J. Increasing oxytocin receptor expression in the nucleus accumbens of pre-pubertal female prairie voles enhances alloparental responsiveness and partner preference formation as adults. Horm. Behav. 60, 498–504 (2011). source
- Not checked yetcites [10] Keebaugh, A. C., Barrett, C. E., Laprairie, J. L., Jenkins, J. J. & Young, L. J. RNAi knockdown of oxytocin receptor in the nucleus accumbens inhibits social attachment and parental care in monogamous female prairie voles. Soc. Neurosci. 10, 561–570 (2015). source
boosteddirect- Asserted: passes — The authors put it forward as true.
- Checkable: passes — It can be checked against evidence.
- Load-bearing: fails — The paper’s conclusions may not depend on it.
- Based: passes — The paper gives a reason why it holds.
Probably not a substantial claim. The paper’s conclusions may not depend on it.
What the paper did — it cites no source for this, so there is none to check. The quote shows it is in the paper.
In the paper
“informed consent was provided by each donor’s next-of-kin.”
§ Oxytocin pathway gene networks in the human brain > Methods > Post-mortem brain samples
plain- Asserted: passes — The authors put it forward as true.
- Checkable: passes — It can be checked against evidence.
- Load-bearing: fails — The paper’s conclusions may not depend on it.
- Based: passes — The paper gives a reason why it holds.
Probably not a substantial claim. The paper’s conclusions may not depend on it.
The paper relies on this without support.
Co-expression of genes across brain regions reflects functional interaction between their signaling systems.
“reflecting an anatomical basis for critical gene pathway interactions”
“providing evidence for putative interactions between dopaminergic and muscarinic acetylcholine systems with oxytocin pathway signaling.”
The paper relies on this without support.
The mRNA co-expression of dopaminergic, muscarinic acetylcholine, and other systems with the oxytocin system is not well characterized.
“However, the mRNA co-expression of these systems, and potentially others, with the oxytocin system is not well characterized.”
The paper relies on this without support.
The six donor brains in the Allen Human Brain Atlas are representative of the general human brain for gene expression mapping.
“The full dataset of protein coding genes (n = 20,737) from six donor brains were collected from the Allen Human Brain Atlas (http://human.brain-map.org/).”
“Here, we leveraged the unique human brain mRNA expression library from Allen Brain Atlas to show that mRNA reflecting specific genes in the oxytocin pathway are highly expressed in subcortical and temporal brain structures, along with the olfactory region.”
The paper relies on this without support.
Olfaction is not as important for human conspecific identification compared to most other mammals due to species specialization.
“as olfaction is not as important for human conspecific identification compared to most other mammals due to species specialization”
The paper relies on this without support.
Research has not yet demonstrated whether increased OXTR expression in humans is associated with activation of the receptor during specific cognitive states.
“research is yet to demonstrate whether the increased expression of OXTR (as measured by the presence of its transcript) in humans is associated with the activation of the receptor during specific cognitive states.”
Claims other papers make about this one
Each is checked against this paper’s own text: does it say what the citing paper says it does?
In the citing paper
“OXTR mRNA has been detected in the nucleus accumbens (Bethlehem et al. 2017; Quintana et al. 2019)”
From Distribution of brain oxytocin and vasopressin V1a receptors in chimpanzees (Pan troglodytes): comparison with humans and other primate species (2022) · cites this paper as Quintana et al. 2019
In the citing paper
“Additionally, there is strong correlation between the expression of the oxytocin receptor gene (OXTR) and dopamine receptors (especially D2R) and muscarinic acetylcholine receptors.”
From Translational opportunities for circuit-based social neuroscience: advancing 21st century psychiatry (2021) · cites this paper as [31]
In the citing paper
“Quintana et al. [31] mapped the mRNA of oxytocin pathway genes throughout human brains and found the highest expression in olfactory bulbs and pallidum, high expression in hypothalamus, thalamus, caudate, and putamen, and more moderately elevated expression in amygdala, anterior cingulum, and hippocampus.”
From Translational opportunities for circuit-based social neuroscience: advancing 21st century psychiatry (2021) · cites this paper as [31]
In the citing paper
“Comparing OXTR expression and fMRI activity associated with cognitive states revealed a robust correlation between OXTR expression and activity maps for “sexual”, “motivation”, “incentive”, and “anxiety” cognitive states.”
From Translational opportunities for circuit-based social neuroscience: advancing 21st century psychiatry (2021) · cites this paper as [31]
Self-check
Percentages, sums and reported differences re-computed from the paper’s own numbers.
Each contradiction between two passages listed here was confirmed by an independent check.
Rated minor: it would not touch a result — a value no result rests on, a p-value that stays on the same side of the significance level, or a conflict that is clerical, resolved elsewhere in the paper, or outside its own findings.
In the paper
§ Oxytocin pathway gene networks in the human brain > Methods > Independent sample validation
“Oxytocin pathway median expression values (Log10 transcripts per million) for 10 distinct brain regions”
§ Oxytocin pathway gene networks in the human brain > Methods > Independent sample validation
“(amygdala, anterior cingulate cortex, caudate, cerebellar hemisphere, cerebellum, cortex, frontal cortex, hippocampus, nucleus accumbens, putamen, substantia nigra)”
Citations
Cites
WGCNA: an R package for weighted correlation network analysis
Langfelder, P., & Horvath, S. (2008) · BMC Bioinformatics · doi:10.1186/1471-2105-9-559 · Cited by 27,252
Molecular signatures database (MSigDB) 3.0
Liberzon, A., Subramanian, A., Pinchback, R., Thorvaldsdóttir, H., Tamayo, P., & Mesirov, J. P. (2011) · Bioinformatics · doi:10.1093/bioinformatics/btr260 · Cited by 7,111
Jaenisch, R., & Bird, A. (2003) · Nature Genetics · doi:10.1038/ng1089 · Cited by 6,325
A General Framework for Weighted Gene Co-Expression Network Analysis
Zhang, B., & Horvath, S. (2005) · Statistical Applications in Genetics and Molecular Biology · doi:10.2202/1544-6115.1128 · Cited by 5,684
The Genotype-Tissue Expression (GTEx) pilot analysis: Multitissue gene regulation in humans
The GTEx Consortium, Ardlie, K. G., Deluca, D. S., Segrè, A. V., Sullivan, T. J., Young, T. R., Gelfand, E. T., Trowbridge, C. A., Maller, J. B., Tukiainen, T., et al. (2015) · Science · doi:10.1126/science.1262110 · Cited by 5,062
A reproducible evaluation of ANTs similarity metric performance in brain image registration
Avants, B. B., Tustison, N. J., Song, G., Cook, P. A., Klein, A., & Gee, J. C. (2011) · NeuroImage · doi:10.1016/j.neuroimage.2010.09.025 · Cited by 4,796
Functional mapping and annotation of genetic associations with FUMA
Watanabe, K., Taskesen, E., van Bochoven, A., & Posthuma, D. (2017) · Nature Communications · doi:10.1038/s41467-017-01261-5 · Cited by 4,083
Large-scale automated synthesis of human functional neuroimaging data.
Yarkoni, T., Poldrack, R. A., Nichols, T. E., Van Essen, D. C., & Wager, T. D. (2011) · Nature Methods · doi:10.1038/nmeth.1635 · Cited by 3,686
Permutation inference for the general linear model
Winkler, A. M., Ridgway, G. R., Webster, M. A., Smith, S. M., & Nichols, T. E. (2014) · NeuroImage · doi:10.1016/j.neuroimage.2014.01.060 · Cited by 3,563
The new NHGRI-EBI Catalog of published genome-wide association studies (GWAS Catalog)
MacArthur, J., Bowler, E., Cerezo, M., Gil, L., Hall, P., Hastings, E., Junkins, H., McMahon, A., Milano, A., Morales, J., et al. (2017) · Nucleic Acids Research · doi:10.1093/nar/gkw1133 · Cited by 2,161
Cited by
Sorted by citations
Items 101–200 of 353
Affective touch in the context of development, oxytocin signaling, and autism
Li, Q., Zhao, W., & Kendrick, K. M. (2022) · Frontiers in Psychology · doi:10.3389/fpsyg.2022.967791 · Cited by 27
Effects of temperature on caffeine and carbon nanotubes co-exposure in Ruditapes philippinarum
Piscopo, R., Coppola, F., Almeida, Â., Marchi, L. D., Russo, T., Esteves, V. I., Soares, A. M. V. M., Pretti, C., Chiellini, E., Polese, G., et al. (2021) · Chemosphere · doi:10.1016/j.chemosphere.2021.129775 · Cited by 24
Liu, R., Sun, D., Xing, X., Chen, Q., Lu, B., Meng, B., Yuan, H., Mo, L., Zheng, J., Zheng, J., et al. (2023) · Neuropharmacology · doi:10.1016/j.neuropharm.2023.109769 · Cited by 24
Participant engagement in environmentally focused social network research
Jasny, L., Sayles, J. S., Hamilton, M., Gómez, L. R., Jacobs, D. B., Prell, C., Matouš, P., Schiffer, E., Guerrero, A. M., & Barnes, M. L. (2021) · Social Networks · doi:10.1016/j.socnet.2021.01.005 · Cited by 22
The somatic molecular evolution of cancer: Mutation, selection, and epistasis
Dasari, K., Somarelli, J. A., Kumar, S., & Townsend, J. P. (2021) · Progress in Biophysics and Molecular Biology · doi:10.1016/j.pbiomolbio.2021.08.003 · Cited by 22
Chen, Y., Li, Q., Zhang, Q., Kou, J., Zhang, Y., Cui, H., Wernicke, J., Montag, C., Becker, B., Kendrick, K. M., et al. (2020) · Frontiers in Neuroscience · doi:10.3389/fnins.2020.589878 · Cited by 26
Quintana, D. S. (2021) · Psychoneuroendocrinology · doi:10.1016/j.psyneuen.2021.105642 · Cited by 22
Self-citationLussier, D., Cruz‐Almeida, Y., & Ebner, N. C. (2019) · Frontiers in Aging Neuroscience · doi:10.3389/fnagi.2019.00338 · Cited by 21
Galton's Quincunx: Probabilistic causation in developmental behavior genetics
Kaplan, J. M., & Turkheimer, E. N. (2021) · Studies in History and Philosophy of Science Part A · doi:10.1016/j.shpsa.2021.04.001 · Cited by 22
Quintana, G. R., Cionnaith, C. E. M., & Pfaus, J. G. (2022) · International Journal of Molecular Sciences · doi:10.3390/ijms23168928 · Cited by 23
Guo, L., Qi, Y., Tan, H., Dai, D., Balesar, R. A., Sluiter, A. A., van Heerikhuize, J. J., Hu, S., Swaab, D. F., & Bao, A. (2022) · EBioMedicine · doi:10.1016/j.ebiom.2022.104266 · Cited by 21
Muhie, S. Y., Gautam, A., Misganaw, B., Yang, R., Mellon, S. H., Hoke, A. V., Flory, J. D., Daigle, B. J., Swift, K., Hood, L., et al. (2023) · Brain Behavior and Immunity · doi:10.1016/j.bbi.2023.07.015 · Cited by 21
On the Nature of the Mother-Infant Tie and Its Interaction With Freudian Drives
Kirsch, M., & Buchholz, M. B. (2020) · Frontiers in Psychology · doi:10.3389/fpsyg.2020.00317 · Cited by 23
Xu, T., Chen, Z., Zhou, X., Wang, L., Zhou, F., Yao, D., Zhou, B., & Becker, B. (2024) · Proceedings of the National Academy of Sciences · doi:10.1073/pnas.2306936121 · Cited by 18
An evolutionary timeline of the oxytocin signaling pathway
Sartorius, A. M., Rokicki, J., Birkeland, S., Bettella, F., Barth, C., de Lange, A. G., Haram, M., Shadrin, A. A., Winterton, A., Steen, N. E., et al. (2024) · Communications Biology · doi:10.1038/s42003-024-06094-9 · Cited by 20
Self-citationZwane, B. N., Mabuba, N., Orimolade, B. O., Koiki, B. A., & Arotiba, O. A. (2020) · Reaction Kinetics Mechanisms and Catalysis · doi:10.1007/s11144-020-01841-5 · Cited by 20
Oxytocin and vasopressin in the hippocampus
Zăgrean, A., Georgescu, I.-A., Ieșanu, M. I., Ionescu, R.-B., Haret, R. M., Panaitescu, A. M., & Zăgrean, L. (2022) · Vitamins and hormones · doi:10.1016/bs.vh.2021.11.002 · Cited by 20
Ferraro, S., Nigri, A., Bruzzone, M. G., Medina, J. P., Fedeli, D., Demichelis, G., Chiapparini, L., Ciullo, G., Gonzalez, A. A., Cecchini, A. P., et al. (2024) · The Journal of Headache and Pain · doi:10.1186/s10194-023-01711-0 · Cited by 19
Zhao, W., Luo, R., Sindermann, C., Li, J., Wei, Z., Zhang, Y., Liu, C., Le, J., Quintana, D. S., Montag, C., et al. (2019) · Progress in Neuro-Psychopharmacology and Biological Psychiatry · doi:10.1016/j.pnpbp.2019.109734 · Cited by 20
Self-citationIdentification of oxytocin expression in human and murine microglia
Maejima, Y., Yokota, S., Ono, T., Yu, Z., Yamachi, M., Hidema, S., Nollet, K. E., Nishimori, K., Tomita, H., Yaginuma, H., et al. (2022) · Progress in Neuro-Psychopharmacology and Biological Psychiatry · doi:10.1016/j.pnpbp.2022.110600 · Cited by 20
Wang, Y., Xu, H., Chen, S., Chen, J., Zheng, Q., Ma, Y., Zhao, X., Shi, Y., & Xiao, L. (2024) · Advanced Science · doi:10.1002/advs.202310244 · Cited by 18
Erramuzpe, A., Schurr, R., Yeatman, J. D., Gotlib, I. H., Sacchet, M. D., Travis, K. E., Feldman, H. M., & Mezer, A. (2020) · Cerebral Cortex · doi:10.1093/cercor/bhaa288 · Cited by 19
Genetic control of variability in subcortical and intracranial volumes
Córdova‐Palomera, A., van der Meer, D., Kaufmann, T., Bettella, F., Wang, Y., Alnæs, D., Doan, N. T., Agartz, I., Bertolino, A., Buitelaar, J. K., et al. (2020) · Molecular Psychiatry · doi:10.1038/s41380-020-0664-1 · Cited by 17
Self-citationThe third form electric organ discharge of electric eels
Xu, J., Cui, X., & Zhang, H. (2021) · Scientific Reports · doi:10.1038/s41598-021-85715-3 · Cited by 17
Touching to connect, explore, and explain: how the human brain makes social touch meaningful
Morrison, I. (2023) · The Senses and Society · doi:10.1080/17458927.2023.2200065 · Cited by 19
Tomberlin, J. K., Miranda, C. D., Flint, C. A., Harris, E., & Wu, G. (2023) · Animal Frontiers · doi:10.1093/af/vfad032 · Cited by 21
Minding the gap in HIV host genetics: opportunities and challenges
Gingras, S. N., Tang, D., Tuff, J. F., & McLaren, P. J. (2020) · Human Genetics · doi:10.1007/s00439-020-02177-9 · Cited by 17
Frazier, I. R., Lin, T., Liu, P., Skarsten, S. N., Feifel, D., & Ebner, N. C. (2021) · Psychology and Aging · doi:10.1037/pag0000545 · Cited by 18
Romero‐Martínez, Á., Sarrate‐Costa, C., & Moya‐Albiol, L. (2021) · Biology · doi:10.3390/biology10121334 · Cited by 19
Chen, Y., Zou, H., Hou, X., Lan, C., Wang, J., Qing, Y., Chen, W., Yao, S., & Kendrick, K. M. (2023) · eLife · doi:10.7554/elife.85847 · Cited by 18
Lan, C., Liu, C., Li, K., Zhao, Z., Yang, J., Ma, Y., Scheele, D., Yao, S., Kendrick, K. M., & Becker, B. (2022) · The International Journal of Neuropsychopharmacology · doi:10.1093/ijnp/pyac037 · Cited by 18
DeRosa, H., Caradonna, S. G., Tran, H., Marrocco, J., & Kentner, A. C. (2022) · Molecular Psychiatry · doi:10.1038/s41380-022-01744-y · Cited by 16
DNA Methylation in Autism Spectrum Disorders: Biomarker or Pharmacological Target?
Gholamalizadeh, H., Amiri-Shahri, M., Rasouli, F., Ansari, A., Rahimi, V. B., & Askari, V. R. (2024) · Brain Sciences · doi:10.3390/brainsci14080737 · Cited by 18
Unveiling the neuroimaging-genetic intersections in the human brain
Diez, I. P., & Sepulcre, J. (2021) · Current Opinion in Neurology · doi:10.1097/wco.0000000000000952 · Cited by 15
Hung, W.-C., Rugh, M., Feraud, M., Avasarala, S., Kurylo, J., Gutierrez, M., Jimenez, K., Truong, N., Holden, P. A., Grant, S. B., et al. (2022) · Journal of Hazardous Materials · doi:10.1016/j.jhazmat.2021.127469 · Cited by 17
Marazziti, D., Diep, P.-T., Carter, C. S., & Carbone, M. G. (2022) · Current Medicinal Chemistry · doi:10.2174/0929867329666220727120646 · Cited by 16
The effect of intranasal oxytocin on social reward processing in humans: a systematic review
Kraus, J., Výborová, E., & Silani, G. (2023) · Frontiers in Psychiatry · doi:10.3389/fpsyt.2023.1244027 · Cited by 16
Medhi, K., Bhardwaj, R., & Laxmi, R. (2021) · Soil biology · doi:10.1007/978-3-030-76863-8_6 · Cited by 15
Seeley, S. H., Andrews‐Hanna, J. R., Allen, J. J. B., & O'Connor, M. (2022) · Human Brain Mapping · doi:10.1002/hbm.26071 · Cited by 16
Coenjaerts, M., Trimborn, I., Adrovic, B., Stoffel‐Wagner, B., Cahill, L. F., Philipsen, A., Hurlemann, R., & Scheele, D. (2022) · NeuroImage · doi:10.1016/j.neuroimage.2022.119689 · Cited by 17
Microbes, oxytocin and stress: Converging players regulating eating behavior
Cuesta‐Marti, C., Uhlig, F., Muguerza, B., Hyland, N. P., Clarke, G. A., & Schellekens, H. (2023) · Journal of Neuroendocrinology · doi:10.1111/jne.13243 · Cited by 17
Giulio, P. (2020) · Archives of Depression and Anxiety · doi:10.17352/2455-5460.000043 · Cited by 15
Oxytocin modulates local topography of human functional connectome in healthy men at rest
Martins, D., Dipasquale, O., & Paloyelis, Y. (2021) · Communications Biology · doi:10.1038/s42003-020-01610-z · Cited by 15
Zheng, X., & Kendrick, K. M. (2021) · Frontiers in Pharmacology · doi:10.3389/fphar.2021.652473 · Cited by 17
Yao, S., & Kendrick, K. M. (2022) · Psychoradiology · doi:10.1093/psyrad/kkac016 · Cited by 16
Reis, M., Wiegleb, G., Claude, J., Lata, R., Horchler, B., Ha, N.-T., Reimer, C., Vieira, C. P., Vieira, J., & Posnien, N. (2020) · Scientific Reports · doi:10.1038/s41598-020-69719-z · Cited by 14
Lesemann, F. H. P., Spencer, H., Montoya, E. R., Kraaijenvanger, E. J., He, Y., Branje, S., Boks, M. P., & Bos, P. A. (2020) · European Neuropsychopharmacology · doi:10.1016/j.euroneuro.2020.08.008 · Cited by 14
Siecinski, S. K., Giamberardino, S. N., Spanos, M., Hauser, A. C., Gibson, J., Chandrasekhar, T., Trelles, M. D. P., Rockhill, C., Palumbo, M. L., Cundiff, A. W., et al. (2023) · Autism Research · doi:10.1002/aur.2884 · Cited by 15
Engel, S., van Zuiden, M., Frijling, J. L., Koch, S. B. J., Nawijn, L., Yildiz, R. L. W., Schumacher, S., Knaevelsrud, C., Bosch, J. A., Veltman, D. J., et al. (2020) · European Journal of Psychotraumatology · doi:10.1080/20008198.2020.1761622 · Cited by 14
Dogani, M., Askari, N., Kalantari‐Hesari, A., & Rahbar, F. H. (2021) · Journal of Traditional and Complementary Medicine · doi:10.1016/j.jtcme.2021.09.007 · Cited by 14
Brain areas affected by intranasal oxytocin show higher oxytocin receptor expression
Habets, P. C., Mclain, C., & Meijer, O. C. (2021) · European Journal of Neuroscience · doi:10.1111/ejn.15447 · Cited by 11
Polk, R. J., Horta, M., Lin, T., Porges, E. C., Ojeda, M., Nazarloo, H. P., Carter, C. S., & Ebner, N. C. (2022) · Philosophical Transactions of the Royal Society B Biological Sciences · doi:10.1098/rstb.2021.0048 · Cited by 12
Arroyave, J., Martinez, C. M., Martínez‐Oriol, F. H., Sosa, E., & Alter, S. E. (2020) · Freshwater Biology · doi:10.1111/fwb.13641 · Cited by 13
The need for polygenic score reporting standards in evidence-based practice: lipid genetics use case
Wand, H., Knowles, J. W., & Clarke, S. L. (2021) · Current Opinion in Lipidology · doi:10.1097/mol.0000000000000733 · Cited by 13
Co-Stimulation of Oxytocin and Arginine-Vasopressin Receptors Affect Hypothalamic Neurospheroid Size
Salehi, M. S., Neumann, I. D., Jurek, B., & Pandamooz, S. (2021) · International Journal of Molecular Sciences · doi:10.3390/ijms22168464 · Cited by 13
Lindenmaier, Z., Ellegood, J., Stuive, M., Easson, K., Yee, Y., Fernandes, D., Foster, J. A., Anagnostou, E. A., & Lerch, J. P. (2022) · NeuroImage · doi:10.1016/j.neuroimage.2022.119243 · Cited by 12
Mayer, A. V., Preckel, K., Ihle, K., Piecha, F. A., Junghanns, K., Reiche, S., Rademacher, L., Müller‐Pinzler, L., Stolz, D. S., Kamp‐Becker, I., et al. (2021) · Biological Psychiatry Global Open Science · doi:10.1016/j.bpsgos.2021.10.004 · Cited by 12
Genes associated with grey matter volume reduction in multiple sclerosis
Sun, J., Xie, Y., Wang, Q., Shen, J., Qin, W., Zhang, N., & Yu, C. (2021) · Journal of Neurology · doi:10.1007/s00415-021-10777-2 · Cited by 12
COVID-19: Are We Facing Secondary Pellagra Which Cannot Simply Be Cured by Vitamin B3?
Kujundžić, R. N. (2022) · International Journal of Molecular Sciences · doi:10.3390/ijms23084309 · Cited by 12
Kunitake, Y., Mizoguchi, Y., Imamura, Y., Kunitake, H., Orihashi, R., Matsushima, J., Tateishi, H., Murakawa‐Hirachi, T., Yamada, S., & Monji, A. (2022) · Comprehensive Psychoneuroendocrinology · doi:10.1016/j.cpnec.2022.100166 · Cited by 11
Age-dependent effects of oxytocin in brain regions enriched with oxytocin receptors
Xiao, S., Ebner, N. C., Manzouri, A., Li, T., Cortes, D. S., Månsson, K. N. T., & Fischer, H. (2023) · Psychoneuroendocrinology · doi:10.1016/j.psyneuen.2023.106666 · Cited by 11
Fu, K., Xu, S., Zhang, Z., Liu, D. C., Xu, T., Zhang, Y., Zhou, F., Zhang, X., Lan, C., Wang, J., et al. (2025) · Advanced Science · doi:10.1002/advs.202503251 · Cited by 13
Gillera, S. E. A., Marinello, W. P., Nelson, M. A., Horman, B. M., & Patisaul, H. B. (2022) · Toxics · doi:10.3390/toxics10050268 · Cited by 11
Borowiak, K., & von Kriegstein, K. (2020) · Translational Psychiatry · doi:10.1038/s41398-020-00903-5 · Cited by 11
Oxytocin increases perceived competence and social-emotional engagement with brands
Barraza, J. A., Hu, X., Terris, E. T., Wang, C., & Zak, P. J. (2021) · PLoS ONE · doi:10.1371/journal.pone.0260589 · Cited by 13
Connectome dysfunction in patients at clinical high risk for psychosis and modulation by oxytocin
Davies, C., Martins, D., Dipasquale, O., McCutcheon, R. A., Micheli, A. D., Ramella‐Cravaro, V., Provenzani, U., Rutigliano, G., Cappucciati, M., Oliver, D., et al. (2024) · Molecular Psychiatry · doi:10.1038/s41380-024-02406-x · Cited by 9
Cavada-Blanco, F., Cróquer, A., Yerena, E., & Rodrı́guez, J. P. (2021) · Frontiers in Marine Science · doi:10.3389/fmars.2021.671024 · Cited by 10
Neville, M. C. (2023) · Animal Frontiers · doi:10.1093/af/vfad021 · Cited by 12
Lactation in domestic carnivores
Chastant‐Maillard, S. (2023) · Animal Frontiers · doi:10.1093/af/vfad027 · Cited by 10
Kong, X., Kang, J., & Liu, K. (2023) · Journal of Psychiatric Research · doi:10.1016/j.jpsychires.2023.08.006 · Cited by 11
Neuropeptides and Their Roles in the Cerebellum
Li, Z.-H., Li, B., Zhang, X., & Zhu, J. (2024) · International Journal of Molecular Sciences · doi:10.3390/ijms25042332 · Cited by 11
Robinson, K. J., Hazon, N., Twiss, S. D., & Pomeroy, P. P. (2019) · Psychoneuroendocrinology · doi:10.1016/j.psyneuen.2019.104423 · Cited by 10
Tapias-Espinosa, C., Cañete, T., Sampedro-Viana, D., Brudek, T., Kaihøj, A., Oliveras, I., Tobeña, A., Aznar, S., & Fernández‐Teruel, A. (2021) · Physiology & Behavior · doi:10.1016/j.physbeh.2021.113547 · Cited by 10
Nazzari, S., Grumi, S., Villa, M., Mambretti, F., Biasucci, G., Decembrino, L., Giacchero, R., Magnani, M. L., Nacinovich, R., Prefumo, F., et al. (2022) · Psychoneuroendocrinology · doi:10.1016/j.psyneuen.2022.105920 · Cited by 12
Takiguchi, S., Makita, K., Fujisawa, T. X., Nishitani, S., & Tomoda, A. (2023) · Frontiers in Child and Adolescent Psychiatry · doi:10.3389/frcha.2022.1056115 · Cited by 9
Isothiazolinone dysregulates the pattern of miRNA secretion: Endocrine implications for neurogenesis
Tang, L., Li, J., Hu, C., Zhou, B., Lam, P. K. S., & Chen, L. (2023) · Environment International · doi:10.1016/j.envint.2023.108308 · Cited by 9
Using MERSCOPE to Generate a Cell Atlas of the Mouse Brain that Includes Lowly Expressed Genes
Emanuel, G., & He, J. (2021) · Microscopy Today · doi:10.1017/s1551929521001346 · Cited by 9
DeRosa, H., Caradonna, S. G., Tran, H., Marrocco, J., & Kentner, A. C. (2022) · eNeuro · doi:10.1523/eneuro.0148-22.2022 · Cited by 10
Værøy, H., Lahaye, E., Dubessy, C., Bénard, M., Nicol, M., Cherifi, Y., Takhlidjt, S., do Rego, J. L., do-Rego, J.-C., Chartrel, N., et al. (2023) · Discover Mental Health · doi:10.1007/s44192-023-00048-z · Cited by 9
Valdes-Hernandez, P. A., Polk, R. J., Horta, M., Frazier, I. R., Perez, E., Ojeda, M., Porges, E. C., Cruz‐Almeida, Y., Feifel, D., & Ebner, N. C. (2021) · Aging Brain · doi:10.1016/j.nbas.2021.100023 · Cited by 9
Martins, D. A., Mazibuko, N., Zelaya, F. O., Vasilakopoulou, S., Loveridge, J., Oates, A., Maltezos, S., Mehta, M. A., Wastling, S. J., Howard, M. A., et al. (2019) · bioRxiv (Cold Spring Harbor Laboratory) · doi:10.1101/563056 · Cited by 9
Deciphering autism heterogeneity: a molecular stratification approach in four mouse models
Gora, C., Dudas, A., Vaugrente, O., Drobecq, L., Pecnard, E., Lefort, G., & Pellissier, L. P. (2024) · Translational Psychiatry · doi:10.1038/s41398-024-03113-5 · Cited by 9
Ramesh, R., & Elango, L. (2021) · Environmental Science and Pollution Research · doi:10.1007/s11356-020-12257-y · Cited by 8
Navarro, G., Fonseca, L., Talarico, F., Spíndola, L., Santoro, M. L., Ota, V., Cogo‐Moreira, H., Mari, J. D. J., Rohde, L. A., Miguel, E. C., et al. (2021) · Journal of Psychiatric Research · doi:10.1016/j.jpsychires.2021.07.057 · Cited by 8
Farrow, E., Chiocchetti, A. G., Rogers, J. C., Pauli, R., Raschle, N. M., González-Madruga, K., Smaragdi, A., Martinelli, A., Kohls, G., Stadler, C., et al. (2021) · Translational Psychiatry · doi:10.1038/s41398-021-01609-y · Cited by 9
Campetella, F., Ignell, R., BEUTEL, R. G., Hansson, B. S., & Sachse, S. (2021) · PLoS neglected tropical diseases · doi:10.1371/journal.pntd.0009098 · Cited by 8
Weinstein, S. R., Erickson, E. N., Molina, R., & Bell, A. F. (2023) · Comprehensive Psychoneuroendocrinology · doi:10.1016/j.cpnec.2023.100209 · Cited by 6
Filho, C. C., Melfior, L., Ramos, S. L., Pizi, M. S. O., Taruhn, L. F., Muller, M. E., Nunes, T., Schmitt, L. D. O., Gaspar, J. M., de Oliveira, M. D. A., et al. (2025) · Brain Sciences · doi:10.3390/brainsci15020151 · Cited by 6
Sun, J.-Y., Wang, Z., Xu, W., & Zhao, J. (2025) · Biochemical Pharmacology · doi:10.1016/j.bcp.2025.117050 · Cited by 8
Reframing oxytocin as a behavioral flexibility hormone
Walle, K. M., Sartorius, A. M., Deilhaug, E., Kang, H., Nærland, T., Andreassen, O. A., Westlye, L. T., & Quintana, D. S. (2026) · Neuroscience & Biobehavioral Reviews · doi:10.1016/j.neubiorev.2026.106628 · Cited by 10
Self-citationOrganization of neuropeptide systems in the human brain
Ceballos, E. G., Farahani, A., Liu, Z.-Q., Milisav, F., Hansen, J. Y., Dagher, A., & Mišić, B. (2026) · Nature Neuroscience · doi:10.1038/s41593-026-02236-w · Cited by 14
Mehta, R. V. (2025) · Infant Behavior and Development · doi:10.1016/j.infbeh.2025.102055 · Cited by 8
The Autism Palette: Combinations of Impairments Explain the Heterogeneity in ASD
Fóthi, Á., Lörincz, A., & Soorya, L. V. (2020) · Frontiers in Psychiatry · doi:10.3389/fpsyt.2020.503462 · Cited by 9
Qiu, M., Zhang, Z., Xiong, X., Du, H., Li, Q., Yu, C., Gan, W., Liu, H., Peng, H., Xia, B., et al. (2020) · PeerJ · doi:10.7717/peerj.8440 · Cited by 7
Neuroimaging genetics of oxytocin: A transcriptomics-informed systematic review
Prata, D. P., & Silva, M. (2022) · Neuroscience & Biobehavioral Reviews · doi:10.1016/j.neubiorev.2022.104912 · Cited by 7
Haaf, R., Brandi, M., Albantakis, L., Lahnakoski, J. M., Henco, L., & Schilbach, L. (2024) · Scientific Reports · doi:10.1038/s41598-023-50770-5 · Cited by 8
Single-Cell Analysis of Sex and Gender Differences in the Human Brain During Development and Disease
Zelco, A., & Joshi, A. (2025) · Cellular and Molecular Neurobiology · doi:10.1007/s10571-025-01536-2 · Cited by 9
Effect of oxytocin injection on fetal heart rate based on multifractal analysis
Wang, J. C., Kim, J., Shao, W., Nam, S., & Hong, S. (2021) · Chaos Solitons & Fractals · doi:10.1016/j.chaos.2021.111045 · Cited by 7
Flinn, M. V. (2021) · Frontiers in Psychology · doi:10.3389/fpsyg.2021.765926 · Cited by 9
Hagan, A., Xu, L., Kou, J., Hu, Y., Klugah‐Brown, B., Li, J., Bore, M. C., Becker, B., Kendrick, K. M., & Jiang, X. (2025) · Psychoradiology · doi:10.1093/psyrad/kkaf021 · Cited by 6
Metadata
- Authors
- Quintana, D. S., Rokicki, J., van der Meer, D., Alnæs, D., Kaufmann, T., Córdova-Palomera, A., Dieset, I., Andreassen, O. A., & Westlye, L. T.
- Affiliations
- Oslo University Hospital (NO)
- Corresponding author
- Quintana, Daniel S.
- ORCID
- Venue
- Nature Communications
- Published
- 2019-02-08
- Volume
- 10
- Issue
- 1
- Pages
- 668-668
- ISSN
- 2041-1723 (ISSN-L)
- PMC
- PMC6368605
- OpenAlex
- W2912308393
- Semantic Scholar
- ba7f26bd71b739a813a7340a6e765b4b799bc092
- Cited by
- 354
- References
- 76
- Citations by year
- 2026: 27 · 2025: 31 · 2024: 43 · 2023: 43 · 2022: 41 · 2021: 78 · 2020: 74 · 2019: 16
- FWCI
- 65.66
- Type
- journal article
- Language
- en
- Open access
- gold
- doi.org
- Locations
- Nature Communications (publishedVersion, cc-by)
- Europe PMC (PubMed Central) (publishedVersion, cc-by)
- PubMed Central (publishedVersion, cc-by)
- PubMed (publishedVersion)
- Research Publications (Maastricht University) (publishedVersion, cc-by)
- RePEc: Research Papers in Economics (submittedVersion)
- DOAJ (DOAJ: Directory of Open Access Journals) (submittedVersion, cc-by-sa)
- DOAJ (DOAJ: Directory of Open Access Journals) (submittedVersion)
- OSF Preprints (OSF Preprints) (submittedVersion)
- OSF Preprints (OSF Preprints) (submittedVersion, cc-by)
- NORA - Norwegian Open Research Archives (submittedVersion, cc-by)
- Research Publications (Maastricht University) (submittedVersion, other-oa)
- Funders
- Novo Nordisk (NNF16OC0019856)
- Norges Forskningsråd (223273, #249795)
- Novo Nordisk Fonden (NNF16OC0019856)
- Helse Sør-Øst RHF (#2014-097, 2015-073, 223273, 2017–112)
- Topics
- Life Sciences › Neuroscience › Endocrine and Autonomic Systems › Neuroendocrine regulation and behavior
- Life Sciences › Neuroscience › Cellular and Molecular Neuroscience › Neurotransmitter Receptor Influence on Behavior
- Life Sciences › Neuroscience › Cellular and Molecular Neuroscience › Neuropeptides and Animal Physiology
- Keywords
- oxytocin signaling, oxytocin receptor, CD38, gene co-expression network, subcortical structures, olfactory region, dopaminergic signaling, cognitive states, social behavior, reproductive behavior
- MeSH terms
- Adult, Brain, Cognition, Female, Humans, Hypothalamus, Magnetic Resonance Imaging, Male, Middle Aged, Oxytocin, RNA, Messenger, Receptors, Oxytocin, ADP-ribosyl Cyclase 1
About these checks
Registry, retraction, Cites and statistics results are computed, not judged, with one exception: a printed reference that no index lists is read once by a model before it counts as a citation error. Claims are extracted by a model and kept only when their quote appears verbatim in the text; each cited source is then checked, with a model’s help, for whether it says what the claim relies on. Those verdicts can be wrong — read the claim’s quote and the cited source before relying on one.
A language model drew the claims from the paper on 2026-10-09, under version 3 of the claim definition (model deepseek-v4.1-flash, prompt extract-v3).
A second model labelled each claim on 2026-10-09 (model jev-1.13-20260917, definition revision gold-guideline-v0.2).
Statistics and arithmetic are recomputed, not judged.
Confidence bands are shown only for fields calibrated on our annotated test set. None is calibrated yet, so no band is shown.
What counts as a claim ›How we measure confidence ›How we check this ›
Are you an author, or do you see a problem with this page? Request a review
