

The DOI matches its Crossref record; 91 of the 95 references it cites were found in a registry or an index; 8 of the 100 sources its claims cite were checked for support.
Layer 4 of mouse neocortex differs in cell types and circuit organization between sensory areas
Open accessPublished version of a preprint
Abstract
Layer 4 (L4) of mammalian neocortex plays a crucial role in cortical information processing, yet a complete census of its cell types and connectivity remains elusive. Using whole-cell recordings with morphological recovery, we identified one major excitatory and seven inhibitory types of neurons in L4 of adult mouse visual cortex (V1). Nearly all excitatory neurons were pyramidal and all somatostatin-positive (SOM + ) non-fast-spiking interneurons were Martinotti cells. In contrast, in somatosensory cortex (S1), excitatory neurons were mostly stellate and SOM + interneurons were non-Martinotti. These morphologically distinct SOM + interneurons corresponded to different transcriptomic cell types and were differentially integrated into the local circuit with only S1 neurons receiving local excitatory input. We propose that cell type specific circuit motifs, such as the Martinotti/pyramidal and non-Martinotti/stellate pairs, are used across the cortex as building blocks to assemble cortical circuits.
Overview
AI snapshot
Written from the paper’s full text.
TL;DR
In adult mouse layer 4 (L4), visual cortex (V1) is dominated by pyramidal excitatory neurons and somatostatin-positive (SOM+) Martinotti cells, whereas somatosensory cortex (S1) is dominated by spiny stellate excitatory neurons and SOM+ non-Martinotti cells. These area-specific cell types correspond to different transcriptomic types and differ in local excitatory-to-SOM+ connectivity.
Key findings
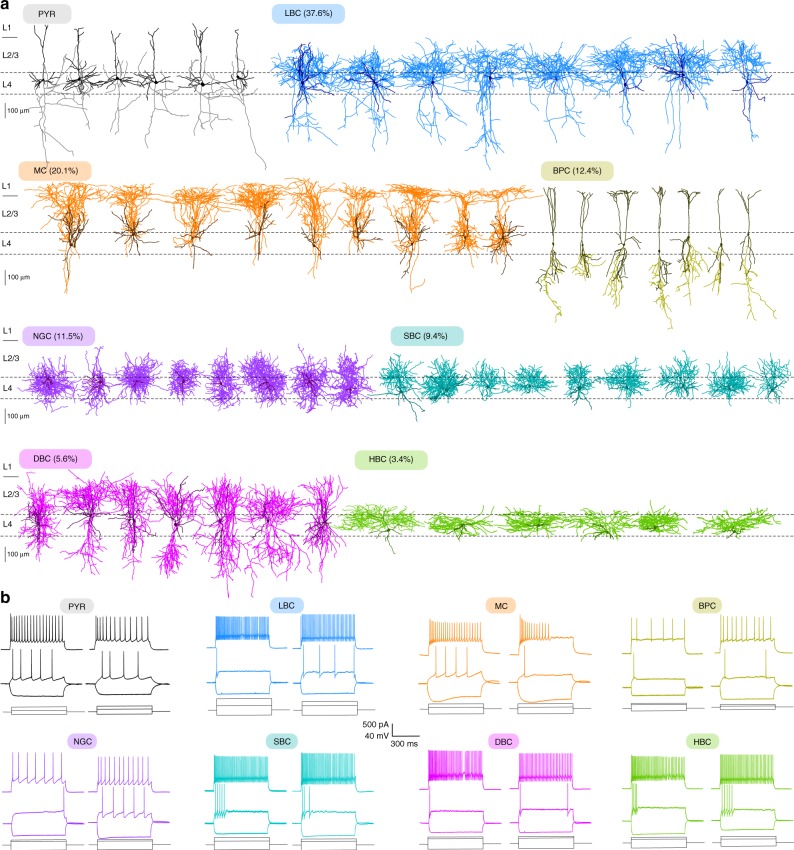
- In V1 L4, 99.1% of recovered excitatory neurons were pyramidal (573/578) and only 0.9% were spiny stellate (5/578); among Viaat-labeled interneurons, SOM+ non-fast-spiking cells were Martinotti cells (20.1%, 47/234), with no non-Martinotti cells found.
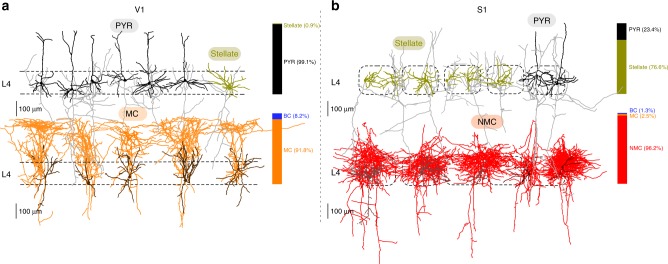
- In S1 L4, 76.6% of recovered spiny neurons were spiny stellate (85/111), and 96.2% of recovered SOM+ neurons were non-Martinotti cells (76/79); both differences from V1 were significant (Fisher’s exact test, p < 0.0001).
- Patch-seq mapping showed L4 SOM+ cells mostly assigned to Sst Calb2 Pdlim in V1 and Sst Hpse Cbln4 in S1 (S1: 27/29 Hpse; V1: 21/33 Calb2; p < 0.0001), with V1 Hpse cells electrophysiologically intermediate between V1 Calb2 Martinotti cells and S1 non-Martinotti cells.
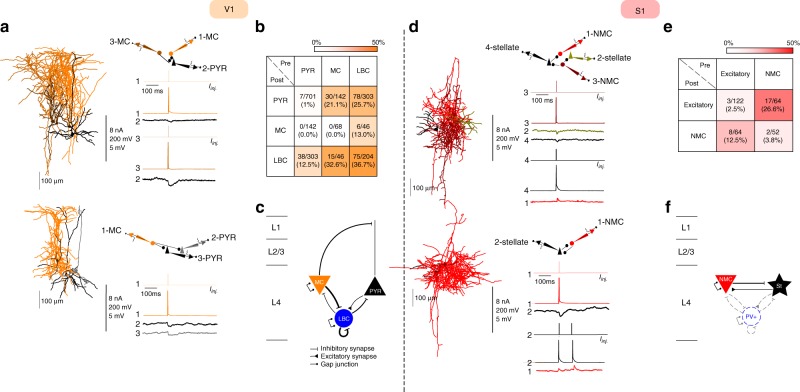
- Local excitatory input to SOM+ cells was present in S1 (12.5%, 8/64) but absent in V1 (0%, 0/142; p = 0.0002); SOM+ to excitatory connection probabilities were high in both areas (21.1%, 30/142 in V1; 26.6%, 17/64 in S1), while excitatory-excitatory connectivity was low (1.0%, 7/701 in V1; 2.5%, 3/122 in S1).
Methods
- Whole-cell patch-clamp recordings with post-hoc morphological recovery in adult mice (V1: n = 129 mice, median age 71 days; 1174 recovered neurons: 578 excitatory, 596 inhibitory), using Cre reporter lines including Viaat-Cre/Ai9, SOM-Cre/Ai9, PV-Cre/Ai9, VIP-Cre/Ai9, and Scnn1a-Cre/Ai9.
- Simultaneous multi-cell recordings up to eight cells to measure unitary synaptic connections, paired-pulse ratios, and gap-junction coupling, with inter-soma distances generally <150 µm.
- Patch-seq combined patch-clamp electrophysiology with single-cell RNA sequencing (V1 L4 n = 42, S1 L4 n = 35 after QC, plus L5 cells), mapped to the Tasic et al. transcriptomic atlas; morphological and electrophysiological features were analyzed with regularized logistic regression, t-SNE, and sparse reduced-rank regression.
Limitations
- Stated: slice electrophysiology can sever neuronal structures, potentially underestimating morphology and connectivity; somatic recordings may fail to detect synapses formed in distal dendrites; low classification accuracy for some morphological pairs (e.g., SBC/HBC) may reflect insufficient sample size.
- Stated: initial S1 connectivity measurements did not ensure cells were within the same barrel, though a separate intra-barrel experiment was performed.
- Evident: transcriptomic profiling was limited to SOM+ neurons, not all L4 cell types; morphological classification relied on expert-defined types with some overlapping classes; Patch-seq sample sizes were modest, and the age range was broad (55–330 days in V1 recordings).
Model-written summary. Check it against the paper before relying on it.
Integrity signals
Registry
Cites
Statistics
Figures
Verification
Claims the paper makes
65 Own result · 45 Not checked yet · 19 Own interpretation · 18 Own method · 2 Partly supported · 2 No basis given · 1 Supported so far · accuracy not yet measured
None of the sources cited for this claim have been checked yet.
In the paper
“all labeled neurons recorded in Scnn1a-Cre/Ai9 mice (n = 5), a transgenic mouse line that preferentially labels excitatory neurons in L436,37, were morphologically confirmed as PYRs (100%, 30/30).”
§ Layer 4 of mouse neocortex differs in cell types and circuit organization between sensory areas > Results > Morphological cell types in L4 of adult mouse visual cortex
What the sources say
- Not checked yetcites [36] Xue, M., Atallah, B. V. & Scanziani, M. Equalizing excitation–inhibition ratios across visual cortical neurons. Nature 511, 596–600 (2014). source
- Not checked yetcites [37] Harris, J. A. et al. Anatomical characterization of Cre driver mice for neural circuit mapping and manipulation. Front. Neural Circuits 8, 76 (2014). source
plainn = 5- Asserted: passes — The authors put it forward as true.
- Checkable: passes — It can be checked against evidence.
- Load-bearing: unclear — It is unclear whether the paper’s conclusions depend on it.
- Based: passes — The paper gives a reason why it holds.
A result the paper reports from its own data — it cites no other source for it, so there is none to check. The quote shows it is in the paper.
In the paper
“However, SBC/HBC pair showed only ~0.6 classification accuracy.”
§ Layer 4 of mouse neocortex differs in cell types and circuit organization between sensory areas > Results > Morphological cell types in L4 of adult mouse visual cortex
plainn = 92- Asserted: passes — The authors put it forward as true.
- Checkable: passes — It can be checked against evidence.
- Load-bearing: unclear — It is unclear whether the paper’s conclusions depend on it.
- Based: passes — The paper gives a reason why it holds.
A result the paper reports from its own data — it cites no other source for it, so there is none to check. The quote shows it is in the paper.
In the paper
“the average cross-validated classification accuracy between the FS types was only 0.67, while the average accuracy across all other pairs was 0.98.”
§ Layer 4 of mouse neocortex differs in cell types and circuit organization between sensory areas > Results > Morphological cell types in L4 of adult mouse visual cortex
plainn = 235- Asserted: passes — The authors put it forward as true.
- Checkable: passes — It can be checked against evidence.
- Load-bearing: unclear — It is unclear whether the paper’s conclusions depend on it.
- Based: passes — The paper gives a reason why it holds.
A result the paper reports from its own data — it cites no other source for it, so there is none to check. The quote shows it is in the paper.
In the paper
“Most features exhibited strong differences between cell types (Supplementary Fig. 5).”
§ Layer 4 of mouse neocortex differs in cell types and circuit organization between sensory areas > Results > Morphological cell types in L4 of adult mouse visual cortex
boostedcorrelationaln = 235- Asserted: passes — The authors put it forward as true.
- Checkable: passes — It can be checked against evidence.
- Load-bearing: passes — The paper’s conclusions depend on it.
- Based: passes — The paper gives a reason why it holds.
A result the paper reports from its own data — it cites no other source for it, so there is none to check. The quote shows it is in the paper.
In the paper
“We found that indeed 76.6% (85/111) of the recovered spiny neurons did not have a clear apical dendrite and were thus classified as spiny stellate cells (Fig. 3b), while the remaining 23.4% were pyramidal cells.”
§ Layer 4 of mouse neocortex differs in cell types and circuit organization between sensory areas > Results > V1 differs from S1 in major L4 cell types
plainn = 24- Asserted: passes — The authors put it forward as true.
- Checkable: passes — It can be checked against evidence.
- Load-bearing: passes — The paper’s conclusions depend on it.
- Based: passes — The paper gives a reason why it holds.
A result the paper reports from its own data — it cites no other source for it, so there is none to check. The quote shows it is in the paper.
In the paper
“This confirms that, unlike in V1, spiny stellate cells are the predominant excitatory population in L4 of adult mouse S1 (Fisher’s exact test for difference in the fraction of spiny stellate cells between V1 and S1: p < 0.0001; 85/111 vs. 5/578).”
§ Layer 4 of mouse neocortex differs in cell types and circuit organization between sensory areas > Results > V1 differs from S1 in major L4 cell types
boostedn = 24- Asserted: passes — The authors put it forward as true.
- Checkable: passes — It can be checked against evidence.
- Load-bearing: passes — The paper’s conclusions depend on it.
- Based: passes — The paper gives a reason why it holds.
A result the paper reports from its own data — it cites no other source for it, so there is none to check. The quote shows it is in the paper.
In the paper
“The last type were neurogliaform cells (NGCs; 11.5%, 27/234), characterized by a very thin axon highly ramifying around the soma and a late-spiking firing pattern with a large AP width.”
§ Layer 4 of mouse neocortex differs in cell types and circuit organization between sensory areas > Results > Morphological cell types in L4 of adult mouse visual cortex
plain- Asserted: passes — The authors put it forward as true.
- Checkable: passes — It can be checked against evidence.
- Load-bearing: unclear — It is unclear whether the paper’s conclusions depend on it.
- Based: passes — The paper gives a reason why it holds.
A result the paper reports from its own data — it cites no other source for it, so there is none to check. The quote shows it is in the paper.
In the paper
“Only five (0.9%) of the excitatory neurons were classified as spiny stellate cells”
§ Layer 4 of mouse neocortex differs in cell types and circuit organization between sensory areas > Results > Morphological cell types in L4 of adult mouse visual cortex
plain- Asserted: passes — The authors put it forward as true.
- Checkable: passes — It can be checked against evidence.
- Load-bearing: passes — The paper’s conclusions depend on it.
- Based: passes — The paper gives a reason why it holds.
A result the paper reports from its own data — it cites no other source for it, so there is none to check. The quote shows it is in the paper.
In the paper
“Comparison of electrophysiological features between MCs, NMCs, and FS cells revealed that NMCs were in between MCs and FS cells in terms of their firing patterns and intrinsic membrane properties (Supplementary Figs. 5, 6).”
§ Layer 4 of mouse neocortex differs in cell types and circuit organization between sensory areas > Results > V1 differs from S1 in major L4 cell types
plaincorrelational- Asserted: passes — The authors put it forward as true.
- Checkable: passes — It can be checked against evidence.
- Load-bearing: unclear — It is unclear whether the paper’s conclusions depend on it.
- Based: passes — The paper gives a reason why it holds.
A result the paper reports from its own data — it cites no other source for it, so there is none to check. The quote shows it is in the paper.
In the paper
“all unlabeled L4 neurons (n = 133) were morphologically confirmed as excitatory neurons”
§ Layer 4 of mouse neocortex differs in cell types and circuit organization between sensory areas > Results > Morphological cell types in L4 of adult mouse visual cortex
plainn = 133- Asserted: passes — The authors put it forward as true.
- Checkable: passes — It can be checked against evidence.
- Load-bearing: passes — The paper’s conclusions depend on it.
- Based: passes — The paper gives a reason why it holds.
- Probably not a substantial claim. 44
- It may state two separate claims as one. 43
- The quote only partly states this claim. 3
The sources with a verdict support this claim; the rest weren’t checked yet, have no full text we could read, or their verdicts aren’t rated yet.
In the paper
“For example, PV+ FS interneurons receive strong thalamic inputs16–20 while SOM+ non-FS interneurons receive weaker thalamic inputs21,22.”
§ Layer 4 of mouse neocortex differs in cell types and circuit organization between sensory areas > Introduction
What the sources say
- Supportedcites [16] Cruikshank, S. J., Lewis, T. J. & Connors, B. W. Synaptic basis for intense thalamocortical activation of feedforward inhibitory cells in neocortex. Nat. Neurosci. 10, 462–468 (2007). source
The citation to this paper is attached to the PV+ FS clause, not the separately cited SOM+ clause. The Methods (p. 7) identify a subset of the studied FS cells as parvalbumin-expressing, and the Results (p. 3) report strong thalamically evoked excitation in FS cells. (LLM, conf=0.92)
- Not checked yetcites [17] Beierlein, M., Gibson, J. R. & Connors, B. W. Two dynamically distinct inhibitory networks in layer 4 of the neocortex. J. Neurophysiol. 90, 2987–3000 (2003). source
- Could not verifycites [18] Higley, M. J. & Contreras, D. Balanced excitation and inhibition determine spike timing during frequency adaptation. J. Neurosci. 26, 448–457 (2006). sourceExperimental — accuracy not yet measured
The Discussion (page unavailable) describes thalamocortical excitation triggering strong feedforward inhibition in layer 4, but does not compare thalamic input strengths across interneuron types. Searches for PV+, SOM+, fast-spiking interneurons, and weaker thalamic inputs found no passage addressing the claimed comparison. (LLM, conf=0.72)
- Not checked yetcites [19] Gabernet, L., Jadhav, S. P., Feldman, D. E., Carandini, M. & Scanziani, M. Somatosensory integration controlled by dynamic thalamocortical feed-forward inhibition. Neuron 48, 315–327 (2005). source
- Not checked yetcites [20] Kloc, M. & Maffei, A. Target-specific properties of thalamocortical synapses onto layer 4 of mouse primary visual cortex. J. Neurosci. 34, 15455–15465 (2014). source
- Supportedcites [21] Cruikshank, S. J., Urabe, H., Nurmikko, A. V. & Connors, B. W. Pathway-specific feedforward circuits between thalamus and neocortex revealed by selective optical stimulation of axons. Neuron 65, 230–245 (2010). source
The citation is attached to the SOM+ non-FS clause. In Results, “Optically evoked TC responses of different neuronal subtypes” (page unavailable), the paper reports that somatostatin-expressing GIN interneurons had much weaker thalamocortical responses than FS cells. The Discussion, “TC circuitry” (page unavailable), likewise describes their responses to thalamic input as much weaker. (LLM, conf=0.92)
- Supportedcites [22] Ji, X.-Y. et al. Thalamocortical innervation pattern in mouse auditory and visual cortex: laminar and cell-type specificity. Cereb. Cortex 26, 2612–2625 (2016). source
The section ‘A Matching Pattern of Thalamocortical Innervation of PV Neurons’ reports strong direct thalamic drive to PV neurons. ‘Laminar Patterns of Thalamocortical Innervation of A1 Inhibitory Neurons’ reports much weaker inputs to SOM neurons, with most outside layer 4 receiving essentially none. No page numbers are available in our copy. (LLM, conf=0.93)
plaincorrelational- Asserted: passes — The authors put it forward as true.
- Checkable: passes — It can be checked against evidence.
- Load-bearing: fails — The paper’s conclusions may not depend on it.
- Based: passes — The paper gives a reason why it holds.
Probably not a substantial claim. The paper’s conclusions may not depend on it. It may state two separate claims as one.
- Supported
The cited sources support only part of this claim — read each source’s verdict below.
In the paper
“Recent evidence indicates that most, if not all, L4 SOM+ cells in mouse S1 have axons mostly localized within L4, in stark contrast to typical MCs15, and have been called non-Martinotti cells (NMCs)13.”
§ Layer 4 of mouse neocortex differs in cell types and circuit organization between sensory areas > Results > V1 differs from S1 in major L4 cell types
What the sources say
- Partly supportedcites [15] Xu, H., Jeong, H.-Y., Tremblay, R. & Rudy, B. Neocortical somatostatin-expressing GABAergic interneurons disinhibit the thalamorecipient layer 4. Neuron 77, 155–167 (2013). sourceExperimental — accuracy not yet measured
The Results section (‘Layer 4 SOM INs Mainly Target Layer 4’; page unavailable) says that most, if not all, layer 4 SOM interneurons in mouse somatosensory cortex preferentially target layer 4, unlike Martinotti cells. Our copy describes them as ‘X94-cell like’ but does not show that this paper calls them ‘non-Martinotti cells.’ (LLM, conf=0.83)
- Supportedcites [13] Yavorska, I. & Wehr, M. Somatostatin-expressing inhibitory interneurons in cortical circuits. Front. Neural Circuits 10, 76 (2016). source
The Layer 4 section says most L4 SOM cells differ from typical Martinotti cells and usually keep their axons within the same layer. The section on distinct SOM-cell types calls the locally projecting X94 cells non-Martinotti and says other L4 SOM cells have similarly local axons. The paper notes sparse L4 Martinotti cells in rat, consistent with the claim’s qualification about mouse S1. (LLM, conf=0.91)
hedgedn = 19- Asserted: passes — The authors put it forward as true.
- Checkable: passes — It can be checked against evidence.
- Load-bearing: passes — The paper’s conclusions depend on it.
- Based: passes — The paper gives a reason why it holds.
It may state two separate claims as one.
- Partly supported
The cited sources support only part of this claim — read each source’s verdict below.
In the paper
“However, this did not seem to strongly affect the studies of local circuits in the past29,78.”
§ Layer 4 of mouse neocortex differs in cell types and circuit organization between sensory areas > Methods > Electrophysiological recordings
What the sources say
- Could not verifycites [29] Jiang, X. et al. Principles of connectivity among morphologically defined cell types in adult neocortex. Science 350, aac9462–aac9462 (2015). sourceExperimental — accuracy not yet measured
The Introduction describes earlier studies of local-circuit connectivity, and the Conclusion compares this study’s findings with earlier work. Neither section says that a potential underestimation had little effect on past studies. Searches for underestimation and slice-related connectivity bias found no passage addressing that assessment. (LLM, conf=0.72)
- Supportedcites [78] Qi, G., Radnikow, G. & Feldmeyer, D. Electrophysiological and morphological characterization of neuronal microcircuits in acute brain slices using paired patch-clamp recordings. J. Vis. Exp. 95, e52358 (2015). source
The Discussion (page unavailable) says local axonal projections in acute slices, particularly those of local interneurons, undergo relatively little truncation and yield largely correct connectivity estimates. This supports the hedged claim for local circuits; the paper contrasts them with longer-range connections, for which connectivity estimates are problematic. (LLM, conf=0.86)
hedged- Asserted: passes — The authors put it forward as true.
- Checkable: passes — It can be checked against evidence.
- Load-bearing: fails — The paper’s conclusions may not depend on it.
- Based: passes — The paper gives a reason why it holds.
Probably not a substantial claim. The paper’s conclusions may not depend on it.
- Could not verify
A result the paper reports from its own data — it cites no other source for it, so there is none to check. The quote shows it is in the paper.
In the paper
“and were differentially integrated into the local circuit with only S1 neurons receiving local excitatory input.”
§ Layer 4 of mouse neocortex differs in cell types and circuit organization between sensory areas > Abstract
plaincorrelational- Asserted: passes — The authors put it forward as true.
- Checkable: passes — It can be checked against evidence.
- Load-bearing: passes — The paper’s conclusions depend on it.
- Based: passes — The paper gives a reason why it holds.
It may state two separate claims as one.
A result the paper reports from its own data — it cites no other source for it, so there is none to check. The quote shows it is in the paper.
In the paper
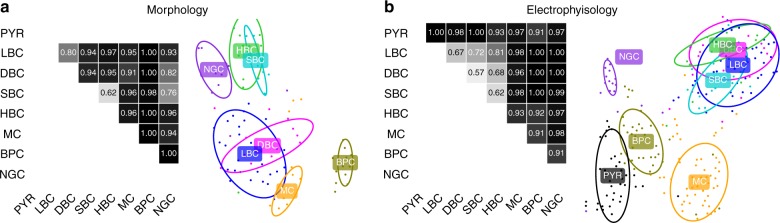
“Across all 21 pairs, the average cross-validated classification accuracy was 0.92, with most pairs discriminated almost perfectly (Fig. 2a, left).”
§ Layer 4 of mouse neocortex differs in cell types and circuit organization between sensory areas > Results > Morphological cell types in L4 of adult mouse visual cortex
plaincorrelationaln = 92- Asserted: passes — The authors put it forward as true.
- Checkable: passes — It can be checked against evidence.
- Load-bearing: passes — The paper’s conclusions depend on it.
- Based: passes — The paper gives a reason why it holds.
It may state two separate claims as one.
A result the paper reports from its own data — it cites no other source for it, so there is none to check. The quote shows it is in the paper.
In the paper
“Two-dimensional visualization of this dataset using t-SNE (Fig. 2b) showed that all four PV+ cell types overlapped in one group of electrophysiologically similar FS neurons, while the other four types (PYR, NGC, BPC, and MC) each had distinct firing patterns.”
§ Layer 4 of mouse neocortex differs in cell types and circuit organization between sensory areas > Results > Morphological cell types in L4 of adult mouse visual cortex
plaincorrelationaln = 235- Asserted: passes — The authors put it forward as true.
- Checkable: passes — It can be checked against evidence.
- Load-bearing: passes — The paper’s conclusions depend on it.
- Based: passes — The paper gives a reason why it holds.
It may state two separate claims as one.
A result the paper reports from its own data — it cites no other source for it, so there is none to check. The quote shows it is in the paper.
In the paper
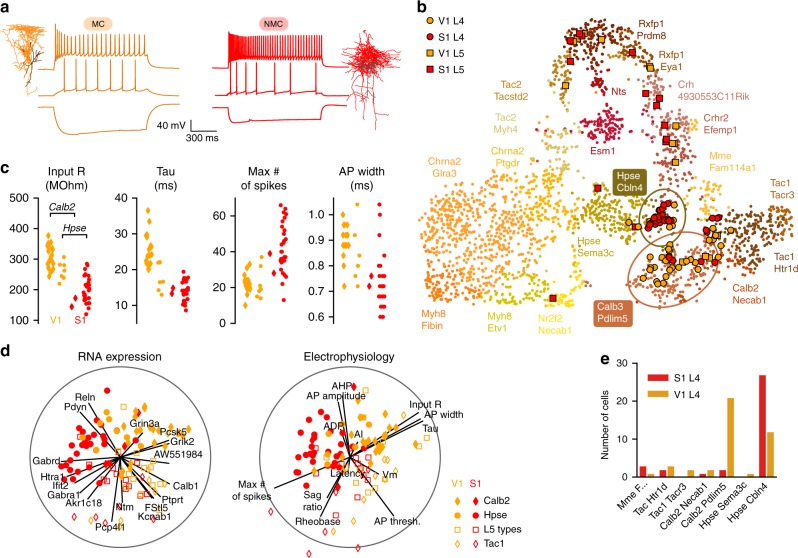
“The NMCs also differed in their firing pattern from MCs recorded in V1: they had a higher maximal firing rate, a lower AP width, and a lower membrane time constant (Fig. 4a, Supplementary Fig. 5).”
§ Layer 4 of mouse neocortex differs in cell types and circuit organization between sensory areas > Results > V1 differs from S1 in major L4 cell types
plaincorrelational- Asserted: passes — The authors put it forward as true.
- Checkable: passes — It can be checked against evidence.
- Load-bearing: passes — The paper’s conclusions depend on it.
- Based: passes — The paper gives a reason why it holds.
It may state two separate claims as one.
A result the paper reports from its own data — it cites no other source for it, so there is none to check. The quote shows it is in the paper.
In the paper
“all somatostatin-positive (SOM+) non-fast-spiking interneurons were Martinotti cells”
- Also stated in: § Morphological cell types in L4 of adult mouse visual cortex · plain
“Martinotti cells (MCs; 20.1%, 47/234), characterized by an ascending axon that projected to L1 and by the large membrane time constant, were the only SOM+ cell type.”
§ Layer 4 of mouse neocortex differs in cell types and circuit organization between sensory areas > Abstract
plain- Asserted: passes — The authors put it forward as true.
- Checkable: passes — It can be checked against evidence.
- Load-bearing: passes — The paper’s conclusions depend on it.
- Based: passes — The paper gives a reason why it holds.
It may state two separate claims as one.
- Also stated in: § Morphological cell types in L4 of adult mouse visual cortex · plain
A result the paper reports from its own data — it cites no other source for it, so there is none to check. The quote shows it is in the paper.
In the paper
“VIP+ neurons were represented by the bipolar cells (BPCs; 12.4%, 29/234) with a small soma, dendrites extending to L1 and L5, an axon projecting mostly downward to L5, and an irregular firing pattern.”
§ Layer 4 of mouse neocortex differs in cell types and circuit organization between sensory areas > Results > Morphological cell types in L4 of adult mouse visual cortex
plain- Asserted: passes — The authors put it forward as true.
- Checkable: passes — It can be checked against evidence.
- Load-bearing: unclear — It is unclear whether the paper’s conclusions depend on it.
- Based: passes — The paper gives a reason why it holds.
It may state two separate claims as one.
A result the paper reports from its own data — it cites no other source for it, so there is none to check. The quote shows it is in the paper.
In the paper
“the most common were large basket cells (LBCs; 37.6% among the interneurons labeled in Viaat-Cre, 88/234), followed by small basket cells (SBCs; 9.4%, 22/234), double-bouquet basket cells (DBCs; 5.6%, 13/234), and horizontally elongated basket cells (HBCs; 3.4%, 8/234).”
§ Layer 4 of mouse neocortex differs in cell types and circuit organization between sensory areas > Results > Morphological cell types in L4 of adult mouse visual cortex
plain- Asserted: passes — The authors put it forward as true.
- Checkable: passes — It can be checked against evidence.
- Load-bearing: unclear — It is unclear whether the paper’s conclusions depend on it.
- Based: passes — The paper gives a reason why it holds.
It may state two separate claims as one.
- The authors state this as an assumption: All four PV+ fast-spiking cell types were basket cells with different axonal morphologies.
A result the paper reports from its own data — it cites no other source for it, so there is none to check. The quote shows it is in the paper.
In the paper
“We found four distinct types of PV+, fast-spiking (FS) cells with narrow AP width, high maximal firing rate, and thick axons.”
§ Layer 4 of mouse neocortex differs in cell types and circuit organization between sensory areas > Results > Morphological cell types in L4 of adult mouse visual cortex
plain- Asserted: passes — The authors put it forward as true.
- Checkable: passes — It can be checked against evidence.
- Load-bearing: passes — The paper’s conclusions depend on it.
- Based: passes — The paper gives a reason why it holds.
It may state two separate claims as one.
None of the sources cited for this claim have been checked yet.
In the paper
“Previous literature suggested that Martinotti cells in L5 form two groups with different morphology and/or electrophysiology29,42, but we did not observe such heterogeneity in L4: in particular, none of the MCs showed a rebound firing after stimulation offset42.”
§ Layer 4 of mouse neocortex differs in cell types and circuit organization between sensory areas > Results > Morphological cell types in L4 of adult mouse visual cortex
What the sources say
- Not checked yetcites [29] Jiang, X. et al. Principles of connectivity among morphologically defined cell types in adult neocortex. Science 350, aac9462–aac9462 (2015). source
- Not checked yetcites [42] Nigro, M. J., Hashikawa-Yamasaki, Y. & Rudy, B. Diversity and connectivity of layer 5 somatostatin-expressing interneurons in the mouse barrel cortex. J. Neurosci. 38, 1622–1633 (2018). source
plain- Asserted: passes — The authors put it forward as true.
- Checkable: passes — It can be checked against evidence.
- Load-bearing: unclear — It is unclear whether the paper’s conclusions depend on it.
- Based: passes — The paper gives a reason why it holds.
It may state two separate claims as one.
A result the paper reports from its own data — it cites no other source for it, so there is none to check. The quote shows it is in the paper.
In the paper
“Most L4 cells (81%, 62/77) were assigned to Sst Calb2 Pdlim and Sst Hpse Cbln4 transcriptomic types (Fig. 4b, e), with S1 cells falling almost exclusively into the Hpse type (27/29) and V1 cells falling preferentially into the Calb2 type (21/33) (p < 0.0001, Fisher’s exact test).”
§ Layer 4 of mouse neocortex differs in cell types and circuit organization between sensory areas > Results > V1 differs from S1 in major L4 cell types
plaincorrelational- Asserted: passes — The authors put it forward as true.
- Checkable: passes — It can be checked against evidence.
- Load-bearing: passes — The paper’s conclusions depend on it.
- Based: passes — The paper gives a reason why it holds.
It may state two separate claims as one.
A result the paper reports from its own data — it cites no other source for it, so there is none to check. The quote shows it is in the paper.
In the paper
“Indeed, we found that in S1, almost all L4 SOM+ neurons we recovered (96.2%, 76/79, from n = 19 SOM-Cre/Ai9 mice) had NMC morphology characterized by a thin, highly ramifying axon mostly residing within L4 (Fig. 3b). Only two cells showed an ascending axon projecting to L1 typical of MCs (2.5%, 2/79) and one was characterized by a thick axon branching similarly to LBC with a FS firing pattern (1.3”
§ Layer 4 of mouse neocortex differs in cell types and circuit organization between sensory areas > Results > V1 differs from S1 in major L4 cell types
plainn = 19- Asserted: passes — The authors put it forward as true.
- Checkable: passes — It can be checked against evidence.
- Load-bearing: passes — The paper’s conclusions depend on it.
- Based: passes — The paper gives a reason why it holds.
It may state two separate claims as one.
None of the sources cited for this claim have been checked yet.
In the paper
“A small fraction of SOM+ neurons exhibited an FS firing pattern and their morphological features matched those of LBCs (8.2%, 5/61; Supplementary Fig. 2), in agreement with the previous reports that due to potential off-target recombination, ~5–20% of neurons labeled in SOM-Cre line are FS29,43,44 and PV+/SOM− at the protein level43.”
§ Layer 4 of mouse neocortex differs in cell types and circuit organization between sensory areas > Results > Morphological cell types in L4 of adult mouse visual cortex
What the sources say
- Not checked yetcites [29] Jiang, X. et al. Principles of connectivity among morphologically defined cell types in adult neocortex. Science 350, aac9462–aac9462 (2015). source
- Not checked yetcites [43] Hu, H., Cavendish, J. Z. & Agmon, A. Not all that glitters is gold: off-target recombination in the somatostatin–IRES-Cre mouse line labels a subset of fast-spiking interneurons. Front. Neural Circuits 7, 195 (2013). source
- Not checked yetcites [44] Reimer, J. et al. Pupil fluctuations track fast switching of cortical states during quiet wakefulness. Neuron 84, 355–362 (2014). source
plaincorrelational- Asserted: passes — The authors put it forward as true.
- Checkable: passes — It can be checked against evidence.
- Load-bearing: unclear — It is unclear whether the paper’s conclusions depend on it.
- Based: passes — The paper gives a reason why it holds.
It may state two separate claims as one.
- The authors state this as an assumption: All four PV+ fast-spiking cell types were basket cells with different axonal morphologies.
A result the paper reports from its own data — it cites no other source for it, so there is none to check. The quote shows it is in the paper.
In the paper
“PYRs exhibited large action potential (AP) width, high AP amplitude, and shallow afterhyperpolarization (AHP), which clearly discriminated them from GABAergic interneurons”
§ Layer 4 of mouse neocortex differs in cell types and circuit organization between sensory areas > Results > Morphological cell types in L4 of adult mouse visual cortex
boostedcorrelational- Asserted: passes — The authors put it forward as true.
- Checkable: passes — It can be checked against evidence.
- Load-bearing: unclear — It is unclear whether the paper’s conclusions depend on it.
- Based: passes — The paper gives a reason why it holds.
It may state two separate claims as one.
A result the paper reports from its own data — it cites no other source for it, so there is none to check. The quote shows it is in the paper.
In the paper
“Nearly all excitatory neurons were pyramidal”
- Also stated in: § Morphological cell types in L4 of adult mouse visual cortex · plain
“Out of the 578 excitatory cells, 573 (99.1%) were pyramidal neurons (PYR), characterized by apical dendrites extending into layer 1 (L1)”
§ Layer 4 of mouse neocortex differs in cell types and circuit organization between sensory areas > Abstract
plain- Asserted: passes — The authors put it forward as true.
- Checkable: passes — It can be checked against evidence.
- Load-bearing: passes — The paper’s conclusions depend on it.
- Based: passes — The paper gives a reason why it holds.
It may state two separate claims as one.
- Also stated in: § Morphological cell types in L4 of adult mouse visual cortex · plain
A result the paper reports from its own data — it cites no other source for it, so there is none to check. The quote shows it is in the paper.
In the paper
“Visualization of this dataset with t-SNE (Fig. 2a, right) indicated that SBC/HBC types were partially overlapping, as well as LBC/DBC.”
§ Layer 4 of mouse neocortex differs in cell types and circuit organization between sensory areas > Results > Morphological cell types in L4 of adult mouse visual cortex
hedgedcorrelationaln = 92- Asserted: passes — The authors put it forward as true.
- Checkable: passes — It can be checked against evidence.
- Load-bearing: unclear — It is unclear whether the paper’s conclusions depend on it.
- Based: passes — The paper gives a reason why it holds.
It may state two separate claims as one.
The paper states this without a source or data behind it here, so there is nothing to check it against. The quote shows it is in the paper.
In the paper
“In S1, by contrast, axons of L4 NMCs were more localized, matching the more compact dendritic structure of spiny stellate cells.”
§ Layer 4 of mouse neocortex differs in cell types and circuit organization between sensory areas > Discussion
plaincorrelational- Asserted: passes — The authors put it forward as true.
- Checkable: passes — It can be checked against evidence.
- Load-bearing: passes — The paper’s conclusions depend on it.
- Based: passes — The paper gives a reason why it holds.
It may state two separate claims as one.
A result the paper reports from its own data — it cites no other source for it, so there is none to check. The quote shows it is in the paper.
In the paper
“The L5 SOM+ cells that we sequenced in both areas mostly mapped to a different set of transcriptomic types than the L4 SOM+ cells, but there were no apparent differences between S1 and V1 in terms of transcriptomic cell types (Fig. 4b).”
§ Layer 4 of mouse neocortex differs in cell types and circuit organization between sensory areas > Results > V1 differs from S1 in major L4 cell types
hedged- Asserted: passes — The authors put it forward as true.
- Checkable: passes — It can be checked against evidence.
- Load-bearing: unclear — It is unclear whether the paper’s conclusions depend on it.
- Based: passes — The paper gives a reason why it holds.
It may state two separate claims as one.
None of the sources cited for this claim have been checked yet.
In the paper
“We found that LBCs followed the same connectivity rules as previously found in other layers29,49. PYRs connected to LBCs with probability 12.5% (38/303), MCs inhibited LBCs with probability 32.6% (15/46), and LBCs inhibited each other (36.7%, 75/204), MCs (13.0%, 6/46) and PYRs (25.7%, 78/303).”
§ Layer 4 of mouse neocortex differs in cell types and circuit organization between sensory areas > Results > Connectivity among excitatory and SOM+ neurons
What the sources say
- Not checked yetcites [29] Jiang, X. et al. Principles of connectivity among morphologically defined cell types in adult neocortex. Science 350, aac9462–aac9462 (2015). source
- Not checked yetcites [49] Pfeffer, C. K., Xue, M., He, M., Huang, Z. J. & Scanziani, M. Inhibition of inhibition in visual cortex: the logic of connections between molecularly distinct interneurons. Nat. Neurosci. 16, 1068–1076 (2013). source
plaincorrelational- Asserted: passes — The authors put it forward as true.
- Checkable: passes — It can be checked against evidence.
- Load-bearing: passes — The paper’s conclusions depend on it.
- Based: passes — The paper gives a reason why it holds.
It may state two separate claims as one.
- The authors state this as an assumption: All four PV+ fast-spiking cell types were basket cells with different axonal morphologies.
None of the sources cited for this claim have been checked yet.
In the paper
“Notably, the connection probability between PYRs in V1 L4 was very low, consistent with our previous work in other layers in adult animals29, but in contrast to the findings in young and juvenile rodents51,52.”
§ Layer 4 of mouse neocortex differs in cell types and circuit organization between sensory areas > Results > Connectivity among excitatory and SOM+ neurons
What the sources say
- Not checked yetcites [29] Jiang, X. et al. Principles of connectivity among morphologically defined cell types in adult neocortex. Science 350, aac9462–aac9462 (2015). source
- Not checked yetcites [51] Markram, H., Lübke, J., Frotscher, M., Roth, A. & Sakmann, B. Physiology and anatomy of synaptic connections between thick tufted pyramidal neurones in the developing rat neocortex. J. Physiol. 500, 409–440 (1997). source
- Not checked yetcites [52] Song, S., Sjöström, P. J., Reigl, M., Nelson, S. & Chklovskii, D. B. Correction: highly nonrandom features of synaptic connectivity in local cortical circuits. PLoS Biol. 3, e350 (2005). source
plain- Asserted: passes — The authors put it forward as true.
- Checkable: passes — It can be checked against evidence.
- Load-bearing: unclear — It is unclear whether the paper’s conclusions depend on it.
- Based: passes — The paper gives a reason why it holds.
It may state two separate claims as one.
A result the paper reports from its own data — it cites no other source for it, so there is none to check. The quote shows it is in the paper.
In the paper
“In contrast, we did not find any connections (0%, 0/142) from local excitatory neurons to MCs in V1 (p = 0.0002, Fisher’s exact text).”
§ Layer 4 of mouse neocortex differs in cell types and circuit organization between sensory areas > Results > Connectivity among excitatory and SOM+ neurons
plain- Asserted: passes — The authors put it forward as true.
- Checkable: passes — It can be checked against evidence.
- Load-bearing: passes — The paper’s conclusions depend on it.
- Based: passes — The paper gives a reason why it holds.
It may state two separate claims as one.
A result the paper reports from its own data — it cites no other source for it, so there is none to check. The quote shows it is in the paper.
In the paper
“but not significantly different from it (p = 0.48, Fisher’s exact test)”
§ Layer 4 of mouse neocortex differs in cell types and circuit organization between sensory areas > Results > Connectivity among excitatory and SOM+ neurons
plainn = 8- Asserted: passes — The authors put it forward as true.
- Checkable: passes — It can be checked against evidence.
- Load-bearing: passes — The paper’s conclusions depend on it.
- Based: passes — The paper gives a reason why it holds.
The quote only partly states this claim.
A result the paper reports from its own data — it cites no other source for it, so there is none to check. The quote shows it is in the paper.
In the paper
“These cells show an electrophysiological profile intermediate between MCs and NMCs, but morphologically correspond to MCs based on our data.”
§ Layer 4 of mouse neocortex differs in cell types and circuit organization between sensory areas > Discussion
plaincorrelational- Asserted: passes — The authors put it forward as true.
- Checkable: passes — It can be checked against evidence.
- Load-bearing: passes — The paper’s conclusions depend on it.
- Based: passes — The paper gives a reason why it holds.
It may state two separate claims as one.
In the paper
“We also found that LBCs were electrically coupled to each other with probability 27.5% (28/102) but were never electrically coupled to MCs (0/23), in agreement with previous findings that gap junctions exist between inhibitory cells of the same type50.”
§ Layer 4 of mouse neocortex differs in cell types and circuit organization between sensory areas > Results > Connectivity among excitatory and SOM+ neurons
What the sources say
- Not checked yetcites [50] Galarreta, M. & Hestrin, S. Electrical synapses between GABA-releasing interneurons. Nat. Rev. Neurosci. 2, 425–433 (2001). source
plain- Asserted: passes — The authors put it forward as true.
- Checkable: passes — It can be checked against evidence.
- Load-bearing: unclear — It is unclear whether the paper’s conclusions depend on it.
- Based: passes — The paper gives a reason why it holds.
It may state two separate claims as one.
- The authors state this as an assumption: All four PV+ fast-spiking cell types were basket cells with different axonal morphologies.
A result the paper reports from its own data — it cites no other source for it, so there is none to check. The quote shows it is in the paper.
In the paper
“and projected to excitatory population in L4.”
§ Layer 4 of mouse neocortex differs in cell types and circuit organization between sensory areas > Discussion
plaincorrelational- Asserted: passes — The authors put it forward as true.
- Checkable: passes — It can be checked against evidence.
- Load-bearing: passes — The paper’s conclusions depend on it.
- Based: passes — The paper gives a reason why it holds.
It may state two separate claims as one.
A result the paper reports from its own data — it cites no other source for it, so there is none to check. The quote shows it is in the paper.
In the paper
“Across genes, there was a clear inverse relationship between μ and τ, that roughly followed exponential law τ ≈ exp(−1.5⋅μ + a) for some horizontal offset a.”
§ Layer 4 of mouse neocortex differs in cell types and circuit organization between sensory areas > Methods > Data analysis of the RNA-seq data
boostedcorrelational- Asserted: passes — The authors put it forward as true.
- Checkable: passes — It can be checked against evidence.
- Load-bearing: fails — The paper’s conclusions may not depend on it.
- Based: passes — The paper gives a reason why it holds.
Probably not a substantial claim. The paper’s conclusions may not depend on it.
A result the paper reports from its own data — it cites no other source for it, so there is none to check. The quote shows it is in the paper.
In the paper
“All the remaining n = 110 cells mapped to the Sst types.”
§ Layer 4 of mouse neocortex differs in cell types and circuit organization between sensory areas > Methods > Data analysis of the RNA-seq data
plainn = 110- Asserted: passes — The authors put it forward as true.
- Checkable: passes — It can be checked against evidence.
- Load-bearing: fails — The paper’s conclusions may not depend on it.
- Based: passes — The paper gives a reason why it holds.
Probably not a substantial claim. The paper’s conclusions may not depend on it.
None of the sources cited for this claim have been checked yet.
In the paper
“Tissue shrinkage due to the fixation and staining procedures was about 10–20%, consistent with previous studies29,51.”
§ Layer 4 of mouse neocortex differs in cell types and circuit organization between sensory areas > Methods > Staining and morphology recovery
What the sources say
- Not checked yetcites [29] Jiang, X. et al. Principles of connectivity among morphologically defined cell types in adult neocortex. Science 350, aac9462–aac9462 (2015). source
- Not checked yetcites [51] Markram, H., Lübke, J., Frotscher, M., Roth, A. & Sakmann, B. Physiology and anatomy of synaptic connections between thick tufted pyramidal neurones in the developing rat neocortex. J. Physiol. 500, 409–440 (1997). source
plaindirect- Asserted: passes — The authors put it forward as true.
- Checkable: passes — It can be checked against evidence.
- Load-bearing: fails — The paper’s conclusions may not depend on it.
- Based: passes — The paper gives a reason why it holds.
Probably not a substantial claim. The paper’s conclusions may not depend on it.
A result the paper reports from its own data — it cites no other source for it, so there is none to check. The quote shows it is in the paper.
In the paper
“ADP because it was equal to zero for most neurons”
§ Layer 4 of mouse neocortex differs in cell types and circuit organization between sensory areas > Methods > Data analysis of the electrophysiological features
plain- Asserted: passes — The authors put it forward as true.
- Checkable: passes — It can be checked against evidence.
- Load-bearing: fails — The paper’s conclusions may not depend on it.
- Based: passes — The paper gives a reason why it holds.
Probably not a substantial claim. The paper’s conclusions may not depend on it.
In the paper
“The remaining n = 114 cells were mapped to the full set of 133 transcriptomic types identified in Tasic et al.25”
§ Layer 4 of mouse neocortex differs in cell types and circuit organization between sensory areas > Methods > Data analysis of the RNA-seq data
What the sources say
- Not checked yetcites Tasic et al.25 Tasic, B. et al. Shared and distinct transcriptomic cell types across neocortical areas. Nature 563, 72–78 (2018). source
plainn = 114- Asserted: passes — The authors put it forward as true.
- Checkable: passes — It can be checked against evidence.
- Load-bearing: fails — The paper’s conclusions may not depend on it.
- Based: passes — The paper gives a reason why it holds.
Probably not a substantial claim. The paper’s conclusions may not depend on it.
A result the paper reports from its own data — it cites no other source for it, so there is none to check. The quote shows it is in the paper.
In the paper
“Furthermore, we found differences in the connections from excitatory neurons to SOM+ interneurons”
§ Layer 4 of mouse neocortex differs in cell types and circuit organization between sensory areas > Discussion
plaincorrelational- Asserted: passes — The authors put it forward as true.
- Checkable: passes — It can be checked against evidence.
- Load-bearing: passes — The paper’s conclusions depend on it.
- Based: passes — The paper gives a reason why it holds.
The quote only partly states this claim.
A result the paper reports from its own data — it cites no other source for it, so there is none to check. The quote shows it is in the paper.
In the paper
“In our V1 L4 dataset, we identified seven morphological types of interneurons but only four electrophysiological types (Fig. 2)”
§ Layer 4 of mouse neocortex differs in cell types and circuit organization between sensory areas > Discussion
plain- Asserted: passes — The authors put it forward as true.
- Checkable: passes — It can be checked against evidence.
- Load-bearing: passes — The paper’s conclusions depend on it.
- Based: passes — The paper gives a reason why it holds.
It may state two separate claims as one.
A result the paper reports from its own data — it cites no other source for it, so there is none to check. The quote shows it is in the paper.
In the paper
“latency because it had high outliers among the FS types”
§ Layer 4 of mouse neocortex differs in cell types and circuit organization between sensory areas > Methods > Data analysis of the electrophysiological features
plaincorrelational- Asserted: passes — The authors put it forward as true.
- Checkable: passes — It can be checked against evidence.
- Load-bearing: fails — The paper’s conclusions may not depend on it.
- Based: passes — The paper gives a reason why it holds.
Probably not a substantial claim. The paper’s conclusions may not depend on it.
A result the paper reports from its own data — it cites no other source for it, so there is none to check. The quote shows it is in the paper.
In the paper
“The total number of sequenced cells was n = 118.”
§ Layer 4 of mouse neocortex differs in cell types and circuit organization between sensory areas > Methods > Data analysis of the RNA-seq data
plainn = 118- Asserted: passes — The authors put it forward as true.
- Checkable: passes — It can be checked against evidence.
- Load-bearing: fails — The paper’s conclusions may not depend on it.
- Based: passes — The paper gives a reason why it holds.
Probably not a substantial claim. The paper’s conclusions may not depend on it.
None of the sources cited for this claim have been checked yet.
In the paper
“Several recent studies revealed that the somatostatin-positive (SOM+) interneurons form a single morphological population that has been called non-Martinotti cells13 since their axons mainly target L414,15, in contrast to typical Martinotti cells, which target L1.”
§ Layer 4 of mouse neocortex differs in cell types and circuit organization between sensory areas > Introduction
What the sources say
- Not checked yetcites [13] Yavorska, I. & Wehr, M. Somatostatin-expressing inhibitory interneurons in cortical circuits. Front. Neural Circuits 10, 76 (2016). source
- Not checked yetcites [14] Ma, Y., Hu, H., Berrebi, A. S., Mathers, P. H. & Agmon, A. Distinct subtypes of somatostatin-containing neocortical interneurons revealed in transgenic mice. J. Neurosci. 26, 5069–5082 (2006). source
- Not checked yetcites [15] Xu, H., Jeong, H.-Y., Tremblay, R. & Rudy, B. Neocortical somatostatin-expressing GABAergic interneurons disinhibit the thalamorecipient layer 4. Neuron 77, 155–167 (2013). source
plain- Asserted: passes — The authors put it forward as true.
- Checkable: passes — It can be checked against evidence.
- Load-bearing: fails — The paper’s conclusions may not depend on it.
- Based: passes — The paper gives a reason why it holds.
Probably not a substantial claim. The paper’s conclusions may not depend on it. It may state two separate claims as one.
In the paper
“In this stereotypical architecture, layer 4 (L4) is the main direct target of sensory inputs coming from the thalamus, thus acting as the first level of cortical processing for sensory signals1.”
§ Layer 4 of mouse neocortex differs in cell types and circuit organization between sensory areas > Introduction
What the sources say
- Not checked yetcites [1] Harris, K. D. & Shepherd, G. M. G. The neocortical circuit: themes and variations. Nat. Neurosci. 18, 170–181 (2015). source
plaindirect- Asserted: passes — The authors put it forward as true.
- Checkable: passes — It can be checked against evidence.
- Load-bearing: passes — The paper’s conclusions depend on it.
- Based: passes — The paper gives a reason why it holds.
Probably not a substantial claim. It may state two separate claims as one.
In the paper
“In contrast, inhibitory interneurons are highly diverse in terms of their genetic markers, morphologies and electrophysiological properties10.”
§ Layer 4 of mouse neocortex differs in cell types and circuit organization between sensory areas > Introduction
What the sources say
- Not checked yetcites [10] Tremblay, R., Lee, S. & Rudy, B. GABAergic interneurons in the neocortex: from cellular properties to circuits. Neuron 91, 260–292 (2016). source
plain- Asserted: passes — The authors put it forward as true.
- Checkable: passes — It can be checked against evidence.
- Load-bearing: fails — The paper’s conclusions may not depend on it.
- Based: passes — The paper gives a reason why it holds.
Probably not a substantial claim. The paper’s conclusions may not depend on it.
None of the sources cited for this claim have been checked yet.
In the paper
“Previous studies have reported three types of fast-spiking (FS), parvalbumin-positive (PV+) interneurons11 and five types of non-FS interneurons12, all of which have distinct morphologies.”
§ Layer 4 of mouse neocortex differs in cell types and circuit organization between sensory areas > Introduction
What the sources say
- Not checked yetcites [11] Koelbl, C., Helmstaedter, M., Lübke, J. & Feldmeyer, D. A Barrel-related interneuron in layer 4 of rat somatosensory cortex with a high intrabarrel connectivity. Cereb. Cortex 25, 713–725 (2013). source
- Not checked yetcites [12] Emmenegger, V., Qi, G., Wang, H. & Feldmeyer, D. Morphological and functional characterization of non-fast-spiking GABAergic interneurons in layer 4 microcircuitry of rat barrel cortex. Cereb. Cortex 28, 1439–1457 (2018). source
plain- Asserted: passes — The authors put it forward as true.
- Checkable: passes — It can be checked against evidence.
- Load-bearing: fails — The paper’s conclusions may not depend on it.
- Based: passes — The paper gives a reason why it holds.
Probably not a substantial claim. The paper’s conclusions may not depend on it. It may state two separate claims as one.
In the paper
“Three cells (excluded from the cell counts given above and from further analysis) had fast-spiking firing pattern and mapped to Pvalb Reln Itm2a transcriptomic type, likely corresponding to the basket cells that we found labeled in the SOM-Cre line (Fig. 3). These three cells did not express SOM (zero read count), suggesting that they could have transiently expressed it during development, as hyp”
§ Layer 4 of mouse neocortex differs in cell types and circuit organization between sensory areas > Results > V1 differs from S1 in major L4 cell types
What the sources say
- Not checked yetcites [43] Hu, H., Cavendish, J. Z. & Agmon, A. Not all that glitters is gold: off-target recombination in the somatostatin–IRES-Cre mouse line labels a subset of fast-spiking interneurons. Front. Neural Circuits 7, 195 (2013). source
hedgedcorrelational- Asserted: passes — The authors put it forward as true.
- Checkable: passes — It can be checked against evidence.
- Load-bearing: fails — The paper’s conclusions may not depend on it.
- Based: passes — The paper gives a reason why it holds.
Probably not a substantial claim. The paper’s conclusions may not depend on it. It may state two separate claims as one.
In the paper
“We did not encounter any labeled NGCs in PV-Cre, SST-Cre, or VIP-Cre lines, suggesting that they belonged to the Lamp5 transcriptomic family25.”
§ Layer 4 of mouse neocortex differs in cell types and circuit organization between sensory areas > Results > Morphological cell types in L4 of adult mouse visual cortex
What the sources say
- Not checked yetcites [25] Tasic, B. et al. Shared and distinct transcriptomic cell types across neocortical areas. Nature 563, 72–78 (2018). source
hedged- Asserted: passes — The authors put it forward as true.
- Checkable: passes — It can be checked against evidence.
- Load-bearing: unclear — It is unclear whether the paper’s conclusions depend on it.
- Based: passes — The paper gives a reason why it holds.
It may state two separate claims as one.
None of the sources cited for this claim have been checked yet.
In the paper
“The quality of the mapping was equally good for V1 and S1 cells (Supplementary Fig. 7), suggesting that the V1 + ALM dataset is a reasonable reference for S1 interneurons, in agreement with the idea that inhibitory transcriptomic cell types are shared across cortical regions25,26.”
§ Layer 4 of mouse neocortex differs in cell types and circuit organization between sensory areas > Results > V1 differs from S1 in major L4 cell types
What the sources say
- Not checked yetcites [25] Tasic, B. et al. Shared and distinct transcriptomic cell types across neocortical areas. Nature 563, 72–78 (2018). source
- Not checked yetcites [26] Nowakowski, T. J. et al. Regulation of cell-type-specific transcriptomes by microRNA networks during human brain development. Nat. Neurosci. 21, 1784–1792 (2018). source
hedgedn = 35- Asserted: passes — The authors put it forward as true.
- Checkable: passes — It can be checked against evidence.
- Load-bearing: passes — The paper’s conclusions depend on it.
- Based: passes — The paper gives a reason why it holds.
It may state two separate claims as one.
None of the sources cited for this claim have been checked yet.
In the paper
“Recent large-scale studies of transcriptomic cell types in mouse and human cortex showed that most interneuron types are shared between cortical areas while the excitatory types are predominantly area-specific25,26.”
§ Layer 4 of mouse neocortex differs in cell types and circuit organization between sensory areas > Introduction
What the sources say
- Not checked yetcites [25] Tasic, B. et al. Shared and distinct transcriptomic cell types across neocortical areas. Nature 563, 72–78 (2018). source
- Not checked yetcites [26] Nowakowski, T. J. et al. Regulation of cell-type-specific transcriptomes by microRNA networks during human brain development. Nat. Neurosci. 21, 1784–1792 (2018). source
plaincorrelational- Asserted: passes — The authors put it forward as true.
- Checkable: passes — It can be checked against evidence.
- Load-bearing: passes — The paper’s conclusions depend on it.
- Based: passes — The paper gives a reason why it holds.
Probably not a substantial claim. It may state two separate claims as one.
A conclusion the paper draws from its own results — it cites no other source for it, so there is none to check. The quote shows it is in the paper.
In the paper
“Overall, this analysis suggests that while most morphological classes can be very well discriminated, some may be partially overlapping.”
§ Layer 4 of mouse neocortex differs in cell types and circuit organization between sensory areas > Results > Morphological cell types in L4 of adult mouse visual cortex
hedgedn = 92- Asserted: passes — The authors put it forward as true.
- Checkable: passes — It can be checked against evidence.
- Load-bearing: unclear — It is unclear whether the paper’s conclusions depend on it.
- Based: passes — The paper gives a reason why it holds.
It may state two separate claims as one.
None of the sources cited for this claim have been checked yet.
In the paper
“This suggests that Sst Calb2 Pdlim is a MC type, in agreement with the conclusions of Tasic et al.25 based on the data from Paul et al.46, and that Sst Hpse Cbln4 is a NMC type, in agreement with Naka et al.47.”
§ Layer 4 of mouse neocortex differs in cell types and circuit organization between sensory areas > Results > V1 differs from S1 in major L4 cell types
What the sources say
- Not checked yetcites [25] Tasic, B. et al. Shared and distinct transcriptomic cell types across neocortical areas. Nature 563, 72–78 (2018). source
- Not checked yetcites [46] Paul, A. et al. Transcriptional architecture of synaptic communication delineates GABAergic neuron identity. Cell 171, 522–539.e20 (2017). source
- Not checked yetcites [47] Naka, A. et al. Complementary networks of cortical somatostatin interneurons enforce layer specific control. eLife 8, e43696 (2019). source
hedged- Asserted: passes — The authors put it forward as true.
- Checkable: passes — It can be checked against evidence.
- Load-bearing: passes — The paper’s conclusions depend on it.
- Based: passes — The paper gives a reason why it holds.
It may state two separate claims as one.
In the paper
“in agreement with previous findings that gap junctions exist between inhibitory cells of the same type50.”
§ Layer 4 of mouse neocortex differs in cell types and circuit organization between sensory areas > Results > Connectivity among excitatory and SOM+ neurons
What the sources say
- Not checked yetcites [50] Galarreta, M. & Hestrin, S. Electrical synapses between GABA-releasing interneurons. Nat. Rev. Neurosci. 2, 425–433 (2001). source
plaincorrelational- Asserted: passes — The authors put it forward as true.
- Checkable: passes — It can be checked against evidence.
- Load-bearing: fails — The paper’s conclusions may not depend on it.
- Based: passes — The paper gives a reason why it holds.
Probably not a substantial claim. The paper’s conclusions may not depend on it.
None of the sources cited for this claim have been checked yet.
In the paper
“it is known that cells in S1 L4 preferentially make intra-barrel connections3,4.”
§ Layer 4 of mouse neocortex differs in cell types and circuit organization between sensory areas > Results > Connectivity among excitatory and SOM+ neurons
What the sources say
- Not checked yetcites [3] Feldmeyer, D., Egger, V., Lübke, J. & Sakmann, B. Reliable synaptic connections between pairs of excitatory layer 4 neurones within a single ‘barrel’ of developing rat somatosensory cortex. J. Physiol. 521, 169–190 (1999). source
- Not checked yetcites [4] Petersen, C. C. H. & Sakmann, B. The excitatory neuronal network of rat layer 4 barrel cortex. J. Neurosci. 20, 7579–7586 (2000). source
boostedcorrelational- Asserted: passes — The authors put it forward as true.
- Checkable: passes — It can be checked against evidence.
- Load-bearing: passes — The paper’s conclusions depend on it.
- Based: passes — The paper gives a reason why it holds.
Probably not a substantial claim.
In the paper
“This was also in stark contrast to MCs in L2/3 and L5 of adult mouse V1, which receive strong facilitating synaptic inputs from local PYRs in the same layers29”
§ Layer 4 of mouse neocortex differs in cell types and circuit organization between sensory areas > Results > Connectivity among excitatory and SOM+ neurons
What the sources say
- Not checked yetcites [29] Jiang, X. et al. Principles of connectivity among morphologically defined cell types in adult neocortex. Science 350, aac9462–aac9462 (2015). source
boostedcorrelational- Asserted: passes — The authors put it forward as true.
- Checkable: passes — It can be checked against evidence.
- Load-bearing: fails — The paper’s conclusions may not depend on it.
- Based: passes — The paper gives a reason why it holds.
Probably not a substantial claim. The paper’s conclusions may not depend on it.
In the paper
“This is in agreement with a recent study that found 6.3% (20/315) connection probability in V1 L4 of P46 mice53.”
§ Layer 4 of mouse neocortex differs in cell types and circuit organization between sensory areas > Results > Connectivity among excitatory and SOM+ neurons
What the sources say
- Not checked yetcites [53] Seeman, S. C. et al. Sparse recurrent excitatory connectivity in the microcircuit of the adult mouse and human cortex. Elife 7, e37349 (2018). source
plain- Asserted: passes — The authors put it forward as true.
- Checkable: passes — It can be checked against evidence.
- Load-bearing: fails — The paper’s conclusions may not depend on it.
- Based: passes — The paper gives a reason why it holds.
Probably not a substantial claim. The paper’s conclusions may not depend on it.
In the paper
“All of these connection patterns have also been reported in S1 L4 of young mice24.”
§ Layer 4 of mouse neocortex differs in cell types and circuit organization between sensory areas > Results > Connectivity among excitatory and SOM+ neurons
What the sources say
- Not checked yetcites [24] Ma, Y., Hu, H. & Agmon, A. Short-term plasticity of unitary inhibitory-to-inhibitory synapses depends on the presynaptic interneuron subtype. J. Neurosci. 32, 983–988 (2012). source
plain- Asserted: passes — The authors put it forward as true.
- Checkable: passes — It can be checked against evidence.
- Load-bearing: fails — The paper’s conclusions may not depend on it.
- Based: passes — The paper gives a reason why it holds.
Probably not a substantial claim. The paper’s conclusions may not depend on it.
None of the sources cited for this claim have been checked yet.
In the paper
“Morphologically, all non-fast-spiking SOM+ cells in V1 L529,47 and the majority of SOM+ cells in S1 L522,29,42,47 are known to be MCs.”
§ Layer 4 of mouse neocortex differs in cell types and circuit organization between sensory areas > Results > V1 differs from S1 in major L4 cell types
What the sources say
- Not checked yetcites [29] Jiang, X. et al. Principles of connectivity among morphologically defined cell types in adult neocortex. Science 350, aac9462–aac9462 (2015). source
- Not checked yetcites [47] Naka, A. et al. Complementary networks of cortical somatostatin interneurons enforce layer specific control. eLife 8, e43696 (2019). source
- Not checked yetcites [22] Ji, X.-Y. et al. Thalamocortical innervation pattern in mouse auditory and visual cortex: laminar and cell-type specificity. Cereb. Cortex 26, 2612–2625 (2016). source
- Not checked yetcites [42] Nigro, M. J., Hashikawa-Yamasaki, Y. & Rudy, B. Diversity and connectivity of layer 5 somatostatin-expressing interneurons in the mouse barrel cortex. J. Neurosci. 38, 1622–1633 (2018). source
boosted- Asserted: passes — The authors put it forward as true.
- Checkable: passes — It can be checked against evidence.
- Load-bearing: unclear — It is unclear whether the paper’s conclusions depend on it.
- Based: passes — The paper gives a reason why it holds.
It may state two separate claims as one.
None of the sources cited for this claim have been checked yet.
In the paper
“This observation is in line with previous findings that the excitatory identity controls the survival and wiring of local interneurons60,61.”
§ Layer 4 of mouse neocortex differs in cell types and circuit organization between sensory areas > Discussion
What the sources say
- Not checked yetcites [60] Lodato, S. et al. Excitatory projection neuron subtypes control the distribution of local inhibitory interneurons in the cerebral cortex. Neuron 69, 763–779 (2011). source
- Not checked yetcites [61] Wong, F. K. et al. Pyramidal cell regulation of interneuron survival sculpts cortical networks. Nature 557, 668–673 (2018). source
plaindirect- Asserted: passes — The authors put it forward as true.
- Checkable: passes — It can be checked against evidence.
- Load-bearing: fails — The paper’s conclusions may not depend on it.
- Based: passes — The paper gives a reason why it holds.
Probably not a substantial claim. The paper’s conclusions may not depend on it.
In the paper
“Tasic et al.25 showed that the majority of transcriptomic inhibitory types are shared between two very different cortical areas (V1 and ALM).”
§ Layer 4 of mouse neocortex differs in cell types and circuit organization between sensory areas > Discussion
What the sources say
- Not checked yetcites [25] Tasic, B. et al. Shared and distinct transcriptomic cell types across neocortical areas. Nature 563, 72–78 (2018). source
plain- Asserted: passes — The authors put it forward as true.
- Checkable: passes — It can be checked against evidence.
- Load-bearing: passes — The paper’s conclusions depend on it.
- Based: passes — The paper gives a reason why it holds.
Probably not a substantial claim.
What the paper did — it cites no source for this, so there is none to check. The quote shows it is in the paper.
In the paper
“Importantly, neuronal structures can be severed (a limitation of all slice electrophysiology experiments) due to the slicing procedure, introducing a potential underestimation of neuronal morphology and connectivity.”
§ Layer 4 of mouse neocortex differs in cell types and circuit organization between sensory areas > Methods > Electrophysiological recordings
hedgedconditional- Asserted: passes — The authors put it forward as true.
- Checkable: passes — It can be checked against evidence.
- Load-bearing: fails — The paper’s conclusions may not depend on it.
- Based: passes — The paper gives a reason why it holds.
Probably not a substantial claim. The paper’s conclusions may not depend on it.
What the paper did — it cites no source for this, so there is none to check. The quote shows it is in the paper.
In the paper
“For pairwise classification, we used exactly the same procedure as described above for pairwise classification using the reconstructed morphologies (nested cross-validation with logistic regression regularized with elastic net).”
§ Layer 4 of mouse neocortex differs in cell types and circuit organization between sensory areas > Methods > Data analysis of the electrophysiological features
plain- Asserted: passes — The authors put it forward as true.
- Checkable: passes — It can be checked against evidence.
- Load-bearing: fails — The paper’s conclusions may not depend on it.
- Based: passes — The paper gives a reason why it holds.
Probably not a substantial claim. The paper’s conclusions may not depend on it. It may state two separate claims as one.
What the paper did — it cites no source for this, so there is none to check. The quote shows it is in the paper.
In the paper
“Investigators were blinded to cell type of Patch-seq samples during library construction and sequencing.”
§ Layer 4 of mouse neocortex differs in cell types and circuit organization between sensory areas > Methods > Patch-seq procedure and sequencing
plain- Asserted: passes — The authors put it forward as true.
- Checkable: passes — It can be checked against evidence.
- Load-bearing: fails — The paper’s conclusions may not depend on it.
- Based: passes — The paper gives a reason why it holds.
Probably not a substantial claim. The paper’s conclusions may not depend on it.
What the paper did — it cites no source for this, so there is none to check. The quote shows it is in the paper.
In the paper
“Four cells were excluded because the sum of counts across all genes was below 1500”
§ Layer 4 of mouse neocortex differs in cell types and circuit organization between sensory areas > Methods > Data analysis of the RNA-seq data
plaindirectn = 118- Asserted: passes — The authors put it forward as true.
- Checkable: passes — It can be checked against evidence.
- Load-bearing: fails — The paper’s conclusions may not depend on it.
- Based: passes — The paper gives a reason why it holds.
Probably not a substantial claim. The paper’s conclusions may not depend on it.
In the paper
“Within S1, Naka et al.47 showed that L4 excitatory neurons connect to NMCs in L5 but not to MCs in L5”
§ Layer 4 of mouse neocortex differs in cell types and circuit organization between sensory areas > Discussion
What the sources say
- Not checked yetcites [47] Naka, A. et al. Complementary networks of cortical somatostatin interneurons enforce layer specific control. eLife 8, e43696 (2019). source
plaindirect- Asserted: passes — The authors put it forward as true.
- Checkable: passes — It can be checked against evidence.
- Load-bearing: passes — The paper’s conclusions depend on it.
- Based: passes — The paper gives a reason why it holds.
It may state two separate claims as one.
What the paper did — it cites no source for this, so there is none to check. The quote shows it is in the paper.
In the paper
“Among those, eight cells did not have good electrophysiological recordings (the recordings were either lost or were of bad quality) and were excluded from all downstream analyses that required electrophysiological data (leaving n = 102 cells).”
§ Layer 4 of mouse neocortex differs in cell types and circuit organization between sensory areas > Methods > Data analysis of the RNA-seq data
plainn = 102- Asserted: passes — The authors put it forward as true.
- Checkable: passes — It can be checked against evidence.
- Load-bearing: fails — The paper’s conclusions may not depend on it.
- Based: passes — The paper gives a reason why it holds.
Probably not a substantial claim. The paper’s conclusions may not depend on it. It may state two separate claims as one.
A conclusion the paper draws from its own results — it cites no other source for it, so there is none to check. The quote shows it is in the paper.
In the paper
“However, our results suggest that L4 MCs in V1 behave differently.”
§ Layer 4 of mouse neocortex differs in cell types and circuit organization between sensory areas > Discussion
hedged- Asserted: passes — The authors put it forward as true.
- Checkable: passes — It can be checked against evidence.
- Load-bearing: passes — The paper’s conclusions depend on it.
- Based: passes — The paper gives a reason why it holds.
The quote only partly states this claim.
What the paper did — it cites no source for this, so there is none to check. The quote shows it is in the paper.
In the paper
“Neurons were assigned to L4 based on the neocortical layer boundaries and the small somata that characterize this layer, which were clearly visible in the micrograph under the bright-field microscope. The layer identity of each neuron was also confirmed by the visualization of their position after the staining.”
§ Layer 4 of mouse neocortex differs in cell types and circuit organization between sensory areas > Methods > Electrophysiological recordings
boosted- Asserted: passes — The authors put it forward as true.
- Checkable: passes — It can be checked against evidence.
- Load-bearing: passes — The paper’s conclusions depend on it.
- Based: passes — The paper gives a reason why it holds.
Probably not a substantial claim. It may state two separate claims as one.
What the paper did — it cites no source for this, so there is none to check. The quote shows it is in the paper.
In the paper
“Animal preparation procedures for animals maintenance and surgeries were performed according to protocols approved by the Institutional Animal Care and Use Committee (IACUC) of Baylor College of Medicine.”
§ Layer 4 of mouse neocortex differs in cell types and circuit organization between sensory areas > Methods > Animals
plain- Asserted: passes — The authors put it forward as true.
- Checkable: passes — It can be checked against evidence.
- Load-bearing: fails — The paper’s conclusions may not depend on it.
- Based: passes — The paper gives a reason why it holds.
Probably not a substantial claim. The paper’s conclusions may not depend on it.
What the paper did — it cites no source for this, so there is none to check. The quote shows it is in the paper.
In the paper
“We used 10-fold cross-validation to select the values of alpha and lambda regularization parameters that would maximize the predicted R-squared.”
§ Layer 4 of mouse neocortex differs in cell types and circuit organization between sensory areas > Methods > Data analysis of the RNA-seq data
plainn = 102- Asserted: passes — The authors put it forward as true.
- Checkable: passes — It can be checked against evidence.
- Load-bearing: fails — The paper’s conclusions may not depend on it.
- Based: passes — The paper gives a reason why it holds.
Probably not a substantial claim. The paper’s conclusions may not depend on it.
What the paper did — it cites no source for this, so there is none to check. The quote shows it is in the paper.
In the paper
“One possible caveat here is that our recordings were done at the soma and could have failed to detect synaptic connections formed in the distal dendrites.”
§ Layer 4 of mouse neocortex differs in cell types and circuit organization between sensory areas > Discussion
hedgedconditional- Asserted: passes — The authors put it forward as true.
- Checkable: passes — It can be checked against evidence.
- Load-bearing: fails — The paper’s conclusions may not depend on it.
- Based: passes — The paper gives a reason why it holds.
Probably not a substantial claim. The paper’s conclusions may not depend on it.
What the paper did — it cites no source for this, so there is none to check. The quote shows it is in the paper.
In the paper
“To make sure that the identified connections were monosynaptic, we recovered the morphology of the presynaptic neurons and made sure that the morphology and electrophysiology of the presynaptic neuron for each connection (i.e., pyramidal neurons vs. interneurons) matched the nature of connections (i.e., EPSP vs. IPSP).”
§ Layer 4 of mouse neocortex differs in cell types and circuit organization between sensory areas > Methods > Electrophysiological recordings
plain- Asserted: passes — The authors put it forward as true.
- Checkable: passes — It can be checked against evidence.
- Load-bearing: passes — The paper’s conclusions depend on it.
- Based: passes — The paper gives a reason why it holds.
It may state two separate claims as one.
In the paper
“Because the synaptic connectivity strongly depends on the inter-soma distance29, we took special care to record from groups of neurons with inter-soma distances less than 150 µm.”
§ Layer 4 of mouse neocortex differs in cell types and circuit organization between sensory areas > Methods > Electrophysiological recordings
What the sources say
- Not checked yetcites [29] Jiang, X. et al. Principles of connectivity among morphologically defined cell types in adult neocortex. Science 350, aac9462–aac9462 (2015). source
boosteddirect- Asserted: passes — The authors put it forward as true.
- Checkable: passes — It can be checked against evidence.
- Load-bearing: passes — The paper’s conclusions depend on it.
- Based: passes — The paper gives a reason why it holds.
Probably not a substantial claim. It may state two separate claims as one.
What the paper did — it cites no source for this, so there is none to check. The quote shows it is in the paper.
In the paper
“Outer-loop performance was assessed via test-set accuracy.”
§ Layer 4 of mouse neocortex differs in cell types and circuit organization between sensory areas > Methods > Data analysis of the morphological reconstructions
plain- Asserted: passes — The authors put it forward as true.
- Checkable: passes — It can be checked against evidence.
- Load-bearing: fails — The paper’s conclusions may not depend on it.
- Based: passes — The paper gives a reason why it holds.
Probably not a substantial claim. The paper’s conclusions may not depend on it.
What the paper did — it cites no source for this, so there is none to check. The quote shows it is in the paper.
In the paper
“three cells were excluded because they mapped to Pvalb Reln Itm2a type (and were fast-spiking)”
§ Layer 4 of mouse neocortex differs in cell types and circuit organization between sensory areas > Methods > Data analysis of the RNA-seq data
plain- Asserted: passes — The authors put it forward as true.
- Checkable: passes — It can be checked against evidence.
- Load-bearing: fails — The paper’s conclusions may not depend on it.
- Based: passes — The paper gives a reason why it holds.
Probably not a substantial claim. The paper’s conclusions may not depend on it.
What the paper did — it cites no source for this, so there is none to check. The quote shows it is in the paper.
In the paper
“For the analysis shown in Fig. 4e, we selected 1000 most variable genes as described above, using n = 102 Patch-seq cells with high-quality electrophysiological recordings.”
§ Layer 4 of mouse neocortex differs in cell types and circuit organization between sensory areas > Methods > Data analysis of the RNA-seq data
plainn = 102- Asserted: passes — The authors put it forward as true.
- Checkable: passes — It can be checked against evidence.
- Load-bearing: fails — The paper’s conclusions may not depend on it.
- Based: passes — The paper gives a reason why it holds.
Probably not a substantial claim. The paper’s conclusions may not depend on it.
What the paper did — it cites no source for this, so there is none to check. The quote shows it is in the paper.
In the paper
“One cell was excluded because it mapped to one of the excitatory types”
§ Layer 4 of mouse neocortex differs in cell types and circuit organization between sensory areas > Methods > Data analysis of the RNA-seq data
plainSingle case- Asserted: passes — The authors put it forward as true.
- Checkable: passes — It can be checked against evidence.
- Load-bearing: fails — The paper’s conclusions may not depend on it.
- Based: passes — The paper gives a reason why it holds.
Probably not a substantial claim. The paper’s conclusions may not depend on it.
In the paper
“This is in qualitative agreement with the findings of Gowens et al.76, who, in a parallel work based on unsupervised clustering, identified twice as many morphological types (m-types) as electrophysiological ones (e-types).”
§ Layer 4 of mouse neocortex differs in cell types and circuit organization between sensory areas > Discussion
What the sources say
- Not checked yetcites [76] Gouwens, N. W. et al. Classification of electrophysiological and morphological neuron types in the mouse visual cortex. Nat. Neurosci. 22, 1182–1195 (2019). source
plaincorrelational- Asserted: passes — The authors put it forward as true.
- Checkable: passes — It can be checked against evidence.
- Load-bearing: fails — The paper’s conclusions may not depend on it.
- Based: passes — The paper gives a reason why it holds.
Probably not a substantial claim. The paper’s conclusions may not depend on it.
What the paper did — it cites no source for this, so there is none to check. The quote shows it is in the paper.
In the paper
“The shrinkage was not compensated for the morphology visualization and analysis.”
§ Layer 4 of mouse neocortex differs in cell types and circuit organization between sensory areas > Methods > Staining and morphology recovery
plain- Asserted: passes — The authors put it forward as true.
- Checkable: passes — It can be checked against evidence.
- Load-bearing: fails — The paper’s conclusions may not depend on it.
- Based: passes — The paper gives a reason why it holds.
Probably not a substantial claim. The paper’s conclusions may not depend on it.
What the paper did — it cites no source for this, so there is none to check. The quote shows it is in the paper.
In the paper
“However, we see no reason to believe that this problem would be more severe in adult animals compared to the young ones (P15–20)”
§ Layer 4 of mouse neocortex differs in cell types and circuit organization between sensory areas > Discussion
hedged- Asserted: passes — The authors put it forward as true.
- Checkable: passes — It can be checked against evidence.
- Load-bearing: passes — The paper’s conclusions depend on it.
- Based: fails — The paper may give no reason why it holds.
Probably not a substantial claim. The paper may give no reason why it holds.
None of the sources cited for this claim have been checked yet.
In the paper
“previous studies have shown that in V1, L4 MCs also receive weak inputs from the thalamus compared to other interneuron types21,22.”
§ Layer 4 of mouse neocortex differs in cell types and circuit organization between sensory areas > Discussion
What the sources say
- Not checked yetcites [21] Cruikshank, S. J., Urabe, H., Nurmikko, A. V. & Connors, B. W. Pathway-specific feedforward circuits between thalamus and neocortex revealed by selective optical stimulation of axons. Neuron 65, 230–245 (2010). source
- Not checked yetcites [22] Ji, X.-Y. et al. Thalamocortical innervation pattern in mouse auditory and visual cortex: laminar and cell-type specificity. Cereb. Cortex 26, 2612–2625 (2016). source
plaincorrelational- Asserted: passes — The authors put it forward as true.
- Checkable: passes — It can be checked against evidence.
- Load-bearing: fails — The paper’s conclusions may not depend on it.
- Based: passes — The paper gives a reason why it holds.
Probably not a substantial claim. The paper’s conclusions may not depend on it.
What the paper did — it cites no source for this, so there is none to check. The quote shows it is in the paper.
In the paper
“special care was taken to select only slices that had a cutting plane parallel to the apical dendrites to ensure preservation of both axonal and dendritic arborization structures.”
§ Layer 4 of mouse neocortex differs in cell types and circuit organization between sensory areas > Methods > Slice preparation
plaindirect- Asserted: passes — The authors put it forward as true.
- Checkable: passes — It can be checked against evidence.
- Load-bearing: fails — The paper’s conclusions may not depend on it.
- Based: passes — The paper gives a reason why it holds.
Probably not a substantial claim. The paper’s conclusions may not depend on it.
A conclusion the paper draws from its own results — it cites no other source for it, so there is none to check. The quote shows it is in the paper.
In the paper
“We suggest that the difference in the morphology of SOM+ neurons between these two cortical areas might be a result of the difference in dendritic arborization of the targeted excitatory neurons.”
§ Layer 4 of mouse neocortex differs in cell types and circuit organization between sensory areas > Discussion
hedgedconditional- Asserted: passes — The authors put it forward as true.
- Checkable: passes — It can be checked against evidence.
- Load-bearing: fails — The paper’s conclusions may not depend on it.
- Based: passes — The paper gives a reason why it holds.
Probably not a substantial claim. The paper’s conclusions may not depend on it.
None of the sources cited for this claim have been checked yet.
In the paper
“SOM+ MCs in other layers are known to receive facilitating excitatory inputs from local principal neurons in both S162,63 and V129,64.”
§ Layer 4 of mouse neocortex differs in cell types and circuit organization between sensory areas > Discussion
What the sources say
- Not checked yetcites [62] Kapfer, C., Glickfeld, L. L., Atallah, B. V. & Scanziani, M. Supralinear increase of recurrent inhibition during sparse activity in the somatosensory cortex. Nat. Neurosci. 10, 743–753 (2007). source
- Not checked yetcites [63] Silberberg, G. & Markram, H. Disynaptic inhibition between neocortical pyramidal cells mediated by Martinotti cells. Neuron 53, 735–746 (2007). source
- Not checked yetcites [29] Jiang, X. et al. Principles of connectivity among morphologically defined cell types in adult neocortex. Science 350, aac9462–aac9462 (2015). source
- Not checked yetcites [64] Adesnik, H., Bruns, W., Taniguchi, H., Huang, Z. J. & Scanziani, M. A neural circuit for spatial summation in visual cortex. Nature 490, 226–231 (2012). source
boosteddirect- Asserted: passes — The authors put it forward as true.
- Checkable: passes — It can be checked against evidence.
- Load-bearing: fails — The paper’s conclusions may not depend on it.
- Based: passes — The paper gives a reason why it holds.
Probably not a substantial claim. The paper’s conclusions may not depend on it.
What the paper did — it cites no source for this, so there is none to check. The quote shows it is in the paper.
In the paper
“We used nested cross-validation to choose the optimal value of the regularization parameter lambda and to obtain an unbiased estimate of the performance.”
§ Layer 4 of mouse neocortex differs in cell types and circuit organization between sensory areas > Methods > Data analysis of the morphological reconstructions
plain- Asserted: passes — The authors put it forward as true.
- Checkable: passes — It can be checked against evidence.
- Load-bearing: passes — The paper’s conclusions depend on it.
- Based: passes — The paper gives a reason why it holds.
Probably not a substantial claim. It may state two separate claims as one.
The authors state this as an assumption.
All four PV+ fast-spiking cell types were basket cells with different axonal morphologies.
“None of them had chandelier-like axonal structures, so we assumed that all four types were basket cells with different axonal morphologies10”
The paper relies on this without support.
There has been no systematic comparison of anatomical and electrophysiological properties as well as connectivity profiles between L4 of different cortical areas.
“However, there has been no systematic comparisons of anatomical and electrophysiological properties as well as connectivity profiles between L4 of different cortical areas, leaving an open question about the similarity in their cellular components and circuitry.”
Claims other papers make about this one
Each is checked against this paper’s own text: does it say what the citing paper says it does?
In the citing paper
“Another finding was that the Sst Pvalb Calb2 type, which is transcriptomically in between the Sst and Pvalb subclasses, was also in between these subclasses in terms of its morpho-electric phenotype28.”
From Phenotypic variation of transcriptomic cell types in mouse motor cortex (2021) · cites this paper as [28]
In the citing paper
“Consistently with previous studies, tissue shrinkage due to the fixation and staining procedures was about 10–20%5,28,49.”
From Phenotypic variation of transcriptomic cell types in mouse motor cortex (2021) · cites this paper as [28]
In the citing paper
“Recent evidence also suggests that different morphological phenotypes correspond to differential synaptic connectivity profiles (Nigro et al., 2018; Naka et al., 2019; Scala et al., 2019).”
From Integrated Morphoelectric and Transcriptomic Classification of Cortical GABAergic Cells (2020) · cites this paper as Scala et al., 2019
Self-check
Percentages, sums and reported differences re-computed from the paper’s own numbers.
Rated minor: it would not touch a result — a value no result rests on, a p-value that stays on the same side of the significance level, or a conflict that is clerical, resolved elsewhere in the paper, or outside its own findings.
In the paper
“The measured connection probability was 5.2% (5/104)”
§ Layer 4 of mouse neocortex differs in cell types and circuit organization between sensory areas > Results > Connectivity among excitatory and SOM+ neurons
Reported 5.2 · recomputed 4.807692
Citations
Cites
Regularization Paths for Generalized Linear Models via Coordinate Descent
Friedman, J., Hastie, T., & Tibshirani, R. (2010) · Journal of Statistical Software · doi:10.18637/jss.v033.i01 · Cited by 19,927
Shrestha, S., & Offer, S. M. (2016) · Medical Epigenetics · doi:10.1159/000444713 · Cited by 8,951
Full-length RNA-seq from single cells using Smart-seq2
Picelli, S., Faridani, O. R., Björklund, Å. K., Winberg, G., Sagasser, S., & Sandberg, R. (2014) · Nature Protocols · doi:10.1038/nprot.2014.006 · Cited by 4,137
Self-citationInterneurons of the neocortical inhibitory system
Markram, H., Toledo-Rodriguez, M., Wang, Y., Gupta, A., Silberberg, G., & Wu, C. (2004) · Nature Reviews Neuroscience · doi:10.1038/nrn1519 · Cited by 2,954
GABAergic Interneurons in the Neocortex: From Cellular Properties to Circuits
Tremblay, R., Lee, S., & Rudy, B. (2016) · Neuron · doi:10.1016/j.neuron.2016.06.033 · Cited by 2,033
Shared and distinct transcriptomic cell types across neocortical areas
Tasic, B., Yao, Z., Graybuck, L. T., Smith, K. A., Nguyen, T. N., Bertagnolli, D., Goldy, J., Garren, E., Economo, M. N., Viswanathan, S., et al. (2018) · Nature · doi:10.1038/s41586-018-0654-5 · Cited by 1,746
Highly nonrandom features of synaptic connectivity in local cortical circuits
Song, S., Sjöström, P. J., Reigl, M., Nelson, S., & Chklovskii, D. B. (2005) · PLoS Biology · doi:10.1371/journal.pbio.0030068 · Cited by 1,512
Petilla terminology: nomenclature of features of GABAergic interneurons of the cerebral cortex
The Petilla Interneuron Nomenclature Group (PING) (2008) · Nature Reviews Neuroscience · doi:10.1038/nrn2402 · Cited by 1,491
GABAergic cell subtypes and their synaptic connections in rat frontal cortex
Kawaguchi, Y. (1997) · Cerebral Cortex · doi:10.1093/cercor/7.6.476 · Cited by 1,416
Two networks of electrically coupled inhibitory neurons in neocortex
Gibson, J. R., Beierlein, M., & Connors, B. W. (1999) · Nature · doi:10.1038/47035 · Cited by 1,404
Cited by
Sorted by citations
Integrated Morphoelectric and Transcriptomic Classification of Cortical GABAergic Cells
Gouwens, N. W., Sorensen, S. A., Baftizadeh, F., Budzillo, A., Lee, B. R., Jarsky, T., Alfiler, L., Baker, K., Barkan, E., Berry, K., et al. (2020) · Cell · doi:10.1016/j.cell.2020.09.057 · Cited by 538
“A previous study also observed that cells of this t-type had fast-spiking-like firing properties (Scala et al., 2019).”
Phenotypic variation of transcriptomic cell types in mouse motor cortex
Scala, F., Kobak, D., Bernabucci, M., Bernaerts, Y., Cadwell, C. R., Castro, J. R., Hartmanis, L., Jiang, X., Laturnus, S., Miranda, E., et al. (2021) · Nature · doi:10.1038/s41586-020-2907-3 · Cited by 398
“Consistently with previous studies, tissue shrinkage due to the fixation and staining procedures was about 10–20% 5,28,49 .”
InfluentialSelf-citationLocal connectivity and synaptic dynamics in mouse and human neocortex
Campagnola, L., Seeman, S. C., Chartrand, T., Kim, L., Hoggarth, A., Gamlin, C., Ito, S., Trinh, J., Davoudian, P., Radaelli, C., et al. (2022) · Science · doi:10.1126/science.abj5861 · Cited by 363
“Sst and Vip cells are often described as lacking recurrent connections (36, 37, 48, 61) despite some evidence to the contrary (6, 62).”
BackgroundResultCircuitry Underlying Experience-Dependent Plasticity in the Mouse Visual System
Hooks, B. M., & Chen, C. (2020) · Neuron · doi:10.1016/j.neuron.2020.01.031 · Cited by 176
Neuronal circuits in barrel cortex for whisker sensory perception
Staiger, J. F., & Petersen, C. C. H. (2021) · Physiological Reviews · doi:10.1152/physrev.00019.2019 · Cited by 165
Schneider, M., Broggini, A. C., Dann, B., Τζάνου, Α., Uran, C., Sheshadri, S., Scherberger, H., & Vinck, M. A. (2021) · Neuron · doi:10.1016/j.neuron.2021.09.037 · Cited by 167
Cortical Somatostatin Interneuron Subtypes Form Cell-Type Specific Circuits
Wu, S. J., Sevier, E., Dwivedi, D., Saldi, G.-A., Hairston, A., Yu, S. Q., Abbott, L., Choi, D. H., Sherer, M., Qiu, Y., et al. (2022) · Neuron · doi:10.1016/j.neuron.2023.05.032 · Cited by 139
Signature morphoelectric properties of diverse GABAergic interneurons in the human neocortex
Lee, B. R., Dalley, R., Miller, J. A., Chartrand, T., Close, J., Mann, R., Mukora, A., Ng, L., Alfiler, L., Baker, K., et al. (2023) · Science · doi:10.1126/science.adf6484 · Cited by 125
“L4-5 SST STK32A and Sst Hpse Cbln4 shared similar morphological qualities, including being found predominately in L4 and L5 and extensive axonal branching that strongly innervated L4 (16, 42) (Fig.”
BackgroundPatch-seq: Past, Present, and Future
Lipovsek, M., Bardy, C., Cadwell, C. R., Hadley, K., Kobak, D., & Tripathy, S. J. (2021) · Journal of Neuroscience · doi:10.1523/jneurosci.1653-20.2020 · Cited by 104
Self-citationMalina, K. C.-K., Tsivourakis, E., Kushinsky, D., Apelblat, D., Shtiglitz, S., Zohar, E., Sokoletsky, M., Tasaka, G., Mizrahi, A., Lampl, I., et al. (2021) · Neuron · doi:10.1016/j.neuron.2021.05.001 · Cited by 95
“, 2011), and that pyramidal excitatory neurons across all layers of V1 extend their dendrites into L1 (Olsen et al., 2012; Scala et al., 2019).”
BackgroundMillman, D. J., Ocker, G. K., Caldejon, S., Kato, I., Larkin, J. D., Lee, E., Luviano, J., Nayan, C., Nguyen, T. V., North, K., et al. (2020) · eLife · doi:10.7554/elife.55130 · Cited by 94
“Notably, most, if not all, SST neurons in layer 4 of V1 are Martinotti cells (Scala et al., 2019).”
BackgroundEstablishing a conceptual framework for holistic cell states and state transitions
Rafelski, S. M., & Theriot, J. A. (2024) · Cell · doi:10.1016/j.cell.2024.04.035 · Cited by 96
Fang, L., Zhao, N., Caudal, L. C., Chang, H., Zhao, R., Lin, C.-H., Hainz, N., Meier, C., Bettler, B., Huang, W., et al. (2022) · Nature Communications · doi:10.1038/s41467-022-29020-1 · Cited by 76
Que, L., Lukacsovich, D., Luo, W., & Földy, C. (2021) · Nature Communications · doi:10.1038/s41467-020-20328-4 · Cited by 62
Gao, L., Liu, S., Wang, Y., Wu, Q., Gou, L., & Yan, J. (2023) · Nature Neuroscience · doi:10.1038/s41593-023-01339-y · Cited by 53
Somatostatin interneurons control the timing of developmental desynchronization in cortical networks
Mòdol, L., Moissidis, M., Selten, M. M., Oozeer, F., & Marín, Ó. (2024) · Neuron · doi:10.1016/j.neuron.2024.03.014 · Cited by 63
Cadwell, C. R., Scala, F., Fahey, P. G., Kobak, D., Mulherkar, S. A., Sinz, F. H., Papadopoulos, S., Tan, Z. H., Johnsson, P., Hartmanis, L., et al. (2020) · eLife · doi:10.7554/elife.52951 · Cited by 56
Self-citationCell-type-specific propagation of visual flicker
Schneider, M., Τζάνου, Α., Uran, C., & Vinck, M. A. (2023) · Cell Reports · doi:10.1016/j.celrep.2023.112492 · Cited by 61
MicroRNAs Instruct and Maintain Cell Type Diversity in the Nervous System
Zolboot, N., Du, J. X., Zampa, F., & Lippi, G. (2021) · Frontiers in Molecular Neuroscience · doi:10.3389/fnmol.2021.646072 · Cited by 50
Primate Neuronal Connections are Sparse as Compared to Mouse
Wildenberg, G. A., Rosen, M. C., Lundell, J., Paukner, D., Freedman, D. J., & Kasthuri, N. (2020) · Cell Reports · doi:10.1016/j.celrep.2021.109709 · Cited by 49
Somatostatin and Somatostatin-Containing Interneurons—From Plasticity to Pathology
Liguz‐Lecznar, M., Dobrzański, G., & Kossut, M. M. (2022) · Biomolecules · doi:10.3390/biom12020312 · Cited by 46
Phenotypic variation within and across transcriptomic cell types in mouse motor cortex
(2020) · doi:10.1101/2020.02.03.929158 · Cited by 397
“Slice preparation The MOp brain slices were obtained following previously described protocols (Jiang et al., 2015; Scala et al., 2019).”
BackgroundMethodResultInfluentialSelf-citationConserved patterns of functional organization between cortex and thalamus in mice
Miller-Hansen, A. J., & Sherman, S. M. (2022) · Proceedings of the National Academy of Sciences · doi:10.1073/pnas.2201481119 · Cited by 43
“The excitatory identity of cells in cortex was verified by layer and area-specific responses to positive and negative current injections which easily distinguish GABAergic interneurons (52), as well as by size and shape (all excitatory cells were pyramidal with the exception of S1 layer 4), as described previously (22…”
BackgroundCellular composition and circuit organization of the locus coeruleus of adult mice
McKinney, A., Hu, M., Hoskins, A., Mohammadyar, A., Naeem, N., Jing, J., Patel, S. S., Sheth, B. R., & Jiang, X. (2023) · eLife · doi:10.7554/elife.80100 · Cited by 58
Self-citationStereo-seq of the prefrontal cortex in aging and Alzheimer’s disease
Gong, Y., Haeri, M., Zhang, X., Li, Y., Liu, A., Wu, D., Zhang, Q., Jazwinski, S. M., Zhou, X., Wang, X., et al. (2025) · Nature Communications · doi:10.1038/s41467-024-54715-y · Cited by 52
“AsthelayersII-Varecrucialin cortical information collection, processing and distributing outputs to subcortical structures 49,50 , the breakdown of the vertical networks leads to the cognitive impairments in AD 51 .”
Layer 1 neocortex: Gating and integrating multidimensional signals
Huang, S., Wu, S. J., Sansone, G., Ibrahim, L. A., & Fishell, G. (2023) · Neuron · doi:10.1016/j.neuron.2023.09.041 · Cited by 43
Consistent cross-modal identification of cortical neurons with coupled autoencoders
Gala, R., Budzillo, A., Baftizadeh, F., Miller, J. A., Gouwens, N. W., Arkhipov, A. S., Murphy, G. J., Tasic, B., Zeng, H., Hawrylycz, M., et al. (2021) · Nature Computational Science · doi:10.1038/s43588-021-00030-1 · Cited by 38
(2020) · doi:10.1101/2020.02.03.932244 · Cited by 537
“Moreover, new methods such as the Patch-seq recording technique (Fuzik et al., 2016; Cadwell et al., 2016; Scala et al., 2019; Fö ldy et al., 2016) enable one to directly relate the transcriptomic features of a given neuron to other identifying characteristics of the same neuron - e.g., the…”
BackgroundMethodInfluentialChandrashekar, P. B., Alatkar, S., Wang, J., Hoffman, G. E., He, C., Jin, T., Khullar, S., Bendl, J., Fullard, J. F., Roussos, P., et al. (2023) · Genome Medicine · doi:10.1186/s13073-023-01248-6 · Cited by 37
“We extracted 112 (L4) neuronal cells patch-seq data [122] containing gene expression data but only a small set of electrophysiological data for independent testing.”
MethodFisher, J., Verhagen, M. G., Long, Z., Moissidis, M., Yan, Y., He, C., Wang, J., Micoli, E., Alastruey, C. M., Moors, R., et al. (2023) · Neuron · doi:10.1016/j.neuron.2023.11.013 · Cited by 38
Genetically Defined Subtypes of Somatostatin-Containing Cortical Interneurons
Hostetler, R. E., Hu, H., & Agmon, A. (2023) · eNeuro · doi:10.1523/eneuro.0204-23.2023 · Cited by 31
“, 2019), although in visual cortex (used for the MET classification) they also have substantial axonal arborization in L1 (Scala et al., 2019).”
Sparse Reduced-Rank Regression for Exploratory Visualisation of Paired Multivariate Data
Kobak, D., Bernaerts, Y., Weis, M. A., Scala, F., Tolias, A. S., & Berens, P. (2021) · Journal of the Royal Statistical Society Series C: Applied Statistics · doi:10.1111/rssc.12494 · Cited by 24
“We used five existing Patch-seq datasets (Cadwell et al., 2016; Fuzik et al., 2016; Gouwens et al., 2020; Scala et al., 2019, 2020) with sample sizes ranging from n = 44 to n = 3395 to demonstrate and validate our method (Table 1).”
MethodSelf-citationMorpho-electric diversity of human hippocampal CA1 pyramidal neurons
Mertens, E. J., Leibner, Y., Pie, J. L., Galakhova, A. A., Waleboer, F., Meijer, J., Heistek, T. S., Wilbers, R., Heyer, D. B., Goriounova, N. A., et al. (2024) · Cell Reports · doi:10.1016/j.celrep.2024.114100 · Cited by 27
“74,77,78 These larger datasets should ideally include dendritic recordings to validate our assumptions on independent dendritic subunits and non-linear properties (Figure 4).”
BackgroundDistinct feedforward and feedback pathways for cell-type specific attention effects
Spyropoulos, G., Schneider, M., van Kempen, J., Gieselmann, M. A., Thiele, A., & Vinck, M. A. (2024) · Neuron · doi:10.1016/j.neuron.2024.04.020 · Cited by 33
“35,44 Thus, the fast-spiking interneurons in V4 may comprise a mixture of PV+ and narrow-waveform SSt+ interneurons.”
Optimizing interneuron circuits for compartment-specific feedback inhibition
Keijser, J., & Sprekeler, H. (2022) · PLoS Computational Biology · doi:10.1371/journal.pcbi.1009933 · Cited by 28
“398 [61] Federico Scala, Dmitry Kobak, Shen Shan, Yves Bernaerts, Sophie Laturnus, Cathryn Rene Cadwell, Leonard Hartmanis, 399 Emmanouil Froudarakis, Jesus Ramon Castro, Zheng Huan Tan, et al.”
Bian, X., Zhu, J., Jia, X., Liang, W., Yu, S., Li, Z., Zhang, W., & Rao, Y. (2023) · eLife · doi:10.7554/elife.89317 · Cited by 32
“These neurons exhibited regular firing patterns ( Scala et al., 2019 ; Stumpf et al., 2018 ) in response to depolarization current injection ( Figure 7D , Figure 7—figure supplement 3A ) with moderate maximal evoked spiking frequencies of 10–30 spikes per 500 ms ( Figure 7E–G ), increasing of…”
BackgroundGemin, O., Serna, P., Zamith, J., Assendorp, N., Fossati, M., Rostaing, P., Triller, A., & Charrier, C. (2021) · PLoS Biology · doi:10.1371/journal.pbio.3001375 · Cited by 25
Connectomics of predicted Sst transcriptomic types in mouse visual cortex
Gamlin, C. R., Schneider-Mizell, C. M., Mallory, M., Elabbady, L., Gouwens, N. W., Williams, G., Mukora, A., Dalley, R. A., Bodor, Á. L., Brittain, D., et al. (2025) · Nature · doi:10.1038/s41586-025-08805-6 · Cited by 32
“We observe ‘blanket inhibition’ from the MET-8 cells onto L4 PCs, but not from MET-8 onto other target subclasses or from other Sst MET-types.”
InfluentialMolecular logic for cellular specializations that initiate the auditory parallel processing pathways
Jing, J., Hu, M., Ngodup, T., Ma, Q., Lau, S.-N. N., Ljungberg, M. C., McGinley, M. J., Trussell, L. O., & Jiang, X. (2025) · Nature Communications · doi:10.1038/s41467-024-55257-z · Cited by 32
“To illustrate the mapping results, each Patch-seq cell was positioned at the median UMAP coordinates of its ten nearest neighbors in snRNA-seq UMAP embeddings, as determined by Pearson correlation 28,114 .”
InfluentialSelf-citationDobrzański, G., Łukomska, A., Zakrzewska, R., Posluszny, A., Kanigowski, D., Urban‐Ciećko, J., Liguz‐Lecznar, M., & Kossut, M. M. (2021) · Biochimica et Biophysica Acta (BBA) - Molecular Cell Research · doi:10.1016/j.bbamcr.2021.119146 · Cited by 20
Signature morpho-electric properties of diverse GABAergic interneurons in the human neocortexPreprint
Lee, B., Dalley, R. A., Miller, J. A., et al. (2022) · bioRxiv (Cold Spring Harbor Laboratory) · doi:10.1101/2022.11.08.515739 · Cited by 22
“Mouse Sst Hpse Cbln4 neurons are predominately found in L4 and have extensive axonal branching that strongly innervates L4 (16, 40), which is similar to what we see for L4-5 SST STK32A neurons (Fig.”
ResultNeocortical somatostatin neuron diversity in cognition and learning
Park, E., Mosso, M. B., & Barth, A. L. (2025) · Trends in Neurosciences · doi:10.1016/j.tins.2024.12.004 · Cited by 24
“And in V1, >90% of SST neurons in super fi cial layers express Calb2, unlike S1 where ~40% of SST neurons in L2/3 are Calb2+ [39].”
InfluentialIntegrating multimodal data to understand cortical circuit architecture and function
Arkhipov, A. S., da Costa, N. M., de Vries, S. E. J., Bakken, T. E., Bennett, C., Bernard, A., Berg, J., Buice, M. A., Collman, F., Daigle, T. L., et al. (2025) · Nature Neuroscience · doi:10.1038/s41593-025-01904-7 · Cited by 27
“…to correspond to distinct me-characteristics of Sst interneuron types between the primary visual (V1) and primary somatosensory (S1) cortical areas 36 , and differences in electrophysiological responses to pharmacological manipulations of NPY + interneurons between the auditory cortex and…”
Rate and oscillatory switching dynamics of a multilayer visual microcircuit model
Hahn, G., Kumar, A., SCHMIDT, H. J., Knösche, T. R., & Deco, G. (2022) · eLife · doi:10.7554/elife.77594 · Cited by 21
Ong, R. C. S., & Tang, A. D. (2025) · Science Advances · doi:10.1126/sciadv.ado6705 · Cited by 22
Donato, C., Victorino, D. B., Cabezas, C., Aguirre, A., Lourenço, J., Potier, M., Martín, J. Z. D. S., & Bacci, A. (2022) · Journal of Neuroscience · doi:10.1523/jneurosci.1661-21.2022 · Cited by 19
Zhou, X., Mansori, I., Fischer, T., Witte, M., & Staiger, J. F. (2020) · Journal of Comparative Neurology · doi:10.1002/cne.24756 · Cited by 18
Lusk, S. J., McKinney, A., Hunt, P. J., Fahey, P. G., Patel, J. M., Chang, A., Sun, J. J., Martinez, V. K., Zhu, P. J., Egbert, J. R., et al. (2022) · BMC Biology · doi:10.1186/s12915-022-01227-0 · Cited by 17
Self-citationInput-specific synaptic depression shapes temporal integration in mouse visual cortex
Li, J. Y., & Glickfeld, L. L. (2023) · Neuron · doi:10.1016/j.neuron.2023.07.003 · Cited by 21
Transcranial Magnetic Stimulation and Neocortical Neurons: The Micro-Macro Connection
Tian, D., & Izumi, S. (2022) · Frontiers in Neuroscience · doi:10.3389/fnins.2022.866245 · Cited by 18
Dynamics of neocortical networks: connectivity beyond the canonical microcircuit
Luhmann, H. J. (2023) · Pflügers Archiv - European Journal of Physiology · doi:10.1007/s00424-023-02830-y · Cited by 18
An unsupervised map of excitatory neuron dendritic morphology in the mouse visual cortex
Weis, M. A., Papadopoulos, S., Hansel, L., Lüddecke, T., Celii, B., Fahey, P. G., Wang, E. Y., Bae, J. A., Bodor, A. L., Brittain, D., et al. (2025) · Nature Communications · doi:10.1038/s41467-025-58763-w · Cited by 28
“Itis ,therefore,temptingtospeculatethatthese atufted, L5-avoiding L4 neurons might be precursors of spiny stellate cells, which are nearly absent in the mouse visual cortex 28 , but exist only in somewhat more developed sensory areas like barrel cortex or in cat and primate V1.”
Self-citationInnate frequency-discrimination hyperacuity in Williams-Beuren syndrome mice
Davenport, C. M., Teubner, B. J. W., Han, S. B., Patton, M. H., Eom, T.-Y., Garić, D., Lansdell, B., Shirinifard, A., Chang, T., Klein, J. D., et al. (2022) · Cell · doi:10.1016/j.cell.2022.08.022 · Cited by 17
Young, T. R., Yamamoto, M., Kikuchi, S. S., Yoshida, A., Abe, T., Inoue, K., Johansen, J. P., Benucci, A., Yoshimura, Y., & Shimogori, T. (2023) · Nature Communications · doi:10.1038/s41467-023-41749-x · Cited by 18
“…that align with distinct L4 spiny stellate neuron distributions observed across different species: for example, nocturnal rodent species display a high abundance of L4 spiny stellate neurons in whisker-related somato-sensory cortex, with relatively few being found in visual cortex 68 – 70 .”
Connecting single-cell transcriptomes to projectomes in the mouse visual cortex
Sorensen, S. A., Gouwens, N. W., Wang, Y., Mallory, M., Budzillo, A., Dalley, R. A., Lee, B., Gliko, O., Kuo, H.-C., Kuang, X., et al. (2026) · Nature · doi:10.1038/s41586-026-10424-8 · Cited by 13
Huang, J., Sheng, J., & Wang, D. (2021) · Communications Biology · doi:10.1038/s42003-021-02807-6 · Cited by 12
“In particular, we focused on two major brain regions, mouse visual cortex and motor cortex, and used the latest Patch-seq data from Allen Brain Atlas in the BRAIN Initiative 5,13,14 (Methods).”
MethodMontinaro, C., Pisanello, M., Bianco, M., Spagnolo, B., Pisano, F., Balena, A., Nuccio, F. D., Lofrumento, D. D., Verri, T., Vittorio, M. D., et al. (2021) · Biomedical Optics Express · doi:10.1364/boe.439848 · Cited by 16
“toward LI and LII-III, with respect to typical LV pyramidal neurons [30].”
BackgroundLateral inhibition in V1 controls neural and perceptual contrast sensitivity
Rosario, J. D., Coletta, S., Kim, S. H., Mobille, Z., Peelman, K., Williams, B., Otsuki, A. J., Valerio, A. D. C., Worden, K., Blanpain, L. T., et al. (2025) · Nature Neuroscience · doi:10.1038/s41593-025-01888-4 · Cited by 23
“48 ).”
InfluentialCellular and Circuit Organization of the Locus Coeruleus of Adult MicePreprint
McKinney, A., Hu, M. Y., Hoskins, A., et al. (2022) · bioRxiv (Cold Spring Harbor Laboratory) · doi:10.1101/2022.03.01.481656 · Cited by 16
“An excitatory synaptic connection is identified if the excitatory postsynaptic potentials (EPSPs) in potential postsynaptic neurons are time-locked to presynaptic APs (Jiang et al., 2015; Scala et al., 2019).”
BackgroundSelf-citationLearning the Architectural Features That Predict Functional Similarity of Neural Networks
Haber, A., & Schneidman, E. (2022) · Physical Review X · doi:10.1103/physrevx.12.021051 · Cited by 14
Camuñas-Soler, J. (2023) · Biophysical Reviews · doi:10.1007/s12551-023-01174-2 · Cited by 17
“They were followed by additional studies on other neuronal subtypes and brain regions by the same labs (Scala et al. 2019; Que et al. 2021; Oláh et al. 2020; Muñoz-Manchado et al. 2018), and others (Ellender et al. 2019; Luo et al. 2019), and studies using isolated iPSC-derived neurons (Bardy et…”
BackgroundMethodIntersectional strategy to study cortical inhibitory parvalbumin-expressing interneurons
Palicz, R., Pater, B. A., Truschow, P., Witte, M., & Staiger, J. F. (2024) · Scientific Reports · doi:10.1038/s41598-024-52901-y · Cited by 13
Transcriptomic cell-type specificity of local cortical circuits
Patiño, M., Rossa, M., Lagos, W. N., Patne, N. S., & Callaway, E. M. (2024) · Neuron · doi:10.1016/j.neuron.2024.09.003 · Cited by 19
de Kock, C. P. J., & Feldmeyer, D. (2023) · Frontiers in Synaptic Neuroscience · doi:10.3389/fnsyn.2023.1274383 · Cited by 13
Swain, A. K., Pandit, V., Sharma, J., & Yadav, P. (2024) · Communications Biology · doi:10.1038/s42003-024-06349-5 · Cited by 18
Sub-threshold neuronal activity and the dynamical regime of cerebral cortex
Amsalem, O., Inagaki, H., Yu, J., Svoboda, K., & Darshan, R. (2024) · Nature Communications · doi:10.1038/s41467-024-51390-x · Cited by 14
Dembrow, N. C., Sawchuk, S., Dalley, R. A., Opitz-Araya, X., Hudson, M., Radaelli, C., Alfiler, L., Walling-Bell, S., Bertagnolli, D., Goldy, J., et al. (2024) · Cell Reports · doi:10.1016/j.celrep.2024.114718 · Cited by 14
“17-22 However, with few exceptions in the mouse neocortex, 23 whether such distinctions are conserved across neocortical areas remains largely untested.”
Chaotic recurrent neural networks for brain modelling: A review
Mattera, A., Alfieri, V., Granato, G., & Baldassarre, G. (2024) · Neural Networks · doi:10.1016/j.neunet.2024.107079 · Cited by 19
Qi, G., & Feldmeyer, D. (2022) · Frontiers in Neural Circuits · doi:10.3389/fncir.2022.843025 · Cited by 10
Pineau, L., Buhler, E., Tarhini, S., Bauer, Š., Crépel, V., Françoise Watrin, A., Cardoso, C., Represa, A., Szepetowski, P., & Burnashev, N. (2024) · Epilepsia · doi:10.1111/epi.18000 · Cited by 12
“%) of all excitatory neurons in layer 4 of somatosensory cortex in rodents, 19,20 were performed at room temperature (22–25°C) in Mg 2 + - free medium to obtain the contribution of the NMDAR-mediated component.”
Characterization of mWake expression in the murine brain
Bell, B. J., Wang, A. A., Kim, D. W., Xiong, J., Blackshaw, S., & Wu, M. N. (2020) · The Journal of Comparative Neurology · doi:10.1002/cne.25066 · Cited by 12
Liu, L., Zhang, Y., & Ju, J. (2022) · Neuroscience Letters · doi:10.1016/j.neulet.2022.136763 · Cited by 10
Burkhalter, A., D’Souza, R. D., Ji, W., & Meier, A. M. (2023) · Annual Review of Neuroscience · doi:10.1146/annurev-neuro-083122-021241 · Cited by 13
Patch-seq: Advances and Biological Applications
Shao, M., Zhang, W., Li, Y., Tang, L., Hao, Z.-Z., & Liu, S. (2023) · Cellular and Molecular Neurobiology · doi:10.1007/s10571-023-01436-3 · Cited by 10
“Patch-seq technology has been successfully applied to the cortex (Mahfooz and Ellender 2021; Oberst et al. 2019; Scala et al. 2019), hippocampus (Oláh et al. 2020; Qiu et al. 2012; Winterer et al. 2019), retina (Laboissonniere et al. 2019; Huang et al. 2022), and cultured neurons (van den Hurk et…”
Local Connectivity and Synaptic Dynamics in Mouse and Human NeocortexPreprint
Campagnola, L., Seeman, S. C., Chartrand, T., Kim, L., Hoggarth, A., Gamlin, C. R., Ito, S., Trinh, J., Davoudian, P. A., Radaelli, C., et al. (2021) · bioRxiv (Cold Spring Harbor Laboratory) · doi:10.1101/2021.03.31.437553 · Cited by 53
MorphoPy: A python package for feature extraction of neural morphologies.
Laturnus, S., von Daranyi, A., Huang, Z., & Berens, P. (2020) · The Journal of Open Source Software · doi:10.21105/joss.02339 · Cited by 9
“It has already been used in a series of scientific publications that relate transcriptome, electrophysiology and morphology of cortical interneurons in V1 and M1 (Scala et al., 2020, 2019).”
MethodSelf-citationMorales, L., González‐Alonso, A., Desfilis, E., & Medina, L. M. (2022) · Frontiers in Neural Circuits · doi:10.3389/fncir.2022.831074 · Cited by 10
Efficient Simulation of 3D Reaction-Diffusion in Models of Neurons and Networks
McDougal, R. A., Conte, C., Eggleston, L., Newton, A. J. H., & Galijasevic, H. (2022) · Frontiers in Neuroinformatics · doi:10.3389/fninf.2022.847108 · Cited by 8
“, 2020), 2017-25-04-slice-2-cell-2-rotated (Scala et al., 2019), 070601-exp1-zB (Groh et al.”
Sparse reduced-rank regression for exploratory visualization of paired multivariate datasetsPreprint
Kobak, D., Bernaerts, Y., Weis, M. A., Scala, F., Tolias, A. S., & Berens, P. (2018) · bioRxiv (Cold Spring Harbor Laboratory) · doi:10.1101/302208 · Cited by 14
Self-citationAn unsupervised map of excitatory neurons’ dendritic morphology in the mouse visual cortexPreprint
Weis, M. A., Papadopoulos, S., Hansel, L., et al. (2022) · bioRxiv (Cold Spring Harbor Laboratory) · doi:10.1101/2022.12.22.521541 · Cited by 9
Self-citationPyramidal neurons proportionately alter cortical interneuron subtypes
Wu, S. J., Dai, M., Yang, S.-P., McCann, C., Qiu, Y., Kumar, V., Marrero, G. J., Tsyporin, J., Huang, S., Shin, D., et al. (2026) · Nature · doi:10.1038/s41586-025-09996-8 · Cited by 26
Freitag, F. B., Ahemaiti, A., Weman, H. M., Ambroz, K., & Lagerström, M. C. (2021) · Scientific Reports · doi:10.1038/s41598-021-82649-8 · Cited by 10
Cortical somatostatin interneuron subtypes form cell-type specific circuitsPreprint
Wu, S. J., Sevier, E., Saldi, G.-A., et al. (2022) · bioRxiv (Cold Spring Harbor Laboratory) · doi:10.1101/2022.09.29.510081 · Cited by 8
“28 Genetic targeting of different SST subtypes reveals stereotyped axonal projection patterns Based on marker gene expression, we designed direct and inter-sectional genetic strategies to target either one or a combination of multiple SST interneuron subtypes (Table S3).”
InfluentialCortical layering disrupts multi-electrode current steering
Meikle, S. J., Hagan, M. A., Price, N. S. C., & Wong, Y. T. (2023) · Journal of Neural Engineering · doi:10.1088/1741-2552/acdaf7 · Cited by 7
“Both of these phenomena would be mitigated by a change in the electrode array orientation to parallel with the cortical surface since the horizontal connections are smaller in length resulting in a less distributed response [48].”
BackgroundKanigowski, D., & Urban‐Ciećko, J. (2024) · Cerebral Cortex · doi:10.1093/cercor/bhae109 · Cited by 6
“Not only do L4 excitatory neurons create reciprocal connections with local PV-INs and SST-INs but also theseinterneuronsarehighlyinterconnected(Beierleinetal.2003; Gabernet et al. 2005; Inoue and Imoto 2006; Ma et al. 2012; Xu et al. 2013; Koelbl et al. 2015; Scala et al. 2019).”
BackgroundOligodendrocyte Secreted Factors Shape Hippocampal GABAergic Neuron Transcriptome and Physiology
Mazuir, E., Richevaux, L., Nassar, M., Robil, N., de la Grange, P., Lubetzki, C., Fricker, D., & Sol‐Foulon, N. (2021) · Cerebral Cortex · doi:10.1093/cercor/bhab139 · Cited by 10
The Organization of Somatostatin-Immunoreactive Cells in the Visual Cortex of the Gerbil
Kwon, K.-M., Lee, M.-J., Chung, H.-S., Pak, J.-H., & Jeon, C. (2022) · Biomedicines · doi:10.3390/biomedicines10010092 · Cited by 4
Cortical interneurons: fit for function and fit to function? Evidence from development and evolution
Keijser, J., & Sprekeler, H. (2023) · Frontiers in Neural Circuits · doi:10.3389/fncir.2023.1172464 · Cited by 9
“[82] Federico Scala, Dmitry Kobak, Shen Shan, Yves Bernaerts, Sophie Laturnus, Cathryn Rene Cadwell, 599 Leonard Hartmanis, Emmanouil Froudarakis, Jesus Ramon Castro, Zheng Huan Tan, et al.”
BackgroundDistinct feedforward and feedback pathways for cell-type specific attention effectsPreprint
Spyropoulos, G., Schneider, M., van Kempen, J., et al. (2022) · bioRxiv (Cold Spring Harbor Laboratory) · doi:10.1101/2022.11.04.515185 · Cited by 7
Somatostatin interneurons control the timing of developmental desynchronization in cortical networksPreprint
Mòdol, L., Moissidis, M., & Marín, Ó. (2023) · bioRxiv (Cold Spring Harbor Laboratory) · doi:10.1101/2023.12.21.572767 · Cited by 7
Long-range axon branching: contributions to brain network plasticity and repair
Richards, L. J., Huang, C., Bauer, A. Q., & Lee, J. (2026) · Nature reviews. Neuroscience · doi:10.1038/s41583-025-01008-y · Cited by 9
Courcelles, E. J., Kjelsberg, K., Convertino, L., Nair, R. R., Witter, M. P., & Nigro, M. J. (2024) · European Journal of Neuroscience · doi:10.1111/ejn.16341 · Cited by 5
“Other studies have highlighted the distribution of specific cell types across cortical areas, pinpointing at regional specializations (Scala et al., 2019).”
BackgroundGawryluk, A., Cybulska-Kłosowicz, A., Charzyńska, A., Zakrzewska, R., Sobolewska, A., Kossut, M. M., & Liguz‐Lecznar, M. (2024) · Scientific Reports · doi:10.1038/s41598-024-70261-5 · Cited by 7
“One of the functions of SOM INs is to regulate the activity of parvalbumin-containing neurons (PV INs), which are activated by tactile stimuli and, in turn, exert a strong inhibitory effect on excitatory cells 81,82 .”
BackgroundShape-aware stochastic neighbor embedding for robust data visualisations
Wängberg, T., Tyrcha, J., & Li, C. (2022) · BMC Bioinformatics · doi:10.1186/s12859-022-05028-8 · Cited by 6
Distribution of calbindin-positive neurons across areas and layers of the marmoset cerebral cortex
Atapour, N., Rosa, M. G. P., Bai, S., Bednarek, S., Kulesza, A., Saworska, G., Teymornejad, S., Worthy, K. H., & Majka, P. (2024) · PLoS Computational Biology · doi:10.1371/journal.pcbi.1012428 · Cited by 8
Meyer, C. M., Vafaeva, O., Low, H., Speca, D. J., & Dı́az, E. (2025) · Molecular and Cellular Neuroscience · doi:10.1016/j.mcn.2025.104015 · Cited by 5
“Sections were then incubated with secondary antibody in the incubation buffer for 1 hour at RT on the shaker, protected from light.”
Patch-seq: Multimodal Profiling of Single-Cell Morphology, Electrophysiology, and Gene Expression
Cadwell, C. R., & Tolias, A. S. (2024) · Methods in molecular biology · doi:10.1007/978-1-0716-3621-3_15 · Cited by 4
Self-citationJiang, H.-J., Qi, G., Duarte, R., Feldmeyer, D., & van Albada, S. J. (2024) · Cerebral Cortex · doi:10.1093/cercor/bhae378 · Cited by 12
Metadata
- Authors
- Scala, F., Kobak, D., Shan, S., Bernaerts, Y., Laturnus, S., Cadwell, C. R., Hartmanis, L., Froudarakis, E., Castro, J. R., Tan, Z. H., Papadopoulos, S., Patel, S. S., Sandberg, R., Berens, P., Jiang, X., & Tolias, A. S.
- Affiliations
- Baylor College of Medicine (US)
- University of Tübingen (DE)
- Karolinska Institutet (SE)
- Corresponding author
- Jiang, Xiaolong
- Tolias, Andreas Savas
- ORCID
- Venue
- Nature Communications
- Published
- 2019-09-13
- Volume
- 10
- Issue
- 1
- Pages
- 4174-4174
- ISSN
- 2041-1723 (ISSN-L)
- PMC
- PMC6744474
- OpenAlex
- W2973144132
- Semantic Scholar
- 37f874c21f68b57cf82e9d67a01769a259bbe382
- Cited by
- 193
- References
- 95
- Citations by year
- 2026: 16 · 2025: 37 · 2024: 27 · 2023: 42 · 2022: 31 · 2021: 20 · 2020: 13 · 2019: 6
- FWCI
- 8.36
- Type
- journal article
- Language
- en
- Update notices
- correction (2019-11-04)
- Open access
- gold
- doi.org
- Locations
- Nature Communications (publishedVersion, cc-by)
- bioRxiv (Cold Spring Harbor Laboratory) (acceptedVersion)
- PubMed Central (publishedVersion, cc-by)
- PubMed (publishedVersion)
- RePEc: Research Papers in Economics (submittedVersion)
- DOAJ (DOAJ: Directory of Open Access Journals) (submittedVersion, cc-by-sa)
- DOAJ (DOAJ: Directory of Open Access Journals) (submittedVersion)
- eScholarship (California Digital Library) (submittedVersion, cc-by)
- Funders
- National Science Foundation (1707359)
- Deutsche Forschungsgemeinschaft (EXC2064, (BE5601/4-1, 276693517, 390727645, SFB1233)
- Bundesministerium für Bildung und Forschung (FKZ 01GQ1601, 01GQ1601)
- National Institutes of Health
- Intelligence Advanced Research Projects Activity (D16PC00003)
- Interior Business Center
- National Institute of Mental Health (R01MH109556, R01MH120404, MH109556, R01MH122169, U19MH114830)
- National Institute of Neurological Disorders and Stroke
- Topics
- Life Sciences › Neuroscience › Cellular and Molecular Neuroscience › Neuroscience and Neuropharmacology Research
- Life Sciences › Neuroscience › Cognitive Neuroscience › Neural dynamics and brain function
- Life Sciences › Neuroscience › Cognitive Neuroscience › Visual perception and processing mechanisms
- Keywords
- layer 4, neocortex, mouse visual cortex, somatosensory cortex, cortical cell types, Martinotti cells, somatostatin interneurons, pyramidal neurons, stellate neurons, inhibitory interneurons, excitatory-inhibitory connectivity
- MeSH terms
- Animals, Electrophysiology, Female, Interneurons, Male, Neurons, Somatosensory Cortex, Somatostatin, Neocortex, Mice
About these checks
Registry, retraction, Cites and statistics results are computed, not judged, with one exception: a printed reference that no index lists is read once by a model before it counts as a citation error. Claims are extracted by a model and kept only when their quote appears verbatim in the text; each cited source is then checked, with a model’s help, for whether it says what the claim relies on. Those verdicts can be wrong — read the claim’s quote and the cited source before relying on one.
A language model drew the claims from the paper on 2026-10-07, under version 3 of the claim definition (model deepseek-v4.1-flash, prompt extract-v3).
A second model labelled each claim on 2026-10-07 (model jev-1.13-20260917, definition revision gold-guideline-v0.2).
Cited sources are checked with a language model’s help (gpt-6-sol).
Statistics and arithmetic are recomputed, not judged.
Confidence bands are shown only for fields calibrated on our annotated test set. None is calibrated yet, so no band is shown.
What counts as a claim ›How we measure confidence ›How we check this ›
Are you an author, or do you see a problem with this page? Request a review
