

The DOI matches its Crossref record; 85 of the 85 references it cites were found in a registry or an index; none of the 137 sources its claims cite is checked for support yet.
Patrilineal segmentary systems provide a peaceful explanation for the post-Neolithic Y-chromosome bottleneck
Open accessAbstract
Studies have found a pronounced decline in male effective population sizes worldwide around 3000–5000 years ago. This bottleneck was not observed for female effective population sizes, which continued to increase over time. Until now, this remarkable genetic pattern was interpreted as the result of an ancient structuring of human populations into patrilineal groups (gathering closely related males) violently competing with each other. In this scenario, violence is responsible for the repeated extinctions of patrilineal groups, leading to a significant reduction in male effective population size. Here, we propose an alternative hypothesis by modelling a segmentary patrilineal system based on anthropological literature. We show that variance in reproductive success between patrilineal groups, combined with lineal fission (i.e., the splitting of a group into two new groups of patrilineally related individuals), can lead to a substantial reduction in the male effective population size without resorting to the violence hypothesis. Thus, a peaceful explanation involving ancient changes in social structures, linked to global changes in subsistence systems, may be sufficient to explain the reported decline in Y-chromosome diversity.
Overview
CoChat Summary
Written by AI from the paper’s full text.
TL;DR
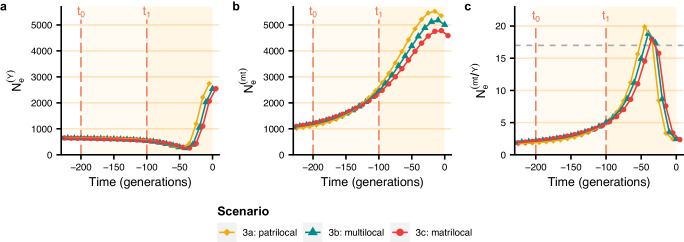
The paper uses forward-time simulations to test whether patrilineal segmentary systems, without violent competition, can explain the post-Neolithic Y-chromosome bottleneck. It finds that variance in reproductive success between patrilineal groups combined with lineal fission can substantially reduce male effective population size, producing female-to-male effective population size ratios up to around 19, comparable to the ratio of 17 reported by Karmin et al.
Key findings
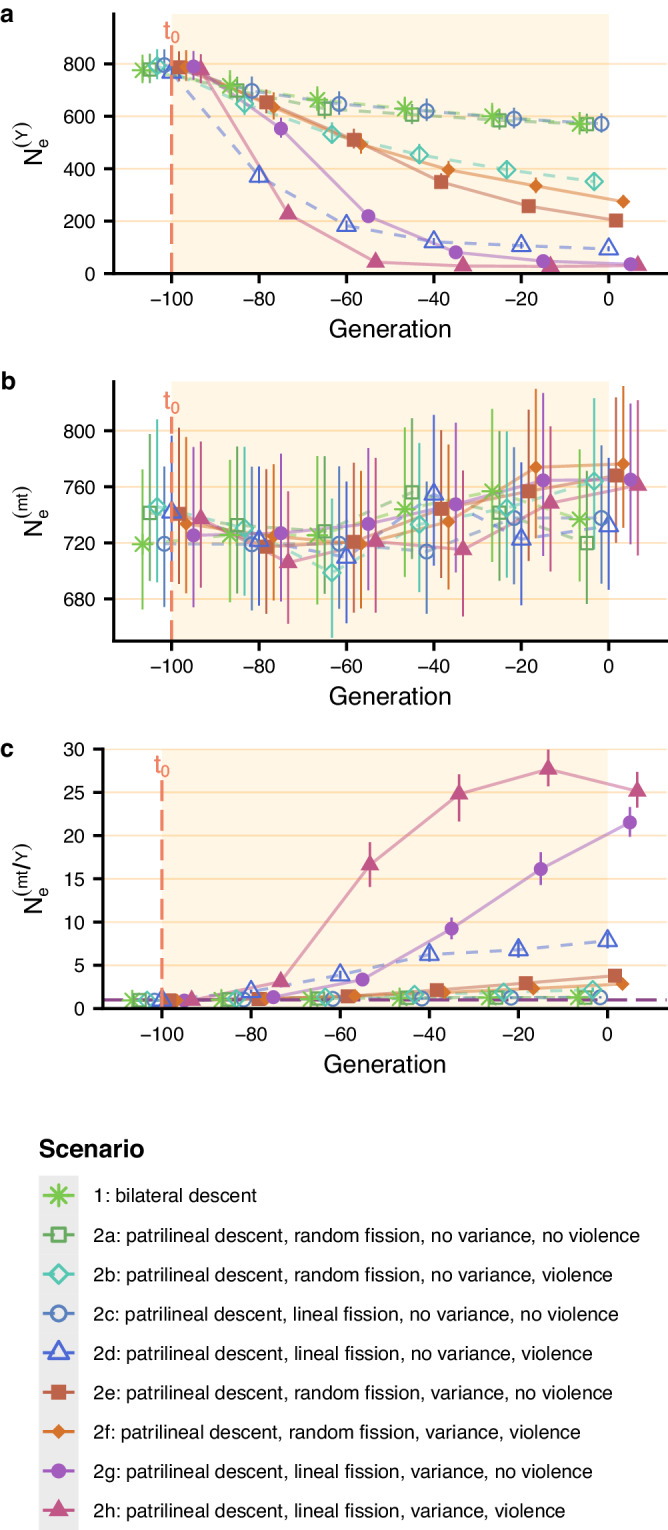
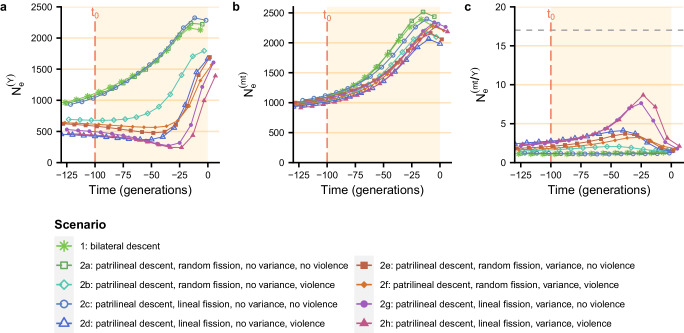
- In π-based estimates, adding variance in reproductive success between patrilineal descent groups (σ² = 0.1) and lineal fission reduced male effective population size by over 20 after 100 generations (scenarios 2g and 2h), regardless of whether violence was included.
- Coalescent-based estimates showed the same relative pattern but smaller reduction factors: scenario 2g had a male effective population size reduction factor of 2.77 and scenario 2h of 3.09, compared with 0.82 for basic patrilineal descent with random fission and no variance (scenario 2a).
- Lineal fission plus variance in reproductive success was more efficient at reducing male effective population size than violence alone; without variance in reproductive success, lineal and random fission had little difference.
- A Kipsigis-like polygyny scenario reduced male effective population size much less than patrilineal lineal fission with violence and/or variance, with π-based and coalescent-based reduction factors around 4.
Methods
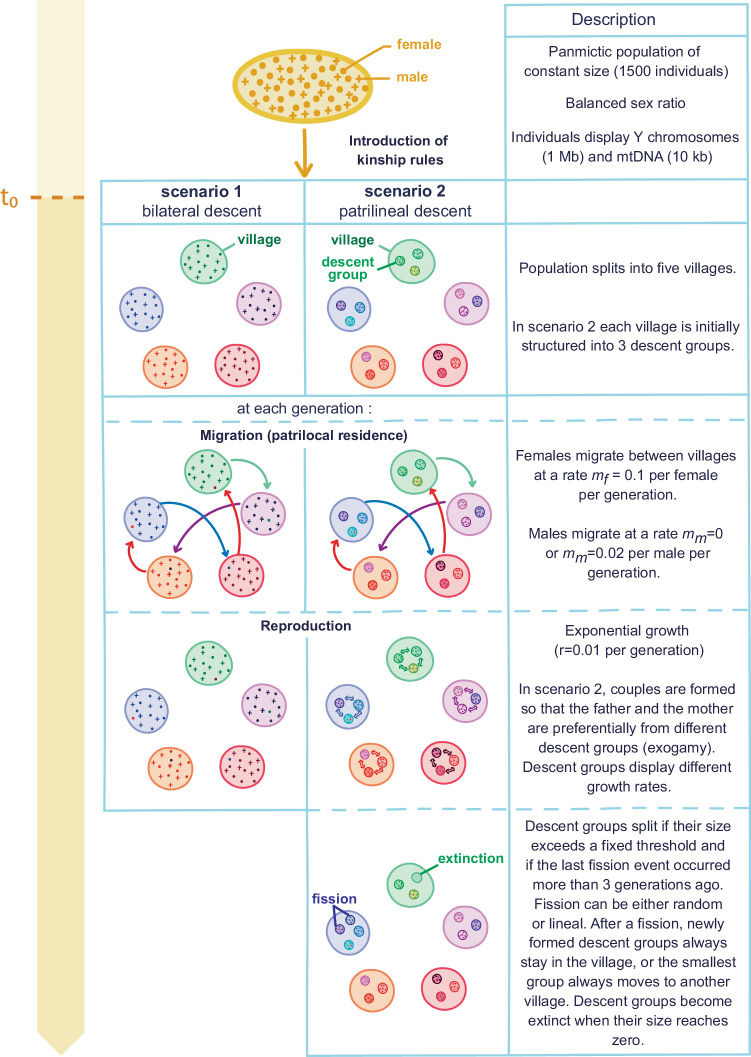
- The authors built a socio-demographic model in SLiM v4.1: 1,500 individuals simulated for 20,000 generations of panmixia, then divided into five villages with patrilocal residence, bilateral or patrilineal descent, exponential growth of 1% per generation, and 100 generations of the kinship rule of interest; 200 replicates were run per scenario.
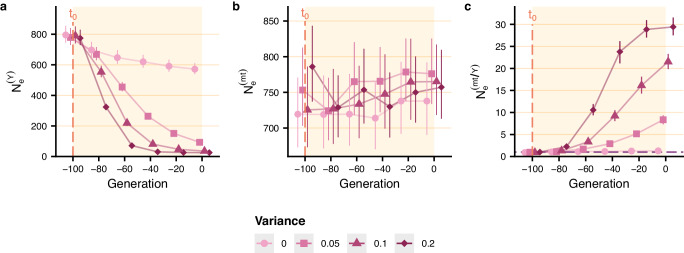
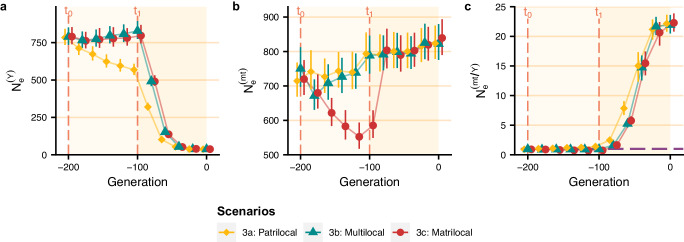
- Males carried a 1 Mb Y chromosome and females a 10 kb mtDNA; mutations were generated at 2.5 × 10⁻⁸ mutations/nucleotide/generation for the Y chromosome and 5.5 × 10⁻⁷ for mtDNA. Scenarios varied fission type (random vs. lineal), variance in reproductive success between descent groups (σ² = 0, 0.05, 0.1, 0.2), violent competition (15% of males killed per generation), male migration (0 or 2%), post-fission migration, and polygyny.
- Male and female effective population sizes were estimated using π-based nucleotide diversity over time and coalescent-based Bayesian skyline plots generated in BEAST v1.10.5.
Limitations
- The paper states that past rates of violence remain uncertain, pre-Neolithic residence patterns are poorly known, and the model does not formally model long-range migrations such as the Steppe migration.
- The paper states that the exact nature of the transition from segmentary patrilineal systems to kinship systems less efficient at reducing Y-chromosome diversity requires future study, and that coalescent-based maximum female-to-male effective population size ratios are underestimates because peaks do not occur simultaneously across replicates.
- Evident from the text: the study is a simulation modelling exercise rather than an empirical test, with parameters calibrated from ethnographic and literature-based estimates; the source of violence in the model is not specified.
Model-written summary. Check it against the paper before relying on it.
Integrity signals
Registry
Cites
Statistics
Figures
Verification
Claims the paper makes
33 Own result · 31 Own interpretation · 27 Check pending · 21 Not checked yet · 15 No full text of the sources · 8 Sources not found · 4 Own method · 1 No basis given
A result the paper reports from its own data — it cites no other source for it, so there is none to check. The quote shows it is in the paper.
In the paper
“Our observation that, in addition to the effects of lineal fission type, the variance in reproductive success between groups (and its transmission to newly formed groups after a fission event) leads to a marked loss of diversity on the Y chromosome is consistent with previous studies showing that cultural transmission of reproductive success at the individual level leads to a reduction in”
§ Patrilineal segmentary systems provide a peaceful explanation for the post-Neolithic Y-chromosome bottleneck > Discussion
plainstates a cause- Asserted: passes — The authors put it forward as true.
- Checkable: passes — It can be checked against evidence.
- Load-bearing: passes — The paper’s conclusions depend on it.
- Based: passes — The paper gives a reason why it holds.
A result the paper reports from its own data — it cites no other source for it, so there is none to check. The quote shows it is in the paper.
In the paper
“In particular, violence had a rapid effect on genetic diversity: in scenarios with variance in reproductive success between groups and lineal fission, the decline in male effective population size is much faster in the scenario with violent competition (2h) than in the scenario without violent competition (2g) (Fig. 2a).”
§ Patrilineal segmentary systems provide a peaceful explanation for the post-Neolithic Y-chromosome bottleneck > Results > π-based male and female effective population sizes
plainstates a cause- Asserted: passes — The authors put it forward as true.
- Checkable: passes — It can be checked against evidence.
- Load-bearing: unclear — It is unclear whether the paper’s conclusions depend on it.
- Based: passes — The paper gives a reason why it holds.
A result the paper reports from its own data — it cites no other source for it, so there is none to check. The quote shows it is in the paper.
In the paper
“We also found that different socio-demographic processes acted at different rates on male effective population size.”
§ Patrilineal segmentary systems provide a peaceful explanation for the post-Neolithic Y-chromosome bottleneck > Results > π-based male and female effective population sizes
plainstates a cause- Asserted: passes — The authors put it forward as true.
- Checkable: passes — It can be checked against evidence.
- Load-bearing: passes — The paper’s conclusions depend on it.
- Based: passes — The paper gives a reason why it holds.
A result the paper reports from its own data — it cites no other source for it, so there is none to check. The quote shows it is in the paper.
In the paper
“Note that the reduction in male effective population size depends on the variance in reproductive success between groups introduced in the model.”
§ Patrilineal segmentary systems provide a peaceful explanation for the post-Neolithic Y-chromosome bottleneck > Results > π-based male and female effective population sizes
plainstates a cause- Asserted: passes — The authors put it forward as true.
- Checkable: passes — It can be checked against evidence.
- Load-bearing: passes — The paper’s conclusions depend on it.
- Based: passes — The paper gives a reason why it holds.
A result the paper reports from its own data — it cites no other source for it, so there is none to check. The quote shows it is in the paper.
In the paper
“Male effective population size under the Kipsigis-like scenario, did not decrease as much as in patrilineal populations undergoing lineal fissions with violence and/or variance in reproductive success between descent groups (π-based and coalescent-based male effective population size reduction factors around 4, Supplementary Figs. 27, 28).”
§ Patrilineal segmentary systems provide a peaceful explanation for the post-Neolithic Y-chromosome bottleneck > Discussion
plain- Asserted: passes — The authors put it forward as true.
- Checkable: passes — It can be checked against evidence.
- Load-bearing: passes — The paper’s conclusions depend on it.
- Based: passes — The paper gives a reason why it holds.
- It may state two separate claims as one. 43
- Probably not a substantial claim. 42
Create a free account to see these claims.
Create a free account to see these assumptions.
62 more claims
Create a free account to see all 140 claims and to verify the 76 references still open.
Claims other papers make about this one
Each is checked against this paper’s own text: does it say what the citing paper says it does?
In the citing paper
“This scenario is expected based on sociodemographic (53) and sociocultural (54) models, which predict increased Y-chromosome haplotype frequencies in patrilineal groups through elite dominance or other privileges that enable greater access to resources and expansion through lineal segmentary fission.”
From Genomes of the Golden Horde elites and their implications for the rulers of the Mongol Empire (2026) · cites this paper as [53]
In the citing paper
“If the paternal lineage of Genghis Khan had belonged to R1b or Q lineages, these lineages would be expected to have a wide geographic distribution, corresponding to the territories of the Mongol Empire and its successor states, and to occur at high frequencies in modern populations of Mongol descent.”
From Genomes of the Golden Horde elites and their implications for the rulers of the Mongol Empire (2026) · cites this paper as [53]
Self-check
Percentages, sums and reported differences re-computed from the paper’s own numbers.
Each contradiction between two passages listed here was confirmed by an independent check.
Rated minor: it would not touch a result — a value no result rests on, a p-value that stays on the same side of the significance level, or a conflict that is clerical, resolved elsewhere in the paper, or outside its own findings.
In the paper
§ Patrilineal segmentary systems provide a peaceful explanation for the post-Neolithic Y-chromosome bottleneck > Results > Coalescent-based estimation of male and female effective population sizes
“or with lineal fission and both variance in reproductive success and violence (scenarios 2f and 2h).”
§ Patrilineal segmentary systems provide a peaceful explanation for the post-Neolithic Y-chromosome bottleneck > Results > Socio-demographic model
“| 2f | Patrilineal | Patrilocal | Random | Yes | Yes | No |”
Citations
Cites
Mathematical model for studying genetic variation in terms of restriction endonucleases.
Nei, M., & Li, W. (1979) · Proceedings of the National Academy of Sciences · doi:10.1073/pnas.76.10.5269 · Cited by 10,393
Bayesian phylogenetic and phylodynamic data integration using BEAST 1.10
Suchard, M. A., Lemey, P., Baele, G., Ayres, D. L., Drummond, A. J., & Rambaut, A. (2018) · Virus Evolution · doi:10.1093/ve/vey016 · Cited by 3,749
Bayesian Coalescent Inference of Past Population Dynamics from Molecular Sequences
Drummond, A. J. (2005) · Molecular Biology and Evolution · doi:10.1093/molbev/msi103 · Cited by 3,155
Standard cross-cultural sample
Murdock, G. P., & White, D. R. (1969) · Ethnology · doi:10.2307/3772907 · Cited by 1,149
Did Warfare Among Ancestral Hunter-Gatherers Affect the Evolution of Human Social Behaviors?
Bowles, S. (2009) · Science · doi:10.1126/science.1168112 · Cited by 773
SLiM 3: Forward Genetic Simulations Beyond the Wright–Fisher Model
Haller, B. C., & Messer, P. W. (2019) · Molecular Biology and Evolution · doi:10.1093/molbev/msy228 · Cited by 722
Efficient Coalescent Simulation and Genealogical Analysis for Large Sample Sizes
Kelleher, J., Etheridge, A. M., & McVean, G. (2016) · PLoS Computational Biology · doi:10.1371/journal.pcbi.1004842 · Cited by 670
Efficient ancestry and mutation simulation with msprime 1.0
Baumdicker, F., Bisschop, G., Goldstein, D., Gower, G., Ragsdale, A. P., Tsambos, G., Zhu, S. J., Eldon, B., Ellerman, E. C., Galloway, J., et al. (2021) · Genetics · doi:10.1093/genetics/iyab229 · Cited by 490
A recent bottleneck of Y chromosome diversity coincides with a global change in culture
Karmin, M., Saag, L., Vicente, M., Sayres, M. A. W., Järve, M., Talas, U. G., Rootsi, S., Ilumäe, A.-M., Mägi, R., Mitt, M., et al. (2015) · Genome Research · doi:10.1101/gr.186684.114 · Cited by 485
Genetic evidence for a higher female migration rate in humans.
Seielstad, M. T., Minch, E., & Cavalli-Sforza, L. L. (1998) · Nature Genetics · doi:10.1038/3088 · Cited by 450
Spread of cattle led to the loss of matrilineal descent in Africa: a coevolutionary analysis
Holden, C. J., & Mace, R. H. (2003) · Proceedings of the Royal Society B Biological Sciences · doi:10.1098/rspb.2003.2535 · Cited by 429
Multiregional Emergence of Mobile Pastoralism and Nonuniform Institutional Complexity across Eurasia
Frachetti, M. D. (2012) · Current Anthropology · doi:10.1086/663692 · Cited by 370
Intergroup Aggression in Chimpanzees and War in Nomadic Hunter-Gatherers
Wrangham, R. W., & Glowacki, L. (2012) · Human Nature · doi:10.1007/s12110-012-9132-1 · Cited by 362
Heller, R., Chikhi, L., & Siegismund, H. R. (2013) · PLoS ONE · doi:10.1371/journal.pone.0062992 · Cited by 344
Punctuated bursts in human male demography inferred from 1,244 worldwide Y-chromosome sequences
The 1000 Genomes Project Consortium, Poznik, G. D., Xue, Y., Mendez, F. L., Willems, T. F., Massaia, A., Wilson Sayres, M. A., Ayub, Q., McCarthy, S. A., Narechania, A., et al. (2016) · Nature Genetics · doi:10.1038/ng.3559 · Cited by 331
Lethal Aggression in Mobile Forager Bands and Implications for the Origins of War
Fry, D. P., & Söderberg, P. (2013) · Science · doi:10.1126/science.1235675 · Cited by 291
Human mtDNA and Y-chromosome variation is correlated with matrilocal versus patrilocal residence.
Oota, H., Settheetham-Ishida, W., Tiwawech, D., Ishida, T., & Stoneking, M. (2001) · Nature Genetics · doi:10.1038/ng711 · Cited by 268
Kinship-based social inequality in Bronze Age Europe
Mittnik, A., Massy, K., Knipper, C., Wittenborn, F., Friedrich, R., Pfrengle, S., Burri, M., Carlichi-Witjes, N., Deeg, H., Furtwängler, A., et al. (2019) · Science · doi:10.1126/science.aax6219 · Cited by 265
The Segmentary Lineage: An Organization of Predatory Expansion1
SAHLINS, M. D. (1961) · American Anthropologist · doi:10.1525/aa.1961.63.2.02a00050 · Cited by 248
Besaggio, D., Fuselli, S., Srikummool, M., Kampuansai, J., Castrì, L., Tyler‐Smith, C., Seielstad, M. T., Kangwanpong, D., & Bertorelle, G. (2007) · BMC Evolutionary Biology · doi:10.1186/1471-2148-7-s2-s12 · Cited by 217
Kipsigis women's preferences for wealthy men: evidence for female choice in mammals?
Mulder, M. B. (1990) · Behavioral Ecology and Sociobiology · doi:10.1007/bf00164897 · Cited by 217
On Cultural and Reproductive Success: Kipsigis Evidence
Mulder, M. B. (1987) · American Anthropologist · doi:10.1525/aa.1987.89.3.02a00050 · Cited by 215
Ember, C. R. (1978) · Ethnology · doi:10.2307/3773193 · Cited by 206
Tree‐sequence recording in SLiM opens new horizons for forward‐time simulation of whole genomes
Haller, B. C., Galloway, J., Kelleher, J., Messer, P. W., & Ralph, P. L. (2018) · Molecular Ecology Resources · doi:10.1111/1755-0998.12968 · Cited by 196
Unraveling ancestry, kinship, and violence in a Late Neolithic mass grave
Schroeder, H., Margaryan, A., Szmyt, M., Theulot, B., Włodarczak, P., Rasmussen, S., Gopalakrishnan, S., Szczepanek, A., Konopka, T., Jensen, T. Z. T., et al. (2019) · Proceedings of the National Academy of Sciences · doi:10.1073/pnas.1820210116 · Cited by 195
The Structure of Unilineal Descent Groups 1
FORTES, M. (1953) · American Anthropologist · doi:10.1525/aa.1953.55.1.02a00030 · Cited by 190
Massive Migrations? The Impact of Recent aDNA Studies on our View of Third Millennium Europe
Furholt, M. (2017) · European Journal of Archaeology · doi:10.1017/eaa.2017.43 · Cited by 188
A high-resolution picture of kinship practices in an Early Neolithic tomb
Fowler, C., Olalde, I., Cummings, V., Armit, I., Büster, L., Cuthbert, S., Rohland, N., Cheronet, O., Pinhasi, R., & Reich, D. (2022) · Nature · doi:10.1038/s41586-021-04241-4 · Cited by 169
The phylogenetic roots of human lethal violence
Gómez, J. M., Verdú, M., González-Megías, A., & Méndez, M. (2016) · Nature · doi:10.1038/nature19758 · Cited by 164
Kayser, M., Brauer, S., Weiss, G., Schiefenhövel, W., Underhill, P., Shen, P., Oefner, P., Tommaseo-Ponzetta, M., & Stoneking, M. (2003) · The American Journal of Human Genetics · doi:10.1086/346065 · Cited by 149
Agriculture, population growth, and statistical analysis of the radiocarbon record
Zahid, H. J., Robinson, E., & Kelly, R. L. (2016) · Proceedings of the National Academy of Sciences · doi:10.1073/pnas.1517650112 · Cited by 148
Marital Residence among Foragers
Marlowe, F. W. (2004) · Current Anthropology · doi:10.1086/382256 · Cited by 143
Megalithic tombs in western and northern Neolithic Europe were linked to a kindred society
Sánchez-Quinto, F., Malmström, H., Fraser, M., Girdland-Flink, L., Svensson, E. M., Simões, L. G., George, R., Hollfelder, N., Burenhult, G., Noble, G., et al. (2019) · Proceedings of the National Academy of Sciences · doi:10.1073/pnas.1818037116 · Cited by 138
Means, variances, and ranges in reproductive success: comparative evidence
Betzig, L. (2012) · Evolution and Human Behavior · doi:10.1016/j.evolhumbehav.2011.10.008 · Cited by 128
On Natural Selection and the Inheritance of Wealth [and Comments and Reply]
Hartung, J., Abelson, A., Basu, A., Basu, M. P., Beals, K. L., Chiarelli, B., Curtain, C. C., Edwards, C. R., Fix, A. G., Korey, K. A., et al. (1976) · Current Anthropology · doi:10.1086/201799 · Cited by 123
Zeng, T. C., Aw, A. J., & Feldman, M. W. (2018) · Nature Communications · doi:10.1038/s41467-018-04375-6 · Cited by 121
Wilder, J. A., Kingan, S. B., Mobasher, Z., Pilkington, M. M., & Hammer, M. F. (2004) · Nature Genetics · doi:10.1038/ng1428 · Cited by 118
Natural Selection Reduced Diversity on Human Y Chromosomes
Wilson Sayres, M. A., Lohmueller, K. E., & Nielsen, R. (2014) · PLoS Genetics · doi:10.1371/journal.pgen.1004064 · Cited by 117
Sex‐specific demographic behaviours that shape human genomic variation
HEYER, E., CHAIX, R., PAVARD, S., & AUSTERLITZ, F. (2012) · Molecular Ecology · doi:10.1111/j.1365-294x.2011.05406.x · Cited by 116
Self-citationExtensive pedigrees reveal the social organization of a Neolithic community
Rivollat, M., Rohrlach, A. B., Ringbauer, H., Childebayeva, A., Mendisco, F., Barquera, R., Szolek, A., Le Roy, M., Colleran, H., Tuke, J., et al. (2023) · Nature · doi:10.1038/s41586-023-06350-8 · Cited by 116
Destro-Bisol, G., Donati, F., Coia, V., Boschi, I., Verginelli, F., Caglià, A., Tofanelli, S., Spedini, G., & Capelli, C. (2004) · Molecular Biology and Evolution · doi:10.1093/molbev/msh186 · Cited by 112
From Social to Genetic Structures in Central Asia
Chaix, R., Quintana-Murci, L., Hegay, T., Hammer, M. F., Mobasher, Z., Austerlitz, F., & Heyer, E. (2007) · Current Biology · doi:10.1016/j.cub.2006.10.058 · Cited by 111
Self-citationGenetic insights into the social organization of Neanderthals
Skov, L., Peyrégne, S., Popli, D., Iasi, L. N. M., Devièse, T., Slon, V., Zavala, E. I., Hajdinjak, M., Sümer, A. P., Grote, S., et al. (2022) · Nature · doi:10.1038/s41586-022-05283-y · Cited by 106
Hamilton, G., Stoneking, M., & Excoffier, L. (2005) · Proceedings of the National Academy of Sciences · doi:10.1073/pnas.0409253102 · Cited by 95
Ségurel, L., Martínez-Cruz, B., Quintana-Murci, L., Balaresque, P., Georges, M., Hegay, T., Aldashev, A., Nasyrova, F., Jobling, M. A., Heyer, E., et al. (2008) · PLoS Genetics · doi:10.1371/journal.pgen.1000200 · Cited by 95
Large-scale recent expansion of European patrilineages shown by population resequencing
Batini, C., Hallast, P., Zadik, D., Delser, P. M., Benazzo, A., Ghirotto, S., Arroyo-Pardo, E., Cavalleri, G. L., de Knijff, P., Dupuy, B. M., et al. (2015) · Nature Communications · doi:10.1038/ncomms8152 · Cited by 91
Production Systems, Inheritance, and Inequality in Premodern Societies: Conclusions
Smith, E. A., Borgerhoff Mulder, M., Bowles, S., Gurven, M., Hertz, T., & Shenk, M. K. (2010) · Current Anthropology · doi:10.1086/649029 · Cited by 88
Furholt, M. (2021) · Journal of Archaeological Research · doi:10.1007/s10814-020-09153-x · Cited by 78
Greater wealth inequality, less polygyny: rethinking the polygyny threshold model
Ross, C. T., Mulder, M. B., Oh, S.-Y., Bowles, S., Beheim, B., Bunce, J. A., Caudell, M. A., Clark, G., Colleran, H., Cortez, C., et al. (2018) · Journal of The Royal Society Interface · doi:10.1098/rsif.2018.0035 · Cited by 71
Ancient genomes reveal social and genetic structure of Late Neolithic Switzerland
Furtwängler, A., Rohrlach, A. B., Lamnidis, T. C., Papac, L., Neumann, G. U., Siebke, I., Reiter, E., Steuri, N., Hald, J., Denaire, A., et al. (2020) · Nature Communications · doi:10.1038/s41467-020-15560-x · Cited by 71
Gunnarsdóttir, E. D., Nandineni, M. R., Li, M., Myles, S., Gil, D., Pakendorf, B., & Stoneking, M. (2011) · Nature Communications · doi:10.1038/ncomms1235 · Cited by 68
Contrasting Paternal and Maternal Genetic Histories of Thai and Lao Populations
Kutanan, W., Kampuansai, J., Srikummool, M., Brunelli, A., Ghirotto, S., Arias, L., Macholdt, E., Hübner, A., Schröder, R., & Stoneking, M. (2019) · Molecular Biology and Evolution · doi:10.1093/molbev/msz083 · Cited by 68
Seguin-Orlando, A., Donat, R., Der Sarkissian, C., Southon, J., Thèves, C., Manen, C., Tchérémissinoff, Y., Crubézy, E., Shapiro, B., Deleuze, J.-F., et al. (2021) · Current Biology · doi:10.1016/j.cub.2020.12.015 · Cited by 61
The Genetic or Mythical Ancestry of Descent Groups: Lessons from the Y Chromosome
Chaix, R., Austerlitz, F., Khegay, T., Jacquesson, S., Hammer, M. F., Heyer, E., & Quintana-Murci, L. (2004) · The American Journal of Human Genetics · doi:10.1086/425938 · Cited by 60
Self-citationOn Mechanisms of Population Growth During the Neolithic
Hassan, F. A., & Sengel, R. A. (1973) · Current Anthropology · doi:10.1086/201380 · Cited by 59
Harrower, M. J., McCorriston, J., & D’Andrea, A. C. (2010) · American Antiquity · doi:10.7183/0002-7316.75.3.452 · Cited by 59
Smouse, P. E., Vitzthum, V. J., & Neel, J. V. (1981) · Genetics · doi:10.1093/genetics/98.1.179 · Cited by 57
Hames, R. (2019) · Human Nature · doi:10.1007/s12110-019-09340-w · Cited by 55
Ancestry Matters: Patrilineage Growth and Extinction
Song, X., Campbell, C. D., & Lee, J. Z. (2015) · American Sociological Review · doi:10.1177/0003122415576516 · Cited by 53
Kinship practices in the early state El Argar society from Bronze Age Iberia
Villalba-Mouco, V., Oliart, C., Rihuete-Herrada, C., Rohrlach, A. B., Fregeiro, M. I., Childebayeva, A., Ringbauer, H., Olalde, I., Celdrán Beltrán, E., Puello-Mora, C., et al. (2022) · Scientific Reports · doi:10.1038/s41598-022-25975-9 · Cited by 53
Ancient DNA gives new insights into a Norman Neolithic monumental cemetery dedicated to male elites
Rivollat, M., Thomas, A., Ghesquière, E., Rohrlach, A. B., Späth, E., Pemonge, M.-H., Haak, W., Chambon, P., & Deguilloux, M.-F. (2022) · Proceedings of the National Academy of Sciences · doi:10.1073/pnas.2120786119 · Cited by 44
Descent, marriage, and residence practices of a 3,800-year-old pastoral community in Central Eurasia
Blöcher, J., Brami, M., Feinauer, I. S., Stolarczyk, E., Diekmann, Y., Vetterdietz, L., Karapetian, M., Winkelbach, L., Kokot, V., Vallini, L., et al. (2023) · Proceedings of the National Academy of Sciences · doi:10.1073/pnas.2303574120 · Cited by 42
Sex‐specific genetic diversity is shaped by cultural factors in Inner Asian human populations
Marchi, N., Hegay, T., Mennecier, P., Georges, M., Laurent, R., Whitten, M., Endicott, P., Aldashev, A., Dorzhu, C., Nasyrova, F., et al. (2017) · American Journal of Physical Anthropology · doi:10.1002/ajpa.23151 · Cited by 38
97. On the Ideology and Composition of Descent Groups
Sahlins, M. D. (1965) · Man · doi:10.2307/2797444 · Cited by 35
Chyleński, M., Makarowicz, P., Juras, A., Krzewińska, M., Pospieszny, Ł., Ehler, E., Breszka, A., Górski, J., Taras, H., Szczepanek, A., et al. (2023) · Nature Communications · doi:10.1038/s41467-023-40072-9 · Cited by 34
Batini, C., Hallast, P., Vågene, Å. J., Zadik, D., Eriksen, H. A., Pamjav, H., Sajantila, A., Wetton, J. H., & Jobling, M. A. (2017) · Scientific Reports · doi:10.1038/s41598-017-11307-9 · Cited by 31
On Determining the Probable Rate of Population Growth During the Neolithic
Carneiro, R. L., & Hilse, D. F. (1966) · American Anthropologist · doi:10.1525/aa.1966.68.1.02a00230 · Cited by 29
The genetic and cultural impact of the Steppe migration into Europe
Scorrano, G., Yediay, F. E., Pinotti, T., Feizabadifarahani, M., & Kristiansen, K. (2021) · Annals of Human Biology · doi:10.1080/03014460.2021.1942984 · Cited by 27
The influence of clan structure on the genetic variation in a single Ghanaian village
Sanchez-Faddeev, H., Pijpe, J., van der Hulle, T., Meij, H. J., J van der Gaag, K., Slagboom, P. E., Westendorp, R. G. J., & de Knijff, P. (2013) · European Journal of Human Genetics · doi:10.1038/ejhg.2013.12 · Cited by 22
Causes, Consequences, and Kin Bias of Human Group Fissions
Walker, R. S., & Hill, K. R. (2014) · Human Nature · doi:10.1007/s12110-014-9209-0 · Cited by 21
The Genographic Consortium, Balanovsky, O., Chukhryaeva, M., Zaporozhchenko, V., Urasin, V., Zhabagin, M., Hovhannisyan, A., Agdzhoyan, A., Dibirova, K., Kuznetsova, M., et al. (2017) · Human Genetics · doi:10.1007/s00439-017-1770-2 · Cited by 20
Ly, G., Alard, B., Laurent, R., Lafosse, S., Toupance, B., Monidarin, C., Diffloth, G., Bourdier, F., Evrard, O., Pavard, S., et al. (2018) · American Journal of Physical Anthropology · doi:10.1002/ajpa.23374 · Cited by 20
Self-citationShenk, M. K., Begley, R. O., Nolin, D. A., & Swiatek, A. (2019) · Philosophical Transactions of the Royal Society B: Biological Sciences · doi:10.1098/rstb.2019.0006 · Cited by 20
Force and Fission in Northern Somali Lineage Structure1
LEWIS, I. M. (1961) · American Anthropologist · doi:10.1525/aa.1961.63.1.02a00060 · Cited by 19
Unilineal Descent Organization and Deep Christianization: A Cross-Cultural Comparison
Korotayev, A. V. (2003) · Cross-Cultural Research · doi:10.1177/1069397102238925 · Cited by 19
Isolation, contact and social behavior shaped genetic diversity in West Timor
Tumonggor, M. K., Karafet, T. M., Downey, S., Lansing, J. S., Norquest, P., Sudoyo, H., Hammer, M. F., & Cox, M. P. (2014) · Journal of Human Genetics · doi:10.1038/jhg.2014.62 · Cited by 18
Hunley, K. L., Spence, J. E., & Merriwether, D. A. (2008) · American Journal of Physical Anthropology · doi:10.1002/ajpa.20720 · Cited by 16
Violence trends in the ancient Middle East between 12,000 and 400 bce
Baten, J., Benati, G., & Sołtysiak, A. (2023) · Nature Human Behaviour · doi:10.1038/s41562-023-01700-y · Cited by 15
Patterns of Collective Violence in the Early Neolithic of Central Europe
Meyer, C., Kürbis, O., Dresely, V., & Alt, K. W. (2018) · Quantitative Methods in the Humanities and Social Sciences · doi:10.1007/978-3-319-78828-9_2 · Cited by 13
Destro Bisol, G., Capocasa, M., & Anagnostou, P. (2012) · Molecular Ecology · doi:10.1111/mec.12001 · Cited by 11
Group membership, geography and shared ancestry: Genetic variation in the Basotho of Lesotho
Montinaro, F., Davies, J., & Capelli, C. (2016) · American Journal of Physical Anthropology · doi:10.1002/ajpa.22933 · Cited by 11
Bronze Age Encounters: Violent or Peaceful?
Harding, A. (2018) · Cambridge University Press eBooks · doi:10.1017/9781316884522.003 · Cited by 10
Guez, J., Achaz, G., Bienvenu, F., Cury, J., Toupance, B., Heyer, É., Jay, F., & Austerlitz, F. (2023) · GENETICS · doi:10.1093/genetics/iyad007 · Cited by 7
Self-citationMazières, S., Oviedo, P., Kamel, C., Bailly, P., Costedoat, C., & Chiaroni, J. (2018) · European Journal of Human Genetics · doi:10.1038/s41431-018-0154-y · Cited by 5
A systematic review of post-marital residence patterns in prehistoric hunter-gatherers
Brewer, D. D. (2016) · doi:10.1101/057059 · Cited by 4
Research works printed but not linked: 12
- Bandelt, H.-J., Macaulay, V. & Richards, M. B. What molecules can’t tell us about the spread of languages and the neolithic. In Bellwood, P. & Renfrew, C. (eds.) Examining the Farming/Language Dispersal Hypothesis, McDonald Institute Monographs (Cambridge University Press, Cambridge, UK, 2002).
- Fox, R. Kinship and Marriage: An Anthropological Perspective. A Pelican Original (Cambridge University Press, Cambridge, 1967).
- Pinker, S. The Better Angels of Our Nature: The Decline of Violence in History and Its Causes (Penguin UK, London, 2011).
- Fontijn, D. Giving Up Weapons. 145–154 (Oxford: Archaeopress, Oxford, 2005).
- Aberle, D. F. Matrilineal Descent in Cross-cultural Perspective, 655–727 (University of California Press, Berkeley, 1961).
- Murdock, G. P. Social Structure. (Macmillan, Oxford, England, 1949).
- Forde, C. D. Fission and accretion in the patrilineal clans of a semi-bantu community in southern Nigeria. J. R. Anthropol. Inst. G.B. Irel. 68, 311–338 (1938).
- Pasternak, B. Descent and social complexity. In Introduction to Kinship and Social Organization, 111–123 (Prentice Hall, New Jersey, 1976).
- Goody, J. The European Family (Wiley, 2000).
- Oboler, R. S. Nandi. In Ember, C. R. & Ember, M. (eds.) Encyclopedia of Sex and Gender: Men and Women in the World’s Cultures Volume I: Topics and Cultures A-K Volume II: Cultures L-Z, 716–724 (Springer Boston, MA, USA, 2004).
- Tange, O. Gnu parallel - the command-line power tool. USENIX Mag. 36, 42–47 (2011).
- Davison, A. C. & Hinkley, D. V. Bootstrap Methods and their Application. Cambridge Series in Statistical and Probabilistic Mathematics (Cambridge University Press, Cambridge, 1997).
Cited by
Wang, M., Sun, Q., Feng, Y., Wei, L.-H., Liu, K., Luo, L., Huang, Y., Zhou, K., Yuan, H., Lv, H., et al. (2025) · Journal of Genetics and Genomics · doi:10.1016/j.jgg.2024.11.012 · Cited by 19
Wang, M., Liu, Y., Luo, L., Wang, Z., Feng, Y., Yang, T., Chen, J., Liu, Y., Huang, Y., Sun, Q., et al. (2026) · Science Advances · doi:10.1126/sciadv.ady1597 · Cited by 8
Not by Selection Alone: Expanding the Scope of Gene‐Culture Coevolution
Kasser, S. M., Laland, K. N., Fortunato, L., & Feldman, M. W. (2025) · Evolutionary Anthropology Issues News and Reviews · doi:10.1002/evan.70007 · Cited by 8
Croze, M., Paladin, A., Zingale, S., Alemanno, S., Nicolis, F., Mottes, E., Maixner, F., Pedrotti, A., Günther, T., Zink, A., et al. (2025) · Nature Communications · doi:10.1038/s41467-025-61601-8 · Cited by 6
Beyond Genetics: Exploring Aspects of Non-Biological Kinship in Prehistoric Times
Sabina, C., Corral, A. M. H., Rebay‐Salisbury, K., Eszter, B., Brami, M., Chaix, R., Hrnčíř, V., Kent, J., David, F. L., Roy, M. L., et al. (2025) · Nature anthropology · doi:10.70322/natanthropol.2025.10016 · Cited by 6
Self-citation
Metadata
- Authors
- Guyon, L., Guez, J., Toupance, B., Heyer, E., & Chaix, R.
- Affiliations
- Centre National de la Recherche Scientifique (FR)
- Corresponding author
- Guyon, Léa
- Chaix, Raphaëlle
- Venue
- Nature Communications
- Published
- 2024-04-24
- Volume
- 15
- Issue
- 1
- Pages
- 3243-3243
- ISSN
- 2041-1723 (ISSN-L)
- PMC
- PMC11043392
- OpenAlex
- W4395081706
- Cited by
- 28
- References
- 85
- Citations by year
- 2026: 14 · 2025: 11 · 2024: 3
- FWCI
- 5.63
- Type
- journal article
- Language
- en
- Open access
- gold
- doi.org
- Locations
- Nature Communications (publishedVersion, cc-by)
- PubMed Central (publishedVersion, cc-by)
- PubMed (publishedVersion)
- HAL (submittedVersion, other-oa)
- RePEc: Research Papers in Economics (submittedVersion)
- DOAJ (DOAJ: Directory of Open Access Journals) (submittedVersion, cc-by-sa)
- Funders
- The PhD funding is a CDSN granted by the Ecole Normale Supérieure and delivered by the MNHN (Museum National d'Histoire Naturelle).
- Topics
- Life Sciences › Biochemistry, Genetics and Molecular Biology › Genetics › Forensic and Genetic Research
- Life Sciences › Biochemistry, Genetics and Molecular Biology › Genetics › Genetic diversity and population structure
- Social Sciences › Cultural Studies › Language and cultural evolution
- Keywords
- social structure change, subsistence change, Y-chromosome diversity
- MeSH terms
- Female, Genetics, Population, Humans, Male, Population Density, Genetic Variation, Violence, Chromosomes, Human, Y, History, Ancient
About these checks
Registry, retraction, Cites and statistics results are computed, not judged, with one exception: a printed reference that no index lists is read once by a model before it counts as a citation error. Claims are extracted by a model and kept only when their quote appears verbatim in the text; each cited source is then checked, with a model’s help, for whether it says what the claim relies on. Those verdicts can be wrong — read the claim’s quote and the cited source before relying on one.
A language model drew the claims from the paper on 2026-11-12, under version 3 of the claim definition (model deepseek-v4.1-flash, prompt extract-v3).
A second model labelled each claim on 2026-11-12 (model jev-1.13-20260917, definition revision gold-guideline-v0.2).
Statistics and arithmetic are recomputed, not judged.
Confidence bands are shown only for fields calibrated on our annotated test set. None is calibrated yet, so no band is shown.
What counts as a claim ›How we measure confidence ›How we check this ›
Are you an author, or do you see a problem with this page? Request a review
