

The DOI matches its Crossref record; 140 of the 140 references it cites were found in a registry or an index; 53 of the 69 sources its claims cite were checked for support.
A mouse tissue atlas of small noncoding RNA
Open accessAbstract
Significance: We report a systematic unbiased analysis of small RNA molecule expression in 11 different tissues of the model organism mouse. We discovered uncharacterized noncoding RNA molecules and identified that ∼30% of total noncoding small RNA transcriptome are distributed across the body in a tissue-specific manner with some also being sexually dimorphic. Distinct distribution patterns of small RNA across the body suggest the existence of tissue-specific mechanisms involved in noncoding RNA processing.
Overview
AI snapshot
Written from the paper’s full text.
TL;DR
This study presents a small noncoding RNA atlas across 11 adult mouse tissues, identifying tissue-specific and sex-dimorphic expression across miRNA, snoRNA, snRNA, scaRNA, tRF, and other ncRNA classes. It also reports novel miRNAs, tissue-dependent miRNA arm switching, and integration with scATAC-seq to infer cell-type origins.
Key findings
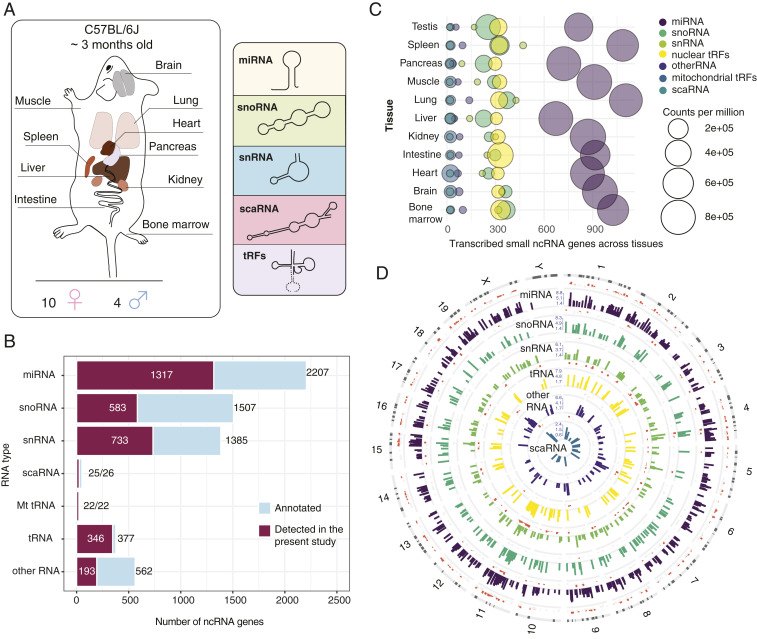
- From 140 small RNA-seq libraries across 11 tissues, the authors identified 1,317 miRNAs, 733 snRNAs, 583 snoRNAs, 25 scaRNAs, 346 tRNAs, 22 mitochondrial tRNAs, and 193 other small ncRNAs; ∼30% of the total noncoding small RNA transcriptome was tissue-specific, with 897 of 3,219 detected genes (28%) contributing to tissue-specific signatures at FDR < 1%, and brain containing the highest number of unique transcripts (∼400).
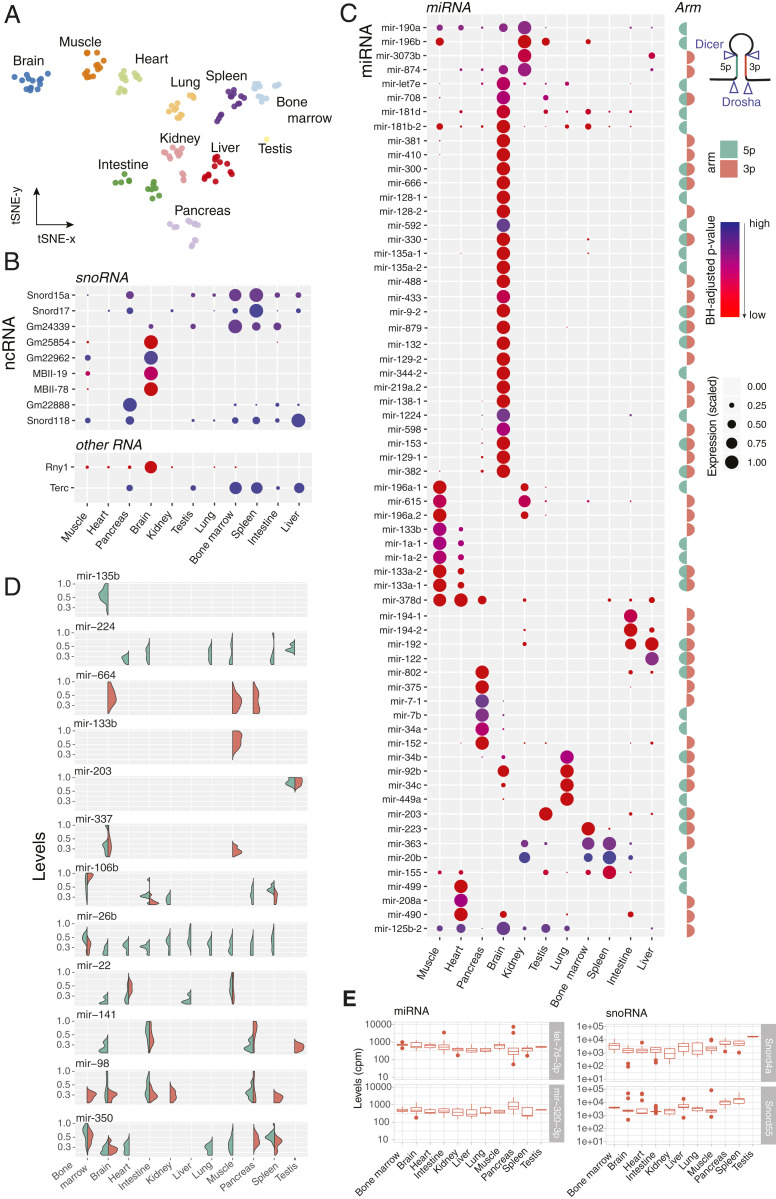
- Tissue specificity extended beyond miRNAs: >200 snoRNAs showed tissue-specific patterns, Snora35 and Snord116 were brain-exclusive (TSI = 1), Rny1 was high in brain, Terc was highest in bone marrow and spleen, and ∼400 miRNAs were differentially expressed across tissues, nearly one-quarter of them brain-specific; ∼5% of miRNAs switched arm preference between tissues, including mir-141 and mir-350.
- Sex-biased miRNAs were identified at FDR < 0.01, with kidney and lung containing the most (27 and 18), followed by brain (7), muscle (5), and heart (2); four of five male-specific brain miRNAs came from a 5-kb region of the imprinted Dlk1-Dio3 locus, and all six sex-specific novel miRNAs were male-dominant.
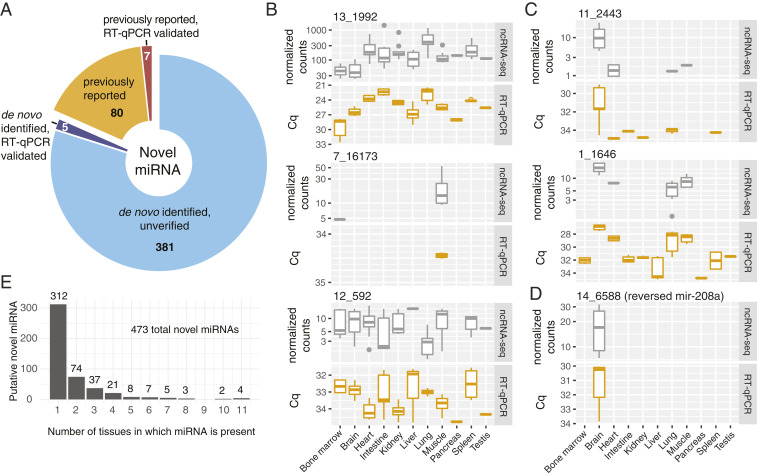
- Novel miRNA discovery yielded 473 candidate regions, 214 supported by AGO-CLIP, 87 previously reported, and 12 validated; tRFs made up about a quarter of libraries, with nuclear tRNA fragments mostly 33 nt and mitochondrial fragments spanning 18–54 nt; an SVM tissue classifier reached 0.96 accuracy on postnatal ENCODE data and 0.69 on embryonic data.
Methods
- Small RNA-seq was performed on 11 tissues from adult C57BL/6J mice (4 males, 10 females, ∼3 mo old), generating 140 libraries; RNA was extracted, prepared with Illumina TruSeq Small RNA, and sequenced on NextSeq500.
- Reads were mapped to GRCm38 with STAR and quantified using GENCODE M20, miRBase v22, and GtRNAdb annotations; tRFs were analyzed with unitas.
- Analyses included DESeq2 normalization, t-SNE, tissue specificity index (TSI), likelihood-ratio test differential expression, sex comparisons with Wald tests and permutation, target correlation, miRDeep2 for novel miRNAs with AGO-CLIP/literature/RT-qPCR validation, SVM tissue classification trained on 1,973 miRNAs and tested on ENCODE data, and integration with scATAC-seq/Cicero and 10X mouse brain data.
Limitations
- The paper states that resolution limitations of the mouse ATAC atlas prevented unambiguous cell-type assignment for the majority of brain-specific ncRNAs, and that lung open chromatin data did not provide sufficient resolution to infer cell types for most transcripts; direct validation of cell-specific transcripts remains desirable.
- The paper notes technical limitations of small RNA sequencing, which has not yet been applied to single neurons and still relies on enrichment of certain cell types.
- Evident from the text: sex-specific comparisons used an unbalanced sample (4 males vs 10 females), and tissue-level bulk profiling cannot fully resolve cell-type composition.
Model-written summary. Check it against the paper before relying on it.
Integrity signals
Registry
Cites
Statistics
Figures
Verification
Claims the paper makes
107 Own result · 19 Partly supported · 14 Own method · 9 Own interpretation · 7 Supported · 5 No full text of the sources · 2 Supported so far · 2 Mixed support · 2 Couldn’t confirm · 1 Not supported · accuracy not yet measured
At least one cited source doesn’t support this claim or points to a different paper, and none confirmed it — see the verdicts below.
In the paper
“our data suggest that Terc is specific to cells of hematopoietic origin.”
§ A mouse tissue atlas of small noncoding RNA > Results > Tissue-Specific Expression of Rny, Terc, and Other ncRNA.
What the sources say
- Not checked — no full text of the sourcecites [39] Morrison S. J., Prowse K. R., Ho P., Weissman I. L., Telomerase activity in hematopoietic cells is associated with self-renewal potential. Immunity 5, 207– 216 (1996). 8808676 source
- Disputedcites [40] Liu H., Yang Y., Ge Y., Liu J., Zhao Y., TERC promotes cellular inflammatory response independent of telomerase. Nucleic Acids Res. 47, 8084– 8095 (2019). 31294790 PMC6735767 sourceExperimental — accuracy not yet measured
The Introduction says TERC is ubiquitously expressed in terminally differentiated human somatic cells, contrary to its being specific to cells of hematopoietic origin. The Results also study TERC in U2OS cancer cells. (LLM, conf=0.88)
Checked by a reasoning model — may be wrong.
hedgedcorrelational- Asserted: passes — The authors put it forward as true.
- Checkable: passes — It can be checked against evidence.
- Load-bearing: passes — The paper’s conclusions depend on it.
- Based: passes — The paper gives a reason why it holds.
Some cited sources support this claim and some don’t — read each source’s verdict below.
In the paper
“This highlights the complexity of tissue-dependent miRNA biogenesis and indicates that the phenomena of miRNA arm switching, so far only observed in cancer, extends to healthy mammalian tissues (43–45).”
§ A mouse tissue atlas of small noncoding RNA > Results > Tissue-Specific Arm Selection of miRNA.
What the sources say
- Disputedcites [43] Chen L., miRNA arm switching identifies novel tumour biomarkers. EBioMedicine 38, 37– 46 (2018). 30425004 PMC6306400 sourceExperimental — accuracy not yet measured
The Introduction (page unavailable) says arm switching had already been observed across tissues, developmental stages and species, contrary to the claim that it had so far been observed only in cancer. The Results (page unavailable) compare tumours with tumour-adjacent normal tissue; they do not establish a new extension to healthy mammalian tissues. (LLM, conf=0.86)
Checked by a reasoning model — may be wrong.
- Partly supportedcites [44] Pinel K., Diver L. A., White K., McDonald R. A., Baker A. H., Substantial dysregulation of miRNA passenger strands underlies the vascular response to injury. Cells 8, 83 (2019). PMC6406808 30678104 sourceExperimental — accuracy not yet measured
The Discussion (page unavailable) discusses miRNA arm switching outside a cancer-specific context, reporting that other studies found a preferred arm switched between samples and tissues. But this paper only suggests that arm switching could explain changes after vascular injury; it does not establish arm switching in healthy mammalian tissues or say it had previously been observed only in cancer. (LLM, conf=0.84)
- Partly supportedcites [45] Kern F., miRSwitch: Detecting microRNA arm shift and switch events. Nucleic Acids Res. 48, W268– W274 (2020). 32356893 PMC7319450 sourceExperimental — accuracy not yet measured
The Results (Workflow of miRSwitch, Figure 2) show opposite dominant arms of miR-142 in different human tissues, supporting tissue-dependent arm switching. The paper does not establish that those tissue samples were healthy, and its Introduction discusses earlier arm-switch findings beyond cancer; it therefore does not support the claim that switching had previously been observed only in cancer. (LLM, conf=0.85)
hedgedcorrelational- Asserted: passes — The authors put it forward as true.
- Checkable: passes — It can be checked against evidence.
- Load-bearing: passes — The paper’s conclusions depend on it.
- Based: passes — The paper gives a reason why it holds.
- Disputed
Every source the paper cites for this claim was checked and supports it.
In the paper
“integrating our ncRNA expression measurements with the scATAC-seq data (28) enabled us to map cell type specificity of small ncRNA expressed in the adult mouse brain.”
§ A mouse tissue atlas of small noncoding RNA > Abstract
What the sources say
- Supportedcites [28] Cusanovich D. A., A single-cell atlas of in vivo mammalian chromatin accessibility. Cell 174, 1309– 1324.e18 (2018). 30078704 PMC6158300 source
The citation identifies the scATAC-seq data used by the citing authors; it does not attribute their ncRNA integration or resulting map to this source. The source’s Results describe sci-ATAC-seq of 8-week-old mice and show that whole-brain cells contributed to multiple cell clusters. No page numbers are available in our copy. (LLM, conf=0.92)
plaindirect- Asserted: passes — The authors put it forward as true.
- Checkable: passes — It can be checked against evidence.
- Load-bearing: passes — The paper’s conclusions depend on it.
- Based: passes — The paper gives a reason why it holds.
- Supported
The cited sources support only part of this claim — read each source’s verdict below.
In the paper
“we detected 95.1% of miRNA precursors denoted by miRBase v22 database as high-confidence transcripts (31).”
§ A mouse tissue atlas of small noncoding RNA > Results > Small ncRNA Expression Atlas of Mouse Tissues.
What the sources say
- Partly supportedcites [31] Kozomara A., Griffiths-Jones S., miRBase: Annotating high confidence microRNAs using deep sequencing data. Nucleic Acids Res. 42, D68– D73 (2014). 24275495 PMC3965103 sourceExperimental — accuracy not yet measured
The section on annotating high-confidence microRNAs describes miRBase’s high-confidence precursor set, supporting the citation as an identification of that classification. But the paper discusses release v20, not v22, and does not report the citing authors’ 95.1% detection result. The detection result is framed as the citing authors’ own finding, not a result attributed to this source. (LLM, conf=0.86)
plain- Asserted: passes — The authors put it forward as true.
- Checkable: passes — It can be checked against evidence.
- Load-bearing: unclear — It is unclear whether the paper’s conclusions depend on it.
- Based: passes — The paper gives a reason why it holds.
- Partly supported
The cited sources support only part of this claim — read each source’s verdict below.
In the paper
“These snoRNAs have been previously reported among up-regulated genes in bacterial infection of soft tissues (35), suggesting the association of these transcripts with immune cells.”
§ A mouse tissue atlas of small noncoding RNA > Results > Tissue-Specific snoRNAs.
What the sources say
- Partly supportedcites [35] Brady R. A., Bruno V. M., Burns D. L., RNA-seq analysis of the host response to Staphylococcus aureus skin and soft tissue infection in a mouse model. PLoS One 10, e0124877 (2015). 25901897 PMC4406450 sourceExperimental — accuracy not yet measured
The table of differentially expressed genes (page unavailable) reports increased Snord17 transcripts at the skin infection site on day 4, but decreased transcripts on day 7. A search for Snord15a found no matching passage in our copy, and the paper does not link either snoRNA specifically to immune cells. The immune-cell association is framed as the citing authors’ inference, not a finding attributed to this source. (LLM, conf=0.85)
hedgedcorrelational- Asserted: passes — The authors put it forward as true.
- Checkable: passes — It can be checked against evidence.
- Load-bearing: unclear — It is unclear whether the paper’s conclusions depend on it.
- Based: passes — The paper gives a reason why it holds.
- Partly supported
Every source the paper cites for this claim was checked and supports it.
In the paper
“we identified hematopoiesis-associated miR-150 and miR-155 (65) to have highest weights among the features defining the bone marrow in our model”
§ A mouse tissue atlas of small noncoding RNA > Results > ncRNA-Based Tissue Classification.
What the sources say
- Supportedcites [65] Bissels U., Bosio A., Wagner W., MicroRNAs are shaping the hematopoietic landscape. Haematologica 97, 160– 167 (2012). 22058204 PMC3269472 source
The section “MicroRNAs are shaping the hematopoietic landscape” describes roles for both miR-150 and miR-155 in hematopoietic differentiation. The citation supports calling them hematopoiesis-associated; the finding that they had the highest weights in the model is explicitly the citing authors’ own result, not a claim attributed to this source. (LLM, conf=0.92)
plaincorrelational- Asserted: passes — The authors put it forward as true.
- Checkable: passes — It can be checked against evidence.
- Load-bearing: unclear — It is unclear whether the paper’s conclusions depend on it.
- Based: passes — The paper gives a reason why it holds.
- Supported
Every source the paper cites for this claim was checked and supports it.
In the paper
“This quantification approach largely agreed with the results obtained through mapping and quantification against the short nucleotide library (77) (SI Appendix, Fig. S9).”
§ A mouse tissue atlas of small noncoding RNA > Materials and Methods > Data Processing.
What the sources say
- Supportedcites [77] Lu Y., Baras A. S., Halushka M. K., miRge 2.0 for comprehensive analysis of microRNA sequencing data. BMC Bioinformatics 19, 275 (2018). 30153801 PMC6112139 source
The citation follows “short nucleotide library,” identifying the mapping-and-quantification approach rather than serving as evidence for the citing authors’ agreement result in SI Appendix, Fig. S9. The source describes miRge 2.0’s miRNA alignment search libraries in Results (“Improvements of miRge 2.0”; page unavailable) and identifies the sequence libraries it uses in Implementation (“Sequence databases and software dependencies”; page unavailable). (LLM, conf=0.84)
plaincorrelational- Asserted: passes — The authors put it forward as true.
- Checkable: passes — It can be checked against evidence.
- Load-bearing: unclear — It is unclear whether the paper’s conclusions depend on it.
- Based: passes — The paper gives a reason why it holds.
- Supported
Every source the paper cites for this claim was checked and supports it.
In the paper
“for the majority of these identified RNA we could not call the cell type of origin based in the data generated within previous studies offering cell type resolution (24, 25).”
§ A mouse tissue atlas of small noncoding RNA > Discussion
What the sources say
- Supportedcites [24] McCall M. N., Toward the human cellular microRNAome. Genome Res. 27, 1769– 1781 (2017). 28877962 PMC5630040 source
The citation identifies a previous study offering cell-type-resolved RNA data. The Results (‘Generation of a cellular microRNAome’) describe microRNA expression patterns across 161 primary-cell samples, including neural/stem-cell types. The statement that most of the citing authors’ identified RNAs could not be assigned a cell of origin is their own assessment, not a finding attributed to this source. (LLM, conf=0.90)
- Supportedcites [25] de Rie D..; FANTOM Consortium, An integrated expression atlas of miRNAs and their promoters in human and mouse. Nat. Biotechnol. 35, 872– 878 (2017). 28829439 PMC5767576 source
The citation identifies a previous study offering cell-type-resolved RNA data; the statement that most of the citing authors’ RNAs could not be assigned a cell of origin is their own assessment. In “Matched miRNA and CAGE expression profiles,” the source reports sRNA sequencing data spanning 121 distinct human cell types, and its “Cell ontology analysis” evaluates miRNA expression by cell-type cluster. (LLM, conf=0.88)
hedged- Asserted: passes — The authors put it forward as true.
- Checkable: passes — It can be checked against evidence.
- Load-bearing: passes — The paper’s conclusions depend on it.
- Based: passes — The paper gives a reason why it holds.
- Supported
Every source the paper cites for this claim was checked and supports it.
In the paper
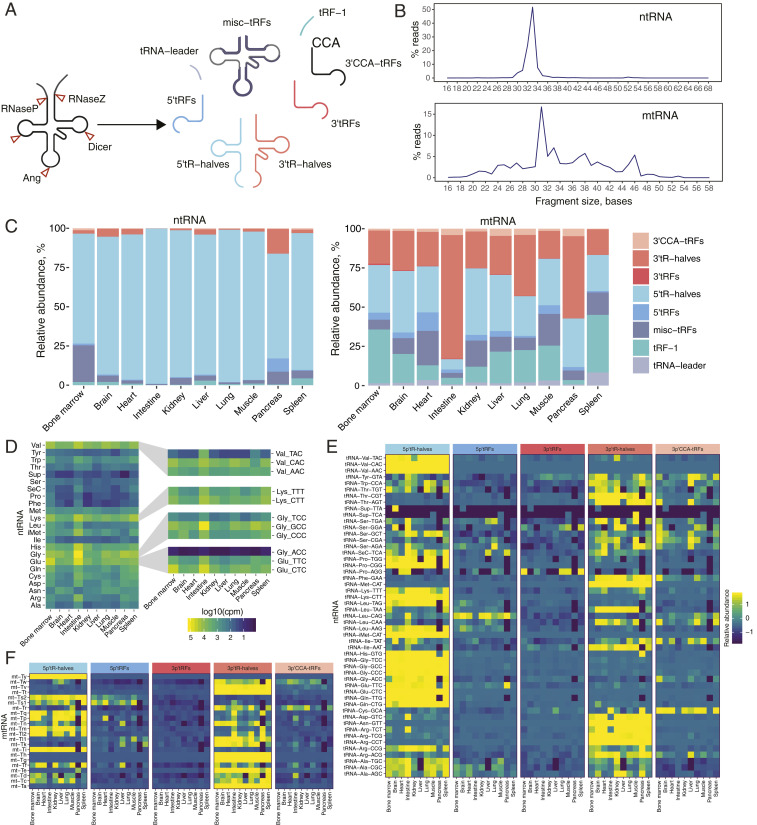
“consistent with a previous report on tRFs in human cell lines (7), we observed a major difference in the size of fragments originating from either nuclearly or mitochondrially encoded tRNA (ntRNA and mtRNA, respectively).”
§ A mouse tissue atlas of small noncoding RNA > Results > Tissue-Resident tRNA Fragments.
What the sources say
- Supportedcites [7] Telonis A. G., Dissecting tRNA-derived fragment complexities using personalized transcriptomes reveals novel fragment classes and unexpected dependencies. Oncotarget 6, 24797– 24822 (2015). 26325506 PMC4694795 source
The Results section on nuclear and mitochondrial tRFs reports that, in the LCL dataset, 36-nt fragments were predominantly mitochondrial while 33-nt fragments were nuclear, linking fragment length to genomic origin. Another Results passage identifies LCLs as lymphoblastoid cell lines from human participants. Page numbers are not available in our copy. (LLM, conf=0.91)
plaincorrelational- Asserted: passes — The authors put it forward as true.
- Checkable: passes — It can be checked against evidence.
- Load-bearing: unclear — It is unclear whether the paper’s conclusions depend on it.
- Based: passes — The paper gives a reason why it holds.
- Supported
The cited sources support only part of this claim — read each source’s verdict below.
In the paper
“we show that some snoRNAs, such as Snord70 and Snord66, which are often used as normalization controls in qPCR-based assays (36, 37), are also expressed in a tissue-biased manner”
§ A mouse tissue atlas of small noncoding RNA > Results > Tissue-Specific snoRNAs.
What the sources say
- Supportedcites [36] Chen P.-Y., FGF regulates TGF-β signaling and endothelial-to-mesenchymal transition via control of let-7 miRNA expression. Cell Rep. 2, 1684– 1696 (2012). 23200853 PMC3534912 source
The citation is attached to the statement about qPCR normalization controls, not the citing authors’ finding of tissue-biased expression. In Materials and methods (microRNA real-time PCR analysis), the source says it normalized mouse miRNA expression to Snord66, supporting its use as a control. It does not need to establish tissue bias for this citation to support the attributed point. (LLM, conf=0.90)
- Partly supportedcites [37] Emde A., Dysregulated miRNA biogenesis downstream of cellular stress and ALS-causing mutations: A new mechanism for ALS. EMBO J. 34, 2633– 2651 (2015). 26330466 PMC4641530 sourceExperimental — accuracy not yet measured
The Figure 2 caption (page unavailable) says the paper normalized qPCR measurements of miRNAs to Snord68 and Snord70, supporting Snord70 as a normalization control. The cited paper does not establish that Snord66 is used as a control. The sentence presents tissue-biased expression as the citing authors’ own finding, not a finding attributed to this source. (LLM, conf=0.86)
plaincorrelational- Asserted: passes — The authors put it forward as true.
- Checkable: passes — It can be checked against evidence.
- Load-bearing: passes — The paper’s conclusions depend on it.
- Based: passes — The paper gives a reason why it holds.
- Supported
The cited sources support only part of this claim — read each source’s verdict below.
In the paper
“We also found that 87 out of 473 novel miRNA were previously reported within other studies (48–52)”
§ A mouse tissue atlas of small noncoding RNA > Results > Novel miRNAs.
What the sources say
- Supportedcites [48] Dhahbi J. M., Deep sequencing identifies circulating mouse miRNAs that are functionally implicated in manifestations of aging and responsive to calorie restriction. Aging (Albany NY) 5, 130– 141 (2013). 23470454 PMC3616200 source
In Results and Discussion, under “Discovery of novel miRNAs circulating in the mouse serum” (page unavailable), the cited paper reports 23 candidate novel miRNAs. The citation serves to identify a previous study reporting novel miRNAs; the 87-of-473 overlap is presented as the citing authors’ own finding, not a count attributed to this paper. (LLM, conf=0.84)
- Could not verifycites [49] Fehlmann T., A high-resolution map of the human small non-coding transcriptome. Bioinformatics 34, 1621– 1628 (2018). 29281000 sourceExperimental — accuracy not yet measured
Section 2.5 says the authors included miRNA candidates from two earlier studies, but does not give the claimed overlap. Searches for “87,” “473,” and the claimed comparison found no passage reporting that 87 of 473 novel miRNAs had previously been reported. (LLM, conf=0.74)
- Could not verifycites [50] Javed R., miRNA transcriptome of hypertrophic skeletal muscle with overexpressed myostatin propeptide. BioMed Res. Int. 2014, 328935 (2014). 25147795 PMC4131533 sourceExperimental — accuracy not yet measured
The Results (§3.4; page unavailable) report 69 putative novel mouse miRNAs, but do not identify which, if any, overlap with the citing authors’ 473 miRNAs. Searches for “87 out of 473” and “473 novel miRNAs” found no passage in our copy establishing the claimed overlap. (LLM, conf=0.70)
- Could not verifycites [51] Metpally R. P. R., Comparison of analysis tools for miRNA high throughput sequencing using nerve crush as a model. Front. Genet. 4, 20 (2013). 23459507 PMC3585423 sourceExperimental — accuracy not yet measured
The Results section on miRNA detection reports counts for mouse muscle and plasma, but does not say that 87 of 473 novel miRNAs had been reported in other studies. Searches for “87 out of 473” and previously reported novel miRNAs found no passage supporting that comparison in our copy. (LLM, conf=0.72)
- Not matchedcites [52] Sundaram L. S., “Toxoplasma gondii-mediated host cell transcriptional changes lead to metabolic alterations akin to the Warburg effect,” PhD thesis, University of Cambridge, Cambridge, UK (2017).
Couldn’t be matched to a paper in Crossref, so it can’t be checked.
plain- Asserted: passes — The authors put it forward as true.
- Checkable: passes — It can be checked against evidence.
- Load-bearing: unclear — It is unclear whether the paper’s conclusions depend on it.
- Based: passes — The paper gives a reason why it holds.
- Supported
A result the paper reports from its own data — it cites no other source for it, so there is none to check. The quote shows it is in the paper.
In the paper
“with some also being sexually dimorphic”
§ A mouse tissue atlas of small noncoding RNA > Abstract
plaincorrelational- Asserted: passes — The authors put it forward as true.
- Checkable: passes — It can be checked against evidence.
- Load-bearing: unclear — It is unclear whether the paper’s conclusions depend on it.
- Based: passes — The paper gives a reason why it holds.
A result the paper reports from its own data — it cites no other source for it, so there is none to check. The quote shows it is in the paper.
In the paper
“provide insights on the tissue-dependent distribution of miRNA arms and tRNA fragments”
§ A mouse tissue atlas of small noncoding RNA > Abstract
plaincorrelationaln = 14- Asserted: passes — The authors put it forward as true.
- Checkable: passes — It can be checked against evidence.
- Load-bearing: passes — The paper’s conclusions depend on it.
- Based: passes — The paper gives a reason why it holds.
A result the paper reports from its own data — it cites no other source for it, so there is none to check. The quote shows it is in the paper.
In the paper
“identified that ∼30% of total noncoding small RNA transcriptome are distributed across the body in a tissue-specific manner”
§ A mouse tissue atlas of small noncoding RNA > Abstract
plain- Asserted: passes — The authors put it forward as true.
- Checkable: passes — It can be checked against evidence.
- Load-bearing: passes — The paper’s conclusions depend on it.
- Based: passes — The paper gives a reason why it holds.
A result the paper reports from its own data — it cites no other source for it, so there is none to check. The quote shows it is in the paper.
In the paper
“We generated a dataset comprising a total of 140 small ncRNA sequencing libraries from brain, lung, heart, muscle, kidney, pancreas, liver, small intestine, spleen, bone marrow, and testes RNA.”
§ A mouse tissue atlas of small noncoding RNA > Results > Small ncRNA Expression Atlas of Mouse Tissues.
plain- Asserted: passes — The authors put it forward as true.
- Checkable: passes — It can be checked against evidence.
- Load-bearing: passes — The paper’s conclusions depend on it.
- Based: passes — The paper gives a reason why it holds.
A result the paper reports from its own data — it cites no other source for it, so there is none to check. The quote shows it is in the paper.
In the paper
“Our data reveal that tissue specificity extends to ncRNA types other than miRNA”
§ A mouse tissue atlas of small noncoding RNA > Abstract
plaincorrelationaln = 14- Asserted: passes — The authors put it forward as true.
- Checkable: passes — It can be checked against evidence.
- Load-bearing: passes — The paper’s conclusions depend on it.
- Based: passes — The paper gives a reason why it holds.
A result the paper reports from its own data — it cites no other source for it, so there is none to check. The quote shows it is in the paper.
In the paper
“We discovered uncharacterized noncoding RNA molecules”
§ A mouse tissue atlas of small noncoding RNA > Abstract
plain- Asserted: passes — The authors put it forward as true.
- Checkable: passes — It can be checked against evidence.
- Load-bearing: passes — The paper’s conclusions depend on it.
- Based: passes — The paper gives a reason why it holds.
A result the paper reports from its own data — it cites no other source for it, so there is none to check. The quote shows it is in the paper.
In the paper
“Independently, unsupervised clustering of the top 400 most differentially expressed ncRNA in our dataset also revealed that two out of three identified clusters comprise ncRNA genes that are up-regulated in the above-mentioned three tissues”
§ A mouse tissue atlas of small noncoding RNA > Results > Tissue-Specific miRNA.
plaincorrelational- Asserted: passes — The authors put it forward as true.
- Checkable: passes — It can be checked against evidence.
- Load-bearing: passes — The paper’s conclusions depend on it.
- Based: passes — The paper gives a reason why it holds.
A result the paper reports from its own data — it cites no other source for it, so there is none to check. The quote shows it is in the paper.
In the paper
“we found that the relative abundance of tRF types, within both ntRNA and mtRNA space, is not constant, but varies across tissues”
§ A mouse tissue atlas of small noncoding RNA > Results > Tissue-Resident tRNA Fragments.
plaincorrelational- Asserted: passes — The authors put it forward as true.
- Checkable: passes — It can be checked against evidence.
- Load-bearing: passes — The paper’s conclusions depend on it.
- Based: passes — The paper gives a reason why it holds.
A result the paper reports from its own data — it cites no other source for it, so there is none to check. The quote shows it is in the paper.
In the paper
“Among the 60 anticorrelated targets (rs < −0.8, FDR < 0.1) we identified two genes previously shown to be sexually dimorphic”
§ A mouse tissue atlas of small noncoding RNA > Results > miRNAs Are Expressed in a Sex-Specific Manner.
plain- Asserted: passes — The authors put it forward as true.
- Checkable: passes — It can be checked against evidence.
- Load-bearing: unclear — It is unclear whether the paper’s conclusions depend on it.
- Based: passes — The paper gives a reason why it holds.
A result the paper reports from its own data — it cites no other source for it, so there is none to check. The quote shows it is in the paper.
In the paper
“We also observed multiple miRNAs present in several tissues but absent in others, reflecting the cellular composition of the tissues.”
§ A mouse tissue atlas of small noncoding RNA > Results > Tissue-Specific miRNA.
plaincorrelational- Asserted: passes — The authors put it forward as true.
- Checkable: passes — It can be checked against evidence.
- Load-bearing: unclear — It is unclear whether the paper’s conclusions depend on it.
- Based: passes — The paper gives a reason why it holds.
A result the paper reports from its own data — it cites no other source for it, so there is none to check. The quote shows it is in the paper.
In the paper
“Our work demonstrates that machine learning algorithms applied to quantitative miRNA expression estimates also detect changes related to the cell-type composition of tissues, such as the shift in hematopoietic cell abundance in the postnatal compared to the fetal liver.”
§ A mouse tissue atlas of small noncoding RNA > Discussion
boostedcorrelational- Asserted: passes — The authors put it forward as true.
- Checkable: passes — It can be checked against evidence.
- Load-bearing: passes — The paper’s conclusions depend on it.
- Based: passes — The paper gives a reason why it holds.
A result the paper reports from its own data — it cites no other source for it, so there is none to check. The quote shows it is in the paper.
In the paper
“we discovered that maternally imprinted AF357428 (also known as MBII-78), AF357341 (MBII-19), and Gm25854, transcribed from a 10-kb region of chromosome 12qF1, are up-regulated in the brain and muscle.”
§ A mouse tissue atlas of small noncoding RNA > Results > Tissue-Specific snoRNAs.
plaincorrelational- Asserted: passes — The authors put it forward as true.
- Checkable: passes — It can be checked against evidence.
- Load-bearing: unclear — It is unclear whether the paper’s conclusions depend on it.
- Based: passes — The paper gives a reason why it holds.
A result the paper reports from its own data — it cites no other source for it, so there is none to check. The quote shows it is in the paper.
In the paper
“found that out of 3,219 detected genes, 897 (28%) contribute to the tissue-specific signature of ncRNA expression (at a false discovery rate [FDR] < 1%)”
§ A mouse tissue atlas of small noncoding RNA > Results > Tissue-Specific Expression of Small ncRNA.
plaincorrelational- Asserted: passes — The authors put it forward as true.
- Checkable: passes — It can be checked against evidence.
- Load-bearing: passes — The paper’s conclusions depend on it.
- Based: passes — The paper gives a reason why it holds.
A result the paper reports from its own data — it cites no other source for it, so there is none to check. The quote shows it is in the paper.
In the paper
“For the majority of fragments, we found 5′tR- or 3′tR-halves to be the most dominant fragment type.”
§ A mouse tissue atlas of small noncoding RNA > Results > Tissue-Resident tRNA Fragments.
plain- Asserted: passes — The authors put it forward as true.
- Checkable: passes — It can be checked against evidence.
- Load-bearing: unclear — It is unclear whether the paper’s conclusions depend on it.
- Based: passes — The paper gives a reason why it holds.
A result the paper reports from its own data — it cites no other source for it, so there is none to check. The quote shows it is in the paper.
In the paper
“For many ntRFs, the distribution between 3′- and 5′-, tRF and tR-halves was surprisingly shifted toward one form”
§ A mouse tissue atlas of small noncoding RNA > Results > Tissue-Resident tRNA Fragments.
plain- Asserted: passes — The authors put it forward as true.
- Checkable: passes — It can be checked against evidence.
- Load-bearing: unclear — It is unclear whether the paper’s conclusions depend on it.
- Based: passes — The paper gives a reason why it holds.
A result the paper reports from its own data — it cites no other source for it, so there is none to check. The quote shows it is in the paper.
In the paper
“Assessing the overall abundance of 5p or 3p arms of miRNA across tissues, we found no significant bias in strand selection”
§ A mouse tissue atlas of small noncoding RNA > Results > Tissue-Specific Arm Selection of miRNA.
plain- Asserted: passes — The authors put it forward as true.
- Checkable: passes — It can be checked against evidence.
- Load-bearing: unclear — It is unclear whether the paper’s conclusions depend on it.
- Based: passes — The paper gives a reason why it holds.
A result the paper reports from its own data — it cites no other source for it, so there is none to check. The quote shows it is in the paper.
In the paper
“We observed that the distribution of nuclear tRFs was largely skewed toward 5′tR-halves, generated by the cleavage in the anticodon loops of mature tRNA.”
§ A mouse tissue atlas of small noncoding RNA > Results > Tissue-Resident tRNA Fragments.
plaindirect- Asserted: passes — The authors put it forward as true.
- Checkable: passes — It can be checked against evidence.
- Load-bearing: unclear — It is unclear whether the paper’s conclusions depend on it.
- Based: passes — The paper gives a reason why it holds.
A result the paper reports from its own data — it cites no other source for it, so there is none to check. The quote shows it is in the paper.
In the paper
“The RT-qPCR quantification of two miRNAs selected from this list, 17_11530 and 7_16137, in turn, confirmed the existence of these transcripts”
§ A mouse tissue atlas of small noncoding RNA > Results > Novel miRNAs.
plaindirect- Asserted: passes — The authors put it forward as true.
- Checkable: passes — It can be checked against evidence.
- Load-bearing: unclear — It is unclear whether the paper’s conclusions depend on it.
- Based: passes — The paper gives a reason why it holds.
A result the paper reports from its own data — it cites no other source for it, so there is none to check. The quote shows it is in the paper.
In the paper
“More striking examples of complete arm switching from one tissue to another are mir-141 and mir-350”
§ A mouse tissue atlas of small noncoding RNA > Results > Tissue-Specific Arm Selection of miRNA.
plaincorrelational- Asserted: passes — The authors put it forward as true.
- Checkable: passes — It can be checked against evidence.
- Load-bearing: unclear — It is unclear whether the paper’s conclusions depend on it.
- Based: passes — The paper gives a reason why it holds.
A result the paper reports from its own data — it cites no other source for it, so there is none to check. The quote shows it is in the paper.
In the paper
“This was mainly due to inability of the model to correctly classify liver tissues instead of assigning them to bone marrow”
§ A mouse tissue atlas of small noncoding RNA > Results > ncRNA-Based Tissue Classification.
plaindirect- Asserted: passes — The authors put it forward as true.
- Checkable: passes — It can be checked against evidence.
- Load-bearing: passes — The paper’s conclusions depend on it.
- Based: passes — The paper gives a reason why it holds.
A result the paper reports from its own data — it cites no other source for it, so there is none to check. The quote shows it is in the paper.
In the paper
“The tissue-type differences are also present across different tRNA isoacceptors and even its anticodons”
§ A mouse tissue atlas of small noncoding RNA > Results > Tissue-Resident tRNA Fragments.
plaincorrelational- Asserted: passes — The authors put it forward as true.
- Checkable: passes — It can be checked against evidence.
- Load-bearing: passes — The paper’s conclusions depend on it.
- Based: passes — The paper gives a reason why it holds.
A result the paper reports from its own data — it cites no other source for it, so there is none to check. The quote shows it is in the paper.
In the paper
“two other snoRNA, Gm22962 and Gm24598, followed the same tissue-specificity pattern, despite being transcribed from other chromosomes (9qC and XqA7.1, respectively).”
§ A mouse tissue atlas of small noncoding RNA > Results > Tissue-Specific snoRNAs.
plaincorrelational- Asserted: passes — The authors put it forward as true.
- Checkable: passes — It can be checked against evidence.
- Load-bearing: unclear — It is unclear whether the paper’s conclusions depend on it.
- Based: passes — The paper gives a reason why it holds.
A result the paper reports from its own data — it cites no other source for it, so there is none to check. The quote shows it is in the paper.
In the paper
“We observed high levels of Snord17 and Snord15a in the spleen and bone marrow, and lower levels in other tissues.”
§ A mouse tissue atlas of small noncoding RNA > Results > Tissue-Specific snoRNAs.
plaincorrelational- Asserted: passes — The authors put it forward as true.
- Checkable: passes — It can be checked against evidence.
- Load-bearing: unclear — It is unclear whether the paper’s conclusions depend on it.
- Based: passes — The paper gives a reason why it holds.
A result the paper reports from its own data — it cites no other source for it, so there is none to check. The quote shows it is in the paper.
In the paper
“we found that the brain contains high levels of Rny1 compared to other tissues”
§ A mouse tissue atlas of small noncoding RNA > Results > Tissue-Specific Expression of Rny, Terc, and Other ncRNA.
plaincorrelational- Asserted: passes — The authors put it forward as true.
- Checkable: passes — It can be checked against evidence.
- Load-bearing: unclear — It is unclear whether the paper’s conclusions depend on it.
- Based: passes — The paper gives a reason why it holds.
A result the paper reports from its own data — it cites no other source for it, so there is none to check. The quote shows it is in the paper.
In the paper
“We observed that ∼17% of all detected ncRNA were present in only one tissue (TSI = 1)”
§ A mouse tissue atlas of small noncoding RNA > Results > Tissue-Specific Expression of Small ncRNA.
plain- Asserted: passes — The authors put it forward as true.
- Checkable: passes — It can be checked against evidence.
- Load-bearing: unclear — It is unclear whether the paper’s conclusions depend on it.
- Based: passes — The paper gives a reason why it holds.
A result the paper reports from its own data — it cites no other source for it, so there is none to check. The quote shows it is in the paper.
In the paper
“Analysis of AGO-CLIP data showed evidence for 214 out of 473 candidates (total, >5 counts).”
§ A mouse tissue atlas of small noncoding RNA > Results > Novel miRNAs.
plain- Asserted: passes — The authors put it forward as true.
- Checkable: passes — It can be checked against evidence.
- Load-bearing: passes — The paper’s conclusions depend on it.
- Based: passes — The paper gives a reason why it holds.
A result the paper reports from its own data — it cites no other source for it, so there is none to check. The quote shows it is in the paper.
In the paper
“Within our study, we also report several tissue-specific miRNAs not identified in previous studies (Fig. 3, SI Appendix, Fig. S4, and Dataset S7).”
§ A mouse tissue atlas of small noncoding RNA > Discussion
plain- Asserted: passes — The authors put it forward as true.
- Checkable: passes — It can be checked against evidence.
- Load-bearing: passes — The paper’s conclusions depend on it.
- Based: passes — The paper gives a reason why it holds.
A result the paper reports from its own data — it cites no other source for it, so there is none to check. The quote shows it is in the paper.
In the paper
“An example of such a fragment is 5′tRF Glu-TTC, which we found to be enriched in the pancreas, compared to other tissues that mostly contained Glu-TTC 5′tR-halves.”
§ A mouse tissue atlas of small noncoding RNA > Results > Tissue-Resident tRNA Fragments.
plaincorrelational- Asserted: passes — The authors put it forward as true.
- Checkable: passes — It can be checked against evidence.
- Load-bearing: unclear — It is unclear whether the paper’s conclusions depend on it.
- Based: passes — The paper gives a reason why it holds.
A result the paper reports from its own data — it cites no other source for it, so there is none to check. The quote shows it is in the paper.
In the paper
“many are potentially expressed solely in neurons”
§ A mouse tissue atlas of small noncoding RNA > Results > Integration of Small RNA-Seq and scATAC-Seq Data.
hedgedcorrelational- Asserted: passes — The authors put it forward as true.
- Checkable: passes — It can be checked against evidence.
- Load-bearing: passes — The paper’s conclusions depend on it.
- Based: passes — The paper gives a reason why it holds.
A result the paper reports from its own data — it cites no other source for it, so there is none to check. The quote shows it is in the paper.
In the paper
“we discovered that, even between healthy tissues, certain miRNA undergo so-called “arm switching””
§ A mouse tissue atlas of small noncoding RNA > Discussion
plaincorrelational- Asserted: passes — The authors put it forward as true.
- Checkable: passes — It can be checked against evidence.
- Load-bearing: passes — The paper’s conclusions depend on it.
- Based: passes — The paper gives a reason why it holds.
A result the paper reports from its own data — it cites no other source for it, so there is none to check. The quote shows it is in the paper.
In the paper
“Principal-component analysis on the newly identified miRNAs, supported by at least 50 reads, showed a clear separation of brain, lung, and muscle from other tissues based on expression values.”
§ A mouse tissue atlas of small noncoding RNA > Results > Novel miRNAs.
boostedcorrelational- Asserted: passes — The authors put it forward as true.
- Checkable: passes — It can be checked against evidence.
- Load-bearing: unclear — It is unclear whether the paper’s conclusions depend on it.
- Based: passes — The paper gives a reason why it holds.
A result the paper reports from its own data — it cites no other source for it, so there is none to check. The quote shows it is in the paper.
In the paper
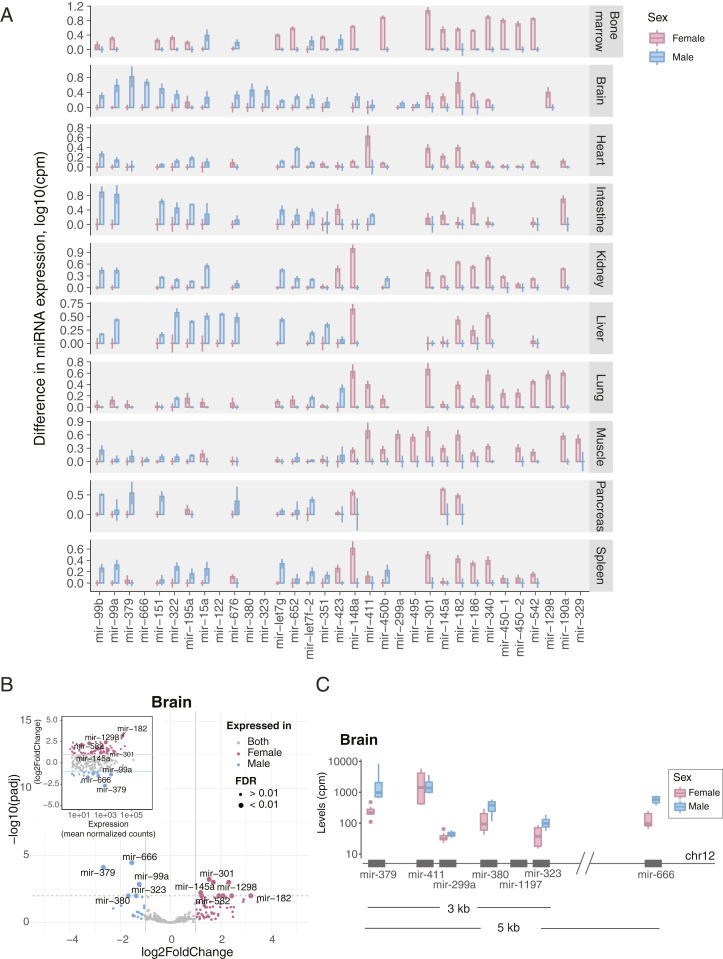
“In each somatic tissue, except pancreas, we identified at least two miRNAs differentially expressed between sexes (log2FoldChange > 1, normalized counts > 100, FDR < 0.01)”
§ A mouse tissue atlas of small noncoding RNA > Results > miRNAs Are Expressed in a Sex-Specific Manner.
plaincorrelational- Asserted: passes — The authors put it forward as true.
- Checkable: passes — It can be checked against evidence.
- Load-bearing: passes — The paper’s conclusions depend on it.
- Based: passes — The paper gives a reason why it holds.
A result the paper reports from its own data — it cites no other source for it, so there is none to check. The quote shows it is in the paper.
In the paper
“We also observed that the levels of another transcript from the same class, Rny3, are elevated in pancreas, brain, and kidney”
§ A mouse tissue atlas of small noncoding RNA > Results > Tissue-Specific Expression of Rny, Terc, and Other ncRNA.
plaincorrelational- Asserted: passes — The authors put it forward as true.
- Checkable: passes — It can be checked against evidence.
- Load-bearing: unclear — It is unclear whether the paper’s conclusions depend on it.
- Based: passes — The paper gives a reason why it holds.
A result the paper reports from its own data — it cites no other source for it, so there is none to check. The quote shows it is in the paper.
In the paper
“we found brain to contain the highest number of unique transcripts not present in other tissues (∼400)”
§ A mouse tissue atlas of small noncoding RNA > Results > Tissue-Specific Expression of Small ncRNA.
plain- Asserted: passes — The authors put it forward as true.
- Checkable: passes — It can be checked against evidence.
- Load-bearing: unclear — It is unclear whether the paper’s conclusions depend on it.
- Based: passes — The paper gives a reason why it holds.
A result the paper reports from its own data — it cites no other source for it, so there is none to check. The quote shows it is in the paper.
In the paper
“we observed a selective enrichment of certain fragment types over others, happening in both gene- and tissue-specific manners.”
§ A mouse tissue atlas of small noncoding RNA > Discussion
plaincorrelational- Asserted: passes — The authors put it forward as true.
- Checkable: passes — It can be checked against evidence.
- Load-bearing: passes — The paper’s conclusions depend on it.
- Based: passes — The paper gives a reason why it holds.
A result the paper reports from its own data — it cites no other source for it, so there is none to check. The quote shows it is in the paper.
In the paper
“Importantly, 52 novel miRNAs identified by this and previous studies were not present in the AGO-CLIP data”
§ A mouse tissue atlas of small noncoding RNA > Results > Novel miRNAs.
plain- Asserted: passes — The authors put it forward as true.
- Checkable: passes — It can be checked against evidence.
- Load-bearing: unclear — It is unclear whether the paper’s conclusions depend on it.
- Based: passes — The paper gives a reason why it holds.
A result the paper reports from its own data — it cites no other source for it, so there is none to check. The quote shows it is in the paper.
In the paper
“We found ∼400 miRNAs differentially expressed across profiled tissues”
§ A mouse tissue atlas of small noncoding RNA > Results > Tissue-Specific miRNA.
plaincorrelational- Asserted: passes — The authors put it forward as true.
- Checkable: passes — It can be checked against evidence.
- Load-bearing: passes — The paper’s conclusions depend on it.
- Based: passes — The paper gives a reason why it holds.
A result the paper reports from its own data — it cites no other source for it, so there is none to check. The quote shows it is in the paper.
In the paper
“even though lung, spleen, and bone marrow expressed the widest spectrum of detected genes”
§ A mouse tissue atlas of small noncoding RNA > Results > Tissue-Specific Expression of Small ncRNA.
plaincorrelational- Asserted: passes — The authors put it forward as true.
- Checkable: passes — It can be checked against evidence.
- Load-bearing: unclear — It is unclear whether the paper’s conclusions depend on it.
- Based: passes — The paper gives a reason why it holds.
A result the paper reports from its own data — it cites no other source for it, so there is none to check. The quote shows it is in the paper.
In the paper
“Dimensionality reduction via t-distributed stochastic neighbor embedding (t-SNE) (Materials and Methods) on ncRNA genes revealed a robust clustering of samples according to tissue types”
§ A mouse tissue atlas of small noncoding RNA > Results > Tissue-Specific Expression of Small ncRNA.
plaincorrelational- Asserted: passes — The authors put it forward as true.
- Checkable: passes — It can be checked against evidence.
- Load-bearing: passes — The paper’s conclusions depend on it.
- Based: passes — The paper gives a reason why it holds.
A result the paper reports from its own data — it cites no other source for it, so there is none to check. The quote shows it is in the paper.
In the paper
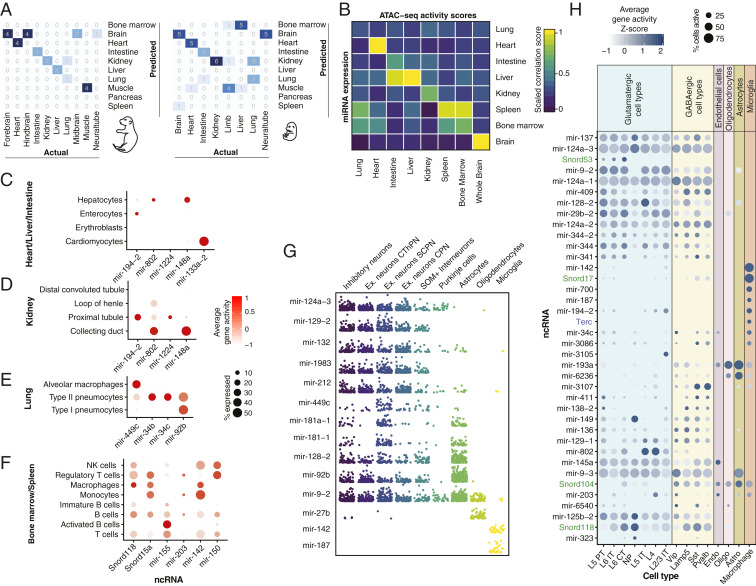
“mir-193a and mir-6236 in astrocytes and oligodendrocytes”
§ A mouse tissue atlas of small noncoding RNA > Results > Integration of Small RNA-Seq and scATAC-Seq Data.
plaincorrelational- Asserted: passes — The authors put it forward as true.
- Checkable: passes — It can be checked against evidence.
- Load-bearing: unclear — It is unclear whether the paper’s conclusions depend on it.
- Based: passes — The paper gives a reason why it holds.
A result the paper reports from its own data — it cites no other source for it, so there is none to check. The quote shows it is in the paper.
In the paper
“we have also identified hundreds of ncRNAs of other types that are expressed in a tissue-specific fashion”
§ A mouse tissue atlas of small noncoding RNA > Results > Tissue-Specific Expression of Small ncRNA.
plaincorrelational- Asserted: passes — The authors put it forward as true.
- Checkable: passes — It can be checked against evidence.
- Load-bearing: unclear — It is unclear whether the paper’s conclusions depend on it.
- Based: passes — The paper gives a reason why it holds.
A result the paper reports from its own data — it cites no other source for it, so there is none to check. The quote shows it is in the paper.
In the paper
“in the case of the lung, open chromatin data did not provide sufficient resolution for us to infer the cell types of origin for the majority of the transcripts.”
§ A mouse tissue atlas of small noncoding RNA > Discussion
plain- Asserted: passes — The authors put it forward as true.
- Checkable: passes — It can be checked against evidence.
- Load-bearing: passes — The paper’s conclusions depend on it.
- Based: passes — The paper gives a reason why it holds.
A result the paper reports from its own data — it cites no other source for it, so there is none to check. The quote shows it is in the paper.
In the paper
“We also found a novel miRNA that, among the three validation methods, was only verified through RT-qPCR.”
§ A mouse tissue atlas of small noncoding RNA > Results > Novel miRNAs.
plainSingle case- Asserted: passes — The authors put it forward as true.
- Checkable: passes — It can be checked against evidence.
- Load-bearing: unclear — It is unclear whether the paper’s conclusions depend on it.
- Based: passes — The paper gives a reason why it holds.
A result the paper reports from its own data — it cites no other source for it, so there is none to check. The quote shows it is in the paper.
In the paper
“We found miRNA to be the main contributor of tissue specificity”
§ A mouse tissue atlas of small noncoding RNA > Results > Tissue-Specific Expression of Small ncRNA.
plaindirect- Asserted: passes — The authors put it forward as true.
- Checkable: passes — It can be checked against evidence.
- Load-bearing: passes — The paper’s conclusions depend on it.
- Based: passes — The paper gives a reason why it holds.
A result the paper reports from its own data — it cites no other source for it, so there is none to check. The quote shows it is in the paper.
In the paper
“mir-34b and mir-34c in type II pneumocytes (Fig. 6E)”
§ A mouse tissue atlas of small noncoding RNA > Results > Integration of Small RNA-Seq and scATAC-Seq Data.
plaincorrelational- Asserted: passes — The authors put it forward as true.
- Checkable: passes — It can be checked against evidence.
- Load-bearing: unclear — It is unclear whether the paper’s conclusions depend on it.
- Based: passes — The paper gives a reason why it holds.
A result the paper reports from its own data — it cites no other source for it, so there is none to check. The quote shows it is in the paper.
In the paper
“We found that snoRNA alone is capable of separating the majority of profiled tissues based on their transcript levels”
§ A mouse tissue atlas of small noncoding RNA > Results > Tissue-Specific snoRNAs.
plaincorrelational- Asserted: passes — The authors put it forward as true.
- Checkable: passes — It can be checked against evidence.
- Load-bearing: passes — The paper’s conclusions depend on it.
- Based: passes — The paper gives a reason why it holds.
A result the paper reports from its own data — it cites no other source for it, so there is none to check. The quote shows it is in the paper.
In the paper
“we found that ∼5% of all miRNAs switch their arm preference between tissues.”
§ A mouse tissue atlas of small noncoding RNA > Results > Tissue-Specific Arm Selection of miRNA.
plain- Asserted: passes — The authors put it forward as true.
- Checkable: passes — It can be checked against evidence.
- Load-bearing: passes — The paper’s conclusions depend on it.
- Based: passes — The paper gives a reason why it holds.
A result the paper reports from its own data — it cites no other source for it, so there is none to check. The quote shows it is in the paper.
In the paper
“we also found that four out of five male-specific miRNAs in the brain are transcribed from a 5-kb region of imprinted Dlk1-Dio3 locus on chromosome 12”
§ A mouse tissue atlas of small noncoding RNA > Results > miRNAs Are Expressed in a Sex-Specific Manner.
plaincorrelational- Asserted: passes — The authors put it forward as true.
- Checkable: passes — It can be checked against evidence.
- Load-bearing: unclear — It is unclear whether the paper’s conclusions depend on it.
- Based: passes — The paper gives a reason why it holds.
A result the paper reports from its own data — it cites no other source for it, so there is none to check. The quote shows it is in the paper.
In the paper
“For the embryonic tissues, however, our model was able to only reach an accuracy of 0.69.”
§ A mouse tissue atlas of small noncoding RNA > Results > ncRNA-Based Tissue Classification.
plain- Asserted: passes — The authors put it forward as true.
- Checkable: passes — It can be checked against evidence.
- Load-bearing: unclear — It is unclear whether the paper’s conclusions depend on it.
- Based: passes — The paper gives a reason why it holds.
A result the paper reports from its own data — it cites no other source for it, so there is none to check. The quote shows it is in the paper.
In the paper
“We detected many ubiquitously expressed ncRNAs across tissues”
§ A mouse tissue atlas of small noncoding RNA > Results > Ubiquitous ncRNA Transcripts.
plain- Asserted: passes — The authors put it forward as true.
- Checkable: passes — It can be checked against evidence.
- Load-bearing: passes — The paper’s conclusions depend on it.
- Based: passes — The paper gives a reason why it holds.
A result the paper reports from its own data — it cites no other source for it, so there is none to check. The quote shows it is in the paper.
In the paper
““Exact tRNA multimapping” of these fragments to the mouse genome revealed the presence of tRFs of various sizes.”
§ A mouse tissue atlas of small noncoding RNA > Results > Tissue-Resident tRNA Fragments.
plaindirect- Asserted: passes — The authors put it forward as true.
- Checkable: passes — It can be checked against evidence.
- Load-bearing: passes — The paper’s conclusions depend on it.
- Based: passes — The paper gives a reason why it holds.
A result the paper reports from its own data — it cites no other source for it, so there is none to check. The quote shows it is in the paper.
In the paper
“We found several snoRNAs present mainly in the pancreas, such as Snord123 (SI Appendix, Fig. S2C), located 3 kb upstream of the pancreatic cancer-associated Sema5a gene, and Gm22888 (Fig. 2B) located within the introns of Ubap2.”
§ A mouse tissue atlas of small noncoding RNA > Results > Tissue-Specific snoRNAs.
plaincorrelational- Asserted: passes — The authors put it forward as true.
- Checkable: passes — It can be checked against evidence.
- Load-bearing: unclear — It is unclear whether the paper’s conclusions depend on it.
- Based: passes — The paper gives a reason why it holds.
A result the paper reports from its own data — it cites no other source for it, so there is none to check. The quote shows it is in the paper.
In the paper
“This distinct pattern of fragment sizes reflected the bias in the amounts of tRF types originating from nt- and mtRNA”
§ A mouse tissue atlas of small noncoding RNA > Results > Tissue-Resident tRNA Fragments.
plaindirect- Asserted: passes — The authors put it forward as true.
- Checkable: passes — It can be checked against evidence.
- Load-bearing: unclear — It is unclear whether the paper’s conclusions depend on it.
- Based: passes — The paper gives a reason why it holds.
A result the paper reports from its own data — it cites no other source for it, so there is none to check. The quote shows it is in the paper.
In the paper
“female-specific miR-340 to negatively correlate with androgen-associated ectodysplasin A2 receptor (Eda2r).”
§ A mouse tissue atlas of small noncoding RNA > Results > miRNAs Are Expressed in a Sex-Specific Manner.
plaincorrelational- Asserted: passes — The authors put it forward as true.
- Checkable: passes — It can be checked against evidence.
- Load-bearing: passes — The paper’s conclusions depend on it.
- Based: passes — The paper gives a reason why it holds.
A result the paper reports from its own data — it cites no other source for it, so there is none to check. The quote shows it is in the paper.
In the paper
“However, in the rare cases, we found 5′- or 3′tRFs to dominate other fragments in a tissue-specific manner.”
§ A mouse tissue atlas of small noncoding RNA > Results > Tissue-Resident tRNA Fragments.
plaincorrelational- Asserted: passes — The authors put it forward as true.
- Checkable: passes — It can be checked against evidence.
- Load-bearing: unclear — It is unclear whether the paper’s conclusions depend on it.
- Based: passes — The paper gives a reason why it holds.
A result the paper reports from its own data — it cites no other source for it, so there is none to check. The quote shows it is in the paper.
In the paper
“We found, however, that within each tissue we could attribute the cell type of origin to a number of identified tissue-specific ncRNA.”
§ A mouse tissue atlas of small noncoding RNA > Results > Integration of Small RNA-Seq and scATAC-Seq Data.
hedgedcorrelational- Asserted: passes — The authors put it forward as true.
- Checkable: passes — It can be checked against evidence.
- Load-bearing: passes — The paper’s conclusions depend on it.
- Based: passes — The paper gives a reason why it holds.
A result the paper reports from its own data — it cites no other source for it, so there is none to check. The quote shows it is in the paper.
In the paper
“Our study finds that the brain, in fact, contains the largest number of unique mammalian ncRNA transcripts that are absent in other tissues.”
§ A mouse tissue atlas of small noncoding RNA > Discussion
plain- Asserted: passes — The authors put it forward as true.
- Checkable: passes — It can be checked against evidence.
- Load-bearing: passes — The paper’s conclusions depend on it.
- Based: passes — The paper gives a reason why it holds.
A result the paper reports from its own data — it cites no other source for it, so there is none to check. The quote shows it is in the paper.
In the paper
“For the majority of brain-specific ncRNA identified in our study, however, due to resolution limitations of the mouse ATAC atlas data, we were unable to unambiguously define the cell type of origin.”
§ A mouse tissue atlas of small noncoding RNA > Results > Integration of Small RNA-Seq and scATAC-Seq Data.
plain- Asserted: passes — The authors put it forward as true.
- Checkable: passes — It can be checked against evidence.
- Load-bearing: passes — The paper’s conclusions depend on it.
- Based: passes — The paper gives a reason why it holds.
A result the paper reports from its own data — it cites no other source for it, so there is none to check. The quote shows it is in the paper.
In the paper
“Among ∼6,000 genes assigned to various ncRNA classes, we identified several miRNAs to be differentially expressed between females and males (at FDR < 0.01)”
§ A mouse tissue atlas of small noncoding RNA > Results > miRNAs Are Expressed in a Sex-Specific Manner.
plaincorrelational- Asserted: passes — The authors put it forward as true.
- Checkable: passes — It can be checked against evidence.
- Load-bearing: passes — The paper’s conclusions depend on it.
- Based: passes — The paper gives a reason why it holds.
A result the paper reports from its own data — it cites no other source for it, so there is none to check. The quote shows it is in the paper.
In the paper
“mir-27b in oligodendrocytes”
§ A mouse tissue atlas of small noncoding RNA > Results > Integration of Small RNA-Seq and scATAC-Seq Data.
plaincorrelational- Asserted: passes — The authors put it forward as true.
- Checkable: passes — It can be checked against evidence.
- Load-bearing: unclear — It is unclear whether the paper’s conclusions depend on it.
- Based: passes — The paper gives a reason why it holds.
A result the paper reports from its own data — it cites no other source for it, so there is none to check. The quote shows it is in the paper.
In the paper
“or GABAergic (mir-3107) neurons (Fig. 6H)”
§ A mouse tissue atlas of small noncoding RNA > Results > Integration of Small RNA-Seq and scATAC-Seq Data.
plaincorrelational- Asserted: passes — The authors put it forward as true.
- Checkable: passes — It can be checked against evidence.
- Load-bearing: unclear — It is unclear whether the paper’s conclusions depend on it.
- Based: passes — The paper gives a reason why it holds.
A result the paper reports from its own data — it cites no other source for it, so there is none to check. The quote shows it is in the paper.
In the paper
“We found that the lung contains the largest number of distinct small ncRNA among 11 profiled tissues.”
§ A mouse tissue atlas of small noncoding RNA > Discussion
plain- Asserted: passes — The authors put it forward as true.
- Checkable: passes — It can be checked against evidence.
- Load-bearing: unclear — It is unclear whether the paper’s conclusions depend on it.
- Based: passes — The paper gives a reason why it holds.
A result the paper reports from its own data — it cites no other source for it, so there is none to check. The quote shows it is in the paper.
In the paper
“However, within mitochondrial tRFs, we identified a more uniform representation of cleaved fragments.”
§ A mouse tissue atlas of small noncoding RNA > Results > Tissue-Resident tRNA Fragments.
plain- Asserted: passes — The authors put it forward as true.
- Checkable: passes — It can be checked against evidence.
- Load-bearing: unclear — It is unclear whether the paper’s conclusions depend on it.
- Based: passes — The paper gives a reason why it holds.
A result the paper reports from its own data — it cites no other source for it, so there is none to check. The quote shows it is in the paper.
In the paper
“in fact, does not support the existence of many miRNA independently detected within RNA-seq datasets or directly validated through RT-qPCR.”
§ A mouse tissue atlas of small noncoding RNA > Discussion
plain- Asserted: passes — The authors put it forward as true.
- Checkable: passes — It can be checked against evidence.
- Load-bearing: passes — The paper’s conclusions depend on it.
- Based: passes — The paper gives a reason why it holds.
A result the paper reports from its own data — it cites no other source for it, so there is none to check. The quote shows it is in the paper.
In the paper
“Altogether, by comparing the miRNA levels measured through RT-qPCR with the tissue transcript abundance identified by small RNA-seq, we validated 12 novel miRNAs”
§ A mouse tissue atlas of small noncoding RNA > Results > Novel miRNAs.
plaincorrelational- Asserted: passes — The authors put it forward as true.
- Checkable: passes — It can be checked against evidence.
- Load-bearing: passes — The paper’s conclusions depend on it.
- Based: passes — The paper gives a reason why it holds.
A result the paper reports from its own data — it cites no other source for it, so there is none to check. The quote shows it is in the paper.
In the paper
“Some of them, like mir-337, mir-106b, and mir-26b, are represented by both arms in certain tissues but only by one of the arms in other”
§ A mouse tissue atlas of small noncoding RNA > Results > Tissue-Specific Arm Selection of miRNA.
plaincorrelational- Asserted: passes — The authors put it forward as true.
- Checkable: passes — It can be checked against evidence.
- Load-bearing: passes — The paper’s conclusions depend on it.
- Based: passes — The paper gives a reason why it holds.
A result the paper reports from its own data — it cites no other source for it, so there is none to check. The quote shows it is in the paper.
In the paper
“we discovered that nearly ∼900 transcripts contribute to the unique noncoding tissue profile.”
§ A mouse tissue atlas of small noncoding RNA > Discussion
plaincorrelational- Asserted: passes — The authors put it forward as true.
- Checkable: passes — It can be checked against evidence.
- Load-bearing: passes — The paper’s conclusions depend on it.
- Based: passes — The paper gives a reason why it holds.
A result the paper reports from its own data — it cites no other source for it, so there is none to check. The quote shows it is in the paper.
In the paper
“with over 200 snoRNA showing tissues-specific patterns”
§ A mouse tissue atlas of small noncoding RNA > Results > Tissue-Specific snoRNAs.
plaincorrelational- Asserted: passes — The authors put it forward as true.
- Checkable: passes — It can be checked against evidence.
- Load-bearing: passes — The paper’s conclusions depend on it.
- Based: passes — The paper gives a reason why it holds.
A result the paper reports from its own data — it cites no other source for it, so there is none to check. The quote shows it is in the paper.
In the paper
“Among other ncRNA types that we found to be differentially expressed across profiled tissues are snRNA and scaRNA”
§ A mouse tissue atlas of small noncoding RNA > Results > Tissue-Specific Expression of Rny, Terc, and Other ncRNA.
plaincorrelational- Asserted: passes — The authors put it forward as true.
- Checkable: passes — It can be checked against evidence.
- Load-bearing: passes — The paper’s conclusions depend on it.
- Based: passes — The paper gives a reason why it holds.
A result the paper reports from its own data — it cites no other source for it, so there is none to check. The quote shows it is in the paper.
In the paper
“integrating our tissue-level ncRNA measurement with single-cell chromatin accessibility profiles turned out to be surprisingly informative and allowed us to infer the activity of ncRNA within individual neuronal and glial types.”
§ A mouse tissue atlas of small noncoding RNA > Discussion
plaindirect- Asserted: passes — The authors put it forward as true.
- Checkable: passes — It can be checked against evidence.
- Load-bearing: passes — The paper’s conclusions depend on it.
- Based: passes — The paper gives a reason why it holds.
A result the paper reports from its own data — it cites no other source for it, so there is none to check. The quote shows it is in the paper.
In the paper
“we also found a few miRNAs, such as mir-134, mir-182, mir-376c, mir299a, mir-3061, and mir-7068 (SI Appendix, Fig. S3A) to be shared solely between muscle, brain, and pancreas”
§ A mouse tissue atlas of small noncoding RNA > Results > Tissue-Specific miRNA.
plain- Asserted: passes — The authors put it forward as true.
- Checkable: passes — It can be checked against evidence.
- Load-bearing: passes — The paper’s conclusions depend on it.
- Based: passes — The paper gives a reason why it holds.
A result the paper reports from its own data — it cites no other source for it, so there is none to check. The quote shows it is in the paper.
In the paper
“About a quarter of our small RNA-seq libraries consisted of tRFs”
§ A mouse tissue atlas of small noncoding RNA > Results > Tissue-Resident tRNA Fragments.
plain- Asserted: passes — The authors put it forward as true.
- Checkable: passes — It can be checked against evidence.
- Load-bearing: unclear — It is unclear whether the paper’s conclusions depend on it.
- Based: passes — The paper gives a reason why it holds.
What the paper did — it cites no source for this, so there is none to check. The quote shows it is in the paper.
In the paper
“We profiled the expression of small ncRNA across 10 tissues from adult female (n = 10) and 11 from adult male (n = 4) C57BL/6J mice”
§ A mouse tissue atlas of small noncoding RNA > Results > Small ncRNA Expression Atlas of Mouse Tissues.
plainn = 10- Asserted: passes — The authors put it forward as true.
- Checkable: passes — It can be checked against evidence.
- Load-bearing: passes — The paper’s conclusions depend on it.
- Based: passes — The paper gives a reason why it holds.
A conclusion the paper draws from its own results — it cites no other source for it, so there is none to check. The quote shows it is in the paper.
In the paper
“Distinct distribution patterns of small RNA across the body suggest the existence of tissue-specific mechanisms involved in noncoding RNA processing.”
§ A mouse tissue atlas of small noncoding RNA > Abstract
hedgedcorrelational- Asserted: passes — The authors put it forward as true.
- Checkable: passes — It can be checked against evidence.
- Load-bearing: passes — The paper’s conclusions depend on it.
- Based: passes — The paper gives a reason why it holds.
A conclusion the paper draws from its own results — it cites no other source for it, so there is none to check. The quote shows it is in the paper.
In the paper
“we identified that in addition to variable transcription levels and posttranscriptional modifications, noncoding tissue specificity is achieved through an unknown mechanism of selective RNA retention.”
§ A mouse tissue atlas of small noncoding RNA > Discussion
plaindirect- Asserted: passes — The authors put it forward as true.
- Checkable: passes — It can be checked against evidence.
- Load-bearing: passes — The paper’s conclusions depend on it.
- Based: passes — The paper gives a reason why it holds.
In the paper
“Strikingly, in this case, our model accurately predicted the hematopoietic composition of the organ, known to shift from the liver at the embryonic stages to the bone marrow in adulthood (64), rather than the tissue type itself.”
§ A mouse tissue atlas of small noncoding RNA > Results > ncRNA-Based Tissue Classification.
What the sources say
- Not checked — no full text of the sourcecites [64] Baron M. H., Isern J., Fraser S. T., The embryonic origins of erythropoiesis in mammals. Blood 119, 4828– 4837 (2012). 22337720 PMC3367890 source
boostedcorrelational- Asserted: passes — The authors put it forward as true.
- Checkable: passes — It can be checked against evidence.
- Load-bearing: passes — The paper’s conclusions depend on it.
- Based: passes — The paper gives a reason why it holds.
A conclusion the paper draws from its own results — it cites no other source for it, so there is none to check. The quote shows it is in the paper.
In the paper
“The gap between AGO-CLIP and small RNA-seq data in terms of data quality, diversity, and depth suggests that validating against AGO-CLIP data may not be the optimal approach for miRNA discovery.”
§ A mouse tissue atlas of small noncoding RNA > Discussion
hedgedconditional- Asserted: passes — The authors put it forward as true.
- Checkable: passes — It can be checked against evidence.
- Load-bearing: passes — The paper’s conclusions depend on it.
- Based: passes — The paper gives a reason why it holds.
A conclusion the paper draws from its own results — it cites no other source for it, so there is none to check. The quote shows it is in the paper.
In the paper
“Altogether, these findings suggest that certain small ncRNAs are involved in maintaining a specific function within the brain, pancreas, and muscle, which could, for example, be ion transport or exocytosis.”
§ A mouse tissue atlas of small noncoding RNA > Results > Tissue-Specific miRNA.
hedgedconditional- Asserted: passes — The authors put it forward as true.
- Checkable: passes — It can be checked against evidence.
- Load-bearing: passes — The paper’s conclusions depend on it.
- Based: passes — The paper gives a reason why it holds.
A conclusion the paper draws from its own results — it cites no other source for it, so there is none to check. The quote shows it is in the paper.
In the paper
“The present resource demonstrates that each healthy mammalian tissue carries a unique noncoding signature, contributed by well-understood RNA types as well as by less studied ones.”
§ A mouse tissue atlas of small noncoding RNA > Discussion
boostedcorrelational- Asserted: passes — The authors put it forward as true.
- Checkable: passes — It can be checked against evidence.
- Load-bearing: passes — The paper’s conclusions depend on it.
- Based: passes — The paper gives a reason why it holds.
A conclusion the paper draws from its own results — it cites no other source for it, so there is none to check. The quote shows it is in the paper.
In the paper
“the provided ncRNA estimates indicate that ncRNA is another contributor to complexity in the architecture of nervous system.”
§ A mouse tissue atlas of small noncoding RNA > Discussion
hedgeddirect- Asserted: passes — The authors put it forward as true.
- Checkable: passes — It can be checked against evidence.
- Load-bearing: passes — The paper’s conclusions depend on it.
- Based: passes — The paper gives a reason why it holds.
A conclusion the paper draws from its own results — it cites no other source for it, so there is none to check. The quote shows it is in the paper.
In the paper
“Spearman correlation coefficients reflected the cell-type composition of tissues”
§ A mouse tissue atlas of small noncoding RNA > Results > ncRNA-Based Tissue Classification.
plaincorrelational- Asserted: passes — The authors put it forward as true.
- Checkable: passes — It can be checked against evidence.
- Load-bearing: passes — The paper’s conclusions depend on it.
- Based: passes — The paper gives a reason why it holds.
- Probably not a substantial claim. 34
- It may state two separate claims as one. 43
- The quote only partly states this claim. 1
Some cited sources support this claim and some don’t — read each source’s verdict below.
In the paper
“a process previously thought to be strictly pathogenic in mammals (43, 45, 67).”
§ A mouse tissue atlas of small noncoding RNA > Discussion
What the sources say
- Disputedcites [43] Chen L., miRNA arm switching identifies novel tumour biomarkers. EBioMedicine 38, 37– 46 (2018). 30425004 PMC6306400 sourceExperimental — accuracy not yet measured
The Introduction (page unavailable) describes arm switching across tissues and developmental stages, citing previous studies, and calls it a basic mechanism in miRNA evolution. The paper does not portray it as having been thought strictly pathogenic in mammals; it discusses cancer as one setting in which arm switching occurs. (LLM, conf=0.82)
Checked by a reasoning model — may be wrong.
- Partly supportedcites [45] Kern F., miRSwitch: Detecting microRNA arm shift and switch events. Nucleic Acids Res. 48, W268– W274 (2020). 32356893 PMC7319450 sourceExperimental — accuracy not yet measured
The Introduction (page unavailable) says earlier studies described selective arm switches in multiple pathological conditions. It does not say arm switching was previously thought to be strictly pathogenic in mammals; it also discusses tissue-specific arm shifts and physiological conditions. The claim’s historical exclusivity is therefore unsupported. (LLM, conf=0.78)
- Disputedcites [67] Lin M., Comprehensive identification of microRNA arm selection preference in lung cancer: miR-324-5p and -3p serve oncogenic functions in lung cancer. Oncol. Lett. 15, 9818– 9826 (2018). 29844840 PMC5958786 sourceExperimental — accuracy not yet measured
The Introduction (page unavailable) says earlier studies reported changes in miRNA arm expression across tissues, developmental stages, and species, as well as during cancer progression. That account of prior research is contrary to the claim that arm switching was previously thought to be strictly pathogenic in mammals. (LLM, conf=0.74)
Checked by a reasoning model — may be wrong.
plain- Asserted: passes — The authors put it forward as true.
- Checkable: passes — It can be checked against evidence.
- Load-bearing: fails — The paper’s conclusions may not depend on it.
- Based: passes — The paper gives a reason why it holds.
Probably not a substantial claim. The paper’s conclusions may not depend on it.
- Disputed
The cited sources support only part of this claim — read each source’s verdict below.
In the paper
“Through their interactions with ribosomes and mRNA, these small noncoding molecules shape the dynamic molecular spectrum of tissues (4, 17).”
§ A mouse tissue atlas of small noncoding RNA > Abstract
What the sources say
- Partly supportedcites [4] Gebetsberger J., Wyss L., Mleczko A. M., Reuther J., Polacek N., A tRNA-derived fragment competes with mRNA for ribosome binding and regulates translation during stress. RNA Biol. 14, 1364– 1373 (2017). 27892771 PMC5711459 sourceExperimental — accuracy not yet measured
The Introduction (page unavailable) says a stress-produced tRNA fragment binds ribosomes and competes with mRNA, reducing protein synthesis. It also describes small RNAs as regulators of cellular RNomes, but the paper does not establish that these interactions shape the molecular spectrum of tissues. (LLM, conf=0.83)
- Not checked — no full text of the sourcecites [17] Faridani O. R., Single-cell sequencing of the small-RNA transcriptome. Nat. Biotechnol. 34, 1264– 1266 (2016). 27798564 source
plaindirect- Asserted: passes — The authors put it forward as true.
- Checkable: passes — It can be checked against evidence.
- Load-bearing: fails — The paper’s conclusions may not depend on it.
- Based: passes — The paper gives a reason why it holds.
Probably not a substantial claim. The paper’s conclusions may not depend on it.
- Partly supported
The cited sources support only part of this claim — read each source’s verdict below.
In the paper
“Small noncoding RNAs (ncRNAs) are a large family of endogenously expressed transcripts, 18 to 200 nt long”
§ A mouse tissue atlas of small noncoding RNA > Abstract
What the sources say
- Partly supportedcites [1] Bartel D. P., Metazoan microRNAs. Cell 173, 20– 51 (2018). 29570994 PMC6091663 sourceExperimental — accuracy not yet measured
The Introduction (page unavailable) describes endogenous small RNAs as a larger class and identifies lin-4 and let-7 products as noncoding RNAs about 22 nt long. It does not give an 18–200 nt range for small ncRNAs generally, so the stated length range is unsupported by this source. (LLM, conf=0.84)
- Partly supportedcites [2] Cech T. R., Steitz J. A., The noncoding RNA revolution-trashing old rules to forge new ones. Cell 157, 77– 94 (2014). 24679528 sourceExperimental — accuracy not yet measured
The Introduction describes several classes of small ncRNAs, and the discussion of miRNAs calls them cellularly encoded. The discussion of lncRNAs places long ncRNAs above 200 nt, but our copy does not define small ncRNAs as 18–200 nt or establish the 18-nt lower bound (searched for the range and its endpoints). (LLM, conf=0.84)
plain- Asserted: passes — The authors put it forward as true.
- Checkable: passes — It can be checked against evidence.
- Load-bearing: fails — The paper’s conclusions may not depend on it.
- Based: passes — The paper gives a reason why it holds.
Probably not a substantial claim. The paper’s conclusions may not depend on it.
- Partly supported
The cited sources support only part of this claim — read each source’s verdict below.
In the paper
“today small ncRNAs are believed to be involved in nearly all developmental and pathological processes in mammals (2–4)”
§ A mouse tissue atlas of small noncoding RNA > Abstract
What the sources say
- Partly supportedcites [2] Cech T. R., Steitz J. A., The noncoding RNA revolution-trashing old rules to forge new ones. Cell 157, 77– 94 (2014). 24679528 sourceExperimental — accuracy not yet measured
The review says miRNAs contribute importantly to developmental, differentiation, and disease processes (indexed passage, section labeled Abstract; no page provided). It does not establish that small ncRNAs are involved in nearly all such processes in mammals; that breadth goes beyond the passage. (LLM, conf=0.86)
- Not checked — no full text of the sourcecites [3] Esteller M., Non-coding RNAs in human disease. Nat. Rev. Genet. 12, 861– 874 (2011). 22094949 source
- Partly supportedcites [4] Gebetsberger J., Wyss L., Mleczko A. M., Reuther J., Polacek N., A tRNA-derived fragment competes with mRNA for ribosome binding and regulates translation during stress. RNA Biol. 14, 1364– 1373 (2017). 27892771 PMC5711459 sourceExperimental — accuracy not yet measured
The Introduction (page not provided) describes ncRNAs as important regulators of gene expression and discusses the regulatory roles of small RNA fragments. It does not say that small ncRNAs are involved in nearly all developmental and pathological processes in mammals; the Discussion instead focuses on a stress-responsive tRNA fragment in an archaeon. (LLM, conf=0.82)
hedgedcorrelational- Asserted: passes — The authors put it forward as true.
- Checkable: passes — It can be checked against evidence.
- Load-bearing: fails — The paper’s conclusions may not depend on it.
- Based: passes — The paper gives a reason why it holds.
Probably not a substantial claim. The paper’s conclusions may not depend on it.
- Partly supported
The cited sources support only part of this claim — read each source’s verdict below.
In the paper
“numerous studies have revealed the direct involvement of various small ncRNAs in regulation of gene expression at the levels of posttranscriptional mRNA processing (5–7) and ribosome biogenesis (8)”
§ A mouse tissue atlas of small noncoding RNA > Abstract
What the sources say
- Supportedcites [5] Becker D., Nuclear pre-snRNA export is an essential quality assurance mechanism for functional spliceosomes. Cell Rep. 27, 3199– 3214.e3 (2019). 31189105 source
The citation is attached to posttranscriptional mRNA processing, not ribosome biogenesis. The Introduction identifies snRNAs as components of spliceosomes, and the Discussion reports that immature snRNAs impair spliceosomes and cause genome-wide splicing defects. This supports the claimed involvement of small ncRNAs in mRNA processing. (LLM, conf=0.90)
- Partly supportedcites [6] Gebert L. F. R., MacRae I. J., Regulation of microRNA function in animals. Nat. Rev. Mol. Cell Biol. 20, 21– 37 (2019). 30108335 PMC6546304 sourceExperimental — accuracy not yet measured
The Introduction and ‘Overview of miRNA function’ (pages unavailable) describe microRNAs regulating gene expression after transcription through translational repression and mRNA decay, including deadenylation and decapping. The cited paper does not establish the broader claim about various small ncRNAs or address ribosome biogenesis. (LLM, conf=0.82)
- Partly supportedcites [7] Telonis A. G., Dissecting tRNA-derived fragment complexities using personalized transcriptomes reveals novel fragment classes and unexpected dependencies. Oncotarget 6, 24797– 24822 (2015). 26325506 PMC4694795 sourceExperimental — accuracy not yet measured
The Discussion (page unavailable) links tRNA-derived fragments to post-transcriptional transcript regulation and reports their Ago loading, but it treats their targeting of other RNA transcripts as an expectation rather than a direct finding of this study. The cited passages do not establish the broader claim about various small ncRNAs or address ribosome biogenesis. (LLM, conf=0.82)
- Supportedcites [8] Reichow S. L., Hamma T., Ferré-D’Amaré A. R., Varani G., The structure and function of small nucleolar ribonucleoproteins. Nucleic Acids Res. 35, 1452– 1464 (2007). 17284456 PMC1865073 source
Citation (8) is attached to the ribosome-biogenesis part of the sentence, not the mRNA-processing part. The BACKGROUND section says snoRNPs act in the nucleolus, where ribosome biogenesis takes place, and that a subset is required for pre-rRNA cleavage. (LLM, conf=0.90)
boosteddirect- Asserted: passes — The authors put it forward as true.
- Checkable: passes — It can be checked against evidence.
- Load-bearing: fails — The paper’s conclusions may not depend on it.
- Based: passes — The paper gives a reason why it holds.
Probably not a substantial claim. The paper’s conclusions may not depend on it.
- Supported
The cited sources support only part of this claim — read each source’s verdict below.
In the paper
“snoRNA and snRNA are believed to yield incomplete recovery in small RNA-seq experiments due to their secondary structure (32).”
§ A mouse tissue atlas of small noncoding RNA > Results > Small ncRNA Expression Atlas of Mouse Tissues.
What the sources say
- Partly supportedcites [32] Boivin V., Simultaneous sequencing of coding and noncoding RNA reveals a human transcriptome dominated by a small number of highly expressed noncoding genes. RNA 24, 950– 965 (2018). 29703781 PMC6004057 sourceExperimental — accuracy not yet measured
The Discussion (page not provided) says size selection favors shorter, less structured box C/D snoRNAs over longer H/ACA snoRNAs, supporting structure-related incomplete recovery for some snoRNAs. The Results (page not provided) also report biased detection of small noncoding RNAs, but do not establish that snRNAs are incompletely recovered because of their secondary structure. (LLM, conf=0.84)
hedgedconditional- Asserted: passes — The authors put it forward as true.
- Checkable: passes — It can be checked against evidence.
- Load-bearing: fails — The paper’s conclusions may not depend on it.
- Based: passes — The paper gives a reason why it holds.
Probably not a substantial claim. The paper’s conclusions may not depend on it.
- Partly supported
The cited sources support only part of this claim — read each source’s verdict below.
In the paper
“Aberrant expression of small ncRNAs, in turn, has been associated with diseases such as cancer, autoimmune disease, and several neurodegenerative disorders (9, 10).”
§ A mouse tissue atlas of small noncoding RNA > Abstract
What the sources say
- Not checked — no full text of the sourcecites [9] Keller A., Toward the blood-borne miRNome of human diseases. Nat. Methods 8, 841– 843 (2011). 21892151 source
- Partly supportedcites [10] Somel M., MicroRNA, mRNA, and protein expression link development and aging in human and macaque brain. Genome Res. 20, 1207– 1218 (2010). 20647238 PMC2928499 sourceExperimental — accuracy not yet measured
The “Strictly developmental regulation” section links miR-29 to tumor suppression and its loss to sporadic Alzheimer’s disease; “Aging as extended development” also discusses miR-34a in neuroblastoma and an Alzheimer’s mouse model. These passages support associations with cancer and one neurodegenerative disorder, but the copy does not support the claim about autoimmune disease or several neurodegenerative disorders. Page numbers are not provided in the indexed passages. (LLM, conf=0.87)
plaincorrelational- Asserted: passes — The authors put it forward as true.
- Checkable: passes — It can be checked against evidence.
- Load-bearing: fails — The paper’s conclusions may not depend on it.
- Based: passes — The paper gives a reason why it holds.
Probably not a substantial claim. The paper’s conclusions may not depend on it.
The sources with a verdict support this claim; the rest weren’t checked yet, have no full text we could read, or their verdicts aren’t rated yet.
In the paper
“with some being shown to be expressed in a tissue- (16), cell type- (17), or even cell state-specific manner (18)”
§ A mouse tissue atlas of small noncoding RNA > Abstract
What the sources say
- Not checked — no full text of the sourcecites [16] Landgraf P., A mammalian microRNA expression atlas based on small RNA library sequencing. Cell 129, 1401– 1414 (2007). 17604727 PMC2681231 source
- Not checked — no full text of the sourcecites [17] Faridani O. R., Single-cell sequencing of the small-RNA transcriptome. Nat. Biotechnol. 34, 1264– 1266 (2016). 27798564 source
- Supportedcites [18] Sherstyuk V. V., Genome-wide profiling and differential expression of microRNA in rat pluripotent stem cells. Sci. Rep. 7, 2787 (2017). 28584262 PMC5459850 source
Citation (18) is attached to the cell state-specific part of the sentence. In Results > Validation of novel miRNAs by qRT-PCR (page not specified), the paper reports that several miRNAs decrease during differentiation of rat embryonic and induced pluripotent stem cells, supporting expression that varies by cell state. (LLM, conf=0.93)
plaincorrelational- Asserted: passes — The authors put it forward as true.
- Checkable: passes — It can be checked against evidence.
- Load-bearing: passes — The paper’s conclusions depend on it.
- Based: passes — The paper gives a reason why it holds.
Probably not a substantial claim.
The cited sources support only part of this claim — read each source’s verdict below.
In the paper
“that play a crucial role in regulating cell function (1, 2)”
§ A mouse tissue atlas of small noncoding RNA > Abstract
What the sources say
- Partly supportedcites [1] Bartel D. P., Metazoan microRNAs. Cell 173, 20– 51 (2018). 29570994 PMC6091663 sourceExperimental — accuracy not yet measured
The Introduction describes microRNAs as small regulatory RNAs, and “Biological Importance of miRNAs” says they influence diverse cellular functions. The paper supports the claim for microRNAs, but the citing sentence extends it to small noncoding RNAs generally. (LLM, conf=0.82)
- Supportedcites [2] Cech T. R., Steitz J. A., The noncoding RNA revolution-trashing old rules to forge new ones. Cell 157, 77– 94 (2014). 24679528 source
The Introduction describes small ncRNAs, including miRNAs, as important in regulating gene expression. The paper also describes small RNAs that regulate translation, supporting the broader paraphrase that they help regulate cell function. Page numbers are not provided in our copy. (LLM, conf=0.91)
plaindirect- Asserted: passes — The authors put it forward as true.
- Checkable: passes — It can be checked against evidence.
- Load-bearing: fails — The paper’s conclusions may not depend on it.
- Based: passes — The paper gives a reason why it holds.
Probably not a substantial claim. The paper’s conclusions may not depend on it.
- Partly supported
The sources with a verdict support this claim; the rest weren’t checked yet, have no full text we could read, or their verdicts aren’t rated yet.
In the paper
“We identified both well-described brain-specific miRNAs, such as mir-9, mir-124, mir-219, mir-338 (16, 24, 33), as well as those which are missing from existing catalogs, such as mir-666, mir-878, mir-433, etc.”
§ A mouse tissue atlas of small noncoding RNA > Results > Tissue-Specific miRNA.
What the sources say
- Not checked — no full text of the sourcecites [16] Landgraf P., A mammalian microRNA expression atlas based on small RNA library sequencing. Cell 129, 1401– 1414 (2007). 17604727 PMC2681231 source
- Could not verifycites [24] McCall M. N., Toward the human cellular microRNAome. Genome Res. 27, 1769– 1781 (2017). 28877962 PMC5630040 sourceExperimental — accuracy not yet measured
The Results sections on diverse microRNA expression and novel human microRNAs discuss cell-specific expression and newly identified candidates, but do not identify miR-9, miR-124, miR-219, or miR-338 as brain-specific, or miR-666, miR-878, or miR-433 as missing from catalogs. Searches for those names and for brain-specific microRNAs found no passage establishing the attributed examples; page numbers were not available in our copy. (LLM, conf=0.72)
- Supportedcites [33] Ludwig N., Distribution of miRNA expression across human tissues. Nucleic Acids Res. 44, 3865– 3877 (2016). 26921406 PMC4856985 source
The citation follows the list of well-described brain-specific miRNAs, not the citing authors’ subsequent claim about miRNAs missing from catalogs. In Results, “Clustering of tissue patterns and analysis of miRNA families,” the source reports brain-specific expression of all four listed miRNAs. (LLM, conf=0.93)
plain- Asserted: passes — The authors put it forward as true.
- Checkable: passes — It can be checked against evidence.
- Load-bearing: unclear — It is unclear whether the paper’s conclusions depend on it.
- Based: passes — The paper gives a reason why it holds.
It may state two separate claims as one.
The cited sources that could be checked couldn’t confirm or dispute this claim.
In the paper
“we could identify that muscle-specific mir-133a-2 is expressed in cardiomyocytes, while mir-148a is expressed in hepatocytes and duct cells (Fig. 6 C and D) and mir-194–2 comes from the enterocytes in the gut (24, 25).”
§ A mouse tissue atlas of small noncoding RNA > Results > Integration of Small RNA-Seq and scATAC-Seq Data.
What the sources say
- Could not verifycites [24] McCall M. N., Toward the human cellular microRNAome. Genome Res. 27, 1769– 1781 (2017). 28877962 PMC5630040 sourceExperimental — accuracy not yet measured
The Results section discusses cell-specific microRNA expression, but the passages in our copy do not identify miR-133a-2 in cardiomyocytes, miR-148a in hepatocytes or duct cells, or miR-194-2 in gut enterocytes. Searches for each named microRNA with its claimed cell type found no passage establishing those associations; page numbers were not available. (LLM, conf=0.72)
- Could not verifycites [25] de Rie D..; FANTOM Consortium, An integrated expression atlas of miRNAs and their promoters in human and mouse. Nat. Biotechnol. 35, 872– 878 (2017). 28829439 PMC5767576 sourceExperimental — accuracy not yet measured
The Results sections on cell ontology and pri-miRNA expression report cell-type patterns, but not the claimed pairings: they name miR-122-5p in hepatocytes and mir-208a in heart, rather than the miRNAs in the citing sentence. Searches for mir-133a-2, mir-148a, and mir-194-2 with their claimed cell types found no passage establishing those expression patterns, including the gut-enterocyte claim nearest the citation. (LLM, conf=0.74)
hedgedcorrelational- Asserted: passes — The authors put it forward as true.
- Checkable: passes — It can be checked against evidence.
- Load-bearing: unclear — It is unclear whether the paper’s conclusions depend on it.
- Based: passes — The paper gives a reason why it holds.
It may state two separate claims as one.
- Could not verify
The cited sources support only part of this claim — read each source’s verdict below.
In the paper
“Several groups have observed a sex bias in the levels of miRNA in blood, cancer tissues, and human lymphoblastoid cell lines (57, 58).”
§ A mouse tissue atlas of small noncoding RNA > Results > miRNAs Are Expressed in a Sex-Specific Manner.
What the sources say
- Supportedcites [57] Guo L., Zhang Q., Ma X., Wang J., Liang T., miRNA and mRNA expression analysis reveals potential sex-biased miRNA expression. Sci. Rep. 7, 39812 (2017). 28045090 PMC5206641 source
The Abstract reports prior findings of sex differences in miRNA expression and concentration, and cites work on gender-dependent isomiR expression in human lymphoblastoid cell lines (References; isomiRs are miRNA variants). The Results section, “Expression and functional analysis in the same tissues between males and females,” reports sex-dependent miRNA expression in cancer tissues. The paper therefore supports the sentence as a summary of findings across studies, rather than as a description of samples it analyzed itself. (LLM, conf=0.84)
- Partly supportedcites [58] Loher P., Londin E. R., Rigoutsos I., IsomiR expression profiles in human lymphoblastoid cell lines exhibit population and gender dependencies. Oncotarget 5, 8790– 8802 (2014). 25229428 PMC4226722 sourceExperimental — accuracy not yet measured
The Discussion reports gender-dependent isomiR expression patterns in human lymphoblastoid cell lines. But the Results section says that no isomiR showed a statistically significant male–female expression difference within any of the five populations, so the paper does not establish a direct sex bias in levels within a population. It does not study blood or cancer tissues. (LLM, conf=0.85)
plaincorrelational- Asserted: passes — The authors put it forward as true.
- Checkable: passes — It can be checked against evidence.
- Load-bearing: fails — The paper’s conclusions may not depend on it.
- Based: passes — The paper gives a reason why it holds.
Probably not a substantial claim. The paper’s conclusions may not depend on it.
- Supported
The cited sources support only part of this claim — read each source’s verdict below.
In the paper
“Recent efforts in profiling of the most studied types of small ncRNA, miRNA, across cells and tissues demonstrated the existence of tissue- and cell type-specific short noncoding transcripts (16, 24, 25, 33).”
§ A mouse tissue atlas of small noncoding RNA > Discussion
What the sources say
- Not checked — no full text of the sourcecites [16] Landgraf P., A mammalian microRNA expression atlas based on small RNA library sequencing. Cell 129, 1401– 1414 (2007). 17604727 PMC2681231 source
- Supportedcites [24] McCall M. N., Toward the human cellular microRNAome. Genome Res. 27, 1769– 1781 (2017). 28877962 PMC5630040 source
The Abstract reports profiling microRNA expression across 46 primary cell types, 42 cell lines, and 26 tissues, identifying both specific and ubiquitous patterns. The Results section, “Diverse microRNAs expression patterns,” reports that 94 of 320 highly expressed microRNAs occurred in only one normal cell class, supporting cell-type specificity; the Discussion also describes cell-specific expression patterns. (LLM, conf=0.93)
- Partly supportedcites [25] de Rie D..; FANTOM Consortium, An integrated expression atlas of miRNAs and their promoters in human and mouse. Nat. Biotechnol. 35, 872– 878 (2017). 28829439 PMC5767576 sourceExperimental — accuracy not yet measured
The Results sections ‘Expression variability of miRNAs in human primary cells’ and ‘Cell ontology analysis’ describe profiling miRNAs across primary cells and tissues and report miRNAs enriched in particular cell types. The passages establish cell-type specificity, but do not separately demonstrate tissue-specific expression. (LLM, conf=0.81)
boostedcorrelational- Asserted: passes — The authors put it forward as true.
- Checkable: passes — It can be checked against evidence.
- Load-bearing: passes — The paper’s conclusions depend on it.
- Based: passes — The paper gives a reason why it holds.
Probably not a substantial claim.
The cited sources support only part of this claim — read each source’s verdict below.
In the paper
“the AGO-CLIP, while often used as a “gold standard” of miRNA validation (24)”
§ A mouse tissue atlas of small noncoding RNA > Discussion
What the sources say
- Partly supportedcites [24] McCall M. N., Toward the human cellular microRNAome. Genome Res. 27, 1769– 1781 (2017). 28877962 PMC5630040 sourceExperimental — accuracy not yet measured
The Results (Novel human microRNAs; page unavailable) use Argonaute CLIP-seq data to narrow the list of putative miRNAs, supporting its use as validation evidence. The paper does not say AGO-CLIP is often used or regarded as a gold standard; the Discussion says the resulting candidates are not definitive miRNAs and require further in vivo evidence. (LLM, conf=0.85)
plain- Asserted: passes — The authors put it forward as true.
- Checkable: passes — It can be checked against evidence.
- Load-bearing: passes — The paper’s conclusions depend on it.
- Based: passes — The paper gives a reason why it holds.
Probably not a substantial claim.
- Partly supported
The cited sources support only part of this claim — read each source’s verdict below.
In the paper
“Batch effects were corrected using limma R package (79).”
§ A mouse tissue atlas of small noncoding RNA > Materials and Methods > Unsupervised Clustering and Dimensionality Reduction Analysis.
What the sources say
- Partly supportedcites [79] Ritchie M. E., Limma powers differential expression analyses for RNA-sequencing and microarray studies. Nucleic Acids Res. 43, e47 (2015). 25605792 PMC4402510 sourceExperimental — accuracy not yet measured
The Introduction and Results > User-interface identify limma as an R-based package. Results > Preprocessing microarray data says its normalization methods remove systematic technical differences between assays, but the passages found do not describe correction of batch effects specifically. The cited paper also cannot establish that the citing authors performed that correction. (LLM, conf=0.78)
plaindirect- Asserted: passes — The authors put it forward as true.
- Checkable: passes — It can be checked against evidence.
- Load-bearing: fails — The paper’s conclusions may not depend on it.
- Based: passes — The paper gives a reason why it holds.
Probably not a substantial claim. The paper’s conclusions may not depend on it.
- Partly supported
Every source the paper cites for this claim was checked and supports it.
In the paper
“Since the abundance of these specific fragments has been shown to correlate with the levels of functional angiogenin in the cell (54)”
§ A mouse tissue atlas of small noncoding RNA > Results > Tissue-Resident tRNA Fragments.
What the sources say
- Supportedcites [54] Thomas S. P., Hoang T. T., Ressler V. T., Raines R. T., Human angiogenin is a potent cytotoxin in the absence of ribonuclease inhibitor. RNA 24, 1018– 1027 (2018). 29748193 PMC6049508 source
In Results, “Effect of ANG on cellular tRF levels” (page unavailable), the authors report that particular tRFs rose sharply after ANG treatment, especially in cells lacking the ANG inhibitor RNH1. This supports the claimed relationship between the abundance of specific tRFs and functional ANG in the cells studied. (LLM, conf=0.87)
plaincorrelational- Asserted: passes — The authors put it forward as true.
- Checkable: passes — It can be checked against evidence.
- Load-bearing: passes — The paper’s conclusions depend on it.
- Based: passes — The paper gives a reason why it holds.
Probably not a substantial claim.
- Supported
Every source the paper cites for this claim was checked and supports it.
In the paper
“another miRNA, mir-340, was reported to be down-regulated in response to elevated androgen levels (60).”
§ A mouse tissue atlas of small noncoding RNA > Results > miRNAs Are Expressed in a Sex-Specific Manner.
What the sources say
- Supportedcites [60] Fletcher C. E., Dart D. A., Bevan C. L., Interplay between steroid signalling and microRNAs: Implications for hormone-dependent cancers. Endocr. Relat. Cancer 21, R409– R429 (2014). 25062737 source
In the ‘Androgen regulation of miR expression’ section, the review reports that miR-340 was downregulated by androgen in androgen-stimulated LNCaP cells. This supports the cited claim; the reported setting is a prostate cancer cell line. (LLM, conf=0.92)
plaindirect- Asserted: passes — The authors put it forward as true.
- Checkable: passes — It can be checked against evidence.
- Load-bearing: fails — The paper’s conclusions may not depend on it.
- Based: passes — The paper gives a reason why it holds.
Probably not a substantial claim. The paper’s conclusions may not depend on it.
- Supported
The cited sources support only part of this claim — read each source’s verdict below.
In the paper
“We have recently demonstrated that the current miRbase annotation of mammalian miRNA remains incomplete but can be readily expanded with the help of emerging small RNA-seq data (46).”
§ A mouse tissue atlas of small noncoding RNA > Results > Novel miRNAs.
What the sources say
- Partly supportedcites [46] Alles J., An estimate of the total number of true human miRNAs. Nucleic Acids Res. 47, 3353– 3364 (2019). 30820533 PMC6468295 sourceExperimental — accuracy not yet measured
The Discussion (page not available in our copy) estimates that miRBase V22 contains about half of the true human mature miRNAs and reports validated miRNAs not yet annotated there. The Results describe using small RNA-seq data to assess novel candidates, but many failed the study’s quality criteria. The paper supports an incomplete human annotation and the potential to expand it; it does not establish that mammalian annotations generally can be readily expanded from sequencing data alone. (LLM, conf=0.86)
boostedconditional- Asserted: passes — The authors put it forward as true.
- Checkable: passes — It can be checked against evidence.
- Load-bearing: passes — The paper’s conclusions depend on it.
- Based: passes — The paper gives a reason why it holds.
Probably not a substantial claim. It may state two separate claims as one.
- Partly supported
The cited sources support only part of this claim — read each source’s verdict below.
In the paper
“Three out of eight female-dominant miRNAs: mir-182, mir-148a, and mir-145a, were also shown previously to be estrogen regulated (59)”
§ A mouse tissue atlas of small noncoding RNA > Results > miRNAs Are Expressed in a Sex-Specific Manner.
What the sources say
- Partly supportedcites [59] Klinge C. M., Estrogen regulation of microRNA expression. Curr. Genomics 10, 169– 183 (2009). 19881910 PMC2705850 sourceExperimental — accuracy not yet measured
In “E2 Regulation of miRNAs in Animal Studies” (page unavailable), the review reports estrogen-related changes in miR-148a and miR-145. It does not identify miR-145a specifically, and no passage found for miR-182 establishes that it is estrogen regulated. The source therefore does not support all three named miRNAs. (LLM, conf=0.87)
plaincorrelational- Asserted: passes — The authors put it forward as true.
- Checkable: passes — It can be checked against evidence.
- Load-bearing: fails — The paper’s conclusions may not depend on it.
- Based: passes — The paper gives a reason why it holds.
Probably not a substantial claim. The paper’s conclusions may not depend on it.
- Partly supported
The cited sources that could be checked couldn’t confirm or dispute this claim.
In the paper
“Among these are ncRNAs known to be expressed in a large number of cell types, such as let-7d-3p, miR-320-3p (25), ncRNAs the cell type specificity of which is still unknown, such as Snord4a and Snord55, as well as those known to be expressed in the cell types that are abundant in all tissues (like endothelial miR-151-5p)”
§ A mouse tissue atlas of small noncoding RNA > Results > Ubiquitous ncRNA Transcripts.
What the sources say
- Could not verifycites [25] de Rie D..; FANTOM Consortium, An integrated expression atlas of miRNAs and their promoters in human and mouse. Nat. Biotechnol. 35, 872– 878 (2017). 28829439 PMC5767576 sourceExperimental — accuracy not yet measured
The citation is attached to the examples let-7d-3p and miR-320-3p, not to Snord4a, Snord55, or endothelial miR-151-5p. The Results section on cell ontology analysis reports that some miRNAs are broadly expressed, but does not identify either cited example as such. Searches for both miRNA names found no passage establishing their expression across many cell types. (LLM, conf=0.72)
plain- Asserted: passes — The authors put it forward as true.
- Checkable: passes — It can be checked against evidence.
- Load-bearing: unclear — It is unclear whether the paper’s conclusions depend on it.
- Based: passes — The paper gives a reason why it holds.
It may state two separate claims as one.
- Could not verify
The cited sources support only part of this claim — read each source’s verdict below.
In the paper
“The precise biological function of Rny1 and Rny3 is so far undefined, although they have been suggested to maintain RNA stability (38).”
§ A mouse tissue atlas of small noncoding RNA > Results > Tissue-Specific Expression of Rny, Terc, and Other ncRNA.
What the sources say
- Partly supportedcites [38] Kowalski M. P., Krude T., Functional roles of non-coding Y RNAs. Int. J. Biochem. Cell Biol. 66, 20– 29 (2015). 26159929 PMC4726728 sourceExperimental — accuracy not yet measured
The section on Y RNAs and RoRNPs says Y RNAs have a role in RNA stability, while the Introduction says the precise cellular function of RoRNPs is unclear. Neither passage makes those statements specifically about Rny1 and Rny3, so the claim’s gene-specific attribution is not supported by this copy. (LLM, conf=0.83)
hedgedconditional- Asserted: passes — The authors put it forward as true.
- Checkable: passes — It can be checked against evidence.
- Load-bearing: fails — The paper’s conclusions may not depend on it.
- Based: passes — The paper gives a reason why it holds.
Probably not a substantial claim. The paper’s conclusions may not depend on it. It may state two separate claims as one.
- Partly supported
The cited sources support only part of this claim — read each source’s verdict below.
In the paper
“fragments of either mature of precursor tRNA molecules enzymatically cleaved by angiogenin (Ang), Dicer, RNaseZ, and RNaseP (7, 53)”
§ A mouse tissue atlas of small noncoding RNA > Results > Tissue-Resident tRNA Fragments.
What the sources say
- Partly supportedcites [7] Telonis A. G., Dissecting tRNA-derived fragment complexities using personalized transcriptomes reveals novel fragment classes and unexpected dependencies. Oncotarget 6, 24797– 24822 (2015). 26325506 PMC4694795 sourceExperimental — accuracy not yet measured
The Introduction says tRFs can arise from mature or precursor tRNAs and describes roles for angiogenin, Dicer, and RNase Z, with Dicer dependence limited to several organisms. It does not identify RNase P as an enzyme producing tRFs, so the four-enzyme list is not fully supported. (LLM, conf=0.87)
- Partly supportedcites [53] Lee Y. S., Shibata Y., Malhotra A., Dutta A., A novel class of small RNAs: tRNA-derived RNA fragments (tRFs). Genes Dev. 23, 2639– 2649 (2009). 19933153 PMC2779758 sourceExperimental — accuracy not yet measured
The Results and Discussion (page not available in our copy) support tRFs arising from mature tRNA and pre-tRNA, and identify ELAC2 as the enzyme generating the pre-tRNA-derived tRF-1001. The Discussion says the enzyme responsible for mature-tRNA-derived tRF-5 and tRF-3 is unclear; it describes angiogenin-generated fragments as different from those studied here. Our copy does not identify Dicer, RNaseZ, or RNaseP as enzymes generating these tRFs. (LLM, conf=0.88)
plaindirect- Asserted: passes — The authors put it forward as true.
- Checkable: passes — It can be checked against evidence.
- Load-bearing: fails — The paper’s conclusions may not depend on it.
- Based: passes — The paper gives a reason why it holds.
Probably not a substantial claim. The paper’s conclusions may not depend on it.
- Partly supported
A result the paper reports from its own data — it cites no other source for it, so there is none to check. The quote shows it is in the paper.
In the paper
“which correspond to 60%, 53%, 39%, 96%, 92%, 100%, and 34% of annotated transcripts of each respective class”
§ A mouse tissue atlas of small noncoding RNA > Results > Small ncRNA Expression Atlas of Mouse Tissues.
plain- Asserted: passes — The authors put it forward as true.
- Checkable: passes — It can be checked against evidence.
- Load-bearing: passes — The paper’s conclusions depend on it.
- Based: passes — The paper gives a reason why it holds.
It may state two separate claims as one.
A result the paper reports from its own data — it cites no other source for it, so there is none to check. The quote shows it is in the paper.
In the paper
“miRNA was the most abundant small ncRNA type in our libraries, followed by snoRNA, snRNA, and tRFs”
§ A mouse tissue atlas of small noncoding RNA > Results > Small ncRNA Expression Atlas of Mouse Tissues.
plain- Asserted: passes — The authors put it forward as true.
- Checkable: passes — It can be checked against evidence.
- Load-bearing: unclear — It is unclear whether the paper’s conclusions depend on it.
- Based: passes — The paper gives a reason why it holds.
It may state two separate claims as one.
A result the paper reports from its own data — it cites no other source for it, so there is none to check. The quote shows it is in the paper.
In the paper
“The number of distinct ncRNA greatly varied across tissues; for example, lymphoid tissues (lung, spleen, and bone marrow) contained the largest number of distinct ncRNA, while pancreas and liver contained the fewest”
§ A mouse tissue atlas of small noncoding RNA > Results > Small ncRNA Expression Atlas of Mouse Tissues.
plaincorrelational- Asserted: passes — The authors put it forward as true.
- Checkable: passes — It can be checked against evidence.
- Load-bearing: unclear — It is unclear whether the paper’s conclusions depend on it.
- Based: passes — The paper gives a reason why it holds.
It may state two separate claims as one.
A result the paper reports from its own data — it cites no other source for it, so there is none to check. The quote shows it is in the paper.
In the paper
“We have also discovered that certain miRNAs are broadly sexually dimorphic, while other show sex bias in the context of specific tissues.”
§ A mouse tissue atlas of small noncoding RNA > Abstract
plaincorrelationaln = 14- Asserted: passes — The authors put it forward as true.
- Checkable: passes — It can be checked against evidence.
- Load-bearing: passes — The paper’s conclusions depend on it.
- Based: passes — The paper gives a reason why it holds.
It may state two separate claims as one.
A result the paper reports from its own data — it cites no other source for it, so there is none to check. The quote shows it is in the paper.
In the paper
“we mapped tissue-specific as well as broadly transcribed small ncRNA attributed to five different classes and spanning a large spectrum of expression levels”
§ A mouse tissue atlas of small noncoding RNA > Abstract
plainn = 14- Asserted: passes — The authors put it forward as true.
- Checkable: passes — It can be checked against evidence.
- Load-bearing: passes — The paper’s conclusions depend on it.
- Based: passes — The paper gives a reason why it holds.
The quote only partly states this claim.
- Rests on an assumption: No prior study encompasses a spectrum of mammalian tissues from both female and male individuals, nor includes the other noncoding RNA types that have recently been identified to carry out tissue- and cell type-specific functions.
A result the paper reports from its own data — it cites no other source for it, so there is none to check. The quote shows it is in the paper.
In the paper
“the detected tRFs were intergenic, snoRNAs were of intronic origin, snRNAs and scaRNAs were intronic and intergenic (63/35% and 64/36%, respectively), and miRNAs were transcribed from either introns (53%), exons (11%), or intergenic regions (11%)”
§ A mouse tissue atlas of small noncoding RNA > Results > Small ncRNA Expression Atlas of Mouse Tissues.
plain- Asserted: passes — The authors put it forward as true.
- Checkable: passes — It can be checked against evidence.
- Load-bearing: unclear — It is unclear whether the paper’s conclusions depend on it.
- Based: passes — The paper gives a reason why it holds.
It may state two separate claims as one.
A result the paper reports from its own data — it cites no other source for it, so there is none to check. The quote shows it is in the paper.
In the paper
“Each library yielded ∼5 to 20 million reads mapping to the mouse genome, out of which, on average ∼7 million mapped to the exons of small ncRNA genes (Materials and Methods), resulting in a total of ∼100 million ncRNA reads per tissue”
§ A mouse tissue atlas of small noncoding RNA > Results > Small ncRNA Expression Atlas of Mouse Tissues.
plain- Asserted: passes — The authors put it forward as true.
- Checkable: passes — It can be checked against evidence.
- Load-bearing: unclear — It is unclear whether the paper’s conclusions depend on it.
- Based: passes — The paper gives a reason why it holds.
It may state two separate claims as one.
A result the paper reports from its own data — it cites no other source for it, so there is none to check. The quote shows it is in the paper.
In the paper
“we identified a total of 1,317 distinct miRNA, 733 snRNA, 583 snoRNA, 25 scaRNA, 346 tRNA, 22 mitochondrial tRNA, and 193 other miscellaneous small ncRNA genes”
§ A mouse tissue atlas of small noncoding RNA > Results > Small ncRNA Expression Atlas of Mouse Tissues.
plain- Asserted: passes — The authors put it forward as true.
- Checkable: passes — It can be checked against evidence.
- Load-bearing: passes — The paper’s conclusions depend on it.
- Based: passes — The paper gives a reason why it holds.
It may state two separate claims as one.
A result the paper reports from its own data — it cites no other source for it, so there is none to check. The quote shows it is in the paper.
In the paper
“mtRFs followed a similar trend of fragment shift. We found 5′tRFs of proline-transferring mt-Tp in the heart and 5′tRFs of asparagine-transferring mt-Tn in the liver, while within other tissues we detected different fragment types of these tRNAs”
§ A mouse tissue atlas of small noncoding RNA > Results > Tissue-Resident tRNA Fragments.
plaincorrelational- Asserted: passes — The authors put it forward as true.
- Checkable: passes — It can be checked against evidence.
- Load-bearing: unclear — It is unclear whether the paper’s conclusions depend on it.
- Based: passes — The paper gives a reason why it holds.
It may state two separate claims as one.
A result the paper reports from its own data — it cites no other source for it, so there is none to check. The quote shows it is in the paper.
In the paper
“we identified novel miRNAs (17_8620, 4_6440, 9_15723) that are supported by AGO-CLIP data, prior reports, or both, but for which we could not confirm the existence through RT-qPCR”
§ A mouse tissue atlas of small noncoding RNA > Results > Novel miRNAs.
plain- Asserted: passes — The authors put it forward as true.
- Checkable: passes — It can be checked against evidence.
- Load-bearing: unclear — It is unclear whether the paper’s conclusions depend on it.
- Based: passes — The paper gives a reason why it holds.
It may state two separate claims as one.
A result the paper reports from its own data — it cites no other source for it, so there is none to check. The quote shows it is in the paper.
In the paper
“In the case of nuclear tRFs, the vast majority of fragments in each tissue were attributed to glycine, glutamine, valine, and lysine tRNA, with the intestine containing the largest amounts of the respective 5′tR-halves.”
§ A mouse tissue atlas of small noncoding RNA > Results > Tissue-Resident tRNA Fragments.
plaincorrelational- Asserted: passes — The authors put it forward as true.
- Checkable: passes — It can be checked against evidence.
- Load-bearing: unclear — It is unclear whether the paper’s conclusions depend on it.
- Based: passes — The paper gives a reason why it holds.
It may state two separate claims as one.
A result the paper reports from its own data — it cites no other source for it, so there is none to check. The quote shows it is in the paper.
In the paper
“Differential expression analysis on putative novel miRNAs identified six miRNAs to be also expressed in a sex-specific manner. Strikingly, all six were male-dominant, with one of them even found to be consistently up-regulated in two tissues, male muscle and pancreas”
§ A mouse tissue atlas of small noncoding RNA > Results > Novel miRNAs.
plaincorrelational- Asserted: passes — The authors put it forward as true.
- Checkable: passes — It can be checked against evidence.
- Load-bearing: unclear — It is unclear whether the paper’s conclusions depend on it.
- Based: passes — The paper gives a reason why it holds.
It may state two separate claims as one.
A result the paper reports from its own data — it cites no other source for it, so there is none to check. The quote shows it is in the paper.
In the paper
“we identified mir-187 and mir-142 to be expressed in microglia”
§ A mouse tissue atlas of small noncoding RNA > Results > Integration of Small RNA-Seq and scATAC-Seq Data.
plaincorrelational- Asserted: passes — The authors put it forward as true.
- Checkable: passes — It can be checked against evidence.
- Load-bearing: unclear — It is unclear whether the paper’s conclusions depend on it.
- Based: passes — The paper gives a reason why it holds.
It may state two separate claims as one.
A result the paper reports from its own data — it cites no other source for it, so there is none to check. The quote shows it is in the paper.
In the paper
“Examples of other miRNAs previously unknown to be tissue-specific include mir-499 in the heart, mir-3073b in the kidney, and mir-215 and mir-194 in the intestine”
§ A mouse tissue atlas of small noncoding RNA > Results > Tissue-Specific miRNA.
plaincorrelational- Asserted: passes — The authors put it forward as true.
- Checkable: passes — It can be checked against evidence.
- Load-bearing: unclear — It is unclear whether the paper’s conclusions depend on it.
- Based: passes — The paper gives a reason why it holds.
It may state two separate claims as one.
A result the paper reports from its own data — it cites no other source for it, so there is none to check. The quote shows it is in the paper.
In the paper
“our SVM model accurately classified postnatal forebrain, midbrain, hindbrain, and neural tube as brain tissue, as well as accurately inferred the tissue types for heart, intestine, kidney, liver, and muscle samples, yielding an overall accuracy of 0.96”
§ A mouse tissue atlas of small noncoding RNA > Results > ncRNA-Based Tissue Classification.
plain- Asserted: passes — The authors put it forward as true.
- Checkable: passes — It can be checked against evidence.
- Load-bearing: passes — The paper’s conclusions depend on it.
- Based: passes — The paper gives a reason why it holds.
It may state two separate claims as one.
A result the paper reports from its own data — it cites no other source for it, so there is none to check. The quote shows it is in the paper.
In the paper
“Using the top 400 ncRNAs identified in our analysis as tissue-specific, we correlated average ATAC-seq activity scores and ncRNA levels across eight tissues for which both types of data were available. We observed a strong correlation of both measurements for the brain, liver, and heart, and a weaker correlation for kidney and mixed scores between spleen, bone marrow, and lung”
§ A mouse tissue atlas of small noncoding RNA > Results > Integration of Small RNA-Seq and scATAC-Seq Data.
plaincorrelational- Asserted: passes — The authors put it forward as true.
- Checkable: passes — It can be checked against evidence.
- Load-bearing: passes — The paper’s conclusions depend on it.
- Based: passes — The paper gives a reason why it holds.
It may state two separate claims as one.
A result the paper reports from its own data — it cites no other source for it, so there is none to check. The quote shows it is in the paper.
In the paper
“we detected the presence of telomerase RNA component (Terc) in analyzed somatic tissues, with the highest levels seen in the bone marrow and spleen.”
§ A mouse tissue atlas of small noncoding RNA > Results > Tissue-Specific Expression of Rny, Terc, and Other ncRNA.
plaincorrelational- Asserted: passes — The authors put it forward as true.
- Checkable: passes — It can be checked against evidence.
- Load-bearing: passes — The paper’s conclusions depend on it.
- Based: passes — The paper gives a reason why it holds.
It may state two separate claims as one.
A result the paper reports from its own data — it cites no other source for it, so there is none to check. The quote shows it is in the paper.
In the paper
“predominantly present in either glutamatergic (Snord53, mir-802)”
§ A mouse tissue atlas of small noncoding RNA > Results > Integration of Small RNA-Seq and scATAC-Seq Data.
plaincorrelational- Asserted: passes — The authors put it forward as true.
- Checkable: passes — It can be checked against evidence.
- Load-bearing: unclear — It is unclear whether the paper’s conclusions depend on it.
- Based: passes — The paper gives a reason why it holds.
It may state two separate claims as one.
A result the paper reports from its own data — it cites no other source for it, so there is none to check. The quote shows it is in the paper.
In the paper
“we observed that mouse bone marrow and spleen had the highest correlation with human B cells, T cells, dendritic cells, and macrophages (0.5 < rs < 0.6), muscle correlated the most with myoblasts and myotubes (rs = 0.47), while brain correlated best with neural stem cells, spinal cord, and pineal and pituitary glands (rs = 0.49)”
§ A mouse tissue atlas of small noncoding RNA > Results > ncRNA-Based Tissue Classification.
plaincorrelational- Asserted: passes — The authors put it forward as true.
- Checkable: passes — It can be checked against evidence.
- Load-bearing: passes — The paper’s conclusions depend on it.
- Based: passes — The paper gives a reason why it holds.
It may state two separate claims as one.
A result the paper reports from its own data — it cites no other source for it, so there is none to check. The quote shows it is in the paper.
In the paper
“We observed this phenomenon on the de novo identified miRNA 14_6588, whose coordinates strictly overlap with mir-802a and that is only present in the brain.”
§ A mouse tissue atlas of small noncoding RNA > Discussion
plainSingle case- Asserted: passes — The authors put it forward as true.
- Checkable: passes — It can be checked against evidence.
- Load-bearing: unclear — It is unclear whether the paper’s conclusions depend on it.
- Based: passes — The paper gives a reason why it holds.
It may state two separate claims as one.
A result the paper reports from its own data — it cites no other source for it, so there is none to check. The quote shows it is in the paper.
In the paper
“we found miR-423, up-regulated in male lung and bone marrow, to negatively correlate with its target, estrogen-related receptor gamma (Esrrg) (rs = −0.9, FDR < 0.1)”
§ A mouse tissue atlas of small noncoding RNA > Results > miRNAs Are Expressed in a Sex-Specific Manner.
plaincorrelational- Asserted: passes — The authors put it forward as true.
- Checkable: passes — It can be checked against evidence.
- Load-bearing: passes — The paper’s conclusions depend on it.
- Based: passes — The paper gives a reason why it holds.
It may state two separate claims as one.
A result the paper reports from its own data — it cites no other source for it, so there is none to check. The quote shows it is in the paper.
In the paper
“we found that in the lung, mir-449c in expressed in alveolar macrophages, mir-34b and mir-34c in type II pneumocytes (Fig. 6E), and mir-155 is found in B cells”
§ A mouse tissue atlas of small noncoding RNA > Results > Integration of Small RNA-Seq and scATAC-Seq Data.
plaincorrelational- Asserted: passes — The authors put it forward as true.
- Checkable: passes — It can be checked against evidence.
- Load-bearing: passes — The paper’s conclusions depend on it.
- Based: passes — The paper gives a reason why it holds.
It may state two separate claims as one.
A result the paper reports from its own data — it cites no other source for it, so there is none to check. The quote shows it is in the paper.
In the paper
“the genomic coordinates of this miRNA, 14_6588, matched the coordinates of another, annotated one, mir-802a. Unlike mir-802a, however, 14_6588 is transcribed from the negative DNA strand and is only present in the brain”
§ A mouse tissue atlas of small noncoding RNA > Results > Novel miRNAs.
plain- Asserted: passes — The authors put it forward as true.
- Checkable: passes — It can be checked against evidence.
- Load-bearing: passes — The paper’s conclusions depend on it.
- Based: passes — The paper gives a reason why it holds.
It may state two separate claims as one.
A result the paper reports from its own data — it cites no other source for it, so there is none to check. The quote shows it is in the paper.
In the paper
“we found that FANTOM5 embryonic and neonatal cerebellum tissues strongly correlated with our brain samples (rs = 0.89 to 0.9), while erythroid cells had the strongest correlation with spleen and bone marrow (rs = 0.93)”
§ A mouse tissue atlas of small noncoding RNA > Results > ncRNA-Based Tissue Classification.
boostedcorrelational- Asserted: passes — The authors put it forward as true.
- Checkable: passes — It can be checked against evidence.
- Load-bearing: passes — The paper’s conclusions depend on it.
- Based: passes — The paper gives a reason why it holds.
It may state two separate claims as one.
A result the paper reports from its own data — it cites no other source for it, so there is none to check. The quote shows it is in the paper.
In the paper
“While the majority of ntRNA fragments were 33 nt long, mtRNA fragments spanned a large size range of 18 to 54 nt”
§ A mouse tissue atlas of small noncoding RNA > Results > Tissue-Resident tRNA Fragments.
plain- Asserted: passes — The authors put it forward as true.
- Checkable: passes — It can be checked against evidence.
- Load-bearing: unclear — It is unclear whether the paper’s conclusions depend on it.
- Based: passes — The paper gives a reason why it holds.
It may state two separate claims as one.
A result the paper reports from its own data — it cites no other source for it, so there is none to check. The quote shows it is in the paper.
In the paper
“Similar to annotated transcripts, novel miRNAs demonstrate a spectrum of tissue specificity with some being ubiquitously expressed, while others are only present in one tissue”
§ A mouse tissue atlas of small noncoding RNA > Results > Novel miRNAs.
boosted- Asserted: passes — The authors put it forward as true.
- Checkable: passes — It can be checked against evidence.
- Load-bearing: unclear — It is unclear whether the paper’s conclusions depend on it.
- Based: passes — The paper gives a reason why it holds.
It may state two separate claims as one.
A result the paper reports from its own data — it cites no other source for it, so there is none to check. The quote shows it is in the paper.
In the paper
“mir-124a-3, mir-1983, mir-212, and others in neurons (Fig. 6G)”
§ A mouse tissue atlas of small noncoding RNA > Results > Integration of Small RNA-Seq and scATAC-Seq Data.
plaincorrelational- Asserted: passes — The authors put it forward as true.
- Checkable: passes — It can be checked against evidence.
- Load-bearing: unclear — It is unclear whether the paper’s conclusions depend on it.
- Based: passes — The paper gives a reason why it holds.
It may state two separate claims as one.
A result the paper reports from its own data — it cites no other source for it, so there is none to check. The quote shows it is in the paper.
In the paper
“We found that the majority of putative miRNAs are present in only one tissue (312), but a small number (4) are found in all 11 tissues”
§ A mouse tissue atlas of small noncoding RNA > Results > Novel miRNAs.
plain- Asserted: passes — The authors put it forward as true.
- Checkable: passes — It can be checked against evidence.
- Load-bearing: passes — The paper’s conclusions depend on it.
- Based: passes — The paper gives a reason why it holds.
It may state two separate claims as one.
A result the paper reports from its own data — it cites no other source for it, so there is none to check. The quote shows it is in the paper.
In the paper
“Kidney and lung contained the highest number of sex-biased miRNAs (27 and 18, respectively), while only two were detected in the heart, five in the muscle, and seven in the brain”
§ A mouse tissue atlas of small noncoding RNA > Results > miRNAs Are Expressed in a Sex-Specific Manner.
plaincorrelational- Asserted: passes — The authors put it forward as true.
- Checkable: passes — It can be checked against evidence.
- Load-bearing: unclear — It is unclear whether the paper’s conclusions depend on it.
- Based: passes — The paper gives a reason why it holds.
It may state two separate claims as one.
A result the paper reports from its own data — it cites no other source for it, so there is none to check. The quote shows it is in the paper.
In the paper
“mouse Rnu11 and Scarna6 are preferentially found in lymphoid tissues, while three snRNAs of unverified function, Gm25793, Gm22448, and Gm23814, are specific to the brain”
§ A mouse tissue atlas of small noncoding RNA > Results > Tissue-Specific Expression of Rny, Terc, and Other ncRNA.
plaincorrelational- Asserted: passes — The authors put it forward as true.
- Checkable: passes — It can be checked against evidence.
- Load-bearing: unclear — It is unclear whether the paper’s conclusions depend on it.
- Based: passes — The paper gives a reason why it holds.
It may state two separate claims as one.
A result the paper reports from its own data — it cites no other source for it, so there is none to check. The quote shows it is in the paper.
In the paper
“we identified Snord17 and mir-700 in macrophages”
§ A mouse tissue atlas of small noncoding RNA > Results > Integration of Small RNA-Seq and scATAC-Seq Data.
plaincorrelational- Asserted: passes — The authors put it forward as true.
- Checkable: passes — It can be checked against evidence.
- Load-bearing: unclear — It is unclear whether the paper’s conclusions depend on it.
- Based: passes — The paper gives a reason why it holds.
It may state two separate claims as one.
A result the paper reports from its own data — it cites no other source for it, so there is none to check. The quote shows it is in the paper.
In the paper
“Out of these 400, nearly one-quarter are specific to the brain, with some being uniquely expressed within the tissue”
§ A mouse tissue atlas of small noncoding RNA > Results > Tissue-Specific miRNA.
plain- Asserted: passes — The authors put it forward as true.
- Checkable: passes — It can be checked against evidence.
- Load-bearing: passes — The paper’s conclusions depend on it.
- Based: passes — The paper gives a reason why it holds.
It may state two separate claims as one.
A result the paper reports from its own data — it cites no other source for it, so there is none to check. The quote shows it is in the paper.
In the paper
“Some of them are globally sexually dimorphic, while the majority are sex-biased only within a specific tissue.”
§ A mouse tissue atlas of small noncoding RNA > Results > miRNAs Are Expressed in a Sex-Specific Manner.
plaincorrelational- Asserted: passes — The authors put it forward as true.
- Checkable: passes — It can be checked against evidence.
- Load-bearing: passes — The paper’s conclusions depend on it.
- Based: passes — The paper gives a reason why it holds.
It may state two separate claims as one.
A result the paper reports from its own data — it cites no other source for it, so there is none to check. The quote shows it is in the paper.
In the paper
“mir-155 is found in B cells and even correlates with its maturation status (Fig. 6F)”
§ A mouse tissue atlas of small noncoding RNA > Results > Integration of Small RNA-Seq and scATAC-Seq Data.
plaincorrelational- Asserted: passes — The authors put it forward as true.
- Checkable: passes — It can be checked against evidence.
- Load-bearing: unclear — It is unclear whether the paper’s conclusions depend on it.
- Based: passes — The paper gives a reason why it holds.
It may state two separate claims as one.
A result the paper reports from its own data — it cites no other source for it, so there is none to check. The quote shows it is in the paper.
In the paper
“For many miRNAs, we generally observed the dominance of either 3p or 5p arm, while for some we also detected high levels of both arms present in one or multiple tissues”
§ A mouse tissue atlas of small noncoding RNA > Results > Tissue-Specific Arm Selection of miRNA.
plain- Asserted: passes — The authors put it forward as true.
- Checkable: passes — It can be checked against evidence.
- Load-bearing: passes — The paper’s conclusions depend on it.
- Based: passes — The paper gives a reason why it holds.
It may state two separate claims as one.
In the paper
“we also identified Snora35 (MBI-36) and Snord116 (MBII-85), known to be involved in neurodevelopmental disorders (34), to be brain exclusive (TSI = 1).”
§ A mouse tissue atlas of small noncoding RNA > Results > Tissue-Specific snoRNAs.
What the sources say
- Not checked — no full text of the sourcecites [34] Gallagher R. C., Pils B., Albalwi M., Francke U., Evidence for the role of PWCR1/HBII-85 C/D box small nucleolar RNAs in Prader–Willi syndrome. Am. J. Hum. Genet. 71, 669– 678 (2002). 12154412 PMC379204 source
plaincorrelational- Asserted: passes — The authors put it forward as true.
- Checkable: passes — It can be checked against evidence.
- Load-bearing: unclear — It is unclear whether the paper’s conclusions depend on it.
- Based: passes — The paper gives a reason why it holds.
It may state two separate claims as one.
A claim is checked only against the cited paper’s full text, never its abstract, and none is available for its sources.
In the paper
“Mammalian cells express several classes of small ncRNA, including microRNA (miRNA) (11), small interfering RNAs (siRNA), small nucleolar RNAs (snoRNA) (12), small nuclear RNA (snRNA) (13), PIWI-interacting RNA (piRNA) (14), and tRNA-derived small RNAs (tRFs) (15)”
§ A mouse tissue atlas of small noncoding RNA > Abstract
What the sources say
- Not checked — no full text of the sourcecites [11] Ha M., Kim V. N., Regulation of microRNA biogenesis. Nat. Rev. Mol. Cell Biol. 15, 509– 524 (2014). 25027649 source
- Not checked — no full text of the sourcecites [12] Matera A. G., Terns R. M., Terns M. P., Non-coding RNAs: Lessons from the small nuclear and small nucleolar RNAs. Nat. Rev. Mol. Cell Biol. 8, 209– 220 (2007). 17318225 source
- Not checked — no full text of the sourcecites [13] Kiss T., Biogenesis of small nuclear RNPs. J. Cell Sci. 117, 5949– 5951 (2004). 15564372 source
plain- Asserted: passes — The authors put it forward as true.
- Checkable: passes — It can be checked against evidence.
- Load-bearing: fails — The paper’s conclusions may not depend on it.
- Based: passes — The paper gives a reason why it holds.
Probably not a substantial claim. The paper’s conclusions may not depend on it.
In the paper
“Small ncRNA plays an indispensable role in shaping cellular identity in health and disease by orchestrating vital cellular processes and altering the expression of protein-coding genes (12).”
§ A mouse tissue atlas of small noncoding RNA > Discussion
What the sources say
- Not checked — no full text of the sourcecites [12] Matera A. G., Terns R. M., Terns M. P., Non-coding RNAs: Lessons from the small nuclear and small nucleolar RNAs. Nat. Rev. Mol. Cell Biol. 8, 209– 220 (2007). 17318225 source
boosteddirect- Asserted: passes — The authors put it forward as true.
- Checkable: passes — It can be checked against evidence.
- Load-bearing: fails — The paper’s conclusions may not depend on it.
- Based: passes — The paper gives a reason why it holds.
Probably not a substantial claim. The paper’s conclusions may not depend on it.
What the paper did — it cites no source for this, so there is none to check. The quote shows it is in the paper.
In the paper
“it proved to be more inclusive for the reads uniquely mapping within the miRNA exon but missing one base at the 5′ prime end of the molecule and more strict in counting reads mapping elsewhere in the genome, for which the levels were consistently overestimated by the other method.”
§ A mouse tissue atlas of small noncoding RNA > Materials and Methods > Data Processing.
plaincorrelational- Asserted: passes — The authors put it forward as true.
- Checkable: passes — It can be checked against evidence.
- Load-bearing: unclear — It is unclear whether the paper’s conclusions depend on it.
- Based: passes — The paper gives a reason why it holds.
It may state two separate claims as one.
A conclusion the paper draws from its own results — it cites no other source for it, so there is none to check. The quote shows it is in the paper.
In the paper
“the genomic location of a novel miRNA might match with that of a previously annotated one, while the molecule itself could be transcribed from an opposite DNA strand.”
§ A mouse tissue atlas of small noncoding RNA > Discussion
hedgedcorrelationalSingle case- Asserted: passes — The authors put it forward as true.
- Checkable: passes — It can be checked against evidence.
- Load-bearing: unclear — It is unclear whether the paper’s conclusions depend on it.
- Based: passes — The paper gives a reason why it holds.
It may state two separate claims as one.
What the paper did — it cites no source for this, so there is none to check. The quote shows it is in the paper.
In the paper
“All procedures followed animal care and biosafety guidelines approved by Stanford University’s Administrative Panel on Laboratory Animal Care and Administrative Panel of Biosafety.”
§ A mouse tissue atlas of small noncoding RNA > Materials and Methods > Subject Details.
plain- Asserted: passes — The authors put it forward as true.
- Checkable: passes — It can be checked against evidence.
- Load-bearing: fails — The paper’s conclusions may not depend on it.
- Based: passes — The paper gives a reason why it holds.
Probably not a substantial claim. The paper’s conclusions may not depend on it.
In the paper
“miRNA has been previously used to train classifiers capable of differentiating cancer/tissue types (71).”
§ A mouse tissue atlas of small noncoding RNA > Discussion
What the sources say
- Not checked — no full text of the sourcecites [71] Sherafatian M., Tree-based machine learning algorithms identified minimal set of miRNA biomarkers for breast cancer diagnosis and molecular subtyping. Gene 677, 111– 118 (2018). 30055304 source
plaindirect- Asserted: passes — The authors put it forward as true.
- Checkable: passes — It can be checked against evidence.
- Load-bearing: fails — The paper’s conclusions may not depend on it.
- Based: passes — The paper gives a reason why it holds.
Probably not a substantial claim. The paper’s conclusions may not depend on it.
What the paper did — it cites no source for this, so there is none to check. The quote shows it is in the paper.
In the paper
“We normalized and scaled train and test datasets separately.”
§ A mouse tissue atlas of small noncoding RNA > Materials and Methods > miRNA-Based Classifier.
plain- Asserted: passes — The authors put it forward as true.
- Checkable: passes — It can be checked against evidence.
- Load-bearing: fails — The paper’s conclusions may not depend on it.
- Based: passes — The paper gives a reason why it holds.
Probably not a substantial claim. The paper’s conclusions may not depend on it.
What the paper did — it cites no source for this, so there is none to check. The quote shows it is in the paper.
In the paper
“We counted a putative miRNA as “supported” if it had >5 AGO-CLIP counts.”
§ A mouse tissue atlas of small noncoding RNA > Materials and Methods > Identification of Identified Candidate miRNA.
plain- Asserted: passes — The authors put it forward as true.
- Checkable: passes — It can be checked against evidence.
- Load-bearing: passes — The paper’s conclusions depend on it.
- Based: passes — The paper gives a reason why it holds.
Probably not a substantial claim.
What the paper did — it cites no source for this, so there is none to check. The quote shows it is in the paper.
In the paper
“For independent validation, we performed RT-qPCR using custom Small RNA TaqMan probes (Life Technologies; catalog #4398987) designed on the star consensus sequence reported by miRDeep2.”
§ A mouse tissue atlas of small noncoding RNA > Materials and Methods > Identification of Identified Candidate miRNA.
plain- Asserted: passes — The authors put it forward as true.
- Checkable: passes — It can be checked against evidence.
- Load-bearing: passes — The paper’s conclusions depend on it.
- Based: passes — The paper gives a reason why it holds.
Probably not a substantial claim.
What the paper did — it cites no source for this, so there is none to check. The quote shows it is in the paper.
In the paper
“Only miRNAs supported by >5 reads were reported in this study.”
§ A mouse tissue atlas of small noncoding RNA > Materials and Methods > Identification of Identified Candidate miRNA.
plain- Asserted: passes — The authors put it forward as true.
- Checkable: passes — It can be checked against evidence.
- Load-bearing: passes — The paper’s conclusions depend on it.
- Based: passes — The paper gives a reason why it holds.
Probably not a substantial claim.
What the paper did — it cites no source for this, so there is none to check. The quote shows it is in the paper.
In the paper
“RNA integrity was assessed using Agilent Bioanalyzer using RNA 6000 pico kit”
§ A mouse tissue atlas of small noncoding RNA > Materials and Methods > Tissue Handling and RNA Extraction.
plain- Asserted: passes — The authors put it forward as true.
- Checkable: passes — It can be checked against evidence.
- Load-bearing: fails — The paper’s conclusions may not depend on it.
- Based: passes — The paper gives a reason why it holds.
Probably not a substantial claim. The paper’s conclusions may not depend on it.
What the paper did — it cites no source for this, so there is none to check. The quote shows it is in the paper.
In the paper
“The accuracy was computed using 10-fold cross-validation procedure.”
§ A mouse tissue atlas of small noncoding RNA > Materials and Methods > miRNA-Based Classifier.
plainn = 136- Asserted: passes — The authors put it forward as true.
- Checkable: passes — It can be checked against evidence.
- Load-bearing: passes — The paper’s conclusions depend on it.
- Based: passes — The paper gives a reason why it holds.
Probably not a substantial claim.
What the paper did — it cites no source for this, so there is none to check. The quote shows it is in the paper.
In the paper
“P values obtained from the LRT test were corrected using Benjamini–Hochberg procedure to obtain an FDR estimate of tissue specificity scores for each gene.”
§ A mouse tissue atlas of small noncoding RNA > Materials and Methods > Differential Expression Analysis with DESeq2.
plaindirect- Asserted: passes — The authors put it forward as true.
- Checkable: passes — It can be checked against evidence.
- Load-bearing: passes — The paper’s conclusions depend on it.
- Based: passes — The paper gives a reason why it holds.
Probably not a substantial claim.
What the paper did — it cites no source for this, so there is none to check. The quote shows it is in the paper.
In the paper
“To test for the NULL hypothesis, we performed a permutation test in which we randomly reassigned the sex labels to 14 samples across each tissue and plotted the distribution of DESeq2 P values computed for the two groups (i.e., female and male) (SI Appendix, Fig. S7A).”
§ A mouse tissue atlas of small noncoding RNA > Materials and Methods > Differential Expression Analysis with DESeq2.
plainn = 14- Asserted: passes — The authors put it forward as true.
- Checkable: passes — It can be checked against evidence.
- Load-bearing: fails — The paper’s conclusions may not depend on it.
- Based: passes — The paper gives a reason why it holds.
Probably not a substantial claim. The paper’s conclusions may not depend on it.
What the paper did — it cites no source for this, so there is none to check. The quote shows it is in the paper.
In the paper
“We analyzed tissue and sex specificity of identified miRNAs based on transcripts supported by at least 50 sequencing reads across all samples.”
§ A mouse tissue atlas of small noncoding RNA > Materials and Methods > Identification of Identified Candidate miRNA.
plain- Asserted: passes — The authors put it forward as true.
- Checkable: passes — It can be checked against evidence.
- Load-bearing: passes — The paper’s conclusions depend on it.
- Based: passes — The paper gives a reason why it holds.
Probably not a substantial claim.
What the paper did — it cites no source for this, so there is none to check. The quote shows it is in the paper.
In the paper
“We used Benjamini–Hochberg-corrected P values (FDR) to assess the statistical significance of the computed DE scores (Fig. 5 and SI Appendix, Fig. S7A).”
§ A mouse tissue atlas of small noncoding RNA > Materials and Methods > Differential Expression Analysis with DESeq2.
plain- Asserted: passes — The authors put it forward as true.
- Checkable: passes — It can be checked against evidence.
- Load-bearing: passes — The paper’s conclusions depend on it.
- Based: passes — The paper gives a reason why it holds.
Probably not a substantial claim.
A conclusion the paper draws from its own results — it cites no other source for it, so there is none to check. The quote shows it is in the paper.
In the paper
“In this work, we show that this phenomenon extends beyond one ncRNA class and involves not only tissue-specific but also sex-specific ncRNA expression.”
§ A mouse tissue atlas of small noncoding RNA > Discussion
plaincorrelational- Asserted: passes — The authors put it forward as true.
- Checkable: passes — It can be checked against evidence.
- Load-bearing: passes — The paper’s conclusions depend on it.
- Based: passes — The paper gives a reason why it holds.
It may state two separate claims as one.
What the paper did — it cites no source for this, so there is none to check. The quote shows it is in the paper.
In the paper
“Only targets present in two or more databases were used.”
§ A mouse tissue atlas of small noncoding RNA > Materials and Methods > Analysis of Correlation between miRNA Expression and the Expression of Its Targets.
plain- Asserted: passes — The authors put it forward as true.
- Checkable: passes — It can be checked against evidence.
- Load-bearing: passes — The paper’s conclusions depend on it.
- Based: passes — The paper gives a reason why it holds.
Probably not a substantial claim.
The paper relies on this without support.
No prior study encompasses a spectrum of mammalian tissues from both female and male individuals, nor includes the other noncoding RNA types that have recently been identified to carry out tissue- and cell type-specific functions.
“However, no prior study encompasses a spectrum of mammalian tissues from both female and male individuals, nor includes the other noncoding RNA types that have recently been identified to carry out tissue- and cell type-specific functions (26, 27).”
The paper relies on this without support.
Surprisingly little is known about cell type-specific small ncRNA in the brain.
“surprisingly little is known about cell type-specific small ncRNA in the brain.”
The paper relies on this without support.
The brain remains one of the most underrepresented tissue within available tissue-level ncRNA resources.
“the brain remains one of the most underrepresented tissue.”
The paper relies on this without support.
Small ncRNAs have long been known to regulate the development and function of the brain.
“Small ncRNAs have been long known to regulate the development and function of the brain.”
Self-check
Percentages, sums and reported differences re-computed from the paper’s own numbers.
Each contradiction between two passages listed here was confirmed by an independent check.
Rated minor: it would not touch a result — a value no result rests on, a p-value that stays on the same side of the significance level, or a conflict that is clerical, resolved elsewhere in the paper, or outside its own findings.
In the paper
§ A mouse tissue atlas of small noncoding RNA > Results > Tissue-Specific miRNA.
“unsupervised clustering of the top 400 most differentially expressed ncRNA in our dataset also revealed that two out of three identified clusters comprise ncRNA genes that are up-regulated in the above-mentioned three tissues (SI Appendix, Fig. S3B).”
§ A mouse tissue atlas of small noncoding RNA > Materials and Methods > Differential Expression Analysis with DESeq2.
“Gene clusters in SI Appendix, Fig. S3B were computed on 250 differentially expressed genes (Padj < 1e-90 and base mean > 3) using DEGreport R package (81).”
Rated minor: it would not touch a result — a value no result rests on, a p-value that stays on the same side of the significance level, or a conflict that is clerical, resolved elsewhere in the paper, or outside its own findings.
In the paper
§ A mouse tissue atlas of small noncoding RNA > Results > Novel miRNAs.
“the genomic coordinates of this miRNA, 14_6588, matched the coordinates of another, annotated one, mir-802a.”
§ A mouse tissue atlas of small noncoding RNA > Results > Novel miRNAs.
“(D) RT-qPCR verified miRNA, 14_6588, transcribed from the negative strand of mir-208a.”
Citations
Cites
Moderated estimation of fold change and dispersion for RNA-seq data with DESeq2
Love, M. I., Huber, W., & Anders, S. (2014) · Genome Biology · doi:10.1186/s13059-014-0550-8 · Cited by 95,106
Cortes, C., & Vapnik, V. (1995) · Machine Learning · doi:10.1007/bf00994018 · Cited by 59,421
STAR: ultrafast universal RNA-seq aligner
Dobin, A., Davis, C. A., Schlesinger, F., Drenkow, J., Zaleski, C., Jha, S., Batut, P., Chaisson, M., & Gingeras, T. R. (2013) · Bioinformatics · doi:10.1093/bioinformatics/bts635 · Cited by 51,709
limma powers differential expression analyses for RNA-sequencing and microarray studies
Ritchie, M. E., Phipson, B., Wu, D., Hu, Y., Law, C. W., Shi, W., & Smyth, G. K. (2015) · Nucleic Acids Research · doi:10.1093/nar/gkv007 · Cited by 40,458
Cortes, C., & Vapnik, V. N. (1995) · Machine Learning · doi:10.1023/a:1022627411411 · Cited by 34,565
(2008) · Journal of Machine Learning Research · Cited by 33,051
featureCounts: an efficient general purpose program for assigning sequence reads to genomic features
Liao, Y., Smyth, G. K., & Shi, W. (2014) · Bioinformatics · doi:10.1093/bioinformatics/btt656 · Cited by 27,219
HTSeq—a Python framework to work with high-throughput sequencing data
Anders, S., Pyl, P. T., & Huber, W. (2015) · Bioinformatics · doi:10.1093/bioinformatics/btu638 · Cited by 21,464
An integrated encyclopedia of DNA elements in the human genome
The ENCODE Project Consortium (2012) · Nature · doi:10.1038/nature11247 · Cited by 18,072
Most mammalian mRNAs are conserved targets of microRNAs
Friedman, R. C., Farh, K. K.-H., Burge, C. B., & Bartel, D. P. (2009) · Genome Research · doi:10.1101/gr.082701.108 · Cited by 8,462
Cited by
Sorted by citations
The evolving role of investigative toxicology in the pharmaceutical industry
Pognan, F., Beilmann, M., Boonen, H. C. M., Czich, A., Dear, G. J., Hewitt, P. G., Mow, T. J., Oinonen, T., Roth, A. B., Steger‐Hartmann, T., et al. (2023) · Nature Reviews Drug Discovery · doi:10.1038/s41573-022-00633-x · Cited by 280
Adeno-Associated Virus Toolkit to Target Diverse Brain Cells
Challis, R. C., Ravindra Kumar, S., Chen, X., Goertsen, D., Coughlin, G. M., Hori, A. M., Chuapoco, M. R., Otis, T. S., Miles, T. F., & Gradinaru, V. (2022) · Annual Review of Neuroscience · doi:10.1146/annurev-neuro-111020-100834 · Cited by 148
miRNATissueAtlas2: an update to the human miRNA tissue atlas
Keller, A., Gröger, L., Tschernig, T., Solomon, J., Laham, O., Schaum, N., Wagner, V., Kern, F., Schmartz, G. P., Li, Y., et al. (2022) · Nucleic Acids Research · doi:10.1093/nar/gkab808 · Cited by 143
Self-citationSpatial mapping of the total transcriptome by in situ polyadenylation
McKellar, D. W., Mantri, M., Hinchman, M. M., Parker, J. S. L., Sethupathy, P., Cosgrove, B. D., & Vlaminck, I. D. (2022) · Nature Biotechnology · doi:10.1038/s41587-022-01517-6 · Cited by 105
Chen, X., Wolfe, D. A., Bindu, D. S., Zhang, M., Taskin, N., Goertsen, D., Shay, T. F., Sullivan, E. E., Huang, S., Kumar, S. R., et al. (2023) · Nature Communications · doi:10.1038/s41467-023-38582-7 · Cited by 111
Self-citation
Metadata
- Authors
- Isakova, A., Fehlmann, T., Keller, A., & Quake, S. R.
- Affiliations
- Stanford University (US)
- Saarland University (DE)
- Stanford Medicine (US)
- Chan Zuckerberg Biohub San Francisco (US)
- Corresponding author
- Quake, Stephen R.
- Venue
- Proceedings of the National Academy of Sciences
- Publisher
- National Academy of Sciences
- Published
- 2020-09-25
- Volume
- 117
- Issue
- 41
- Pages
- 25634-25645
- ISSN
- 0027-8424 (ISSN-L)
- 1091-6490
- PMC
- PMC7568261
- OpenAlex
- W3088117294
- Semantic Scholar
- 4fba20e6bf188463c6a22af45a486765a5869886
- Cited by
- 119
- References
- 138
- Citations by year
- 2026: 19 · 2025: 18 · 2024: 16 · 2023: 13 · 2022: 18 · 2021: 33 · 2020: 1
- FWCI
- 5.19
- Type
- journal article
- Language
- en
- Open access
- hybrid
- doi.org
- Licence
- Locations
- Proceedings of the National Academy of Sciences (publishedVersion, cc-by-nc-nd)
- bioRxiv (Cold Spring Harbor Laboratory) (acceptedVersion, cc-by-nc-nd)
- PubMed Central (publishedVersion, cc-by-nc-nd)
- PubMed (publishedVersion)
- Publications of the UdS (Saarland University)
- Topics
- Life Sciences › Biochemistry, Genetics and Molecular Biology › Cancer Research › MicroRNA in disease regulation
- Life Sciences › Biochemistry, Genetics and Molecular Biology › Cancer Research › Cancer-related molecular mechanisms research
- Life Sciences › Biochemistry, Genetics and Molecular Biology › Molecular Biology › RNA modifications and cancer
- Keywords
- small RNA, tissue-specific gene expression, mouse tissues, microRNA, small nucleolar RNA, small nuclear RNA, tRNA-derived fragments, sexual dimorphism, single-cell chromatin accessibility, tissue atlas
- MeSH terms
- Animals, Brain, Female, Male, Mice, Inbred C57BL, Organ Specificity, Sex Characteristics, Mice, RNA, Small Untranslated, Single-Cell Analysis, Transcriptome
About these checks
Registry, retraction, Cites and statistics results are computed, not judged, with one exception: a printed reference that no index lists is read once by a model before it counts as a citation error. Claims are extracted by a model and kept only when their quote appears verbatim in the text; each cited source is then checked, with a model’s help, for whether it says what the claim relies on. Those verdicts can be wrong — read the claim’s quote and the cited source before relying on one.
A language model drew the claims from the paper on 2026-11-06, under version 3 of the claim definition (model deepseek-v4.1-flash, prompt extract-v3).
A second model labelled each claim on 2026-11-06 (model jev-1.13-20260917, definition revision gold-guideline-v0.2).
Cited sources are checked with a language model’s help (gpt-6-sol).
Statistics and arithmetic are recomputed, not judged.
Confidence bands are shown only for fields calibrated on our annotated test set. None is calibrated yet, so no band is shown.
What counts as a claim ›How we measure confidence ›How we check this ›
Are you an author, or do you see a problem with this page? Request a review
