

FastTree: Computing Large Minimum Evolution Trees with Profiles instead of a Distance Matrix
Open accessThe DOI matches its Crossref record; 42 of the 42 references it cites were found in a registry or an index.
Abstract
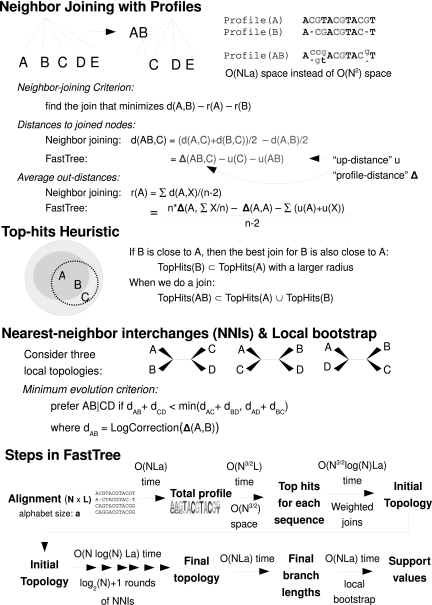
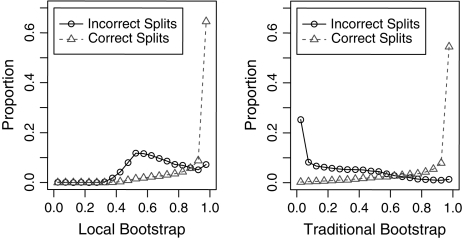
Gene families are growing rapidly, but standard methods for inferring phylogenies do not scale to alignments with over 10,000 sequences. We present FastTree, a method for constructing large phylogenies and for estimating their reliability. Instead of storing a distance matrix, FastTree stores sequence profiles of internal nodes in the tree. FastTree uses these profiles to implement Neighbor-Joining and uses heuristics to quickly identify candidate joins. FastTree then uses nearest neighbor interchanges to reduce the length of the tree. For an alignment with N sequences, L sites, and a different characters, a distance matrix requires O(N(2)) space and O(N(2)L) time, but FastTree requires just O(NLa + N ) memory and O(N log (N)La) time. To estimate the tree's reliability, FastTree uses local bootstrapping, which gives another 100-fold speedup over a distance matrix. For example, FastTree computed a tree and support values for 158,022 distinct 16S ribosomal RNAs in 17 h and 2.4 GB of memory. Just computing pairwise Jukes-Cantor distances and storing them, without inferring a tree or bootstrapping, would require 17 h and 50 GB of memory. In simulations, FastTree was slightly more accurate than Neighbor-Joining, BIONJ, or FastME; on genuine alignments, FastTree's topologies had higher likelihoods. FastTree is available at http://microbesonline.org/fasttree.
Overview
The claims and statistics of this paper haven’t been checked yet.
Free: it reads the open-access text and checks the first 5 claims that cite a source we can check. Create a free account to check every claim.
Integrity signals
Registry
Cites
Statistics
Figures
Verification
Claims the paper makes
The claims and statistics of this paper haven’t been checked yet.
Free: it reads the open-access text and checks the first 5 claims that cite a source we can check. Create a free account to check every claim.
Self-check
Percentages, sums and reported differences re-computed from the paper’s own numbers.
The self-check needs the paper’s full text.
Citations
Cites
The neighbor-joining method: a new method for reconstructing phylogenetic trees.
(1987) · Molecular Biology and Evolution · doi:10.1093/oxfordjournals.molbev.a040454 · Cited by 59,715
MUSCLE: multiple sequence alignment with high accuracy and high throughput
Edgar, R. C. (2004) · Nucleic Acids Research · doi:10.1093/nar/gkh340 · Cited by 44,662
CONFIDENCE LIMITS ON PHYLOGENIES: AN APPROACH USING THE BOOTSTRAP
Felsenstein, J. (1985) · Evolution · doi:10.1111/j.1558-5646.1985.tb00420.x · Cited by 44,647
DeLong, E. R., DeLong, D. M., & Clarke-Pearson, D. L. (1988) · Biometrics · doi:10.2307/2531595 · Cited by 22,649
Confidence Limits on Phylogenies: An Approach Using the Bootstrap
Felsenstein, J. (1985) · Evolution · doi:10.2307/2408678 · Cited by 19,371
A Simple, Fast, and Accurate Algorithm to Estimate Large Phylogenies by Maximum Likelihood
Guindon, S., & Gascuel, O. (2003) · Systematic Biology · doi:10.1080/10635150390235520 · Cited by 16,806
RAxML-VI-HPC: maximum likelihood-based phylogenetic analyses with thousands of taxa and mixed models
Stamatakis, A. (2006) · Bioinformatics · doi:10.1093/bioinformatics/btl446 · Cited by 15,582
Greengenes, a Chimera-Checked 16S rRNA Gene Database and Workbench Compatible with ARB
DeSantis, T. Z., Hugenholtz, P., Larsen, N., Rojas, M., Brodie, E. L., Keller, K., Huber, T., Dalevi, D., Hu, P., & Andersen, G. L. (2006) · Applied and Environmental Microbiology · doi:10.1128/aem.03006-05 · Cited by 10,891
Amino acid substitution matrices from protein blocks.
Henikoff, S., & Henikoff, J. G. (1992) · Proceedings of the National Academy of Sciences · doi:10.1073/pnas.89.22.10915 · Cited by 6,218
Approximate likelihood-ratio test for branches: A fast, accurate, and powerful alternative
Anisimova, M., & Gascuel, O. (2006) · Systematic Biology · doi:10.1080/10635150600755453 · Cited by 2,693
Research works printed but not linked: 4
- 2001, Pacific Symposium on Biocomputing. Pacific Symposium on Biocomputing, 2001, 547
- 1998, 44, 837
- Saitou, 1987, Molecular Biology and Evolution, 4, 406
- Studier, 1988, Molecular Biology and Evolution, 5, 729
Cited by
FastTree 2 – Approximately Maximum-Likelihood Trees for Large Alignments
Price, M. N., Dehal, P. S., & Arkin, A. P. (2010) · PLoS ONE · doi:10.1371/journal.pone.0009490 · Cited by 14,894
Self-citationThe Pfam Protein Families Database
Bateman, A. (2002) · Nucleic Acids Research · doi:10.1093/nar/30.1.276 · Cited by 14,000
Parks, D. H., Imelfort, M., Skennerton, C. T., Hugenholtz, P., & Tyson, G. W. (2015) · Genome Research · doi:10.1101/gr.186072.114 · Cited by 12,496
Global patterns of 16S rRNA diversity at a depth of millions of sequences per sample
Caporaso, J. G., Lauber, C. L., Walters, W. A., Berg-Lyons, D., Lozupone, C. A., Turnbaugh, P. J., Fierer, N., & Knight, R. (2011) · Proceedings of the National Academy of Sciences · doi:10.1073/pnas.1000080107 · Cited by 9,711
Dominguez-Bello, M. G., Costello, E. K., Contreras, M., Magris, M., Hidalgo, G., Fierer, N., & Knight, R. (2010) · Proceedings of the National Academy of Sciences · doi:10.1073/pnas.1002601107 · Cited by 4,774
Soil bacterial and fungal communities across a pH gradient in an arable soil
Rousk, J., Bååth, E., Brookes, P. C., Lauber, C. L., Lozupone, C., Caporaso, J. G., Knight, R., & Fierer, N. (2010) · The ISME Journal · doi:10.1038/ismej.2010.58 · Cited by 4,223
A standardized bacterial taxonomy based on genome phylogeny substantially revises the tree of life
Parks, D. H., Chuvochina, M., Waite, D. W., Rinke, C., Skarshewski, A., Chaumeil, P.-A., & Hugenholtz, P. (2018) · Nature Biotechnology · doi:10.1038/nbt.4229 · Cited by 3,603
Hsiao, E. Y., McBride, S. W., Hsien, S., Sharon, G., Hyde, E. R., McCue, T., Codelli, J. A., Chow, J., Reisman, S. E., Petrosino, J. F., et al. (2013) · Cell · doi:10.1016/j.cell.2013.11.024 · Cited by 3,283
The Pfam protein families database
Finn, R. D., Mistry, J., Tate, J., Coggill, P., Heger, A., Pollington, J. E., Gavin, O. L., Gunasekaran, P., Ceric, G., Forslund, K., et al. (2010) · Nucleic Acids Research · doi:10.1093/nar/gkp985 · Cited by 2,694
Parks, D. H., Chuvochina, M., Rinke, C., Mussig, A. J., Chaumeil, P.-A., & Hugenholtz, P. (2022) · Nucleic Acids Research · doi:10.1093/nar/gkab776 · Cited by 2,402
Host Remodeling of the Gut Microbiome and Metabolic Changes during Pregnancy
Koren, O., Goodrich, J. K., Cullender, T. C., Spor, A., Laitinen, K., Kling Bäckhed, H., Gonzalez, A., Werner, J. J., Angenent, L. T., Knight, R., et al. (2012) · Cell · doi:10.1016/j.cell.2012.07.008 · Cited by 2,165
Dietary emulsifiers impact the mouse gut microbiota promoting colitis and metabolic syndrome
Chassaing, B., Koren, O., Goodrich, J. K., Poole, A. C., Srinivasan, S., Ley, R. E., & Gewirtz, A. T. (2015) · Nature · doi:10.1038/nature14232 · Cited by 2,055
Recovery of nearly 8,000 metagenome-assembled genomes substantially expands the tree of life
Parks, D. H., Rinke, C., Chuvochina, M., Chaumeil, P.-A., Woodcroft, B. J., Evans, P. N., Hugenholtz, P., & Tyson, G. W. (2017) · Nature Microbiology · doi:10.1038/s41564-017-0012-7 · Cited by 1,882
Bayesian community-wide culture-independent microbial source tracking
Knights, D., Kuczynski, J., Charlson, E. S., Zaneveld, J., Mozer, M. C., Collman, R. G., Bushman, F. D., Knight, R., & Kelley, S. T. (2011) · Nature Methods · doi:10.1038/nmeth.1650 · Cited by 1,856
Composition, variability, and temporal stability of the intestinal microbiota of the elderly
Claesson, M. J., Cusack, S., O'Sullivan, O., Greene-Diniz, R., de Weerd, H., Flannery, E., Marchesi, J. R., Falush, D., Dinan, T., Fitzgerald, G., et al. (2011) · Proceedings of the National Academy of Sciences · doi:10.1073/pnas.1000097107 · Cited by 1,754
FastME 2.0: A Comprehensive, Accurate, and Fast Distance-Based Phylogeny Inference Program: Table 1.
Lefort, V., Desper, R., & Gascuel, O. (2015) · Molecular Biology and Evolution · doi:10.1093/molbev/msv150 · Cited by 1,777
A complete domain-to-species taxonomy for Bacteria and Archaea
Parks, D. H., Chuvochina, M., Chaumeil, P.-A., Rinke, C., Mussig, A. J., & Hugenholtz, P. (2020) · Nature Biotechnology · doi:10.1038/s41587-020-0501-8 · Cited by 1,530
Kang, D.-W., Adams, J. B., Gregory, A. C., Borody, T., Chittick, L., Fasano, A., Khoruts, A., Geis, E., Maldonado, J., McDonough-Means, S., et al. (2017) · Microbiome · doi:10.1186/s40168-016-0225-7 · Cited by 1,391
Joensen, K. G., Scheutz, F., Lund, O., Hasman, H., Kaas, R. S., Nielsen, E. M., & Aarestrup, F. M. (2014) · Journal of Clinical Microbiology · doi:10.1128/jcm.03617-13 · Cited by 1,409
Pushalkar, S., Hundeyin, M., Daley, D., Zambirinis, C. P., Kurz, E., Mishra, A., Mohan, N., Aykut, B., Usyk, M., Torres, L. E., et al. (2018) · Cancer Discovery · doi:10.1158/2159-8290.cd-17-1134 · Cited by 1,400
Examining the global distribution of dominant archaeal populations in soil
Bates, S. T., Berg-Lyons, D., Caporaso, J. G., Walters, W. A., Knight, R., & Fierer, N. (2011) · The ISME Journal · doi:10.1038/ismej.2010.171 · Cited by 1,322
Alterations of the human gut microbiome in multiple sclerosis
Jangi, S., Gandhi, R., Cox, L. M., Li, N., von Glehn, F., Yan, R., Patel, B., Mazzola, M. A., Liu, S., Glanz, B. L., et al. (2016) · Nature Communications · doi:10.1038/ncomms12015 · Cited by 1,307
Consistent effects of nitrogen amendments on soil microbial communities and processes across biomes
Ramirez, K. S., Craine, J. M., & Fierer, N. (2012) · Global Change Biology · doi:10.1111/j.1365-2486.2012.02639.x · Cited by 1,245
Human oral, gut, and plaque microbiota in patients with atherosclerosis
Koren, O., Spor, A., Felin, J., Fåk, F., Stombaugh, J., Tremaroli, V., Behre, C. J., Knight, R., Fagerberg, B., Ley, R. E., et al. (2011) · Proceedings of the National Academy of Sciences · doi:10.1073/pnas.1011383107 · Cited by 1,196
Viruses in the faecal microbiota of monozygotic twins and their mothers
Reyes, A., Haynes, M., Hanson, N., Angly, F. E., Heath, A. C., Rohwer, F., & Gordon, J. I. (2010) · Nature · doi:10.1038/nature09199 · Cited by 1,194
Human Gut Microbiota from Autism Spectrum Disorder Promote Behavioral Symptoms in Mice
Sharon, G., Cruz, N. J., Kang, D.-W., Gandal, M. J., Wang, B., Kim, Y.-M., Zink, E. M., Casey, C. P., Taylor, B. C., Lane, C. J., et al. (2019) · Cell · doi:10.1016/j.cell.2019.05.004 · Cited by 1,182
Paez-Espino, D., Eloe-Fadrosh, E. A., Pavlopoulos, G. A., Thomas, A. D., Huntemann, M., Mikhailova, N., Rubin, E., Ivanova, N. N., & Kyrpides, N. C. (2016) · Nature · doi:10.1038/nature19094 · Cited by 1,170
A computational framework to explore large-scale biosynthetic diversity
Navarro-Muñoz, J. C., Selem-Mojica, N., Mullowney, M. W., Kautsar, S. A., Tryon, J. H., Parkinson, E. I., De Los Santos, E. L. C., Yeong, M., Cruz-Morales, P., Abubucker, S., et al. (2020) · Nature Chemical Biology · doi:10.1038/s41589-019-0400-9 · Cited by 1,025
The Soil Microbiome Influences Grapevine-Associated Microbiota
Zarraonaindia, I., Owens, S. M., Weisenhorn, P., West, K., Hampton-Marcell, J., Lax, S., Bokulich, N. A., Mills, D. A., Martin, G., Taghavi, S., et al. (2015) · mBio · doi:10.1128/mbio.02527-14 · Cited by 990
Responses of soil bacterial and fungal communities to extreme desiccation and rewetting
Barnard, R. L., Osborne, C. A., & Firestone, M. K. (2013) · The ISME Journal · doi:10.1038/ismej.2013.104 · Cited by 987
Ubeda, C., Taur, Y., Jenq, R. R., Equinda, M. J., Son, T., Samstein, M., Viale, A., Socci, N. D., van den Brink, M. R. M., Kamboj, M., et al. (2010) · Journal of Clinical Investigation · doi:10.1172/jci43918 · Cited by 943
FXR is a molecular target for the effects of vertical sleeve gastrectomy
Ryan, K. K., Tremaroli, V., Clemmensen, C., Kovatcheva-Datchary, P., Myronovych, A., Karns, R., Wilson-Pérez, H. E., Sandoval, D. A., Kohli, R., Bäckhed, F., et al. (2014) · Nature · doi:10.1038/nature13135 · Cited by 931
Seasonal cycling in the gut microbiome of the Hadza hunter-gatherers of Tanzania
Smits, S. A., Leach, J., Sonnenburg, E. D., Gonzalez, C. G., Lichtman, J. S., Reid, G., Knight, R., Manjurano, A., Changalucha, J., Elias, J. E., et al. (2017) · Science · doi:10.1126/science.aan4834 · Cited by 886
Kostka, J. E., Prakash, O., Overholt, W. A., Green, S. J., Freyer, G., Canion, A., Delgardio, J., Norton, N., Hazen, T. C., & Huettel, M. (2011) · Applied and Environmental Microbiology · doi:10.1128/aem.05402-11 · Cited by 875
Asnicar, F., Thomas, A. M., Beghini, F., Mengoni, C., Manara, S., Manghi, P., Zhu, Q., Bolzan, M., Cumbo, F., May, U., et al. (2020) · Nature Communications · doi:10.1038/s41467-020-16366-7 · Cited by 869
A microbial signature for Crohn's disease
Pascal, V., Pozuelo, M., Borruel, N., Casellas, F., Campos, D., Santiago, A., Martinez, X., Varela, E., Sarrabayrouse, G., Machiels, K., et al. (2017) · Gut · doi:10.1136/gutjnl-2016-313235 · Cited by 822
Bifidobacteria-mediated immune system imprinting early in life
Henrick, B. M., Rodriguez, L., Lakshmikanth, T., Pou, C., Henckel, E., Arzoomand, A., Olin, A., Wang, J., Mikes, J., Tan, Z., et al. (2021) · Cell · doi:10.1016/j.cell.2021.05.030 · Cited by 800
Methane metabolism in the archaeal phylum Bathyarchaeota revealed by genome-centric metagenomics
Evans, P. N., Parks, D. H., Chadwick, G. L., Robbins, S. J., Orphan, V. J., Golding, S. D., & Tyson, G. W. (2015) · Science · doi:10.1126/science.aac7745 · Cited by 799
Garrett, W. S., Gallini, C. A., Yatsunenko, T., Michaud, M., DuBois, A., Delaney, M. L., Punit, S., Karlsson, M., Bry, L., Glickman, J. N., et al. (2010) · Cell Host & Microbe · doi:10.1016/j.chom.2010.08.004 · Cited by 788
Propionibacterium acnes Strain Populations in the Human Skin Microbiome Associated with Acne
Fitz-Gibbon, S., Tomida, S., Chiu, B.-H., Nguyen, L., Du, C., Liu, M., Elashoff, D., Erfe, M. C., Loncaric, A., Kim, J., et al. (2013) · Journal of Investigative Dermatology · doi:10.1038/jid.2013.21 · Cited by 775
Hezaveh, K., Shinde, R. S., Klötgen, A., Halaby, M. J., Lamorte, S., Ciudad, M. T., Quevedo, R., Neufeld, L., Liu, Z. Q., Jin, R., et al. (2022) · Immunity · doi:10.1016/j.immuni.2022.01.006 · Cited by 746
Discovery and inhibition of an interspecies gut bacterial pathway for Levodopa metabolism
Maini Rekdal, V., Bess, E. N., Bisanz, J. E., Turnbaugh, P. J., & Balskus, E. P. (2019) · Science · doi:10.1126/science.aau6323 · Cited by 753
Correcting for 16S rRNA gene copy numbers in microbiome surveys remains an unsolved problem
Louca, S., Doebeli, M., & Parfrey, L. W. (2018) · Microbiome · doi:10.1186/s40168-018-0420-9 · Cited by 753
Simplified and representative bacterial community of maize roots
Niu, B., Paulson, J. N., Zheng, X., & Kolter, R. (2017) · Proceedings of the National Academy of Sciences · doi:10.1073/pnas.1616148114 · Cited by 751
The composition of the gut microbiota shapes the colon mucus barrier
Jakobsson, H. E., Rodríguez‐Piñeiro, A. M., Schütte, A., Ermund, A., Boysen, P., Bemark, M., Sommer, F., Bäckhed, F., Hansson, G. C., & Johansson, M. E. (2015) · The EMBO Reports · doi:10.15252/embr.201439263 · Cited by 700
“The GG taxonomies were used to generate summaries of the taxonomic distributions of OTUs across different levels (phylum, order, family, genus and species A phylogenetic tree was built with FastTree [57] and used for estimates of a -diversity (Rarefaction curves, Chao1 [58], Shannon diversity [59]) and b -diversity (u…”
Metagenomic analysis of a permafrost microbial community reveals a rapid response to thaw
Mackelprang, R., Waldrop, M. P., DeAngelis, K. M., David, M. M., Chavarria, K. L., Blazewicz, S. J., Rubin, E. M., & Jansson, J. K. (2011) · Nature · doi:10.1038/nature10576 · Cited by 711
A Metagenomic Approach to Characterization of the Vaginal Microbiome Signature in Pregnancy
Aagaard, K., Riehle, K., Ma, J., Segata, N., Mistretta, T.-A., Coarfa, C., Raza, S., Rosenbaum, S., Van den Veyver, I., Milosavljevic, A., et al. (2012) · PLoS ONE · doi:10.1371/journal.pone.0036466 · Cited by 709
Airway microbiota and bronchial hyperresponsiveness in patients with suboptimally controlled asthma
Huang, Y. J., Nelson, C. E., Brodie, E. L., DeSantis, T. Z., Baek, M. S., Liu, J., Woyke, T., Allgaier, M., Bristow, J., Wiener-Kronish, J. P., et al. (2011) · Journal of Allergy and Clinical Immunology · doi:10.1016/j.jaci.2010.10.048 · Cited by 696
Gastrointestinal microbiome signatures of pediatric patients with irritable bowel syndrome
Saulnier, D. M., Riehle, K., Mistretta, T., Diaz, M., Mandal, D., Raza, S., Weidler, E. M., Qin, X., Coarfa, C., Milosavljevic, A., et al. (2011) · Gastroenterology · doi:10.1053/j.gastro.2011.06.072 · Cited by 672
Yin, J., Liao, S., He, Y., Wang, S., Xia, G., Liu, F., Zhu, J., You, C., Chen, Q., Zhou, L., et al. (2015) · Journal of the American Heart Association · doi:10.1161/jaha.115.002699 · Cited by 669
Goldfarb, K. C., Karaoz, U., Hanson, C. A., Santee, C. A., Bradford, M. A., Treseder, K. K., Wallenstein, M. D., & Brodie, E. L. (2011) · Frontiers in Microbiology · doi:10.3389/fmicb.2011.00094 · Cited by 663
Evolving Views of Pectin Biosynthesis
Atmodjo, M. A., Hao, Z., & Mohnen, D. (2013) · Annual Review of Plant Biology · doi:10.1146/annurev-arplant-042811-105534 · Cited by 625
Pathogens and host immunity in the ancient human oral cavity
Warinner, C., Rodrigues, J. F. M., Vyas, R., Trachsel, C., Shved, N., Grossmann, J., Radini, A., Hancock, Y., Tito, R. Y., Fiddyment, S., et al. (2014) · Nature Genetics · doi:10.1038/ng.2906 · Cited by 618
The Microbiota of Breast Tissue and Its Association with Breast Cancer
Urbaniak, C., Gloor, G. B., Brackstone, M., Scott, L., Tangney, M., & Reid, G. (2016) · Applied and Environmental Microbiology · doi:10.1128/aem.01235-16 · Cited by 625
Maturation of the gut microbiome and risk of asthma in childhood
Stokholm, J., Blaser, M. J., Thorsen, J., Rasmussen, M. A., Waage, J., Vinding, R. K., Schoos, A.-M. M., Kunøe, A., Fink, N. R., Chawes, B. L., et al. (2018) · Nature Communications · doi:10.1038/s41467-017-02573-2 · Cited by 614
Advancing Our Understanding of the Human Microbiome Using QIIME
Navas-Molina, J. A., Peralta-Sánchez, J. M., González, A., McMurdie, P. J., Vázquez-Baeza, Y., Xu, Z., Ursell, L. K., Lauber, C., Zhou, H., Song, S. J., et al. (2013) · Methods in Enzymology · doi:10.1016/b978-0-12-407863-5.00019-8 · Cited by 609
An evolving view of methane metabolism in the Archaea
Evans, P. N., Boyd, J. A., Leu, A. O., Woodcroft, B. J., Parks, D. H., Hugenholtz, P., & Tyson, G. W. (2019) · Nature Reviews Microbiology · doi:10.1038/s41579-018-0136-7 · Cited by 606
Chu, H., Fierer, N., Lauber, C. L., Caporaso, J. G., Knight, R., & Grogan, P. (2010) · Environmental Microbiology · doi:10.1111/j.1462-2920.2010.02277.x · Cited by 604
High taxonomic variability despite stable functional structure across microbial communities
Louca, S., Jacques, S. M. S., Pires, A. P. F., Leal, J. S., Srivastava, D. S., Parfrey, L. W., Farjalla, V. F., & Doebeli, M. (2016) · Nature Ecology & Evolution · doi:10.1038/s41559-016-0015 · Cited by 589
A human gut bacterial genome and culture collection for improved metagenomic analyses
Forster, S. C., Kumar, N., Anonye, B. O., Almeida, A., Viciani, E., Stares, M. D., Dunn, M., Mkandawire, T. T., Zhu, A., Shao, Y., et al. (2019) · Nature Biotechnology · doi:10.1038/s41587-018-0009-7 · Cited by 580
Rhythmicity of the intestinal microbiota is regulated by gender and the host circadian clock
Liang, X., Bushman, F. D., & FitzGerald, G. A. (2015) · Proceedings of the National Academy of Sciences · doi:10.1073/pnas.1501305112 · Cited by 578
Gorrie, C. L., Mirčeta, M., Wick, R. R., Edwards, D. J., Thomson, N. R., Strugnell, R. A., Pratt, N. F., Garlick, J. S., Watson, K. M., Pilcher, D. V., et al. (2017) · Clinical Infectious Diseases · doi:10.1093/cid/cix270 · Cited by 576
Microbiota of Human Breast Tissue
Urbaniak, C., Cummins, J., Brackstone, M., Macklaim, J. M., Gloor, G. B., Baban, C. K., Scott, L., O'Hanlon, D. M., Burton, J. P., Francis, K. P., et al. (2014) · Applied and Environmental Microbiology · doi:10.1128/aem.00242-14 · Cited by 552
Du, X., Huang, G., He, S., Yang, Z., Sun, G., Ma, X., Li, N., Zhang, X., Sun, J., Liu, M., et al. (2018) · Nature Genetics · doi:10.1038/s41588-018-0116-x · Cited by 566
Plant cell-surface GIPC sphingolipids sense salt to trigger Ca2+ influx
Jiang, Z., Zhou, X., Tao, M., Yuan, F., Liu, L., Wu, F., Wu, X., Xiang, Y., Niu, Y., Liu, F., et al. (2019) · Nature · doi:10.1038/s41586-019-1449-z · Cited by 550
McNulty, N. P., Yatsunenko, T., Hsiao, A., Faith, J. J., Muegge, B. D., Goodman, A. L., Henrissat, B., Oozeer, R., Cools-Portier, S., Gobert, G., et al. (2011) · Science Translational Medicine · doi:10.1126/scitranslmed.3002701 · Cited by 549
Temporal variability in soil microbial communities across land-use types
Lauber, C. L., Ramirez, K. S., Aanderud, Z., Lennon, J., & Fierer, N. (2013) · The ISME Journal · doi:10.1038/ismej.2013.50 · Cited by 542
Recurrent deletions in the SARS-CoV-2 spike glycoprotein drive antibody escape
McCarthy, K. R., Rennick, L. J., Nambulli, S., Robinson-McCarthy, L. R., Bain, W. G., Haidar, G., & Duprex, W. P. (2021) · Science · doi:10.1126/science.abf6950 · Cited by 535
Mao, S., Zhang, M., Liu, J., & Zhu, W. (2015) · Scientific Reports · doi:10.1038/srep16116 · Cited by 532
Cyclic GMP–AMP signalling protects bacteria against viral infection
Cohen, D., Melamed, S., Millman, A., Shulman, G., Oppenheimer-Shaanan, Y., Kacen, A., Doron, S., Amitai, G., & Sorek, R. (2019) · Nature · doi:10.1038/s41586-019-1605-5 · Cited by 531
Genomes of Subaerial Zygnematophyceae Provide Insights into Land Plant Evolution
Cheng, S., Xian, W., Fu, Y., Marin, B., Keller, J., Wu, T., Sun, W., Li, X., Xu, Y., Zhang, Y., et al. (2019) · Cell · doi:10.1016/j.cell.2019.10.019 · Cited by 524
Santos-Medellín, C., Edwards, J., Liechty, Z., Nguyen, B., & Sundaresan, V. (2017) · mBio · doi:10.1128/mbio.00764-17 · Cited by 520
Unraveling the processes shaping mammalian gut microbiomes over evolutionary time
Groussin, M., Mazel, F., Sanders, J. G., Smillie, C. S., Lavergne, S., Thuiller, W., & Alm, E. J. (2017) · Nature Communications · doi:10.1038/ncomms14319 · Cited by 508
De Palma, G., Lynch, M. D. J., Lu, J., Dang, V. T., Deng, Y., Jury, J., Umeh, G., Miranda, P. M., Pigrau Pastor, M., Sidani, S., et al. (2017) · Science Translational Medicine · doi:10.1126/scitranslmed.aaf6397 · Cited by 505
Miyauchi, S., Kiss, E., Kuo, A., Drula, E., Kohler, A., Sánchez-García, M., Morin, E., Andreopoulos, B., Barry, K. W., Bonito, G., et al. (2020) · Nature Communications · doi:10.1038/s41467-020-18795-w · Cited by 497
Evolutionary Relationships of Wild Hominids Recapitulated by Gut Microbial Communities
Ochman, H., Worobey, M., Kuo, C.-H., Ndjango, J.-B. N., Peeters, M., Hahn, B. H., & Hugenholtz, P. (2010) · PLoS Biology · doi:10.1371/journal.pbio.1000546 · Cited by 494
Marsh, A. J., O'Sullivan, O., Hill, C., Ross, R. P., & Cotter, P. D. (2014) · Food Microbiology · doi:10.1016/j.fm.2013.09.003 · Cited by 485
Human milk microbiota profiles in relation to birthing method, gestation and infant gender
Urbaniak, C., Angelini, M., Gloor, G. B., & Reid, G. (2016) · Microbiome · doi:10.1186/s40168-015-0145-y · Cited by 477
Biodiversity and species competition regulate the resilience of microbial biofilm community
Feng, K., Zhang, Z., Cai, W., Liu, W., Xu, M., Yin, H., Wang, A., He, Z., & Deng, Y. (2017) · Molecular Ecology · doi:10.1111/mec.14356 · Cited by 474
Zhao, Z.-B., He, J.-Z., Geisen, S., Han, L.-L., Wang, J.-T., Shen, J.-P., Wei, W.-X., Fang, Y.-T., Li, P.-P., & Zhang, L.-M. (2019) · Microbiome · doi:10.1186/s40168-019-0647-0 · Cited by 462
Lauber, C. L., Zhou, N., Gordon, J. I., Knight, R., & Fierer, N. (2010) · FEMS Microbiology Letters · doi:10.1111/j.1574-6968.2010.01965.x · Cited by 461
Bowers, R. M., McLetchie, S., Knight, R., & Fierer, N. (2011) · The ISME Journal · doi:10.1038/ismej.2010.167 · Cited by 461
Whole-Genome Sequencing of Bacterial Pathogens: the Future of Nosocomial Outbreak Analysis
Quainoo, S., Coolen, J. P. M., van Hijum, S. A. F. T., Huynen, M. A., Melchers, W. J. G., van Schaik, W., & Wertheim, H. F. L. (2017) · Clinical Microbiology Reviews · doi:10.1128/cmr.00016-17 · Cited by 458
Colonic transit time is related to bacterial metabolism and mucosal turnover in the gut
Roager, H. M., Hansen, L. B. S., Bahl, M. I., Frandsen, H. L., Carvalho, V., Gøbel, R. J., Dalgaard, M. D., Plichta, D. R., Sparholt, M. H., Vestergaard, H., et al. (2016) · Nature Microbiology · doi:10.1038/nmicrobiol.2016.93 · Cited by 449
Airway Microbiota and Pathogen Abundance in Age-Stratified Cystic Fibrosis Patients
Cox, M. J., Allgaier, M., Taylor, B., Baek, M. S., Huang, Y. J., Daly, R. A., Karaoz, U., Andersen, G. L., Brown, R., Fujimura, K. E., et al. (2010) · PLoS ONE · doi:10.1371/journal.pone.0011044 · Cited by 451
PLAZA 4.0: an integrative resource for functional, evolutionary and comparative plant genomics
Van Bel, M., Diels, T., Vancaester, E., Kreft, L., Botzki, A., Van de Peer, Y., Coppens, F., & Vandepoele, K. (2018) · Nucleic Acids Research · doi:10.1093/nar/gkx1002 · Cited by 450
Bacterial Community Mapping of the Mouse Gastrointestinal Tract
Gu, S., Chen, D., Zhang, J.-N., Lv, X., Wang, K., Duan, L.-P., Nie, Y., & Wu, X.-L. (2013) · PLoS ONE · doi:10.1371/journal.pone.0074957 · Cited by 443
Hover, B. M., Kim, S.-H., Katz, M., Charlop-Powers, Z., Owen, J. G., Ternei, M. A., Maniko, J., Estrela, A. B., Molina, H., Park, S., et al. (2018) · Nature Microbiology · doi:10.1038/s41564-018-0110-1 · Cited by 432
Oral Microbiome Composition Reflects Prospective Risk for Esophageal Cancers
Peters, B. A., Wu, J., Pei, Z., Yang, L., Purdue, M. P., Freedman, N. D., Jacobs, E. J., Gapstur, S. M., Hayes, R. B., & Ahn, J. (2017) · Cancer Research · doi:10.1158/0008-5472.can-17-1296 · Cited by 423
Ramirez, K. S., Leff, J. W., Barberán, A., Bates, S. T., Betley, J., Crowther, T. W., Kelly, E. F., Oldfield, E. E., Shaw, E. A., Steenbock, C., et al. (2014) · Proceedings of the Royal Society B: Biological Sciences · doi:10.1098/rspb.2014.1988 · Cited by 423
Effect of warming and drought on grassland microbial communities
Sheik, C. S., Beasley, W. H., Elshahed, M. S., Zhou, X., Luo, Y., & Krumholz, L. R. (2011) · The ISME Journal · doi:10.1038/ismej.2011.32 · Cited by 421
Abreu, N. A., Nagalingam, N. A., Song, Y., Roediger, F. C., Pletcher, S. D., Goldberg, A. N., & Lynch, S. V. (2012) · Science Translational Medicine · doi:10.1126/scitranslmed.3003783 · Cited by 415
“The 16S rRNA sequences of significant taxa were used to construct a neighbor-joining with nearestneighbor interchange tree with FastTree (48), which was annotated with the Interactive Tree of Life [http://itol.embl.de/; (49)].”
MethodInfluentialPjevac, P., Schauberger, C., Poghosyan, L., Herbold, C. W., van Kessel, M. A. H. J., Daebeler, A., Steinberger, M., Jetten, M. S. M., Lücker, S., Wagner, M., et al. (2017) · Frontiers in Microbiology · doi:10.3389/fmicb.2017.01508 · Cited by 415
Waite, D. W., Vanwonterghem, I., Rinke, C., Parks, D. H., Zhang, Y., Takai, K., Sievert, S. M., Simon, J., Campbell, B. J., Hanson, T. E., et al. (2017) · Frontiers in Microbiology · doi:10.3389/fmicb.2017.00682 · Cited by 414
Highly pathogenic avian influenza A (H5N1) in marine mammals and seabirds in Peru
Leguia, M., Garcia-Glaessner, A., Muñoz-Saavedra, B., Juarez, D., Barrera, P., Calvo-Mac, C., Jara, J., Silva, W., Ploog, K., Amaro, L., et al. (2023) · Nature Communications · doi:10.1038/s41467-023-41182-0 · Cited by 414
Analysis of the chronic wound microbiota of 2,963 patients by 16S rDNA pyrosequencing
Wolcott, R. D., Hanson, J. D., Rees, E. J., Koenig, L. D., Phillips, C. D., Wolcott, R. A., Cox, S. B., & White, J. S. (2016) · Wound Repair and Regeneration · doi:10.1111/wrr.12370 · Cited by 414
Zhou, J., Guan, D., Zhou, B., Zhao, B., Ma, M., Qin, J., Jiang, X., Chen, S., Cao, F., Shen, D., et al. (2015) · Soil Biology and Biochemistry · doi:10.1016/j.soilbio.2015.07.005 · Cited by 411
A heritable subset of the core rumen microbiome dictates dairy cow productivity and emissions
Wallace, R. J., Sasson, G., Garnsworthy, P. C., Tapio, I., Gregson, E., Bani, P., Huhtanen, P., Bayat, A. R., Strozzi, F., Biscarini, F., et al. (2019) · Science Advances · doi:10.1126/sciadv.aav8391 · Cited by 410
Parthasarathy, G., Chen, J., Chen, X., Chia, N., O'Connor, H. M., Wolf, P. G., Gaskins, H. R., & Bharucha, A. E. (2016) · Gastroenterology · doi:10.1053/j.gastro.2015.10.005 · Cited by 396
SILVA, RDP, Greengenes, NCBI and OTT — how do these taxonomies compare?
Balvočiūtė, M., & Huson, D. H. (2017) · BMC Genomics · doi:10.1186/s12864-017-3501-4 · Cited by 405
Metadata
- Authors
- Price, M. N., Dehal, P. S., & Arkin, A. P.
- Affiliations
- Lawrence Berkeley National Laboratory (US)
- Corresponding author
- Price, M. N.
- Dehal, P. S.
- Arkin, A. P.
- Venue
- Molecular Biology and Evolution
- Publisher
- Oxford University Press (OUP)
- Published
- 2009-04-17
- Volume
- 26
- Issue
- 7
- Pages
- 1641-1650
- ISSN
- 0737-4038 (ISSN-L)
- 1537-1719
- PMC
- PMC2693737
- OpenAlex
- W2105329815
- Semantic Scholar
- 9d054caaec9e59a15b30845f81d31dcf95594b87
- Cited by
- 5,602
- References
- 42
- Citations by year
- 2026: 460 · 2025: 573 · 2024: 638 · 2023: 571 · 2022: 496 · 2021: 511 · 2020: 503 · 2019: 393 · 2018: 314 · 2017: 279 · 2016: 227 · 2015: 182 · 2014: 143 · 2013: 112 · 2012: 77
- FWCI
- 25.69
- Type
- journal article
- Language
- en
- Open access
- green
- www.ncbi.nlm.nih.gov
- Licence
- cc-by-nc
- Locations
- Molecular Biology and Evolution (publishedVersion)
- PubMed Central (publishedVersion, cc-by-nc)
- PubMed (publishedVersion)
- OSTI OAI (U.S. Department of Energy Office of Scientific and Technical Information) (submittedVersion)
- University of North Texas Digital Library (University of North Texas) (submittedVersion)
- eScholarship (California Digital Library) (submittedVersion)
- Lawrence Berkeley National Laboratory
- Funders
- U.S. Department of Energy (-AC02-05CH11231, 05CH11231, DE AC02 05CH11231, DE-AC02-)
- Topics
- Life Sciences › Biochemistry, Genetics and Molecular Biology › Molecular Biology › Genomics and Phylogenetic Studies
- Life Sciences › Biochemistry, Genetics and Molecular Biology › Molecular Biology › RNA and protein synthesis mechanisms
- Life Sciences › Biochemistry, Genetics and Molecular Biology › Molecular Biology › Fractal and DNA sequence analysis
- Keywords
- FastTree, phylogenetic tree construction, minimum evolution, sequence profiles, neighbor-joining, 16S rRNA, nearest neighbor interchange
- MeSH terms
- Algorithms, Models, Genetic, Phylogeny, Proteins, Sequence Alignment, Evolution, Molecular
About these checks
Registry, retraction, Cites and statistics results are computed, not judged, with one exception: a printed reference that no index lists is read once by a model before it counts as a citation error. Claims are extracted by a model and kept only when their quote appears verbatim in the text; each cited source is then checked, with a model’s help, for whether it says what the claim relies on. Those verdicts can be wrong — read the claim’s quote and the cited source before relying on one.
Statistics and arithmetic are recomputed, not judged.
Confidence bands are shown only for fields calibrated on our annotated test set. None is calibrated yet, so no band is shown.
What counts as a claim ›How we measure confidence ›How we check this ›
Are you an author, or do you see a problem with this page? Request a review
Data sources
Bibliographic data: Semantic Scholar, OpenAlex, Crossref.
Contains information from the Semantic Scholar Academic Graph Datasets, made available under the ODC Attribution License (ODC-BY 1.0).
Semantic Scholar’s data is described in: Kinney, R., et al. (2023). The Semantic Scholar Open Data Platform. arXiv:2301.10140.
