

The DOI matches its Crossref record; 2 of the 2 references it cites were found in a registry or an index.
deepTools2: a next generation web server for deep-sequencing data analysis
Open accessAbstract
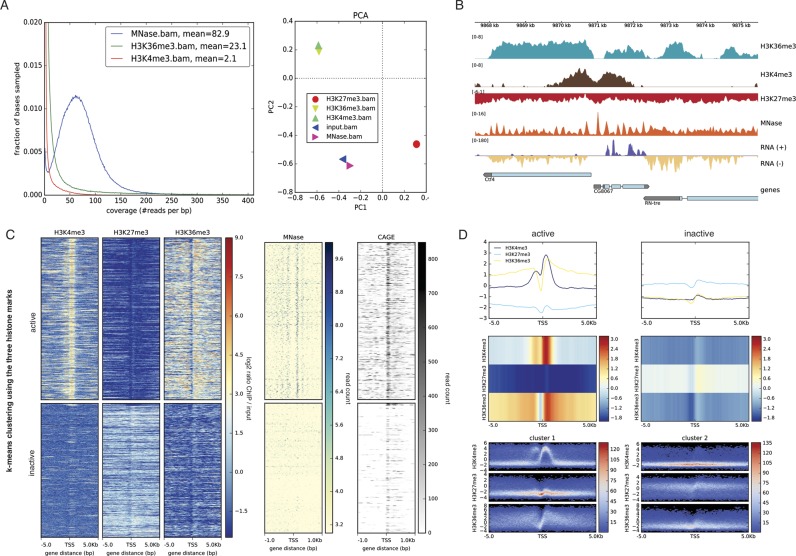
We present an update to our Galaxy-based web server for processing and visualizing deeply sequenced data. Its core tool set, deepTools, allows users to perform complete bioinformatic workflows ranging from quality controls and normalizations of aligned reads to integrative analyses, including clustering and visualization approaches. Since we first described our deepTools Galaxy server in 2014, we have implemented new solutions for many requests from the community and our users. Here, we introduce significant enhancements and new tools to further improve data visualization and interpretation. deepTools continue to be open to all users and freely available as a web service at deeptools.ie-freiburg.mpg.de The new deepTools2 suite can be easily deployed within any Galaxy framework via the toolshed repository, and we also provide source code for command line usage under Linux and Mac OS X. A public and documented API for access to deepTools functionality is also available.
Overview
The claims and statistics of this paper haven’t been checked yet.
Run the check — free, no account needed. It reads the open-access text and checks the sources it cites.
Integrity signals
Registry
Cites
Statistics
Figures
Verification
Claims the paper makes
The claims and statistics of this paper haven’t been checked yet.
Run the check — free, no account needed. It reads the open-access text and checks the sources it cites.
Claims other papers make about this one
Each is checked against this paper’s own text: does it say what the citing paper says it does?
The cited source says what the claim attributes to it.
In the citing paper
“Bigwigs were generated with the bamCoverage function from deepTools (82) with scaling factors calculated using the formula (human reads in input) / (mouse reads in input) / (human reads in ChIP) x 15000000 (83, 84).”
From Synergy between regulatory elements can render cohesin dispensable for distal enhancer function (2026) · cites this paper as [82]
The cited source says what the claim attributes to it.
In the citing paper
“For genome-wide profiles and peak overlaps, peaks were filtered for a minimum signal of 1000 and then generated using the plotProfile function in deepTools2 (82) centered on peaks called from control (DMSO) cells and separated by replicate.”
From Synergy between regulatory elements can render cohesin dispensable for distal enhancer function (2026) · cites this paper as [82]
Self-check
Percentages, sums and reported differences re-computed from the paper’s own numbers.
The self-check needs the paper’s full text.
Citations
Cites
The Sequence Alignment/Map format and SAMtools
Li, H., Handsaker, B., Wysoker, A., Fennell, T., Ruan, J., Homer, N., Marth, G., Abecasis, G., Durbin, R., & 1000 Genome Project Data Processing Subgroup (2009) · Bioinformatics · doi:10.1093/bioinformatics/btp352 · Cited by 62,041
Integrative analysis of 111 reference human epigenomes
Roadmap Epigenomics Consortium, Kundaje, A., Meuleman, W., Ernst, J., Bilenky, M., Yen, A., Heravi-Moussavi, A., Kheradpour, P., Zhang, Z., Wang, J., et al. (2015) · Nature · doi:10.1038/nature14248 · Cited by 6,368
Research works printed but not linked: 16
- 10.1111/cgf.12096 · DOI
- 10.1093/bioinformatics/btu775 · DOI
- 10.1016/j.molcel.2010.05.004 · DOI · Paper page
- 10.1186/1471-2164-15-284 · DOI
- Ramírez F. Dündar F. Diehl S. Grüning B.A. Manke T. deepTools: a flexible platform for exploring deep-sequencing data. 2014;42:W187-W191. · DOI · Paper page
- Hillman-Jackson J. Clements D. Blankenberg D. Taylor J. Nekrutenko A.Galaxy Team . Using Galaxy to perform large-scale interactive data analyses. Curr. Protoc. Bioinformatics 2012. Chapter 10, Unit 10.5–10.5.47. · DOI
- 10.1093/nar/gkv1275 · DOI
- 10.1038/nprot.2012.101 · DOI
- 10.1101/gr.136184.111 · DOI · Paper page
- 10.1186/gb4161 · DOI
- 10.1038/nature11247 · DOI · Paper page
- 10.1016/j.cell.2015.04.044 · DOI · Paper page
- 10.1101/gad.201327.112 · DOI · Paper page
- 10.1038/nmeth.1985 · DOI
- 10.1016/j.molcel.2015.08.024 · DOI
- 10.1016/j.molcel.2013.12.029 · DOI
Cited by
Sorted by citations
Comprehensive Integration of Single-Cell Data
Stuart, T., Butler, A., Hoffman, P., Hafemeister, C., Papalexi, E., Mauck, W. M., Hao, Y., Stoeckius, M., Smibert, P., & Satija, R. (2019) · Cell · doi:10.1016/j.cell.2019.05.031 · Cited by 15,453
The Galaxy platform for accessible, reproducible and collaborative biomedical analyses: 2018 update
Afgan, E., Baker, D., Batut, B., van den Beek, M., Bouvier, D., Čech, M., Chilton, J., Clements, D., Coraor, N., Grüning, B. A., et al. (2018) · Nucleic Acids Research · doi:10.1093/nar/gky379 · Cited by 3,662
Self-citationImpact of cytosine methylation on DNA binding specificities of human transcription factors
Yin, Y., Morgunova, E., Jolma, A., Kaasinen, E., Sahu, B., Khund-Sayeed, S., Das, P. K., Kivioja, T., Dave, K., Zhong, F., et al. (2017) · Science · doi:10.1126/science.aaj2239 · Cited by 1,257
TOX is a critical regulator of tumour-specific T cell differentiation
Scott, A. C., Dündar, F., Zumbo, P., Chandran, S. S., Klebanoff, C. A., Shakiba, M., Trivedi, P., Menocal, L., Appleby, H., Camara, S., et al. (2019) · Nature · doi:10.1038/s41586-019-1324-y · Cited by 1,106
Self-citationA Single-Cell Atlas of In Vivo Mammalian Chromatin Accessibility
Cusanovich, D. A., Hill, A. J., Aghamirzaie, D., Daza, R. M., Pliner, H. A., Berletch, J. B., Filippova, G. N., Huang, X., Christiansen, L., DeWitt, W. S., et al. (2018) · Cell · doi:10.1016/j.cell.2018.06.052 · Cited by 759
Comparative cellular analysis of motor cortex in human, marmoset and mouse
Bakken, T. E., Jorstad, N. L., Hu, Q., Lake, B. B., Tian, W., Kalmbach, B. E., Crow, M., Hodge, R. D., Krienen, F. M., Sorensen, S. A., et al. (2021) · Nature · doi:10.1038/s41586-021-03465-8 · Cited by 812
Genome-wide programmable transcriptional memory by CRISPR-based epigenome editing
Nuñez, J. K., Chen, J., Pommier, G. C., Cogan, J. Z., Replogle, J. M., Adriaens, C., Ramadoss, G. N., Shi, Q., Hung, K. L., Samelson, A. J., et al. (2021) · Cell · doi:10.1016/j.cell.2021.03.025 · Cited by 760
Decoding myofibroblast origins in human kidney fibrosis
Kuppe, C., Ibrahim, M. M., Kranz, J., Zhang, X., Ziegler, S., Perales-Patón, J., Jansen, J., Reimer, K. C., Smith, J. R., Dobie, R., et al. (2021) · Nature · doi:10.1038/s41586-020-2941-1 · Cited by 769
Loss of epigenetic information as a cause of mammalian aging
Yang, J.-H., Hayano, M., Griffin, P. T., Amorim, J. A., Bonkowski, M. S., Apostolides, J. K., Salfati, E. L., Blanchette, M., Munding, E. M., Bhakta, M., et al. (2023) · Cell · doi:10.1016/j.cell.2022.12.027 · Cited by 643
Thiol-linked alkylation for the metabolic sequencing of RNA
Herzog, V. A., Reichholf, B., Neumann, T., Rescheneder, P., Bhat, P., Burkard, T. R., Wlotzka, W., von Haeseler, A., Zuber, J., & Ameres, S. L. (2017) · doi:10.1101/177642 · Cited by 622
CTCF and cohesin regulate chromatin loop stability with distinct dynamics
Hansen, A. S., Pustova, I., Cattoglio, C., Tjian, R., & Darzacq, X. (2017) · eLife · doi:10.7554/elife.25776 · Cited by 613
Kobayashi, Y., Tata, A., Konkimalla, A., Katsura, H., Lee, R. F., Ou, J., Banovich, N. E., Kropski, J. A., & Tata, P. R. (2020) · Nature Cell Biology · doi:10.1038/s41556-020-0542-8 · Cited by 559
Kurppa, K. J., Liu, Y., To, C., Zhang, T., Fan, M., Vajdi, A., Knelson, E. H., Xie, Y., Lim, K., Cejas, P., et al. (2020) · Cancer Cell · doi:10.1016/j.ccell.2019.12.006 · Cited by 475
Single-cell CUT&Tag profiles histone modifications and transcription factors in complex tissues
Bartosovic, M., Kabbe, M., & Castelo-Branco, G. (2021) · Nature Biotechnology · doi:10.1038/s41587-021-00869-9 · Cited by 483
Direct promoter repression by BCL11A controls the fetal to adult hemoglobin switch
Liu, N., Hargreaves, V. V., Zhu, Q., Kurland, J. V., Hong, J., Kim, W., Sher, F., Macias-Trevino, C., Rogers, J. M., Kurita, R., et al. (2018) · Cell · doi:10.1016/j.cell.2018.03.016 · Cited by 478
From telomere to telomere: The transcriptional and epigenetic state of human repeat elements
Hoyt, S. J., Storer, J. M., Hartley, G. A., Grady, P. G. S., Gershman, A., de Lima, L. G., Limouse, C., Halabian, R., Wojenski, L., Rodriguez, M., et al. (2022) · Science · doi:10.1126/science.abk3112 · Cited by 411
Preissl, S., Fang, R., Huang, H., Zhao, Y., Raviram, R., Gorkin, D. U., Zhang, Y., Sos, B. C., Afzal, V., Dickel, D. E., et al. (2018) · Nature Neuroscience · doi:10.1038/s41593-018-0079-3 · Cited by 332
Hypoxia induces rapid changes to histone methylation and reprograms chromatin
Batie, M., Frost, J., Frost, M., Wilson, J. W., Schofield, P., & Rocha, S. (2019) · Science · doi:10.1126/science.aau5870 · Cited by 385
Mitochondrial Reprogramming Underlies Resistance to BCL-2 Inhibition in Lymphoid Malignancies
Guièze, R., Liu, V. M., Rosebrock, D., Jourdain, A. A., Hernández-Sánchez, M., Martinez Zurita, A., Sun, J., Ten Hacken, E., Baranowski, K., Thompson, P. A., et al. (2019) · Cancer Cell · doi:10.1016/j.ccell.2019.08.005 · Cited by 361
Acetate Promotes T Cell Effector Function during Glucose Restriction
Qiu, J., Villa, M., Sanin, D. E., Buck, M. D., O’Sullivan, D., Ching, R., Matsushita, M., Grzes, K. M., Winkler, F., Chang, C.-H., et al. (2019) · Cell Reports · doi:10.1016/j.celrep.2019.04.022 · Cited by 342
MCM2 promotes symmetric inheritance of modified histones during DNA replication
Petryk, N., Dalby, M., Wenger, A., Stromme, C. B., Strandsby, A., Andersson, R., & Groth, A. (2018) · Science · doi:10.1126/science.aau0294 · Cited by 294
Singh, N., Lee, Y. G., Shestova, O., Ravikumar, P., Hayer, K. E., Hong, S. J., Lu, X. M., Pajarillo, R., Agarwal, S., Kuramitsu, S., et al. (2020) · Cancer Discovery · doi:10.1158/2159-8290.cd-19-0813 · Cited by 295
A bacterial bile acid metabolite modulates Treg activity through the nuclear hormone receptor NR4A1
Li, W., Hang, S., Fang, Y., Bae, S., Zhang, Y., Zhang, M., Wang, G., McCurry, M. D., Bae, M., Paik, D., et al. (2021) · Cell Host & Microbe · doi:10.1016/j.chom.2021.07.013 · Cited by 306
Epigenetic patterns in a complete human genome
Gershman, A., Sauria, M. E. G., Guitart, X., Vollger, M. R., Hook, P. W., Hoyt, S. J., Jain, M., Shumate, A., Razaghi, R., Koren, S., et al. (2022) · Science · doi:10.1126/science.abj5089 · Cited by 297
p21 produces a bioactive secretome that places stressed cells under immunosurveillance
Sturmlechner, I., Zhang, C., Sine, C. C., van Deursen, E.-J., Jeganathan, K. B., Hamada, N., Grasic, J., Friedman, D., Stutchman, J. T., Can, I., et al. (2021) · Science · doi:10.1126/science.abb3420 · Cited by 295
“0 (48) by first normalizing each ChIP-seq sample and its matching input to cpm (counts per million mapped reads) and then subtracting the input signal from each ChIP sample.”
MethodSchafer, S. T., Paquola, A. C. M., Stern, S., Gosselin, D., Ku, M., Pena, M., Kuret, T. J. M., Liyanage, M., Mansour, A. A., Jaeger, B. N., et al. (2019) · Nature Neuroscience · doi:10.1038/s41593-018-0295-x · Cited by 288
Wang, X., Prager, B. C., Wu, Q., Kim, L. J. Y., Gimple, R. C., Shi, Y., Yang, K., Morton, A. R., Zhou, W., Zhu, Z., et al. (2018) · Cell Stem Cell · doi:10.1016/j.stem.2018.03.011 · Cited by 285
Distinct structural classes of activating FOXA1 alterations in advanced prostate cancer
Parolia, A., Cieslik, M., Chu, S.-C., Xiao, L., Ouchi, T., Zhang, Y., Wang, X., Vats, P., Cao, X., Pitchiaya, S., et al. (2019) · Nature · doi:10.1038/s41586-019-1347-4 · Cited by 284
Methods for ChIP-seq analysis: A practical workflow and advanced applications
Nakato, R., & Sakata, T. (2021) · Methods · doi:10.1016/j.ymeth.2020.03.005 · Cited by 267
Distinct Classes of Chromatin Loops Revealed by Deletion of an RNA-Binding Region in CTCF
Hansen, A. S., Hsieh, T.-H. S., Cattoglio, C., Pustova, I., Saldaña-Meyer, R., Reinberg, D., Darzacq, X., & Tjian, R. (2019) · Molecular Cell · doi:10.1016/j.molcel.2019.07.039 · Cited by 279
KDM5B promotes immune evasion by recruiting SETDB1 to silence retroelements
Zhang, S.-M., Cai, W. L., Liu, X., Thakral, D., Luo, J., Chan, L. H., McGeary, M. K., Song, E., Blenman, K. R. M., Micevic, G., et al. (2021) · Nature · doi:10.1038/s41586-021-03994-2 · Cited by 272
Transcriptional and epigenomic landscapes of CNS and non-CNS vascular endothelial cells
Sabbagh, M. F., Heng, J. S., Luo, C., Castanon, R. G., Nery, J. R., Rattner, A., Goff, L. A., Ecker, J. R., & Nathans, J. (2018) · eLife · doi:10.7554/elife.36187 · Cited by 245
Cameron, A. M., Castoldi, A., Sanin, D. E., Flachsmann, L. J., Field, C. S., Puleston, D. J., Kyle, R. L., Patterson, A. E., Hässler, F., Buescher, J. M., et al. (2019) · Nature Immunology · doi:10.1038/s41590-019-0336-y · Cited by 269
Disease-Associated Short Tandem Repeats Co-localize with Chromatin Domain Boundaries
Sun, J. H., Zhou, L., Emerson, D. J., Phyo, S. A., Titus, K. R., Gong, W., Gilgenast, T. G., Beagan, J. A., Davidson, B. L., Tassone, F., et al. (2018) · Cell · doi:10.1016/j.cell.2018.08.005 · Cited by 249
“…matrix balancing Imakaev et al., 2012 https://github.com/hiclib/iced MEME Suite Bailey et al., 2009 http://meme-suite.org Quantile normalization Bolstad et al., 2003 https://www.ncbi.nlm.nih.gov/pubmed/ 12538238 deepTools Ramı́rez et al., 2016 https://github.com/deeptools/deepTools”
KMT2D Deficiency Impairs Super-Enhancers to Confer a Glycolytic Vulnerability in Lung Cancer
Alam, H., Tang, M., Maitituoheti, M., Dhar, S. S., Kumar, M., Han, C. Y., Ambati, C. R., Amin, S. B., Gu, B., Chen, T.-Y., et al. (2020) · Cancer Cell · doi:10.1016/j.ccell.2020.03.005 · Cited by 243
Tchieu, J., Calder, E. L., Guttikonda, S. R., Gutzwiller, E. M., Aromolaran, K. A., Steinbeck, J. A., Goldstein, P. A., & Studer, L. (2019) · Nature Biotechnology · doi:10.1038/s41587-019-0035-0 · Cited by 231
Neuronal enhancers are hotspots for DNA single-strand break repair
Wu, W., Kargbo-Hill, S. E., Nathan, W. J., Paiano, J., Callen, E., Wang, D., Shinoda, K., van Wietmarschen, N., Colón-Mercado, J. M., Zong, D., et al. (2021) · Nature · doi:10.1038/s41586-021-03468-5 · Cited by 223
A general approach for detecting expressed mutations in AML cells using single cell RNA-sequencing
Petti, A. A., Williams, S. R., Miller, C. A., Fiddes, I. T., Srivatsan, S. N., Chen, D. Y., Fronick, C. C., Fulton, R. S., Church, D. M., & Ley, T. J. (2019) · Nature Communications · doi:10.1038/s41467-019-11591-1 · Cited by 215
Smooth Muscle Cell Reprogramming in Aortic Aneurysms
Chen, P.-Y., Qin, L., Li, G., Malagon-Lopez, J., Wang, Z., Bergaya, S., Gujja, S., Caulk, A. W., Murtada, S.-I., Zhang, X., et al. (2020) · Cell Stem Cell · doi:10.1016/j.stem.2020.02.013 · Cited by 214
CoBATCH for High-Throughput Single-Cell Epigenomic Profiling
Wang, Q., Xiong, H., Ai, S., Yu, X., Liu, Y., Zhang, J., & He, A. (2019) · Molecular Cell · doi:10.1016/j.molcel.2019.07.015 · Cited by 213
Super-enhancers include classical enhancers and facilitators to fully activate gene expression
Blayney, J. W., Francis, H., Rampasekova, A., Camellato, B., Mitchell, L., Stolper, R., Cornell, L., Babbs, C., Boeke, J. D., Higgs, D. R., et al. (2023) · Cell · doi:10.1016/j.cell.2023.11.030 · Cited by 196
A TCF4-dependent gene regulatory network confers resistance to immunotherapy in melanoma
Pozniak, J., Pedri, D., Landeloos, E., Van Herck, Y., Antoranz, A., Vanwynsberghe, L., Nowosad, A., Roda, N., Makhzami, S., Bervoets, G., et al. (2024) · Cell · doi:10.1016/j.cell.2023.11.037 · Cited by 199
Peneder, P., Stütz, A. M., Surdez, D., Krumbholz, M., Semper, S., Chicard, M., Sheffield, N. C., Pierron, G., Lapouble, E., Tötzl, M., et al. (2021) · Nature Communications · doi:10.1038/s41467-021-23445-w · Cited by 200
Spatially resolved epigenomic profiling of single cells in complex tissues
Lu, T., Ang, C. E., & Zhuang, X. (2022) · Cell · doi:10.1016/j.cell.2022.09.035 · Cited by 197
Co-transcriptional splicing regulates 3′ end cleavage during mammalian erythropoiesis
Reimer, K. A., Mimoso, C. A., Adelman, K., & Neugebauer, K. M. (2021) · Molecular Cell · doi:10.1016/j.molcel.2020.12.018 · Cited by 180
Autophagy Regulation of Metabolism Is Required for CD8+ T Cell Anti-tumor Immunity
DeVorkin, L., Pavey, N., Carleton, G., Comber, A., Ho, C., Lim, J., McNamara, E., Huang, H., Kim, P., Zacharias, L. G., et al. (2019) · Cell Reports · doi:10.1016/j.celrep.2019.03.037 · Cited by 185
Traxler, L., Herdy, J. R., Stefanoni, D., Eichhorner, S., Pelucchi, S., Szücs, A., Santagostino, A., Kim, Y., Agarwal, R. K., Schlachetzki, J. C. M., et al. (2022) · Cell Metabolism · doi:10.1016/j.cmet.2022.07.014 · Cited by 179
The transcription factor ZEB2 drives the formation of age-associated B cells
Dai, D., Gu, S., Han, X., Ding, H., Jiang, Y., Zhang, X., Yao, C., Hong, S., Zhang, J., Shen, Y., et al. (2024) · Science · doi:10.1126/science.adf8531 · Cited by 178
FOXA2 drives lineage plasticity and KIT pathway activation in neuroendocrine prostate cancer
Han, M., Li, F., Zhang, Y., Dai, P., He, J., Li, Y., Zhu, Y., Zheng, J., Huang, H., Bai, F., et al. (2022) · Cancer Cell · doi:10.1016/j.ccell.2022.10.011 · Cited by 166
A comparative atlas of single-cell chromatin accessibility in the human brain
Li, Y. E., Preissl, S., Miller, M., Johnson, N. D., Wang, Z., Jiao, H., Zhu, C., Wang, Z., Xie, Y., Poirion, O., et al. (2023) · Science · doi:10.1126/science.adf7044 · Cited by 173
Decoding gene regulation in the fly brain
Janssens, J., Aibar, S., Taskiran, I. I., Ismail, J. N., Spanier, K. I., Bravo González-Blas, C., Quan, X. J., Papasokrati, D., Hulselmans, G., Makhzami, S., et al. (2021) · doi:10.1101/2021.08.11.454937 · Cited by 170
Lio, C.-W., Zhang, J., González-Avalos, E., Hogan, P. G., Chang, X., & Rao, A. (2016) · eLife · doi:10.7554/elife.18290 · Cited by 170
Decoding gene regulation in the fly brain
Janssens, J., Aibar, S., Taskiran, I. I., Ismail, J. N., Gomez, A. E., Aughey, G., Spanier, K. I., De Rop, F. V., González-Blas, C. B., Dionne, M., et al. (2022) · Nature · doi:10.1038/s41586-021-04262-z · Cited by 170
Targeted degradation of the enhancer lysine acetyltransferases CBP and p300
Vannam, R., Sayilgan, J., Ojeda, S., Karakyriakou, B., Hu, E., Kreuzer, J., Morris, R., Herrera Lopez, X. I., Rai, S., Haas, W., et al. (2021) · Cell Chemical Biology · doi:10.1016/j.chembiol.2020.12.004 · Cited by 177
The Polycomb-Dependent Epigenome Controls β Cell Dysfunction, Dedifferentiation, and Diabetes
Lu, T. T.-H., Heyne, S., Dror, E., Casas, E., Leonhardt, L., Boenke, T., Yang, C.-H., Sagar, Arrigoni, L., Dalgaard, K., et al. (2018) · Cell Metabolism · doi:10.1016/j.cmet.2018.04.013 · Cited by 151
Self-citationImmediate and deferred epigenomic signatures of in vivo neuronal activation in mouse hippocampus
Fernandez-Albert, J., Lipinski, M., Lopez-Cascales, M. T., Rowley, M. J., Martin-Gonzalez, A. M., del Blanco, B., Corces, V. G., & Barco, A. (2019) · Nature Neuroscience · doi:10.1038/s41593-019-0476-2 · Cited by 166
Hi-C analyses with GENOVA: a case study with cohesin variants
van der Weide, R. H., van den Brand, T., Haarhuis, J. H. I., Teunissen, H., Rowland, B. D., & de Wit, E. (2021) · NAR Genomics and Bioinformatics · doi:10.1093/nargab/lqab040 · Cited by 161
Single-cell ATAC sequencing analysis: From data preprocessing to hypothesis generation
Baek, S., & Lee, I. (2020) · Computational and Structural Biotechnology Journal · doi:10.1016/j.csbj.2020.06.012 · Cited by 151
Beagan, J. A., Pastuzyn, E. D., Fernandez, L. R., Guo, M. H., Feng, K., Titus, K. R., Chandrashekar, H., Shepherd, J. D., & Phillips-Cremins, J. E. (2020) · Nature Neuroscience · doi:10.1038/s41593-020-0634-6 · Cited by 143
Adeno-to-squamous transition drives resistance to KRAS inhibition in LKB1 mutant lung cancer
Tong, X., Patel, A. S., Kim, E., Li, H., Chen, Y., Li, S., Liu, S., Dilly, J., Kapner, K. S., Zhang, N., et al. (2024) · Cancer Cell · doi:10.1016/j.ccell.2024.01.012 · Cited by 142
Profiling chromatin states using single-cell itChIP-seq
Ai, S., Xiong, H., Li, C. C., Luo, Y., Shi, Q., Liu, Y., Yu, X., Li, C., & He, A. (2019) · Nature Cell Biology · doi:10.1038/s41556-019-0383-5 · Cited by 140
Zou, M., Ke, Q., Nie, Q., Qi, R., Zhu, X., Liu, W., Hu, X., Sun, Q., Fu, J.-L., Tang, X., et al. (2022) · Cell Death & Differentiation · doi:10.1038/s41418-022-00967-4 · Cited by 138
MYC Recruits SPT5 to RNA Polymerase II to Promote Processive Transcription Elongation
Baluapuri, A., Hofstetter, J., Dudvarski Stankovic, N., Endres, T., Bhandare, P., Vos, S. M., Adhikari, B., Schwarz, J. D., Narain, A., Vogt, M., et al. (2019) · Molecular Cell · doi:10.1016/j.molcel.2019.02.031 · Cited by 138
Kelly, R. D. W., Chandru, A., Watson, P. J., Song, Y., Blades, M., Robertson, N. S., Jamieson, A. G., Schwabe, J. W. R., & Cowley, S. M. (2018) · Scientific Reports · doi:10.1038/s41598-018-32927-9 · Cited by 138
Highly efficient and rapid generation of human pluripotent stem cells by chemical reprogramming.
Liuyang, S., Wang, G., Wang, Y., He, H., Lyu, Y., Cheng, L., Yang, Z., Guan, J., Fu, Y., Zhu, J., et al. (2023) · Cell Stem Cell · doi:10.1016/j.stem.2023.02.008 · Cited by 136
Li, L., Cui, L., Lin, P., Liu, Z., Bao, S., Ma, X., Nan, H., Zhu, W., Cen, J., Mao, Y., et al. (2023) · Cell Stem Cell · doi:10.1016/j.stem.2023.01.009 · Cited by 134
Poetsch, A. R., Boulton, S. J., & Luscombe, N. M. (2018) · Genome Biology · doi:10.1186/s13059-018-1582-2 · Cited by 132
Arruabarrena-Aristorena, A., Maag, J. L. V., Kittane, S., Cai, Y., Karthaus, W. R., Ladewig, E., Park, J., Kannan, S., Ferrando, L., Cocco, E., et al. (2020) · Cancer Cell · doi:10.1016/j.ccell.2020.08.003 · Cited by 130
Loubiere, V., Papadopoulos, G. L., Szabo, Q., Martinez, A.-M., & Cavalli, G. (2020) · Science Advances · doi:10.1126/sciadv.aax4001 · Cited by 126
FBXO44 promotes DNA replication-coupled repetitive element silencing in cancer cells
Shen, J. Z., Qiu, Z., Wu, Q., Finlay, D., Garcia, G., Sun, D., Rantala, J., Barshop, W., Hope, J. L., Gimple, R. C., et al. (2021) · Cell · doi:10.1016/j.cell.2020.11.042 · Cited by 113
Lau, S.-F., Chen, C., Fu, W.-Y., Qu, J. Y., Cheung, T. H., Fu, A. K. Y., & Ip, N. Y. (2020) · Cell Reports · doi:10.1016/j.celrep.2020.107530 · Cited by 114
Koester, J., Miroshnikova, Y. A., Ghatak, S., Chacón-Martínez, C. A., Morgner, J., Li, X., Atanassov, I., Altmüller, J., Birk, D. E., Koch, M., et al. (2021) · Nature Cell Biology · doi:10.1038/s41556-021-00705-x · Cited by 117
Cross-species analysis of enhancer logic using deep learning
Minnoye, L., Taskiran, I. I., Mauduit, D., Fazio, M., Van Aerschot, L., Hulselmans, G., Christiaens, V., Makhzami, S., Seltenhammer, M., Karras, P., et al. (2020) · Genome Research · doi:10.1101/gr.260844.120 · Cited by 116
Active DNA demethylation promotes cell fate specification and the DNA damage response
Wang, D., Wu, W., Callen, E., Pavani, R., Zolnerowich, N., Kodali, S., Zong, D., Wong, N., Noriega, S., Nathan, W. J., et al. (2022) · Science · doi:10.1126/science.add9838 · Cited by 113
Gillespie, M. A., Palii, C. G., Sanchez-Taltavull, D., Shannon, P., Longabaugh, W. J. R., Downes, D. J., Sivaraman, K., Espinoza, H. M., Hughes, J. R., Price, N. D., et al. (2020) · Molecular Cell · doi:10.1016/j.molcel.2020.03.031 · Cited by 110
Large-scale chromatin reorganization reactivates placenta-specific genes that drive cellular aging
Liu, Z., Ji, Q., Ren, J., Yan, P., Wu, Z., Wang, S., Sun, L., Wang, Z., Li, J., Sun, G., et al. (2022) · Developmental Cell · doi:10.1016/j.devcel.2022.05.004 · Cited by 109
A tissue injury sensing and repair pathway distinct from host pathogen defense
Liu, S., Hur, Y. H., Cai, X., Cong, Q., Yang, Y., Xu, C., Bilate, A. M., Gonzales, K. A. U., Parigi, S. M., Cowley, C. J., et al. (2023) · Cell · doi:10.1016/j.cell.2023.03.031 · Cited by 108
Down-syndrome-induced senescence disrupts the nuclear architecture of neural progenitors
Meharena, H. S., Marco, A., Dileep, V., Lockshin, E. R., Akatsu, G. Y., Mullahoo, J., Watson, L. A., Ko, T., Guerin, L. N., Abdurrob, F., et al. (2022) · Cell Stem Cell · doi:10.1016/j.stem.2021.12.002 · Cited by 92
Glioblastoma epigenome profiling identifies SOX10 as a master regulator of molecular tumour subtype
Wu, Y., Fletcher, M., Gu, Z., Wang, Q., Costa, B., Bertoni, A., Man, K.-H., Schlotter, M., Felsberg, J., Mangei, J., et al. (2020) · Nature Communications · doi:10.1038/s41467-020-20225-w · Cited by 101
Bulut-Karslioglu, A., Macrae, T. A., Oses-Prieto, J. A., Covarrubias, S., Percharde, M., Ku, G., Diaz, A., McManus, M. T., Burlingame, A. L., & Ramalho-Santos, M. (2018) · Cell Stem Cell · doi:10.1016/j.stem.2018.02.004 · Cited by 97
Epigenomic priming of immune genes implicates oligodendroglia in multiple sclerosis susceptibility
Meijer, M., Agirre, E., Kabbe, M., van Tuijn, C. A., Heskol, A., Zheng, C., Mendanha Falcão, A., Bartosovic, M., Kirby, L., Calini, D., et al. (2022) · Neuron · doi:10.1016/j.neuron.2021.12.034 · Cited by 98
Kang, Y., Kim, Y. W., Kang, J., & Kim, A. (2021) · The FASEB Journal · doi:10.1096/fj.202100488r · Cited by 93
de Wet, T. J., Winkler, K. R., Mhlanga, M., Mizrahi, V., & Warner, D. F. (2020) · eLife · doi:10.7554/elife.60083 · Cited by 79
LEDGF and HDGF2 relieve the nucleosome-induced barrier to transcription in differentiated cells
LeRoy, G., Oksuz, O., Descostes, N., Aoi, Y., Ganai, R. A., Kara, H. O., Yu, J.-R., Lee, C.-H., Stafford, J., Shilatifard, A., et al. (2019) · Science Advances · doi:10.1126/sciadv.aay3068 · Cited by 89
SIRT7 mediates L1 elements transcriptional repression and their association with the nuclear lamina
Vazquez, B. N., Thackray, J. K., Simonet, N. G., Chahar, S., Kane-Goldsmith, N., Newkirk, S. J., Lee, S., Xing, J., Verzi, M. P., An, W., et al. (2019) · Nucleic Acids Research · doi:10.1093/nar/gkz519 · Cited by 79
Jpx RNA regulates CTCF anchor site selection and formation of chromosome loops
Oh, H. J., Aguilar, R., Kesner, B., Lee, H.-G., Kriz, A. J., Chu, H.-P., & Lee, J. T. (2021) · Cell · doi:10.1016/j.cell.2021.11.012 · Cited by 84
Generation of human adult hepatocyte organoids with metabolic functions
Igarashi, R., Oda, M., Okada, R., Yano, T., Takahashi, S., Pastuhov, S., Matano, M., Masuda, N., Togasaki, K., Ohta, Y., et al. (2025) · Nature · doi:10.1038/s41586-025-08861-y · Cited by 85
Ravichandran, M., Hu, J., Cai, C., Ward, N. P., Venida, A., Foakes, C., Kuljanin, M., Yang, A., Hennessey, C. J., Yang, Y., et al. (2022) · Cancer Discovery · doi:10.1158/2159-8290.cd-22-0044 · Cited by 80
Activation of endogenous retroviruses during brain development causes an inflammatory response
Jönsson, M. E., Garza, R., Sharma, Y., Petri, R., Södersten, E., Johansson, J. G., Johansson, P. A., Atacho, D. A., Pircs, K., Madsen, S., et al. (2021) · The EMBO Journal · doi:10.15252/embj.2020106423 · Cited by 80
Functional multi-organelle units control inflammatory lipid metabolism of macrophages
Zimmermann, J. A., Lucht, K., Stecher, M., Badhan, C., Glaser, K. M., Epple, M. W., Koch, L. R., Deboutte, W., Manke, T., Ebnet, K., et al. (2024) · Nature Cell Biology · doi:10.1038/s41556-024-01457-0 · Cited by 79
Self-citationHNF1A recruits KDM6A to activate differentiated acinar cell programs that suppress pancreatic cancer
Kalisz, M., Bernardo, E., Beucher, A., Maestro, M. A., del Pozo, N., Millán, I., Haeberle, L., Schlensog, M., Safi, S. A., Knoefel, W. T., et al. (2020) · The EMBO Journal · doi:10.15252/embj.2019102808 · Cited by 77
An evolutionary trade-off between host immunity and metabolism drives fatty liver in male mice
Nikkanen, J., Leong, Y. A., Krause, W. C., Dermadi, D., Maschek, J. A., Van Ry, T., Cox, J. E., Weiss, E. J., Gokcumen, O., Chawla, A., et al. (2022) · Science · doi:10.1126/science.abn9886 · Cited by 77
Transcription-dependent cohesin repositioning rewires chromatin loops in cellular senescence
Olan, I., Parry, A. J., Schoenfelder, S., Narita, M., Ito, Y., Chan, A. S. L., Slater, G. S. C., Bihary, D., Bando, M., Shirahige, K., et al. (2020) · Nature Communications · doi:10.1038/s41467-020-19878-4 · Cited by 76
Nascent Transcript Folding Plays a Major Role in Determining RNA Polymerase Elongation Rates
Turowski, T. W., Petfalski, E., Goddard, B. D., French, S. L., Helwak, A., & Tollervey, D. (2020) · Molecular Cell · doi:10.1016/j.molcel.2020.06.002 · Cited by 75
Automated in situ chromatin profiling efficiently resolves cell types and gene regulatory programs
Janssens, D. H., Wu, S. J., Sarthy, J. F., Meers, M. P., Myers, C. H., Olson, J. M., Ahmad, K., & Henikoff, S. (2018) · Epigenetics & Chromatin · doi:10.1186/s13072-018-0243-8 · Cited by 73
Dedifferentiation and neuronal repression define familial Alzheimer’s disease
Caldwell, A. B., Liu, Q., Schroth, G. P., Galasko, D. R., Yuan, S. H., Wagner, S. L., & Subramaniam, S. (2020) · Science Advances · doi:10.1126/sciadv.aba5933 · Cited by 69
12-h clock regulation of genetic information flow by XBP1s
Pan, Y., Ballance, H., Meng, H., Gonzalez, N., Kim, S.-M., Abdurehman, L., York, B., Chen, X., Schnytzer, Y., Levy, O., et al. (2020) · PLOS Biology · doi:10.1371/journal.pbio.3000580 · Cited by 70
Deconstructing Stepwise Fate Conversion of Human Fibroblasts to Neurons by MicroRNAs
Cates, K., McCoy, M. J., Kwon, J.-S., Liu, Y., Abernathy, D. G., Zhang, B., Liu, S., Gontarz, P., Kim, W. K., Chen, S., et al. (2021) · Cell Stem Cell · doi:10.1016/j.stem.2020.08.015 · Cited by 67
Capano, L. S., Sato, C., Ficulle, E., Yu, A., Horie, K., Kwon, J.-S., Burbach, K. F., Barthélemy, N. R., Fox, S. G., Karch, C. M., et al. (2022) · Cell Stem Cell · doi:10.1016/j.stem.2022.04.018 · Cited by 65
Kumar, A., Karuppagounder, S. S., Chen, Y., Corona, C., Kawaguchi, R., Cheng, Y., Balkaya, M., Sagdullaev, B. T., Wen, Z., Stuart, C., et al. (2023) · Neuron · doi:10.1016/j.neuron.2023.06.013 · Cited by 64
Metadata
- Authors
- Ramírez, F., Ryan, D. P., Grüning, B., Bhardwaj, V., Kilpert, F., Richter, A. S., Heyne, S., Dündar, F., & Manke, T.
- Affiliations
- Max Planck Institute of Immunobiology and Epigenetics (DE)
- University of Freiburg (DE)
- Weill Cornell Medicine (US)
- Corresponding author
- Manke, Thomas
- ORCID
- Venue
- Nucleic Acids Research
- Publisher
- Oxford University Press (OUP)
- Published
- 2016-04-13
- Volume
- 44
- Issue
- W1
- Pages
- W160-W165
- ISSN
- 0305-1048 (ISSN-L)
- 1362-4962
- PMC
- PMC4987876
- OpenAlex
- W2341539131
- Cited by
- 8,096
- References
- 2
- Citations by year
- 2026: 1065 · 2025: 1325 · 2024: 1238 · 2023: 1188 · 2022: 1018 · 2021: 941 · 2020: 602 · 2019: 393 · 2018: 234 · 2017: 85 · 2016: 5
- FWCI
- 124.25
- Type
- journal article
- Language
- en
- Open access
- gold
- doi.org
- Licence
- Locations
- Nucleic Acids Research (publishedVersion, cc-by-nc)
- Europe PMC (PubMed Central) (publishedVersion, cc-by-nc)
- PubMed Central (publishedVersion, cc-by-nc)
- PubMed (publishedVersion)
- FreiDok plus (Universitätsbibliothek Freiburg) (submittedVersion, other-oa)
- HighWire Press Open Archive (submittedVersion)
- MPG.PuRe (Max Planck Society) (submittedVersion)
- Funders
- Deutsche Forschungsgemeinschaft (SFB 992)
- Topics
- Life Sciences › Biochemistry, Genetics and Molecular Biology › Molecular Biology › Genomics and Phylogenetic Studies
- Life Sciences › Biochemistry, Genetics and Molecular Biology › Molecular Biology › Genomics and Chromatin Dynamics
- Social Sciences › Decision Sciences › Information Systems and Management › Scientific Computing and Data Management
- Keywords
- read normalization, read quality control, read clustering, data visualization
- MeSH terms
- Animals, Base Sequence, Computer Graphics, Drosophila melanogaster, Humans, Software, Information Storage and Retrieval, Sequence Alignment, Sequence Analysis, DNA, Computational Biology, Internet, High-Throughput Nucleotide Sequencing
About these checks
Registry, retraction, Cites and statistics results are computed, not judged, with one exception: a printed reference that no index lists is read once by a model before it counts as a citation error. Claims are extracted by a model and kept only when their quote appears verbatim in the text; each cited source is then checked, with a model’s help, for whether it says what the claim relies on. Those verdicts can be wrong — read the claim’s quote and the cited source before relying on one.
Statistics and arithmetic are recomputed, not judged.
Confidence bands are shown only for fields calibrated on our annotated test set. None is calibrated yet, so no band is shown.
What counts as a claim ›How we measure confidence ›How we check this ›
Are you an author, or do you see a problem with this page? Request a review
