

The DOI matches its Crossref record; 65 of the 67 references it cites were found in a registry or an index; none of the 66 sources its claims cite is checked for support yet.
Associations of Glycemic Index and Load With Coronary Heart Disease Events: A Systematic Review and Meta‐Analysis of Prospective Cohorts
Open accessAbstract
Background: Glycemic index ( GI ) and glycemic load ( GL ) have been associated with coronary heart disease ( CHD ) risk in some but not all cohort studies. We therefore assessed the association of GI and GL with CHD risk in prospective cohorts. Methods and Results: We searched MEDLINE , EMBASE , and CINAHL (through April 5, 2012) and identified all prospective cohorts assessing associations of GI and GL with incidence of CHD . Meta‐analysis of observational studies in epidemiology ( MOOSE ) methodologies were used. Relative measures of risk, comparing the group with the highest exposure (mean GI of cohorts=84.4 GI units, range 79.9 to 91; mean GL of cohorts=224.8, range 166 to 270) to the reference group (mean GI =72.3 GI units, range 68.1 to 77; mean GL =135.4, range 83 to 176), were pooled using random‐effects models, expressed as relative risk ( RR ) with heterogeneity assessed by χ 2 and quantified by I 2 . Subgroups included sex and duration of follow‐up. Ten studies (n=240 936) were eligible. Pooled analyses showed an increase in CHD risk for the highest GI quantile compared with the lowest, with RR =1.11 (95% confidence interval [ CI ] 0.99 to 1.24) and for GL , RR =1.27 (95% CI 1.09 to 1.49), both with evidence of heterogeneity (I 2 >42%, P <0.07). Subgroup analyses revealed only a significant modification by sex, with the female cohorts showing significance for GI RR =1.26 (95% CI 1.12 to 1.41) and for GL RR =1.55 (95% CI 1.18 to 2.03). Conclusions: High GI and GL diets were significantly associated with CHD events in women but not in men. Further studies are required to determine the relationship between GI and GL with CHD in men.
Overview
AI snapshot
Written from the paper’s full text.
TL;DR
This systematic review and meta-analysis of 10 prospective cohorts found that high glycemic load was significantly associated with increased coronary heart disease risk, while high glycemic index was not significant overall. The associations were significant in women but not in men.
Key findings
- Across 10 studies (n=240,936 for GL; n=233,655 for GI), 6 to 25 years of follow-up yielded 6,940 coronary events.
- Highest versus lowest GI exposure: RR=1.11 (95% CI 0.99 to 1.24), P=0.09, with heterogeneity I²=45%, P=0.05; removing the Grau et al. report on men gave RR=1.14 (95% CI 1.02 to 1.26), P=0.02, I²=30%.
- Highest versus lowest GL exposure: RR=1.27 (95% CI 1.09 to 1.49), P=0.002, with heterogeneity I²=43%, P=0.06.
- Sex significantly modified associations: women had GI RR=1.26 (95% CI 1.12 to 1.41) and GL RR=1.55 (95% CI 1.18 to 2.03); men had GI RR=0.96 (95% CI 0.84 to 1.11) and GL RR=1.08 (95% CI 0.93 to 1.26). Duration of follow-up was not a significant modifier.
Methods
- Systematic review and meta-analysis of prospective cohorts in healthy adults, following MOOSE guidelines; MEDLINE, EMBASE, and CINAHL were searched through April 5, 2012, for studies assessing GI or GL and incident CHD, MI, or CHD death.
- Eligible studies included 10 cohorts with 12 GI reports and 12 GL reports; all used Cox proportional hazards models except one study using restricted cubic spline models.
- Natural log-transformed relative risks comparing highest versus reference exposure were pooled using random-effects generic inverse variance models; heterogeneity was assessed by Cochrane’s Q and I², with a priori subgroups for sex and follow-up duration and publication bias tested by Begg’s and Egger’s tests.
Limitations
- The paper states limitations including the limited number of studies, inability to include potentially relevant studies because of missing data, heterogeneity in overall analyses, likely underpowered analyses in men, potential residual confounding or overadjustment, combining dietary data from multiple instruments, and a predominantly white population limiting racial diversity.
- The text makes evident that observational design cannot establish causality, and the sex-specific findings may be influenced by the larger female sample and underpowered male cohorts.
- One included study used restricted cubic splines and was identified as an outlier and contributor to heterogeneity, which the authors note may affect pooled estimates.
Model-written summary. Check it against the paper before relying on it.
Integrity signals
Registry
Cites
Statistics
Figures
Verification
Claims the paper makes
38 Not checked yet · 32 Own result · 8 Own method · 5 Own interpretation · 2 No basis given
A result the paper reports from its own data — it cites no other source for it, so there is none to check. The quote shows it is in the paper.
In the paper
“During 6 to 25 years of follow-up, 6940 coronary events were recorded.”
§ Associations of Glycemic Index and Load With Coronary Heart Disease Events: A Systematic Review and Meta-Analysis of Prospective Cohorts > Results > Cohort Characteristics
plain- Asserted: passes — The authors put it forward as true.
- Checkable: passes — It can be checked against evidence.
- Load-bearing: unclear — It is unclear whether the paper’s conclusions depend on it.
- Based: passes — The paper gives a reason why it holds.
A result the paper reports from its own data — it cites no other source for it, so there is none to check. The quote shows it is in the paper.
In the paper
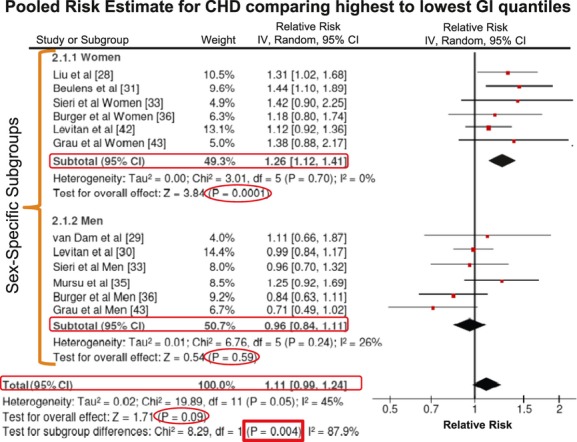
“Pooled analyses showed an increase in CHD risk for the highest GI quantile compared with the lowest, with RR=1.11 (95% confidence interval [CI] 0.99 to 1.24)”
- Also stated in: § Glycemic Index and Coronary Heart Disease · plain
“The CHD incidence rate was increased at the highest level of GI exposure (mean GI of 84.4 GI units, range 79.9 to 91) relative to the lowest (mean GI of 72.3 GI units, range 68.1 to 77), RR=1.11, 95% CI 0.99 to 1.24, and approached significance (P=0.09)”
§ Associations of Glycemic Index and Load With Coronary Heart Disease Events: A Systematic Review and Meta-Analysis of Prospective Cohorts > Abstract > Methods and Results
plaincorrelational- Asserted: passes — The authors put it forward as true.
- Checkable: passes — It can be checked against evidence.
- Load-bearing: passes — The paper’s conclusions depend on it.
- Based: passes — The paper gives a reason why it holds.
- Also stated in: § Glycemic Index and Coronary Heart Disease · plain
A result the paper reports from its own data — it cites no other source for it, so there is none to check. The quote shows it is in the paper.
In the paper
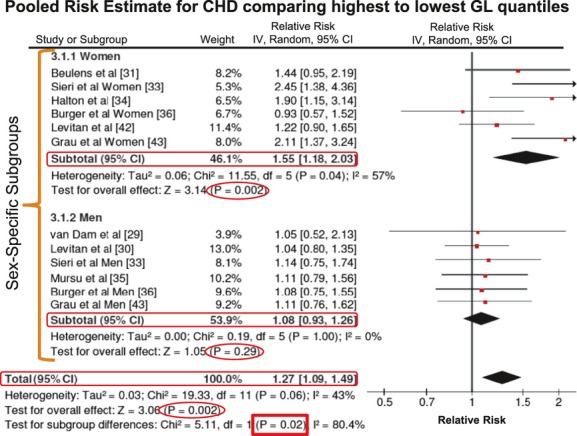
“The pooled risk estimation showed a significant increase in CHD risk (RR=1.27 [95% CI 1.09 to 1.49], P=0.002), with significant heterogeneity (I2=43%, P=0.06), for the highest level of GL exposure (mean GL of 224.8 GL units, range 166 to 270) relative to the lowest (mean GL of 135.4 GL units, range 83 to 176).”
§ Associations of Glycemic Index and Load With Coronary Heart Disease Events: A Systematic Review and Meta-Analysis of Prospective Cohorts > Results > Glycemic Load and Coronary Heart Disease
plain- Asserted: passes — The authors put it forward as true.
- Checkable: passes — It can be checked against evidence.
- Load-bearing: unclear — It is unclear whether the paper’s conclusions depend on it.
- Based: passes — The paper gives a reason why it holds.
In the paper
“The removal of Grau et al43 somewhat reduced the estimate of the association of GL with CHD (RR=1.21 [95% CI 1.05 to 1.38], P=0.007; I2=23%, P=0.23)”
§ Associations of Glycemic Index and Load With Coronary Heart Disease Events: A Systematic Review and Meta-Analysis of Prospective Cohorts > Results > Glycemic Load and Coronary Heart Disease
What the sources say
- Not checked yetcites Grau et al43
plaindirect- Asserted: passes — The authors put it forward as true.
- Checkable: passes — It can be checked against evidence.
- Load-bearing: unclear — It is unclear whether the paper’s conclusions depend on it.
- Based: passes — The paper gives a reason why it holds.
A result the paper reports from its own data — it cites no other source for it, so there is none to check. The quote shows it is in the paper.
In the paper
“Sensitivity analyses identified the Grau et al43 report on men as the largest contributor to heterogeneity.”
§ Associations of Glycemic Index and Load With Coronary Heart Disease Events: A Systematic Review and Meta-Analysis of Prospective Cohorts > Results > Glycemic Index and Coronary Heart Disease
plaincorrelational- Asserted: passes — The authors put it forward as true.
- Checkable: passes — It can be checked against evidence.
- Load-bearing: unclear — It is unclear whether the paper’s conclusions depend on it.
- Based: passes — The paper gives a reason why it holds.
A result the paper reports from its own data — it cites no other source for it, so there is none to check. The quote shows it is in the paper.
In the paper
“The effect was seen only in women with 26% increased relative risk of CHD for GI and 55% for GL.”
§ Associations of Glycemic Index and Load With Coronary Heart Disease Events: A Systematic Review and Meta-Analysis of Prospective Cohorts > Discussion
plaincorrelational- Asserted: passes — The authors put it forward as true.
- Checkable: passes — It can be checked against evidence.
- Load-bearing: passes — The paper’s conclusions depend on it.
- Based: passes — The paper gives a reason why it holds.
A result the paper reports from its own data — it cites no other source for it, so there is none to check. The quote shows it is in the paper.
In the paper
“with the female cohorts showing significance for GI RR=1.26 (95% CI 1.12 to 1.41)”
- Also stated in: § Glycemic Index and Coronary Heart Disease · plain
“The pooled female cohorts28,31,33,36,42,43 showed a larger, statistically significant association (ΔGI between mean of highest exposure and mean of reference=11.9±1.5 SE, RR=1.26 [95% CI 1.12 to 1.41])”
§ Associations of Glycemic Index and Load With Coronary Heart Disease Events: A Systematic Review and Meta-Analysis of Prospective Cohorts > Abstract > Methods and Results
plaincorrelational- Asserted: passes — The authors put it forward as true.
- Checkable: passes — It can be checked against evidence.
- Load-bearing: passes — The paper’s conclusions depend on it.
- Based: passes — The paper gives a reason why it holds.
- Also stated in: § Glycemic Index and Coronary Heart Disease · plain
A result the paper reports from its own data — it cites no other source for it, so there is none to check. The quote shows it is in the paper.
In the paper
“The pooled risk estimation showed a significant increase in CHD risk (RR=1.27 [95% CI 1.09 to 1.49], P=0.002), with significant heterogeneity (I2=43%, P=0.06), for the highest level of GL exposure (mean GL of 224.8 GL units, range 166 to 270) relative to the lowest (mean GL of 135.4 GL units, range 83 to 176).”
- Also stated in: § Discussion · boosted
“and a 27% increased relative risk of CHD for the highest versus the lowest quantile of GL.”
§ Associations of Glycemic Index and Load With Coronary Heart Disease Events: A Systematic Review and Meta-Analysis of Prospective Cohorts > Results > Glycemic Load and Coronary Heart Disease
boostedcorrelational- Asserted: passes — The authors put it forward as true.
- Checkable: passes — It can be checked against evidence.
- Load-bearing: passes — The paper’s conclusions depend on it.
- Based: passes — The paper gives a reason why it holds.
- Also stated in: § Discussion · boosted
None of the sources cited for this claim have been checked yet.
In the paper
“Sensitivity analyses identified the Grau et al43 and Sieri et al33 reports on women as the largest contributors to heterogeneity when removed individually.”
§ Associations of Glycemic Index and Load With Coronary Heart Disease Events: A Systematic Review and Meta-Analysis of Prospective Cohorts > Results > Glycemic Load and Coronary Heart Disease
What the sources say
- Not checked yetcites Grau et al43
- Not checked yetcites Sieri et al33
plaincorrelational- Asserted: passes — The authors put it forward as true.
- Checkable: passes — It can be checked against evidence.
- Load-bearing: unclear — It is unclear whether the paper’s conclusions depend on it.
- Based: passes — The paper gives a reason why it holds.
A result the paper reports from its own data — it cites no other source for it, so there is none to check. The quote shows it is in the paper.
In the paper
“whereas in the male cohorts,29,30,33,35,36,43 the association was not significant (ΔGL between mean of highest exposure and mean of reference=90.4±9.2 SE, RR=1.08 [95% CI 0.93 to 1.26]).”
§ Associations of Glycemic Index and Load With Coronary Heart Disease Events: A Systematic Review and Meta-Analysis of Prospective Cohorts > Results > Glycemic Load and Coronary Heart Disease
plain- Asserted: passes — The authors put it forward as true.
- Checkable: passes — It can be checked against evidence.
- Load-bearing: passes — The paper’s conclusions depend on it.
- Based: passes — The paper gives a reason why it holds.
A result the paper reports from its own data — it cites no other source for it, so there is none to check. The quote shows it is in the paper.
In the paper
“Sex, however, was a significant modifier of the association of GI with CHD (β=0.77 [95% CI 0.65 to 0.93]; P=0.004, Figure 2, sex-specific subgroups).”
§ Associations of Glycemic Index and Load With Coronary Heart Disease Events: A Systematic Review and Meta-Analysis of Prospective Cohorts > Results > Glycemic Index and Coronary Heart Disease
plaincorrelational- Asserted: passes — The authors put it forward as true.
- Checkable: passes — It can be checked against evidence.
- Load-bearing: passes — The paper’s conclusions depend on it.
- Based: passes — The paper gives a reason why it holds.
A result the paper reports from its own data — it cites no other source for it, so there is none to check. The quote shows it is in the paper.
In the paper
“and for GL RR=1.55 (95% CI 1.18 to 2.03)”
§ Associations of Glycemic Index and Load With Coronary Heart Disease Events: A Systematic Review and Meta-Analysis of Prospective Cohorts > Abstract > Methods and Results
plaincorrelational- Asserted: passes — The authors put it forward as true.
- Checkable: passes — It can be checked against evidence.
- Load-bearing: passes — The paper’s conclusions depend on it.
- Based: passes — The paper gives a reason why it holds.
A result the paper reports from its own data — it cites no other source for it, so there is none to check. The quote shows it is in the paper.
In the paper
“A priori stratification revealed no significant modification of association for the duration of follow-up analysis with cohorts of ≥10 years28,29,35,36,43 (RR=1.08 [95% CI 0.89 to 1.31]) versus those of <10 years30,31,33,42 (RR=1.13 [95% CI 0.97 to 1.31]) as subsets (β=0.95 [95% CI 0.71 to 1.26]), both with evidence of heterogeneity (I2>44% for both, figure not shown).”
§ Associations of Glycemic Index and Load With Coronary Heart Disease Events: A Systematic Review and Meta-Analysis of Prospective Cohorts > Results > Glycemic Index and Coronary Heart Disease
plain- Asserted: passes — The authors put it forward as true.
- Checkable: passes — It can be checked against evidence.
- Load-bearing: unclear — It is unclear whether the paper’s conclusions depend on it.
- Based: passes — The paper gives a reason why it holds.
A result the paper reports from its own data — it cites no other source for it, so there is none to check. The quote shows it is in the paper.
In the paper
“Congruent with the GI analysis, sex was a significant modifier of the association of GL with CHD (β=0.73 [95% CI 0.56 to 0.96]; P=0.02, Figure 3, sex-specific subgroups).”
§ Associations of Glycemic Index and Load With Coronary Heart Disease Events: A Systematic Review and Meta-Analysis of Prospective Cohorts > Results > Glycemic Load and Coronary Heart Disease
plaincorrelational- Asserted: passes — The authors put it forward as true.
- Checkable: passes — It can be checked against evidence.
- Load-bearing: passes — The paper’s conclusions depend on it.
- Based: passes — The paper gives a reason why it holds.
In the paper
“Furthermore, the 1 study43 of men in the present analysis that showed a near-significant deleterious effect of low-GI diets was also responsible for the heterogeneity in the analysis.”
§ Associations of Glycemic Index and Load With Coronary Heart Disease Events: A Systematic Review and Meta-Analysis of Prospective Cohorts > Discussion
What the sources say
- Not checked yetcites [43] Grau K Tetens I Bjornsbo KS Heitman BL Overall glycaemic index and glycaemic load of habitual diet and risk of heart disease. Public Health Nutr. 2011; 14: 109- 118. 20576198 source
plaindirectSingle case- Asserted: passes — The authors put it forward as true.
- Checkable: passes — It can be checked against evidence.
- Load-bearing: unclear — It is unclear whether the paper’s conclusions depend on it.
- Based: passes — The paper gives a reason why it holds.
In the paper
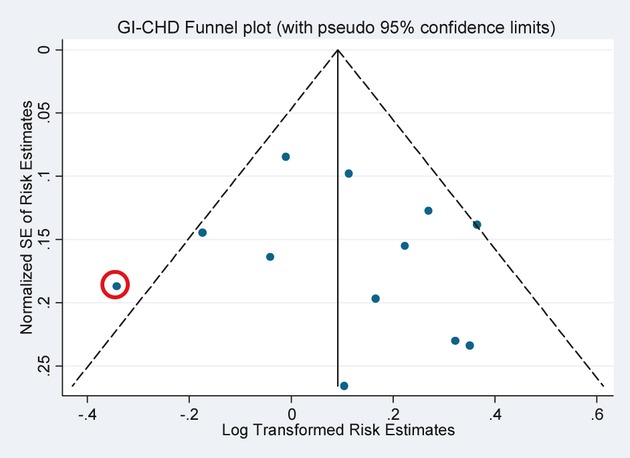
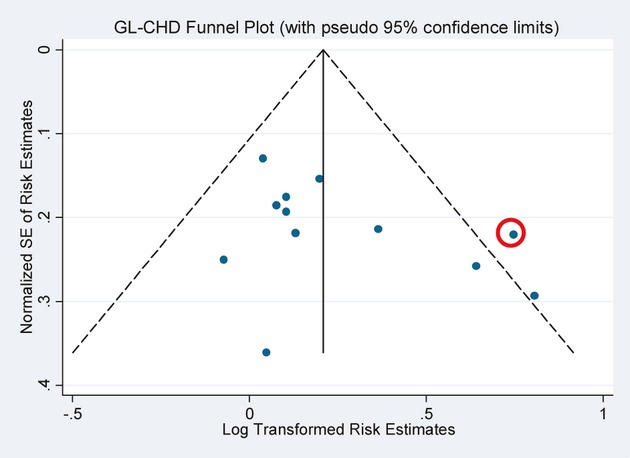
“in the GL funnel plot, and the Grau et al43 report on women appears to be an outlier (outside the pseudo 95% confidence limits).”
§ Associations of Glycemic Index and Load With Coronary Heart Disease Events: A Systematic Review and Meta-Analysis of Prospective Cohorts > Results > Publication Bias
What the sources say
- Not checked yetcites Grau et al43
hedged- Asserted: passes — The authors put it forward as true.
- Checkable: passes — It can be checked against evidence.
- Load-bearing: unclear — It is unclear whether the paper’s conclusions depend on it.
- Based: passes — The paper gives a reason why it holds.
A result the paper reports from its own data — it cites no other source for it, so there is none to check. The quote shows it is in the paper.
In the paper
“Subgroup analyses revealed only a significant modification by sex”
§ Associations of Glycemic Index and Load With Coronary Heart Disease Events: A Systematic Review and Meta-Analysis of Prospective Cohorts > Abstract > Methods and Results
plaincorrelational- Asserted: passes — The authors put it forward as true.
- Checkable: passes — It can be checked against evidence.
- Load-bearing: unclear — It is unclear whether the paper’s conclusions depend on it.
- Based: passes — The paper gives a reason why it holds.
In the paper
“as did the removal of Sieri et al33 (RR=1.22 [95% CI 1.06 to 1.40], P=0.005; I2=27%, P=0.19).”
§ Associations of Glycemic Index and Load With Coronary Heart Disease Events: A Systematic Review and Meta-Analysis of Prospective Cohorts > Results > Glycemic Load and Coronary Heart Disease
What the sources say
- Not checked yetcites Sieri et al33
plaindirect- Asserted: passes — The authors put it forward as true.
- Checkable: passes — It can be checked against evidence.
- Load-bearing: unclear — It is unclear whether the paper’s conclusions depend on it.
- Based: passes — The paper gives a reason why it holds.
A result the paper reports from its own data — it cites no other source for it, so there is none to check. The quote shows it is in the paper.
In the paper
“Ten studies (n=240 936) were eligible.”
§ Associations of Glycemic Index and Load With Coronary Heart Disease Events: A Systematic Review and Meta-Analysis of Prospective Cohorts > Abstract > Methods and Results
plain- Asserted: passes — The authors put it forward as true.
- Checkable: passes — It can be checked against evidence.
- Load-bearing: passes — The paper’s conclusions depend on it.
- Based: passes — The paper gives a reason why it holds.
A result the paper reports from its own data — it cites no other source for it, so there is none to check. The quote shows it is in the paper.
In the paper
“Similar to the GI analyses, no modification in the association was revealed by the duration of follow-up analysis, ≥10 years29,34–36,43 (RR=1.26 [95% CI 1.01 to 1.59]) versus <10 years30,31,33,42 (RR=1.29 [95% CI 1.02 to 1.63]) with β=0.99 (95% CI 0.68 to 1.44)”
§ Associations of Glycemic Index and Load With Coronary Heart Disease Events: A Systematic Review and Meta-Analysis of Prospective Cohorts > Results > Glycemic Load and Coronary Heart Disease
plain- Asserted: passes — The authors put it forward as true.
- Checkable: passes — It can be checked against evidence.
- Load-bearing: unclear — It is unclear whether the paper’s conclusions depend on it.
- Based: passes — The paper gives a reason why it holds.
A result the paper reports from its own data — it cites no other source for it, so there is none to check. The quote shows it is in the paper.
In the paper
“We demonstrated an overall increased relative risk of CHD of 11% in the comparison of the highest versus lowest quantile of GI”
§ Associations of Glycemic Index and Load With Coronary Heart Disease Events: A Systematic Review and Meta-Analysis of Prospective Cohorts > Discussion
boostedcorrelational- Asserted: passes — The authors put it forward as true.
- Checkable: passes — It can be checked against evidence.
- Load-bearing: passes — The paper’s conclusions depend on it.
- Based: passes — The paper gives a reason why it holds.
A result the paper reports from its own data — it cites no other source for it, so there is none to check. The quote shows it is in the paper.
In the paper
“and for GL, RR=1.27 (95% CI 1.09 to 1.49)”
§ Associations of Glycemic Index and Load With Coronary Heart Disease Events: A Systematic Review and Meta-Analysis of Prospective Cohorts > Abstract > Methods and Results
plaincorrelational- Asserted: passes — The authors put it forward as true.
- Checkable: passes — It can be checked against evidence.
- Load-bearing: passes — The paper’s conclusions depend on it.
- Based: passes — The paper gives a reason why it holds.
A result the paper reports from its own data — it cites no other source for it, so there is none to check. The quote shows it is in the paper.
In the paper
“both with evidence of heterogeneity (I2>42%, P<0.07)”
§ Associations of Glycemic Index and Load With Coronary Heart Disease Events: A Systematic Review and Meta-Analysis of Prospective Cohorts > Abstract > Methods and Results
plain- Asserted: passes — The authors put it forward as true.
- Checkable: passes — It can be checked against evidence.
- Load-bearing: unclear — It is unclear whether the paper’s conclusions depend on it.
- Based: passes — The paper gives a reason why it holds.
None of the sources cited for this claim have been checked yet.
In the paper
“In the overall GL extreme quantile analysis there was significant heterogeneity that became nonsignificant when either the Grau et al43 or the Sieri et al33 reports on women were removed.”
§ Associations of Glycemic Index and Load With Coronary Heart Disease Events: A Systematic Review and Meta-Analysis of Prospective Cohorts > Discussion
What the sources say
- Not checked yetcites Grau et al43
- Not checked yetcites Sieri et al33
plain- Asserted: passes — The authors put it forward as true.
- Checkable: passes — It can be checked against evidence.
- Load-bearing: unclear — It is unclear whether the paper’s conclusions depend on it.
- Based: passes — The paper gives a reason why it holds.
The paper states this without a source or data behind it here, so there is nothing to check it against. The quote shows it is in the paper.
In the paper
“The current studies do not suggest a latency effect of GI or GL on CHD risk.”
§ Associations of Glycemic Index and Load With Coronary Heart Disease Events: A Systematic Review and Meta-Analysis of Prospective Cohorts > Discussion
hedged- Asserted: passes — The authors put it forward as true.
- Checkable: passes — It can be checked against evidence.
- Load-bearing: unclear — It is unclear whether the paper’s conclusions depend on it.
- Based: passes — The paper gives a reason why it holds.
In the paper
“These findings have intensified the focus on carbohydrates, because diets rich in highly processed carbohydrates can lead to raised triglycerides (TGs),9 reductions in high-density lipoprotein cholesterol (HDL-C),10 and increasing CHD risk.11”
§ Associations of Glycemic Index and Load With Coronary Heart Disease Events: A Systematic Review and Meta-Analysis of Prospective Cohorts > Introduction
What the sources say
- Not checked yetcites [10] Mancini M Mattock M Rabaya E Chait A Lewis B Studies of the mechanisms of carbohydrate-induced lipaemia in normal man. Atherosclerosis. 1973; 17: 445- 454. 4351720 source
plaindirect- Asserted: passes — The authors put it forward as true.
- Checkable: passes — It can be checked against evidence.
- Load-bearing: passes — The paper’s conclusions depend on it.
- Based: passes — The paper gives a reason why it holds.
None of the sources cited for this claim have been checked yet.
In the paper
“Over the last 3 decades, clinical trials have demonstrated that reducing the GI or glycemic load (GL), the product of GI and the available carbohydrate content of a food,13 in the context of diets low in saturated fat, can improve CHD risk factors including body mass index (BMI), blood pressure, and serum cholesterol.14–24”
§ Associations of Glycemic Index and Load With Coronary Heart Disease Events: A Systematic Review and Meta-Analysis of Prospective Cohorts > Introduction
What the sources say
- Not checked yetcites [14] Dickinson S Hancock DP Petocz P Ceriello A Brand-Miller J High-glycemic index carbohydrate increases nuclear factor-kappab activation in mononuclear cells of young, lean healthy subjects. Am J Clin Nutr. 2008; 87: 1188- 1193. 18469238
- Not checked yetcites [15] Jenkins DJ Kendall CW McKeown-Eyssen G Josse RG Silverberg J Booth GL Vidgen E Josse AR Nguyen TH Corrigan S Banach MS Ares S Mitchell S Emam A Augustin LS Parker TL Leiter LA Effect of a low-glycemic index or a high-cereal fiber diet on type 2 diabetes: a randomized trial. JAMA. 2008; 300: 2742- 2753. 19088352 source
- Not checked yetcites [16] Jenkins DJ Srichaikul K Kendall CW Sievenpiper JL Abdulnour S Mirrahimi A Meneses C Nishi S He X Lee S So YT Esfahani A Mitchell S Parker TL Vidgen E Josse RG Leiter LA The relation of low glycaemic index fruit consumption to glycaemic control and risk factors for coronary heart disease in type 2 diabetes. Diabetologia. 2011; 54: 271- 279. 20978741 PMC3017317 source
- Not checked yetcites [17] Luscombe ND Noakes M Clifton PM Diets high and low in glycemic index versus high monounsaturated fat diets: effects on glucose and lipid metabolism in NIDDM. Eur J Clin Nutr. 1999; 53: 473- 478. 10403584 source
- Not checked yetcites [18] McMillan-Price J Petocz P Atkinson F O'Neill K Samman S Steinbeck K Caterson I Brand-Miller J Comparison of 4 diets of varying glycemic load on weight loss and cardiovascular risk reduction in overweight and obese young adults: a randomized controlled trial. Arch Intern Med. 2006; 166: 1466- 1475. 16864756 source
- Not checked yetcites [19] Pereira MA Swain J Goldfine AB Rifai N Ludwig DS Effects of a low-glycemic load diet on resting energy expenditure and heart disease risk factors during weight loss. JAMA. 2004; 292: 2482- 2490. 15562127 source
- Not checked yetcites [20] Rizkalla SW Taghrid L Laromiguiere M Huet D Boillot J Rigoir A Elgrably F Slama G Improved plasma glucose control, whole-body glucose utilization, and lipid profile on a low-glycemic index diet in type 2 diabetic men: a randomized controlled trial. Diabetes Care. 2004; 27: 1866- 1872. 15277409 source
- Not checked yetcites [21] Thomas D Elliott E Baur L Low glycaemic index or low glycaemic load diets for overweight and obesity. Cochrane Database Syst Rev. 2007 CD005105 17636786 PMC9022192
- Not checked yetcites [22] Wolever TM Gibbs AL Mehling C Chiasson JL Connelly PW Josse RG Leiter LA Maheux P Rabasa-Lhoret R Rodger NW Ryan EA The Canadian Trial of Carbohydrates in Diabetes (CCD), a 1-y controlled trial of low-glycemic-index dietary carbohydrate in type 2 diabetes: no effect on glycated hemoglobin but reduction in C-reactive protein. Am J Clin Nutr. 2008; 87: 114- 125. 18175744 source
- Not checked yetcites [23] Wolever TM Mehling C High-carbohydrate-low-glycaemic index dietary advice improves glucose disposition index in subjects with impaired glucose tolerance. Br J Nutr. 2002; 87: 477- 487. 12010586 source
boosteddirect- Asserted: passes — The authors put it forward as true.
- Checkable: passes — It can be checked against evidence.
- Load-bearing: passes — The paper’s conclusions depend on it.
- Based: passes — The paper gives a reason why it holds.
None of the sources cited for this claim have been checked yet.
In the paper
“Glycemic index (GI) and glycemic load (GL) have been associated with coronary heart disease (CHD) risk in some but not all cohort studies.”
- Also stated in: § Introduction · plain
“Despite the proposed physiological mechanisms,27 published cohort studies in the last decade have produced mixed results for the associations of GI and GL with CHD.28–31”
§ Associations of Glycemic Index and Load With Coronary Heart Disease Events: A Systematic Review and Meta-Analysis of Prospective Cohorts > Abstract > Background
What the sources say
- Not checked yetcites [28] Liu S Willett WC Stampfer MJ Hu FB Franz M Sampson L Hennekens CH Manson JE A prospective study of dietary glycemic load, carbohydrate intake, and risk of coronary heart disease in US women. Am J Clin Nutr. 2000; 71: 1455- 1461. 10837285 source
- Not checked yetcites [29] van Dam RM Visscher AW Feskens EJ Verhoef P Kromhout D Dietary glycemic index in relation to metabolic risk factors and incidence of coronary heart disease: the Zutphen Elderly Study. Eur J Clin Nutr. 2000; 54: 726- 731. 11002385 source
- Not checked yetcites [30] Levitan EB Mittleman MA Hakansson N Wolk A Dietary glycemic index, dietary glycemic load, and cardiovascular disease in middle-aged and older Swedish men. Am J Clin Nutr. 2007; 85: 1521- 1526. 17556687 PMC4355937 source
- Not checked yetcites [31] Beulens JW de Bruijne LM Stolk RP Peeters PH Bots ML Grobbee DE van der Schouw YT High dietary glycemic load and glycemic index increase risk of cardiovascular disease among middle-aged women: a population-based follow-up study. J Am Coll Cardiol. 2007; 50: 14- 21. 17601539 source
plaincorrelational- Asserted: passes — The authors put it forward as true.
- Checkable: passes — It can be checked against evidence.
- Load-bearing: passes — The paper’s conclusions depend on it.
- Based: passes — The paper gives a reason why it holds.
- Also stated in: § Introduction · plain
None of the sources cited for this claim have been checked yet.
In the paper
“However, recent prospective cohort meta-analyses suggest an even greater increase in CHD risk when highly refined and readily absorbed carbohydrates replaced SFAs.4,5”
§ Associations of Glycemic Index and Load With Coronary Heart Disease Events: A Systematic Review and Meta-Analysis of Prospective Cohorts > Introduction
What the sources say
- Not checked yetcites [4] Jakobsen MU O'Reilly EJ Heitmann BL Pereira MA Balter K Fraser GE Goldbourt U Hallmans G Knekt P Liu S Pietinen P Spiegelman D Stevens J Virtamo J Willett WC Ascherio A Major types of dietary fat and risk of coronary heart disease: a pooled analysis of 11 cohort studies. Am J Clin Nutr. 2009; 89: 1425- 1432. 19211817 PMC2676998 source
- Not checked yetcites [5] Siri-Tarino PW Sun Q Hu FB Krauss RM Meta-analysis of prospective cohort studies evaluating the association of saturated fat with cardiovascular disease. Am J Clin Nutr. 2010; 91: 535- 546. 20071648 PMC2824152 source
hedgeddirect- Asserted: passes — The authors put it forward as true.
- Checkable: passes — It can be checked against evidence.
- Load-bearing: passes — The paper’s conclusions depend on it.
- Based: passes — The paper gives a reason why it holds.
None of the sources cited for this claim have been checked yet.
In the paper
“Cohort studies have also shown an association between low GI diets25,26 and reduced development of hyperglycemia and diabetes, further implicating the GI in the progression to CHD.25,26”
§ Associations of Glycemic Index and Load With Coronary Heart Disease Events: A Systematic Review and Meta-Analysis of Prospective Cohorts > Introduction
What the sources say
- Not checked yetcites [25] Salmeron J Manson JE Stampfer MJ Colditz GA Wing AL Willett WC Dietary fiber, glycemic load, and risk of non-insulin-dependent diabetes mellitus in women. JAMA. 1997; 277: 472- 477. 9020271 source
- Not checked yetcites [26] Salmeron J Ascherio A Rimm EB Colditz GA Spiegelman D Jenkins DJ Stampfer MJ Wing AL Willett WC Dietary fiber, glycemic load, and risk of NIDDM in men. Diabetes Care. 1997; 20: 545- 550. 9096978 source
plaincorrelational- Asserted: passes — The authors put it forward as true.
- Checkable: passes — It can be checked against evidence.
- Load-bearing: passes — The paper’s conclusions depend on it.
- Based: passes — The paper gives a reason why it holds.
In the paper
“These findings have intensified the focus on carbohydrates, because diets rich in highly processed carbohydrates can lead to raised triglycerides (TGs),9 reductions in high-density lipoprotein cholesterol (HDL-C),10 and increasing CHD risk.11”
§ Associations of Glycemic Index and Load With Coronary Heart Disease Events: A Systematic Review and Meta-Analysis of Prospective Cohorts > Introduction
What the sources say
- Not checked yetcites [9] Liu S Manson JE Stampfer MJ Holmes MD Hu FB Hankinson SE Willett WC Dietary glycemic load assessed by food-frequency questionnaire in relation to plasma high-density-lipoprotein cholesterol and fasting plasma triacylglycerols in postmenopausal women. Am J Clin Nutr. 2001; 73: 560- 566. 11237932 source
plaindirect- Asserted: passes — The authors put it forward as true.
- Checkable: passes — It can be checked against evidence.
- Load-bearing: passes — The paper’s conclusions depend on it.
- Based: passes — The paper gives a reason why it holds.
In the paper
“These findings have intensified the focus on carbohydrates, because diets rich in highly processed carbohydrates can lead to raised triglycerides (TGs),9 reductions in high-density lipoprotein cholesterol (HDL-C),10 and increasing CHD risk.11”
§ Associations of Glycemic Index and Load With Coronary Heart Disease Events: A Systematic Review and Meta-Analysis of Prospective Cohorts > Introduction
What the sources say
- Not checked yetcites [11] Jeppesen J Schaaf P Jones C Zhou MY Chen YD Reaven GM Effects of low-fat, high-carbohydrate diets on risk factors for ischemic heart disease in postmenopausal women. Am J Clin Nutr. 1997; 65: 1027- 1033. 9094889 source
plaindirect- Asserted: passes — The authors put it forward as true.
- Checkable: passes — It can be checked against evidence.
- Load-bearing: passes — The paper’s conclusions depend on it.
- Based: passes — The paper gives a reason why it holds.
None of the sources cited for this claim have been checked yet.
In the paper
“These studies indicated that in Danish47 and Black American44 men, positive benefits for cardiovascular events were seen related to consumption of lower GI foods.”
§ Associations of Glycemic Index and Load With Coronary Heart Disease Events: A Systematic Review and Meta-Analysis of Prospective Cohorts > Discussion
What the sources say
- Not checked yetcites [47] Jakobsen MU Dethlefsen C Joensen AM Stegger J Tjonneland A Schmidt EB Overvad K Intake of carbohydrates compared with intake of saturated fatty acids and risk of myocardial infarction: importance of the glycemic index. Am J Clin Nutr. 2010; 91: 1764- 1768. 20375186 source
- Not checked yetcites [44] Hardy DS Hoelscher DM Aragaki C Stevens J Steffen LM Pankow JS Boerwinkle E Association of glycemic index and glycemic load with risk of incident coronary heart disease among whites and African Americans with and without type 2 diabetes: the Atherosclerosis Risk in Communities study. Ann Epidemiol. 2010; 20: 610- 616. 20609341 PMC3085981 source
hedgedcorrelational- Asserted: passes — The authors put it forward as true.
- Checkable: passes — It can be checked against evidence.
- Load-bearing: unclear — It is unclear whether the paper’s conclusions depend on it.
- Based: passes — The paper gives a reason why it holds.
A conclusion the paper draws from its own results — it cites no other source for it, so there is none to check. The quote shows it is in the paper.
In the paper
“The effect was seen only in women with 26% increased relative risk of CHD for GI and 55% for GL.”
§ Associations of Glycemic Index and Load With Coronary Heart Disease Events: A Systematic Review and Meta-Analysis of Prospective Cohorts > Discussion
plaincorrelational- Asserted: passes — The authors put it forward as true.
- Checkable: passes — It can be checked against evidence.
- Load-bearing: passes — The paper’s conclusions depend on it.
- Based: passes — The paper gives a reason why it holds.
A conclusion the paper draws from its own results — it cites no other source for it, so there is none to check. The quote shows it is in the paper.
In the paper
“Despite these reservations there are reasons why women may be potentially more vulnerable to high glycemic index diets.”
§ Associations of Glycemic Index and Load With Coronary Heart Disease Events: A Systematic Review and Meta-Analysis of Prospective Cohorts > Discussion
hedgedconditional- Asserted: passes — The authors put it forward as true.
- Checkable: passes — It can be checked against evidence.
- Load-bearing: passes — The paper’s conclusions depend on it.
- Based: passes — The paper gives a reason why it holds.
In the paper
“At the same time, high-GI diets may raise TG levels,52”
§ Associations of Glycemic Index and Load With Coronary Heart Disease Events: A Systematic Review and Meta-Analysis of Prospective Cohorts > Discussion
What the sources say
- Not checked yetcites [52] Levitan EB Cook NR Stampfer MJ Ridker PM Rexrode KM Buring JE Manson JE Liu S Dietary glycemic index, dietary glycemic load, blood lipids, and C-reactive protein. Metabolism. 2008; 57: 437- 443. 18249220 PMC2262400 source
hedgedconditional- Asserted: passes — The authors put it forward as true.
- Checkable: passes — It can be checked against evidence.
- Load-bearing: unclear — It is unclear whether the paper’s conclusions depend on it.
- Based: passes — The paper gives a reason why it holds.
None of the sources cited for this claim have been checked yet.
In the paper
“which may also carry more risk for CHD in women than in men.53,54”
§ Associations of Glycemic Index and Load With Coronary Heart Disease Events: A Systematic Review and Meta-Analysis of Prospective Cohorts > Discussion
What the sources say
- Not checked yetcites [53] Reardon MF Nestel PJ Craig IH Harper RW Lipoprotein predictors of the severity of coronary artery disease in men and women. Circulation. 1985; 71: 881- 888. 3986978 source
- Not checked yetcites [54] Austin MA Hokanson JE Edwards KL Hypertriglyceridemia as a cardiovascular risk factor. Am J Cardiol. 1998; 81: 7B- 12B. 9526807 source
hedgedconditional- Asserted: passes — The authors put it forward as true.
- Checkable: passes — It can be checked against evidence.
- Load-bearing: passes — The paper’s conclusions depend on it.
- Based: passes — The paper gives a reason why it holds.
In the paper
“men with lower BMIs have been shown to be less susceptible to the effects of GI on CHD risk.48”
§ Associations of Glycemic Index and Load With Coronary Heart Disease Events: A Systematic Review and Meta-Analysis of Prospective Cohorts > Discussion
What the sources say
- Not checked yetcites [48] Ding EL Malik VS Convergence of obesity and high glycemic diet on compounding diabetes and cardiovascular risks in modernizing China: an emerging public health dilemma. Global Health. 2008; 4: 4 18302739 PMC2292178 source
plaincorrelational- Asserted: passes — The authors put it forward as true.
- Checkable: passes — It can be checked against evidence.
- Load-bearing: unclear — It is unclear whether the paper’s conclusions depend on it.
- Based: passes — The paper gives a reason why it holds.
None of the sources cited for this claim have been checked yet.
In the paper
“Part of the protection that women have from CHD may be related to their high HDL-C levels.49,50”
§ Associations of Glycemic Index and Load With Coronary Heart Disease Events: A Systematic Review and Meta-Analysis of Prospective Cohorts > Discussion
What the sources say
- Not checked yetcites [49] Knopp RH Paramsothy P Retzlaff BM Fish B Walden C Dowdy A Tsunehara C Aikawa K Cheung MC Gender differences in lipoprotein metabolism and dietary response: basis in hormonal differences and implications for cardiovascular disease. Curr Atheroscler Rep. 2005; 7: 472- 479. 16256006 source
- Not checked yetcites [50] Gordon DJ Probstfield JL Garrison RJ Neaton JD Castelli WP Knoke JD Jacobs DR Jr Bangdiwala S Tyroler HA High-density lipoprotein cholesterol and cardiovascular disease. Four prospective American studies. Circulation. 1989; 79: 8- 15. 2642759 source
hedgedconditional- Asserted: passes — The authors put it forward as true.
- Checkable: passes — It can be checked against evidence.
- Load-bearing: passes — The paper’s conclusions depend on it.
- Based: passes — The paper gives a reason why it holds.
In the paper
“A systematic review of such RCTs in overweight and obese subjects found that replacing refined carbohydrates with low-GI complex carbohydrates conferred more beneficial effects on CHD lipid risk factors when compared with complex starchy carbohydrates with higher GI.57”
§ Associations of Glycemic Index and Load With Coronary Heart Disease Events: A Systematic Review and Meta-Analysis of Prospective Cohorts > Discussion
What the sources say
- Not checked yetcites [57] Gastrich M Lasser N Wien M Bachmann G Dietary complex carbohydrates and low glycemic index/load decrease levels of specific metabolic syndrome/cardiovascular disease risk factors. Top Clin Nutr. 2008; 23: 76- 96. source
plaindirect- Asserted: passes — The authors put it forward as true.
- Checkable: passes — It can be checked against evidence.
- Load-bearing: unclear — It is unclear whether the paper’s conclusions depend on it.
- Based: passes — The paper gives a reason why it holds.
A conclusion the paper draws from its own results — it cites no other source for it, so there is none to check. The quote shows it is in the paper.
In the paper
“We conclude that a reduction in the glycemic index and glycemic load may favorably affect CHD outcomes in women.”
§ Associations of Glycemic Index and Load With Coronary Heart Disease Events: A Systematic Review and Meta-Analysis of Prospective Cohorts > Conclusion
hedgedconditional- Asserted: passes — The authors put it forward as true.
- Checkable: passes — It can be checked against evidence.
- Load-bearing: passes — The paper’s conclusions depend on it.
- Based: passes — The paper gives a reason why it holds.
- Rests on an assumption: The observed associations between GI/GL and CHD in women reflect causal effects that would be modified by reducing GI/GL.
None of the sources cited for this claim have been checked yet.
In the paper
“Although no change was found in our overall conclusions with post hoc sensitivity analyses removing the 429,35,43 reports with food diaries and interviews”
§ Associations of Glycemic Index and Load With Coronary Heart Disease Events: A Systematic Review and Meta-Analysis of Prospective Cohorts > Discussion
What the sources say
- Not checked yetcites [29] van Dam RM Visscher AW Feskens EJ Verhoef P Kromhout D Dietary glycemic index in relation to metabolic risk factors and incidence of coronary heart disease: the Zutphen Elderly Study. Eur J Clin Nutr. 2000; 54: 726- 731. 11002385 source
- Not checked yetcites [35] Mursu J Virtanen JK Rissanen TH Tuomainen TP Nykanen I Laukkanen JA Kortelainen R Voutilainen S Glycemic index, glycemic load, and the risk of acute myocardial infarction in Finnish men: the Kuopio Ischaemic Heart Disease Risk Factor Study. Nutr Metab Cardiovasc Dis. 2011; 21: 144- 149. 19836217 source
- Not checked yetcites [43] Grau K Tetens I Bjornsbo KS Heitman BL Overall glycaemic index and glycaemic load of habitual diet and risk of heart disease. Public Health Nutr. 2011; 14: 109- 118. 20576198 source
plain- Asserted: passes — The authors put it forward as true.
- Checkable: passes — It can be checked against evidence.
- Load-bearing: unclear — It is unclear whether the paper’s conclusions depend on it.
- Based: passes — The paper gives a reason why it holds.
None of the sources cited for this claim have been checked yet.
In the paper
“There has also been emerging evidence on the positive effects of low-GI diets on CHD risk factors such as oxidative damage58 and inflammation22 in overweight/obese and type 2 diabetic individuals, respectively.”
§ Associations of Glycemic Index and Load With Coronary Heart Disease Events: A Systematic Review and Meta-Analysis of Prospective Cohorts > Discussion
What the sources say
- Not checked yetcites [58] Botero D Ebbeling CB Blumberg JB Ribaya-Mercado JD Creager MA Swain JF Feldman HA Ludwig DS Acute effects of dietary glycemic index on antioxidant capacity in a nutrient-controlled feeding study. Obesity (Silver Spring). 2009; 17: 1664- 1670. 19543205 PMC2752149 source
- Not checked yetcites [22] Wolever TM Gibbs AL Mehling C Chiasson JL Connelly PW Josse RG Leiter LA Maheux P Rabasa-Lhoret R Rodger NW Ryan EA The Canadian Trial of Carbohydrates in Diabetes (CCD), a 1-y controlled trial of low-glycemic-index dietary carbohydrate in type 2 diabetes: no effect on glycated hemoglobin but reduction in C-reactive protein. Am J Clin Nutr. 2008; 87: 114- 125. 18175744 source
hedgedconditional- Asserted: passes — The authors put it forward as true.
- Checkable: passes — It can be checked against evidence.
- Load-bearing: unclear — It is unclear whether the paper’s conclusions depend on it.
- Based: passes — The paper gives a reason why it holds.
What the paper did — it cites no source for this, so there is none to check. The quote shows it is in the paper.
In the paper
“Although the reports included men and women from Holland,29,31,36 Finland,35 Denmark,43 Sweden,30,42 Italy,33 and the United States,28,34 the majority of the population was white, limiting the racial diversity of this meta-analysis.”
§ Associations of Glycemic Index and Load With Coronary Heart Disease Events: A Systematic Review and Meta-Analysis of Prospective Cohorts > Discussion
plain- Asserted: passes — The authors put it forward as true.
- Checkable: passes — It can be checked against evidence.
- Load-bearing: unclear — It is unclear whether the paper’s conclusions depend on it.
- Based: passes — The paper gives a reason why it holds.
In the paper
“However, it is noteworthy that our systematic review captured a report on African American men that, although not included because of lack of necessary data (ie, quantile analyses), showed that a 5-unit increase in GI conferred a 16% increase in CHD risk.44”
§ Associations of Glycemic Index and Load With Coronary Heart Disease Events: A Systematic Review and Meta-Analysis of Prospective Cohorts > Discussion
What the sources say
- Not checked yetcites [44] Hardy DS Hoelscher DM Aragaki C Stevens J Steffen LM Pankow JS Boerwinkle E Association of glycemic index and glycemic load with risk of incident coronary heart disease among whites and African Americans with and without type 2 diabetes: the Atherosclerosis Risk in Communities study. Ann Epidemiol. 2010; 20: 610- 616. 20609341 PMC3085981 source
plaindirect- Asserted: passes — The authors put it forward as true.
- Checkable: passes — It can be checked against evidence.
- Load-bearing: unclear — It is unclear whether the paper’s conclusions depend on it.
- Based: passes — The paper gives a reason why it holds.
- It may state two separate claims as one. 27
- The quote only partly states this claim. 1
- Probably not a substantial claim. 22
A result the paper reports from its own data — it cites no other source for it, so there is none to check. The quote shows it is in the paper.
In the paper
“The effect was seen only in women with 26% increased relative risk of CHD for GI and 55% for GL.”
§ Associations of Glycemic Index and Load With Coronary Heart Disease Events: A Systematic Review and Meta-Analysis of Prospective Cohorts > Discussion
plaincorrelational- Asserted: unclear — It is unclear whether the authors put it forward as true.
- Checkable: passes — It can be checked against evidence.
- Load-bearing: passes — The paper’s conclusions depend on it.
- Based: unclear — It is unclear why the paper says it holds.
It may state two separate claims as one. The quote only partly states this claim.
None of the sources cited for this claim have been checked yet.
In the paper
“Two reports28,34 on the Nurses' Health Study provided data on the GL exposure; only the report with the larger subject numbers and longer follow-up was included in the GL analyses.34,44”
§ Associations of Glycemic Index and Load With Coronary Heart Disease Events: A Systematic Review and Meta-Analysis of Prospective Cohorts > Results > Search Results
plain- Asserted: passes — The authors put it forward as true.
- Checkable: passes — It can be checked against evidence.
- Load-bearing: fails — The paper’s conclusions may not depend on it.
- Based: passes — The paper gives a reason why it holds.
Probably not a substantial claim. The paper’s conclusions may not depend on it. It may state two separate claims as one.
A result the paper reports from its own data — it cites no other source for it, so there is none to check. The quote shows it is in the paper.
In the paper
“The most common confounders adjusted for included age, BMI, and cigarette smoking, with full multivariate analyses outlined in Table 1.”
§ Associations of Glycemic Index and Load With Coronary Heart Disease Events: A Systematic Review and Meta-Analysis of Prospective Cohorts > Results > Cohort Characteristics
plain- Asserted: passes — The authors put it forward as true.
- Checkable: passes — It can be checked against evidence.
- Load-bearing: fails — The paper’s conclusions may not depend on it.
- Based: passes — The paper gives a reason why it holds.
Probably not a substantial claim. The paper’s conclusions may not depend on it.
A result the paper reports from its own data — it cites no other source for it, so there is none to check. The quote shows it is in the paper.
In the paper
“The removal of this study changed the risk estimate for the association of GI with CHD (RR=1.14 [95% CI 1.02 to 1.26], P=0.02) and also improved the precision of the estimate and eliminated much of the heterogeneity (I2=30%, P=0.16).”
§ Associations of Glycemic Index and Load With Coronary Heart Disease Events: A Systematic Review and Meta-Analysis of Prospective Cohorts > Results > Glycemic Index and Coronary Heart Disease
plaincorrelational- Asserted: passes — The authors put it forward as true.
- Checkable: passes — It can be checked against evidence.
- Load-bearing: unclear — It is unclear whether the paper’s conclusions depend on it.
- Based: passes — The paper gives a reason why it holds.
It may state two separate claims as one.
A result the paper reports from its own data — it cites no other source for it, so there is none to check. The quote shows it is in the paper.
In the paper
“All studies used Cox proportional hazard models for CHD risk estimation analyses, except for 1 study43 which used restricted cubic spline models.”
§ Associations of Glycemic Index and Load With Coronary Heart Disease Events: A Systematic Review and Meta-Analysis of Prospective Cohorts > Results > Cohort Characteristics
plain- Asserted: passes — The authors put it forward as true.
- Checkable: passes — It can be checked against evidence.
- Load-bearing: fails — The paper’s conclusions may not depend on it.
- Based: passes — The paper gives a reason why it holds.
Probably not a substantial claim. The paper’s conclusions may not depend on it.
In the paper
“in the visual inspection of the GI funnel plot, the Grau et al43 report on men appears to be an outlier”
§ Associations of Glycemic Index and Load With Coronary Heart Disease Events: A Systematic Review and Meta-Analysis of Prospective Cohorts > Results > Publication Bias
What the sources say
- Not checked yetcites Grau et al43
hedged- Asserted: passes — The authors put it forward as true.
- Checkable: passes — It can be checked against evidence.
- Load-bearing: fails — The paper’s conclusions may not depend on it.
- Based: passes — The paper gives a reason why it holds.
Probably not a substantial claim. The paper’s conclusions may not depend on it.
A result the paper reports from its own data — it cites no other source for it, so there is none to check. The quote shows it is in the paper.
In the paper
“The dietary patterns across the different quantiles of GL were similar between studies, with a trend of increasing carbohydrate and decreasing protein and fat content at higher GL quantiles (Table 2).”
§ Associations of Glycemic Index and Load With Coronary Heart Disease Events: A Systematic Review and Meta-Analysis of Prospective Cohorts > Results > Cohort Characteristics
plaincorrelational- Asserted: passes — The authors put it forward as true.
- Checkable: passes — It can be checked against evidence.
- Load-bearing: fails — The paper’s conclusions may not depend on it.
- Based: passes — The paper gives a reason why it holds.
Probably not a substantial claim. The paper’s conclusions may not depend on it. It may state two separate claims as one.
A result the paper reports from its own data — it cites no other source for it, so there is none to check. The quote shows it is in the paper.
In the paper
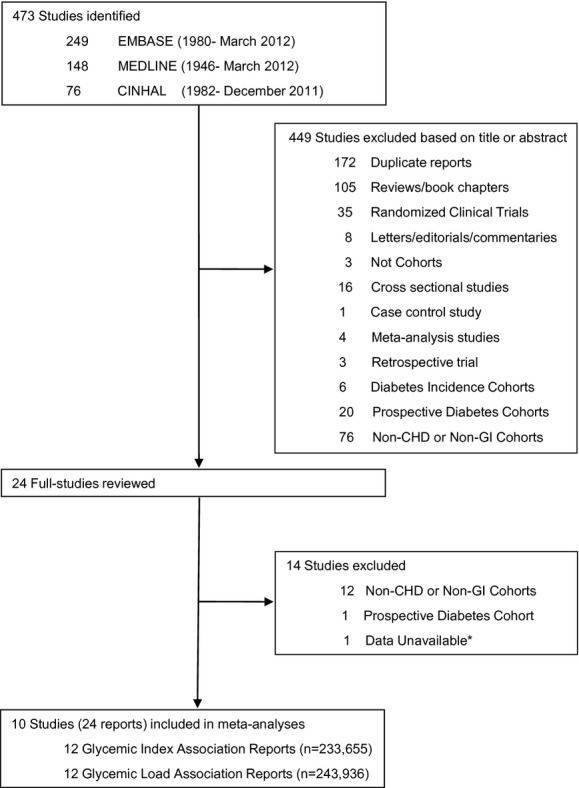
“Of the 10 studies identified, 12 GI and 12 GL reports with CHD risk estimation were included in our analyses, with a total of 233 65528–31,33,35,36,42,43 and 240 93628–31,33,34,35,36,42,43 subjects, respectively.”
§ Associations of Glycemic Index and Load With Coronary Heart Disease Events: A Systematic Review and Meta-Analysis of Prospective Cohorts > Results > Cohort Characteristics
plain- Asserted: passes — The authors put it forward as true.
- Checkable: passes — It can be checked against evidence.
- Load-bearing: unclear — It is unclear whether the paper’s conclusions depend on it.
- Based: passes — The paper gives a reason why it holds.
It may state two separate claims as one.
In the paper
“This study differed from the other studies of men in several respects. The proportion (54%) of smokers was almost twice that of the other studies, and BMI was somewhat lower (25.3 versus 26.1 kg/m2)”
§ Associations of Glycemic Index and Load With Coronary Heart Disease Events: A Systematic Review and Meta-Analysis of Prospective Cohorts > Discussion
What the sources say
- Not checked yetcites [43] Grau K Tetens I Bjornsbo KS Heitman BL Overall glycaemic index and glycaemic load of habitual diet and risk of heart disease. Public Health Nutr. 2011; 14: 109- 118. 20576198 source
plainSingle case- Asserted: passes — The authors put it forward as true.
- Checkable: passes — It can be checked against evidence.
- Load-bearing: passes — The paper’s conclusions depend on it.
- Based: passes — The paper gives a reason why it holds.
It may state two separate claims as one.
A result the paper reports from its own data — it cites no other source for it, so there is none to check. The quote shows it is in the paper.
In the paper
“The majority of the studies (7 of 10) used either a semiquantitative or quantitative Food Frequency Questionnaire (SFFQ or FFQ),28,30,31,33,34,36,42 but 3 used 4- or 7-day diet records or diet history interviews for food consumption patterns.29,35,43”
§ Associations of Glycemic Index and Load With Coronary Heart Disease Events: A Systematic Review and Meta-Analysis of Prospective Cohorts > Results > Cohort Characteristics
plain- Asserted: passes — The authors put it forward as true.
- Checkable: passes — It can be checked against evidence.
- Load-bearing: fails — The paper’s conclusions may not depend on it.
- Based: passes — The paper gives a reason why it holds.
Probably not a substantial claim. The paper’s conclusions may not depend on it. It may state two separate claims as one.
The paper states this without a source or data behind it here, so there is nothing to check it against. The quote shows it is in the paper.
In the paper
“All analyses were stratified by sex.”
§ Associations of Glycemic Index and Load With Coronary Heart Disease Events: A Systematic Review and Meta-Analysis of Prospective Cohorts > Results > Cohort Characteristics
plain- Asserted: passes — The authors put it forward as true.
- Checkable: passes — It can be checked against evidence.
- Load-bearing: fails — The paper’s conclusions may not depend on it.
- Based: passes — The paper gives a reason why it holds.
Probably not a substantial claim. The paper’s conclusions may not depend on it.
A result the paper reports from its own data — it cites no other source for it, so there is none to check. The quote shows it is in the paper.
In the paper
“All cohorts excluded those with documented CHD or major CHD risk factor at time of enrollment, with the exception of 1 that included a population 5% of whom had diabetes35 but adjusted for diabetes status.”
§ Associations of Glycemic Index and Load With Coronary Heart Disease Events: A Systematic Review and Meta-Analysis of Prospective Cohorts > Results > Cohort Characteristics
plain- Asserted: passes — The authors put it forward as true.
- Checkable: passes — It can be checked against evidence.
- Load-bearing: unclear — It is unclear whether the paper’s conclusions depend on it.
- Based: passes — The paper gives a reason why it holds.
It may state two separate claims as one.
A result the paper reports from its own data — it cites no other source for it, so there is none to check. The quote shows it is in the paper.
In the paper
“There was significant evidence of heterogeneity in the female subset but not in the male subset.”
§ Associations of Glycemic Index and Load With Coronary Heart Disease Events: A Systematic Review and Meta-Analysis of Prospective Cohorts > Results > Glycemic Load and Coronary Heart Disease
plain- Asserted: passes — The authors put it forward as true.
- Checkable: passes — It can be checked against evidence.
- Load-bearing: unclear — It is unclear whether the paper’s conclusions depend on it.
- Based: passes — The paper gives a reason why it holds.
It may state two separate claims as one.
A result the paper reports from its own data — it cites no other source for it, so there is none to check. The quote shows it is in the paper.
In the paper
“In all, 473 eligible studies were identified by the search.”
§ Associations of Glycemic Index and Load With Coronary Heart Disease Events: A Systematic Review and Meta-Analysis of Prospective Cohorts > Results > Search Results
plain- Asserted: passes — The authors put it forward as true.
- Checkable: passes — It can be checked against evidence.
- Load-bearing: fails — The paper’s conclusions may not depend on it.
- Based: passes — The paper gives a reason why it holds.
Probably not a substantial claim. The paper’s conclusions may not depend on it.
A result the paper reports from its own data — it cites no other source for it, so there is none to check. The quote shows it is in the paper.
In the paper
“A total of 10 studies with 12 GI reports28–31,33,35,36,42,43 and 12 GL reports28–31,33–36,42,43 were selected for analyses.”
§ Associations of Glycemic Index and Load With Coronary Heart Disease Events: A Systematic Review and Meta-Analysis of Prospective Cohorts > Results > Search Results
plain- Asserted: passes — The authors put it forward as true.
- Checkable: passes — It can be checked against evidence.
- Load-bearing: passes — The paper’s conclusions depend on it.
- Based: passes — The paper gives a reason why it holds.
Probably not a substantial claim. It may state two separate claims as one.
A result the paper reports from its own data — it cites no other source for it, so there is none to check. The quote shows it is in the paper.
In the paper
“All studies used the International Tables of Glycemic Index for assessing the GI of different foods; 328,29,34 used the 1995 iteration,45 630,31,33,36,42,43 used the 2002 iteration,46 and 135 used the 2008 iteration.”
§ Associations of Glycemic Index and Load With Coronary Heart Disease Events: A Systematic Review and Meta-Analysis of Prospective Cohorts > Results > Cohort Characteristics
plain- Asserted: passes — The authors put it forward as true.
- Checkable: passes — It can be checked against evidence.
- Load-bearing: fails — The paper’s conclusions may not depend on it.
- Based: passes — The paper gives a reason why it holds.
Probably not a substantial claim. The paper’s conclusions may not depend on it. It may state two separate claims as one.
A result the paper reports from its own data — it cites no other source for it, so there is none to check. The quote shows it is in the paper.
In the paper
“whereas the male cohorts29,30,33,35,36,43 showed no association (ΔGI between mean of highest exposure and mean of reference=12.2±1.7 SE, RR=0.96 [95% CI 0.84 to 1.11])”
§ Associations of Glycemic Index and Load With Coronary Heart Disease Events: A Systematic Review and Meta-Analysis of Prospective Cohorts > Results > Glycemic Index and Coronary Heart Disease
plain- Asserted: passes — The authors put it forward as true.
- Checkable: passes — It can be checked against evidence.
- Load-bearing: passes — The paper’s conclusions depend on it.
- Based: passes — The paper gives a reason why it holds.
It may state two separate claims as one.
A result the paper reports from its own data — it cites no other source for it, so there is none to check. The quote shows it is in the paper.
In the paper
“In general, the glycemic index and glycemic load data were in agreement, although the magnitude of the CHD risk was greater based on the difference between the extreme quantiles of glycemic load.”
§ Associations of Glycemic Index and Load With Coronary Heart Disease Events: A Systematic Review and Meta-Analysis of Prospective Cohorts > Discussion
plaincorrelational- Asserted: passes — The authors put it forward as true.
- Checkable: passes — It can be checked against evidence.
- Load-bearing: passes — The paper’s conclusions depend on it.
- Based: passes — The paper gives a reason why it holds.
It may state two separate claims as one.
In the paper
“We followed the meta-analysis of observational studies in epidemiology (MOOSE) guidelines for this report.32”
§ Associations of Glycemic Index and Load With Coronary Heart Disease Events: A Systematic Review and Meta-Analysis of Prospective Cohorts > Methods > Data Sources and Study Selection
What the sources say
- Not checked yetcites [32] Stroup DF Berlin JA Morton SC Olkin I Williamson GD Rennie D Moher D Becker BJ Sipe TA Thacker SB Meta-analysis of observational studies in epidemiology: a proposal for reporting. Meta-analysis of observational studies in epidemiology (MOOSE) group. JAMA. 2000; 283: 2008- 2012. 10789670 source
plain- Asserted: passes — The authors put it forward as true.
- Checkable: passes — It can be checked against evidence.
- Load-bearing: fails — The paper’s conclusions may not depend on it.
- Based: passes — The paper gives a reason why it holds.
Probably not a substantial claim. The paper’s conclusions may not depend on it.
What the paper did — it cites no source for this, so there is none to check. The quote shows it is in the paper.
In the paper
“Electronic databases (MEDLINE 1946-March, Week 4, 2012; EMBASE 1980–2012, Week 13; CINAHL 1982–December 2011) were searched by 2 individuals independently; searches were supplemented by manual searches through the reference lists of original publications and review articles.”
§ Associations of Glycemic Index and Load With Coronary Heart Disease Events: A Systematic Review and Meta-Analysis of Prospective Cohorts > Methods > Data Sources and Study Selection
plain- Asserted: passes — The authors put it forward as true.
- Checkable: passes — It can be checked against evidence.
- Load-bearing: fails — The paper’s conclusions may not depend on it.
- Based: passes — The paper gives a reason why it holds.
Probably not a substantial claim. The paper’s conclusions may not depend on it. It may state two separate claims as one.
What the paper did — it cites no source for this, so there is none to check. The quote shows it is in the paper.
In the paper
“Two reviewers (A.M., L.C.) independently reviewed and extracted relevant data employing a standardized pro forma sheet with the first author and year of publication used as study identifiers for convenience.”
§ Associations of Glycemic Index and Load With Coronary Heart Disease Events: A Systematic Review and Meta-Analysis of Prospective Cohorts > Methods > Data Extraction
plain- Asserted: passes — The authors put it forward as true.
- Checkable: passes — It can be checked against evidence.
- Load-bearing: fails — The paper’s conclusions may not depend on it.
- Based: passes — The paper gives a reason why it holds.
Probably not a substantial claim. The paper’s conclusions may not depend on it.
None of the sources cited for this claim have been checked yet.
In the paper
“Potential publication bias was assessed visually by inspecting funnel plots of effect size against the standard error and formally tested using Begg's and Egger's tests in STATA.39,40”
§ Associations of Glycemic Index and Load With Coronary Heart Disease Events: A Systematic Review and Meta-Analysis of Prospective Cohorts > Methods > Data Synthesis
What the sources say
- Not checked yetcites [39] Begg CB Mazumdar M Operating characteristics of a rank correlation test for publication bias. Biometrics. 1994; 50: 1088- 1101. 7786990 source
- Not checked yetcites [40] Egger M Davey Smith G Schneider M Minder C Bias in meta-analysis detected by a simple, graphical test. BMJ. 1997; 315: 629- 634. 9310563 PMC2127453 source
plain- Asserted: passes — The authors put it forward as true.
- Checkable: passes — It can be checked against evidence.
- Load-bearing: fails — The paper’s conclusions may not depend on it.
- Based: passes — The paper gives a reason why it holds.
Probably not a substantial claim. The paper’s conclusions may not depend on it. It may state two separate claims as one.
In the paper
“Regardless of P value, sensitivity analyses were performed to identify sources of heterogeneity.38”
§ Associations of Glycemic Index and Load With Coronary Heart Disease Events: A Systematic Review and Meta-Analysis of Prospective Cohorts > Methods > Data Synthesis
What the sources say
- Not checked yetcites [38] Higgins J Green S Cochrane handbook for systematic reviews of interventions version 5.0.0 [updated February 2008] 2008 The Cochrane Collaboration source
plain- Asserted: passes — The authors put it forward as true.
- Checkable: passes — It can be checked against evidence.
- Load-bearing: fails — The paper’s conclusions may not depend on it.
- Based: passes — The paper gives a reason why it holds.
Probably not a substantial claim. The paper’s conclusions may not depend on it.
In the paper
“Our a priori stratified analyses included sex and duration of follow-up, that is, whether studies were more or less than 10 years, consistent with the 10-year Framingham Risk Score41 approach, and analyzed using meta-regression in STATA.”
§ Associations of Glycemic Index and Load With Coronary Heart Disease Events: A Systematic Review and Meta-Analysis of Prospective Cohorts > Methods > Data Synthesis
What the sources say
- Not checked yetcites [41] Anderson KM Odell PM Wilson PW Kannel WB Cardiovascular disease risk profiles. Am Heart J. 1991; 121: 293- 298. 1985385 source
plain- Asserted: passes — The authors put it forward as true.
- Checkable: passes — It can be checked against evidence.
- Load-bearing: fails — The paper’s conclusions may not depend on it.
- Based: passes — The paper gives a reason why it holds.
Probably not a substantial claim. The paper’s conclusions may not depend on it. It may state two separate claims as one.
What the paper did — it cites no source for this, so there is none to check. The quote shows it is in the paper.
In the paper
“Titles and abstracts were initially reviewed to identify relevant reports by 2 independent reviewers (A.M., L.C., both investigators); reviewers conducted a subsequent full-text assessment of all studies in which there was uncertainty about the assessment of relevance. Disagreements regarding eligibility were resolved through discussion with 2 additional adjudicators (D.J.A.J/R.J.D.).”
§ Associations of Glycemic Index and Load With Coronary Heart Disease Events: A Systematic Review and Meta-Analysis of Prospective Cohorts > Methods > Data Sources and Study Selection
plain- Asserted: passes — The authors put it forward as true.
- Checkable: passes — It can be checked against evidence.
- Load-bearing: fails — The paper’s conclusions may not depend on it.
- Based: passes — The paper gives a reason why it holds.
Probably not a substantial claim. The paper’s conclusions may not depend on it. It may state two separate claims as one.
None of the sources cited for this claim have been checked yet.
In the paper
“As a result, SFAs per se no longer appeared to be associated with CHD, emphasizing the potentially deleterious effects of refined, rapidly absorbed carbohydrates.4,5”
§ Associations of Glycemic Index and Load With Coronary Heart Disease Events: A Systematic Review and Meta-Analysis of Prospective Cohorts > Introduction
What the sources say
- Not checked yetcites [4] Jakobsen MU O'Reilly EJ Heitmann BL Pereira MA Balter K Fraser GE Goldbourt U Hallmans G Knekt P Liu S Pietinen P Spiegelman D Stevens J Virtamo J Willett WC Ascherio A Major types of dietary fat and risk of coronary heart disease: a pooled analysis of 11 cohort studies. Am J Clin Nutr. 2009; 89: 1425- 1432. 19211817 PMC2676998 source
- Not checked yetcites [5] Siri-Tarino PW Sun Q Hu FB Krauss RM Meta-analysis of prospective cohort studies evaluating the association of saturated fat with cardiovascular disease. Am J Clin Nutr. 2010; 91: 535- 546. 20071648 PMC2824152 source
hedgedcorrelational- Asserted: passes — The authors put it forward as true.
- Checkable: passes — It can be checked against evidence.
- Load-bearing: passes — The paper’s conclusions depend on it.
- Based: passes — The paper gives a reason why it holds.
It may state two separate claims as one.
What the paper did — it cites no source for this, so there is none to check. The quote shows it is in the paper.
In the paper
“However, we were unable to include 2 studies in this analysis because of the expression of results as either the substitution of low GI carbohydrates for SFAs, rather than dietary GI analysis, or the incremental association of dietary GI with CHD rather than quantile presentation (ie, CHD risk per 5 GI unit increments).”
§ Associations of Glycemic Index and Load With Coronary Heart Disease Events: A Systematic Review and Meta-Analysis of Prospective Cohorts > Discussion
plain- Asserted: passes — The authors put it forward as true.
- Checkable: passes — It can be checked against evidence.
- Load-bearing: fails — The paper’s conclusions may not depend on it.
- Based: passes — The paper gives a reason why it holds.
Probably not a substantial claim. The paper’s conclusions may not depend on it.
In the paper
“Higher glycemic index diets tend to reduce circulating HDL-C concentrations and thus disproportionately increase CHD risk in women, especially when postmenopausal.51”
§ Associations of Glycemic Index and Load With Coronary Heart Disease Events: A Systematic Review and Meta-Analysis of Prospective Cohorts > Discussion
What the sources say
- Not checked yetcites [51] Matthews KA Meilahn E Kuller LH Kelsey SF Caggiula AW Wing RR Menopause and risk factors for coronary heart disease. N Engl J Med. 1989; 321: 641- 646. 2488072 source
hedgeddirect- Asserted: passes — The authors put it forward as true.
- Checkable: passes — It can be checked against evidence.
- Load-bearing: unclear — It is unclear whether the paper’s conclusions depend on it.
- Based: passes — The paper gives a reason why it holds.
It may state two separate claims as one.
A conclusion the paper draws from its own results — it cites no other source for it, so there is none to check. The quote shows it is in the paper.
In the paper
“High GI and GL diets were significantly associated with CHD events in women but not in men.”
§ Associations of Glycemic Index and Load With Coronary Heart Disease Events: A Systematic Review and Meta-Analysis of Prospective Cohorts > Abstract > Conclusions
plain- Asserted: passes — The authors put it forward as true.
- Checkable: passes — It can be checked against evidence.
- Load-bearing: passes — The paper’s conclusions depend on it.
- Based: passes — The paper gives a reason why it holds.
It may state two separate claims as one.
None of the sources cited for this claim have been checked yet.
In the paper
“Neither Begg's nor Egger's tests revealed significant evidence of publication bias in the overall analyses of GI and GL (P>0.115 for all).”
§ Associations of Glycemic Index and Load With Coronary Heart Disease Events: A Systematic Review and Meta-Analysis of Prospective Cohorts > Results > Publication Bias
What the sources say
- Not checked yetcites [39] Begg CB Mazumdar M Operating characteristics of a rank correlation test for publication bias. Biometrics. 1994; 50: 1088- 1101. 7786990 source
- Not checked yetcites [40] Egger M Davey Smith G Schneider M Minder C Bias in meta-analysis detected by a simple, graphical test. BMJ. 1997; 315: 629- 634. 9310563 PMC2127453 source
plain- Asserted: passes — The authors put it forward as true.
- Checkable: passes — It can be checked against evidence.
- Load-bearing: unclear — It is unclear whether the paper’s conclusions depend on it.
- Based: passes — The paper gives a reason why it holds.
It may state two separate claims as one.
A conclusion the paper draws from its own results — it cites no other source for it, so there is none to check. The quote shows it is in the paper.
In the paper
“High GI and GL diets were significantly associated with CHD events in women but not in men.”
§ Associations of Glycemic Index and Load With Coronary Heart Disease Events: A Systematic Review and Meta-Analysis of Prospective Cohorts > Abstract > Conclusions
plaincorrelational- Asserted: passes — The authors put it forward as true.
- Checkable: passes — It can be checked against evidence.
- Load-bearing: passes — The paper’s conclusions depend on it.
- Based: passes — The paper gives a reason why it holds.
It may state two separate claims as one.
None of the sources cited for this claim have been checked yet.
In the paper
“Other factors that in general may contribute to the increased CHD risk with high-GI diets are blood pressure and CRP, both of which may be raised by high-GI diets.52,55”
§ Associations of Glycemic Index and Load With Coronary Heart Disease Events: A Systematic Review and Meta-Analysis of Prospective Cohorts > Discussion
What the sources say
- Not checked yetcites [52] Levitan EB Cook NR Stampfer MJ Ridker PM Rexrode KM Buring JE Manson JE Liu S Dietary glycemic index, dietary glycemic load, blood lipids, and C-reactive protein. Metabolism. 2008; 57: 437- 443. 18249220 PMC2262400 source
- Not checked yetcites [55] Liu S Manson JE Buring JE Stampfer MJ Willett WC Ridker PM Relation between a diet with a high glycemic load and plasma concentrations of high-sensitivity C-reactive protein in middle-aged women. Am J Clin Nutr. 2002; 75: 492- 498. 11864854 source
hedgedconditional- Asserted: passes — The authors put it forward as true.
- Checkable: passes — It can be checked against evidence.
- Load-bearing: unclear — It is unclear whether the paper’s conclusions depend on it.
- Based: passes — The paper gives a reason why it holds.
It may state two separate claims as one.
None of the sources cited for this claim have been checked yet.
In the paper
“Because no studies have a time frame shorter than 6 years, it is not possible to determine whether the effect is early, possibly from alterations in clotting factors,60 or later due to reduction in the rate of atheroma formation secondary to oxidative damage.61”
§ Associations of Glycemic Index and Load With Coronary Heart Disease Events: A Systematic Review and Meta-Analysis of Prospective Cohorts > Discussion
What the sources say
- Not checked yetcites [60] Jarvi AE Karlstrom BE Granfeldt YE Bjorck IE Asp NG Vessby BO Improved glycemic control and lipid profile and normalized fibrinolytic activity on a low-glycemic index diet in type 2 diabetic patients. Diabetes Care. 1999; 22: 10- 18. 10333897 source
- Not checked yetcites [61] Hu Y Block G Norkus EP Morrow JD Dietrich M Hudes M Relations of glycemic index and glycemic load with plasma oxidative stress markers. Am J Clin Nutr. 2006; 84: 70- 76 quiz 266-267 16825683 source
plain- Asserted: passes — The authors put it forward as true.
- Checkable: passes — It can be checked against evidence.
- Load-bearing: passes — The paper’s conclusions depend on it.
- Based: passes — The paper gives a reason why it holds.
It may state two separate claims as one.
What the paper did — it cites no source for this, so there is none to check. The quote shows it is in the paper.
In the paper
“because of the time frame of published reports, the GI and GL data were still compiled from various data sources.”
§ Associations of Glycemic Index and Load With Coronary Heart Disease Events: A Systematic Review and Meta-Analysis of Prospective Cohorts > Discussion
plain- Asserted: passes — The authors put it forward as true.
- Checkable: passes — It can be checked against evidence.
- Load-bearing: fails — The paper’s conclusions may not depend on it.
- Based: passes — The paper gives a reason why it holds.
Probably not a substantial claim. The paper’s conclusions may not depend on it.
None of the sources cited for this claim have been checked yet.
In the paper
“The weaknesses of the present study include the limited number of studies, the inability to include potentially relevant studies44,47 because of lack of necessary data, and the heterogeneity in the overall analyses, especially in the likely underpowered analyses of men.”
§ Associations of Glycemic Index and Load With Coronary Heart Disease Events: A Systematic Review and Meta-Analysis of Prospective Cohorts > Discussion
What the sources say
- Not checked yetcites [44] Hardy DS Hoelscher DM Aragaki C Stevens J Steffen LM Pankow JS Boerwinkle E Association of glycemic index and glycemic load with risk of incident coronary heart disease among whites and African Americans with and without type 2 diabetes: the Atherosclerosis Risk in Communities study. Ann Epidemiol. 2010; 20: 610- 616. 20609341 PMC3085981 source
- Not checked yetcites [47] Jakobsen MU Dethlefsen C Joensen AM Stegger J Tjonneland A Schmidt EB Overvad K Intake of carbohydrates compared with intake of saturated fatty acids and risk of myocardial infarction: importance of the glycemic index. Am J Clin Nutr. 2010; 91: 1764- 1768. 20375186 source
plain- Asserted: passes — The authors put it forward as true.
- Checkable: passes — It can be checked against evidence.
- Load-bearing: unclear — It is unclear whether the paper’s conclusions depend on it.
- Based: passes — The paper gives a reason why it holds.
It may state two separate claims as one.
What the paper did — it cites no source for this, so there is none to check. The quote shows it is in the paper.
In the paper
“We further believe that our systematic review was strengthened by our efforts to acquire as much data as possible by contacting all study authors to include all relevant studies in our analyses.”
§ Associations of Glycemic Index and Load With Coronary Heart Disease Events: A Systematic Review and Meta-Analysis of Prospective Cohorts > Discussion
plaindirect- Asserted: passes — The authors put it forward as true.
- Checkable: passes — It can be checked against evidence.
- Load-bearing: fails — The paper’s conclusions may not depend on it.
- Based: passes — The paper gives a reason why it holds.
Probably not a substantial claim. The paper’s conclusions may not depend on it.
In the paper
“Conversely, acarbose, the α-glucosidase inhibitor that converts dietary carbohydrate to a low glycemic index form, has been shown to prevent hypertension and CHD events in the STOP NIDDM trial.56”
§ Associations of Glycemic Index and Load With Coronary Heart Disease Events: A Systematic Review and Meta-Analysis of Prospective Cohorts > Discussion
What the sources say
- Not checked yetcites [56] Chiasson JL Josse RG Gomis R Hanefeld M Karasik A Laakso M STOP-NIDDM Trial Research Group. Acarbose treatment and the risk of cardiovascular disease and hypertension in patients with impaired glucose tolerance: the STOP-NIDDM trial. JAMA. 2003; 290: 486- 494. 12876091 source
plaindirect- Asserted: passes — The authors put it forward as true.
- Checkable: passes — It can be checked against evidence.
- Load-bearing: unclear — It is unclear whether the paper’s conclusions depend on it.
- Based: passes — The paper gives a reason why it holds.
It may state two separate claims as one.
In the paper
“An earlier meta-analysis that assessed the effect of dietary GI on several health outcomes including diabetes, CHD, and cancer also concluded that low-GI diets were protective for diabetes, CHD, and colon and breast cancers.62”
§ Associations of Glycemic Index and Load With Coronary Heart Disease Events: A Systematic Review and Meta-Analysis of Prospective Cohorts > Discussion
What the sources say
- Not checked yetcites [62] Barclay AW Petocz P McMillan-Price J Flood VM Prvan T Mitchell P Brand-Miller JC Glycemic index, glycemic load, and chronic disease risk – a meta-analysis of observational studies. Am J Clin Nutr. 2008; 87: 627- 637. 18326601 source
plaindirect- Asserted: passes — The authors put it forward as true.
- Checkable: passes — It can be checked against evidence.
- Load-bearing: fails — The paper’s conclusions may not depend on it.
- Based: passes — The paper gives a reason why it holds.
Probably not a substantial claim. The paper’s conclusions may not depend on it.
What the paper did — it cites no source for this, so there is none to check. The quote shows it is in the paper.
In the paper
“The strength of our study included the use of random-effects models to allow assessment of heterogeneity to guide the sensitivity analyses.”
§ Associations of Glycemic Index and Load With Coronary Heart Disease Events: A Systematic Review and Meta-Analysis of Prospective Cohorts > Discussion
plaindirect- Asserted: passes — The authors put it forward as true.
- Checkable: passes — It can be checked against evidence.
- Load-bearing: passes — The paper’s conclusions depend on it.
- Based: passes — The paper gives a reason why it holds.
Probably not a substantial claim.
None of the sources cited for this claim have been checked yet.
In the paper
“In addition, meta-analyses of low-GI RCTs have shown beneficial effects on body weight and lipid profiles in obese and overweight subjects21 as well as on glycemic control in type 2 diabetic subjects.59”
§ Associations of Glycemic Index and Load With Coronary Heart Disease Events: A Systematic Review and Meta-Analysis of Prospective Cohorts > Discussion
What the sources say
- Not checked yetcites [21] Thomas D Elliott E Baur L Low glycaemic index or low glycaemic load diets for overweight and obesity. Cochrane Database Syst Rev. 2007 CD005105 17636786 PMC9022192
- Not checked yetcites [59] Thomas D Elliott EJ Low glycaemic index, or low glycaemic load, diets for diabetes mellitus. Cochrane Database Syst Rev. 2009 CD006296 19160276 PMC6486008
plaindirect- Asserted: passes — The authors put it forward as true.
- Checkable: passes — It can be checked against evidence.
- Load-bearing: unclear — It is unclear whether the paper’s conclusions depend on it.
- Based: passes — The paper gives a reason why it holds.
It may state two separate claims as one.
The paper relies on this without support.
Carbohydrates with differing physical form, particle size, chemical structure, and fiber content alter the rate of starch digestion and their physiological response.
“Carbohydrates with differing physical form, particle size, chemical structure, and fiber content alter the rate of starch digestion and their physiological response.”
The paper relies on this without support.
The observed associations between GI/GL and CHD in women reflect causal effects that would be modified by reducing GI/GL.
“We conclude that a reduction in the glycemic index and glycemic load may favorably affect CHD outcomes in women.”
Claims other papers make about this one
Each is checked against this paper’s own text: does it say what the citing paper says it does?
In the citing paper
“For instance, glycemic responses to carbohydrate consumption appear especially detrimental in women,89”
From Dietary and Policy Priorities for Cardiovascular Disease, Diabetes, and Obesity: A Comprehensive Review (2016) · cites this paper as [89]
In the citing paper
“Harms appear to be larger in women89, 167 and others predisposed to insulin resistance and atherogenic dyslipidemia, and smaller in men and in younger, lean individuals with high physical activity.”
From Dietary and Policy Priorities for Cardiovascular Disease, Diabetes, and Obesity: A Comprehensive Review (2016) · cites this paper as [89]
In the citing paper
“Consistent with this constellation of adverse effects, poor quality carbohydrates are associated with long-term weight gain, diabetes, and CVD.29, 89, 158, 167”
From Dietary and Policy Priorities for Cardiovascular Disease, Diabetes, and Obesity: A Comprehensive Review (2016) · cites this paper as [89]
In the citing paper
“A meta-analysis of 10 prospective cohort studies (n=296,849) (107) found increased GL associated with a 27% increased coronary heart disease (CHD) and MI risk (108).”
From Food Consumption and its Impact on Cardiovascular Disease: Importance of Solutions Focused on the Globalized Food System (2015) · cites this paper as [107]
Self-check
Percentages, sums and reported differences re-computed from the paper’s own numbers.
Each contradiction between two passages listed here was confirmed by an independent check.
Rated minor: it would not touch a result — a value no result rests on, a p-value that stays on the same side of the significance level, or a conflict that is clerical, resolved elsewhere in the paper, or outside its own findings.
In the paper
§ Associations of Glycemic Index and Load With Coronary Heart Disease Events: A Systematic Review and Meta-Analysis of Prospective Cohorts > Results > Glycemic Load and Coronary Heart Disease
“whereas in the male cohorts,29,30,33,35,36,43 the association was not significant (ΔGL between mean of highest exposure and mean of reference=90.4±9.2 SE, RR=1.08 [95% CI 0.93 to 1.26]).”
§ Associations of Glycemic Index and Load With Coronary Heart Disease Events: A Systematic Review and Meta-Analysis of Prospective Cohorts > Results > Glycemic Load and Coronary Heart Disease
“The figure is stratified by sex-specific subgroups with subtotal boxes in 3.1.1 and 3.1.2 summarizing the pooled analysis for women31,33,34,36,42,43 and for men,29,30,33,35,43 respectively.”
Citations
Cites
Bias in meta-analysis detected by a simple, graphical test
Egger, M., Smith, G. D., Schneider, M., & Minder, C. (1997) · BMJ · doi:10.1136/bmj.315.7109.629 · Cited by 56,722 · cited 4×
“134) tests approached significance for evidence of publication bias.(39,40) CHD indicates coronary heart disease; GL, glycemic load.”
BackgroundMethodInfluentialCochrane Handbook for Systematic Reviews of Interventions: Cochrane Book Series
(2008) · doi:10.1002/9780470712184 · Cited by 25,048
Meta-analysis of Observational Studies in Epidemiology<SUBTITLE>A Proposal for Reporting</SUBTITLE>
Stroup, D. F. (2000) · JAMA · doi:10.1001/jama.283.15.2008 · Cited by 20,623
Operating characteristics of a rank correlation test for publication bias
Begg, C. B., & Mazumdar, M. (1994) · Biometrics · doi:10.2307/2533446 · Cited by 16,955 · cited 4×
“134) tests approached significance for evidence of publication bias.(39,40) CHD indicates coronary heart disease; GL, glycemic load.”
BackgroundMethodInfluentialGlycemic index of foods: a physiological basis for carbohydrate exchange
Jenkins, D. J., Wolever, T. M., Taylor, R. H., Barker, H., Fielden, H., Baldwin, J. M., Bowling, A. C., Newman, H. C., Jenkins, A. L., & Goff, D. V. (1981) · The American Journal of Clinical Nutrition · doi:10.1093/ajcn/34.3.362 · Cited by 3,857 · cited 1×
“of a carbohydrate food compared with a reference carbohydrate food.(12) Over the last 3 decades, clinical trials have demonstrated that reducing the GI or glycemic load (GL), the product of GI and the available carbohydrate content of a food,(13) in the context of diets low in saturated fat, can improve CHD risk facto…”
BackgroundSelf-citationHigh-density lipoprotein cholesterol and cardiovascular disease. Four prospective American studies.
Gordon, D. J., Probstfield, J. L., Garrison, R. J., Neaton, J. D., Castelli, W. P., Knoke, J. D., Jacobs, D. R., Bangdiwala, S., & Tyroler, H. A. (1989) · Circulation · doi:10.1161/01.cir.79.1.8 · Cited by 3,162
International table of glycemic index and glycemic load values: 2002,
Foster-Powell, K., Holt, S. H., & Brand-Miller, J. C. (2002) · The American Journal of Clinical Nutrition · doi:10.1093/ajcn/76.1.5 · Cited by 3,080
Mensink, R. P., Zock, P. L., Kester, A. D., & Katan, M. B. (2003) · The American Journal of Clinical Nutrition · doi:10.1093/ajcn/77.5.1146 · Cited by 2,811
Cardiovascular disease risk profiles
Anderson, K. M., Odell, P. M., Wilson, P. W. F., & Kannel, W. B. (1991) · American Heart Journal · doi:10.1016/0002-8703(91)90861-b · Cited by 2,163
Overadjustment bias and unnecessary adjustment in epidemiologic studies.
Schisterman, E. F., Cole, S. R., & Platt, R. W. (2009) · Epidemiology · doi:10.1097/ede.0b013e3181a819a1 · Cited by 2,096 · cited 1×
“Another inherent limitation of observational analyses is the potential problem for residual confounding as well as the possibility of overadjusting, which remains an area of debate in epidemiology.(63) Perhaps, the most common limitation in meta-analyses of dietary studies is the combination of dietary data collected…”
Background
Cited by
Sorted by citations
Mozaffarian, D. (2016) · Circulation · doi:10.1161/circulationaha.115.018585 · Cited by 2,216
“%) comes from packaged foods and restaurants, and a minority from home cooking or table salt; whereas in Asian countries, most sodium comes from soy sauce and salt added during cooking or at the table.302 Nearly every country in the world exceeds the recommended mean national intake of 2000 mg/d.303 Sodium raises BP i…”
InfluentialCarbohydrate quality and human health: a series of systematic reviews and meta-analyses
Reynolds, A., Mann, J., Cummings, J., Winter, N., Mete, E., & Te Morenga, L. (2019) · The Lancet · doi:10.1016/s0140-6736(18)31809-9 · Cited by 1,630
Anderson, T. J., Grégoire, J., Pearson, G. J., Barry, A. R., Couture, P., Dawes, M., Francis, G. A., Genest, J., Grover, S., Gupta, M., et al. (2016) · Canadian Journal of Cardiology · doi:10.1016/j.cjca.2016.07.510 · Cited by 1,173
“…80 Dietary Approaches to Stop Hypertension (DASH) dietary pattern, 81 low-glycemic index/ glycemic load dietary pattern (Supplemental Table S3), 82 and vegetarian dietary pattern, 83 as well as dietary patterns high in nuts, 79,84 legumes, 84 olive oil, 79 fruits and vegetables, 85 total fi…”
BackgroundSelf-citationPearson, G. J., Thanassoulis, G., Anderson, T. J., Barry, A. R., Couture, P., Dayan, N., Francis, G. A., Genest, J. J., Grégoire, J. C., Grover, S. A., et al. (2021) · Canadian Journal of Cardiology · doi:10.1016/j.cjca.2021.03.016 · Cited by 900
Self-citationComparative Effectiveness of Weight-Loss Interventions in Clinical Practice
Appel, L. J., Clark, J. M., Yeh, H.-C., Wang, N.-Y., Coughlin, J. W., Daumit, G., Miller, E. R., Dalcin, A., Jerome, G. J., Geller, S., et al. (2011) · New England Journal of Medicine · doi:10.1056/nejmoa1108660 · Cited by 783
Metadata
- Authors
- Mirrahimi, A., de Souza, R. J., Chiavaroli, L., Sievenpiper, J. L., Beyene, J., Hanley, A. J., Augustin, L. S. A., Kendall, C. W. C., & Jenkins, D. J. A.
- Affiliations
- St. Michael's Hospital (CA)
- Clinical Nutrition and Risk Factor Modification Center, St. Michael's Hospital, Toronto, Ontario, Canada
- University of Toronto (CA)
- ORCID
- Venue
- Journal of the American Heart Association
- Published
- 2012-09-26
- Volume
- 1
- Issue
- 5
- Pages
- e000752-e000752
- ISSN
- 2047-9980 (ISSN-L)
- PMC
- PMC3541617
- OpenAlex
- W2170277419
- Semantic Scholar
- 47eb7760657e667e37984e210aefe8411be10287
- Cited by
- 161
- References
- 67
- Citations by year
- 2026: 3 · 2025: 4 · 2024: 10 · 2023: 8 · 2022: 13 · 2021: 10 · 2020: 13 · 2019: 11 · 2018: 12 · 2017: 16 · 2016: 17 · 2015: 11 · 2014: 25 · 2013: 7
- FWCI
- 2.14
- Type
- journal article
- Language
- en
- Open access
- gold
- doi.org
- Licence
- cc-by-nc
- Locations
- Journal of the American Heart Association (publishedVersion, cc-by-nc)
- PubMed Central (publishedVersion, cc-by)
- PubMed (publishedVersion)
- Topics
- Health Sciences › Medicine › Public Health, Environmental and Occupational Health › Nutritional Studies and Diet
- Health Sciences › Nursing › Nutrition and Dietetics › Food composition and properties
- Health Sciences › Medicine › Endocrinology, Diabetes and Metabolism › Diet, Metabolism, and Disease
- Keywords
- glycemic index, glycemic load, coronary artery disease, cardiovascular risk, sex differences, prospective cohort
- MeSH terms
- Coronary Disease, Humans, Risk Factors, Incidence, Glycemic Index
About these checks
Registry, retraction, Cites and statistics results are computed, not judged, with one exception: a printed reference that no index lists is read once by a model before it counts as a citation error. Claims are extracted by a model and kept only when their quote appears verbatim in the text; each cited source is then checked, with a model’s help, for whether it says what the claim relies on. Those verdicts can be wrong — read the claim’s quote and the cited source before relying on one.
A language model drew the claims from the paper on 2026-10-10, under version 3 of the claim definition (model deepseek-v4.1-flash, prompt extract-v3).
A second model labelled each claim on 2026-10-10 (model jev-1.13-20260917, definition revision gold-guideline-v0.2).
Statistics and arithmetic are recomputed, not judged.
Confidence bands are shown only for fields calibrated on our annotated test set. None is calibrated yet, so no band is shown.
What counts as a claim ›How we measure confidence ›How we check this ›
Are you an author, or do you see a problem with this page? Request a review
