

The DOI matches its Crossref record; 46 of the 46 references it cites were found in a registry or an index.
Selective Chemokine Receptor Usage by Central Nervous System Myeloid Cells in CCR2-Red Fluorescent Protein Knock-In Mice
Open accessAbstract
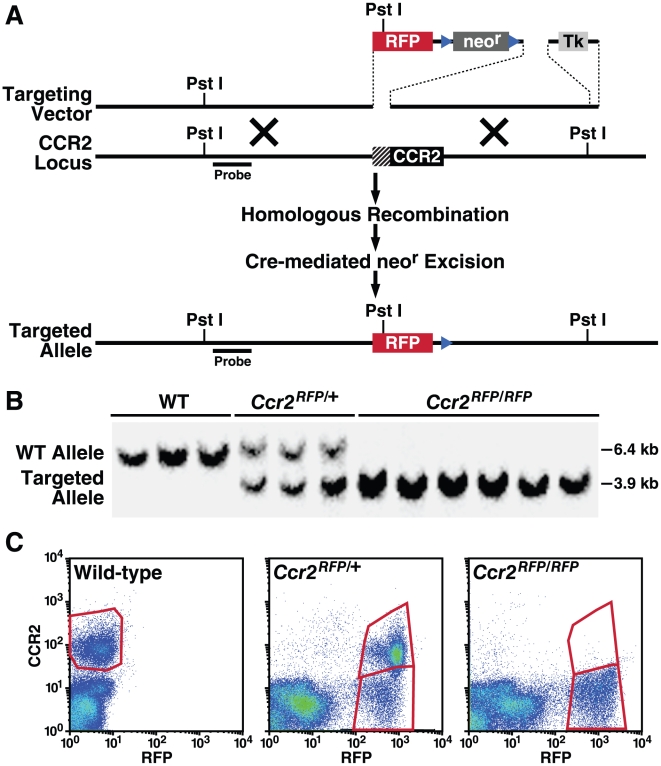
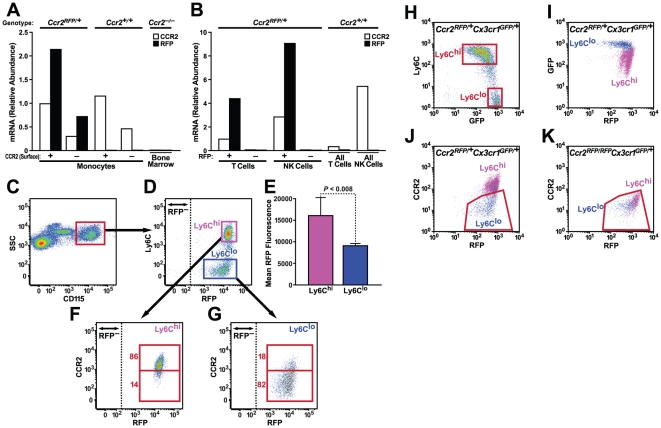
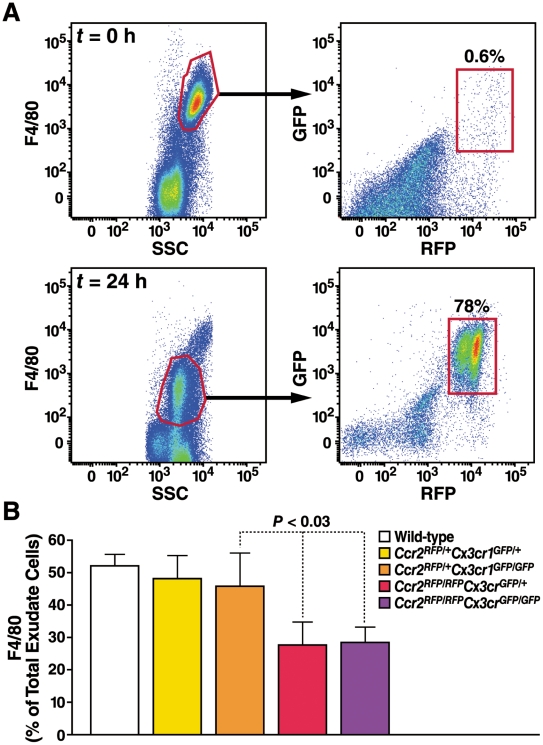
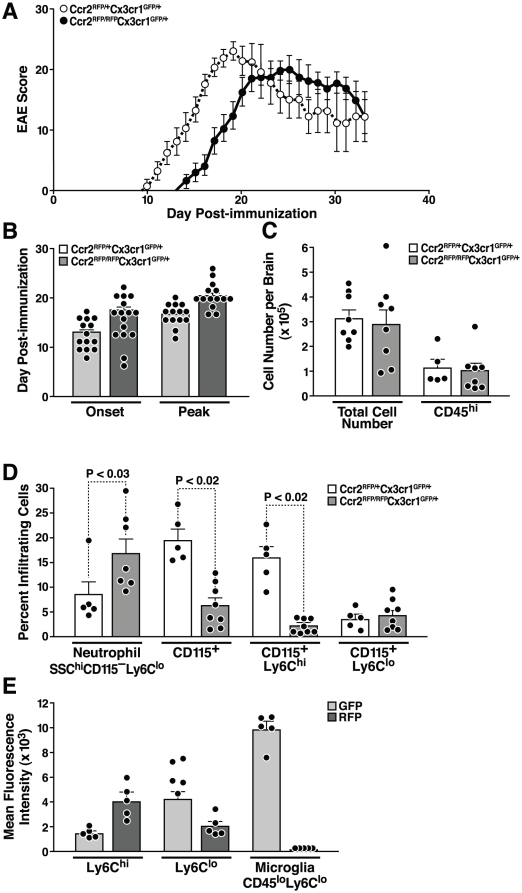
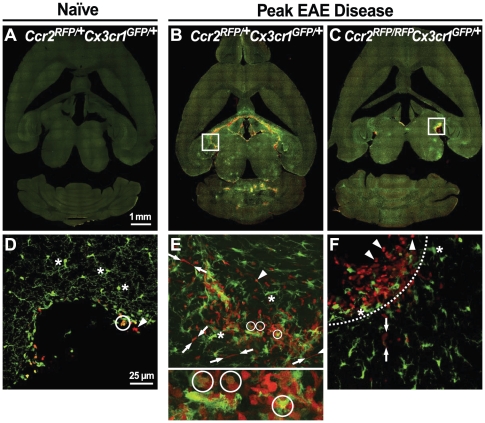
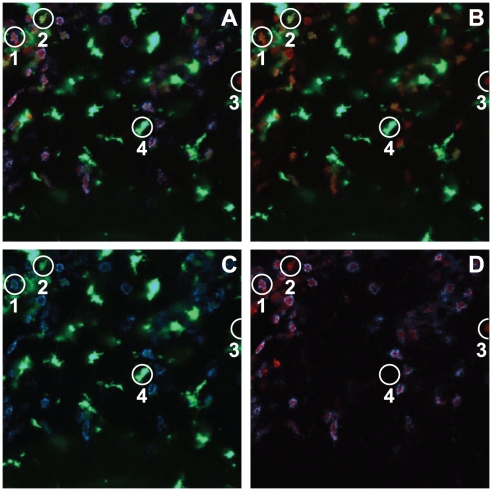
BACKGROUND: Monocyte subpopulations distinguished by differential expression of chemokine receptors CCR2 and CX3CR1 are difficult to track in vivo, partly due to lack of CCR2 reagents. METHODOLOGY/PRINCIPAL FINDINGS: We created CCR2-red fluorescent protein (RFP) knock-in mice and crossed them with CX3CR1-GFP mice to investigate monocyte subset trafficking. In mice with experimental autoimmune encephalomyelitis, CCR2 was critical for efficient intrathecal accumulation and localization of Ly6C(hi)/CCR2(hi) monocytes. Surprisingly, neutrophils, not Ly6C(lo) monocytes, largely replaced Ly6C(hi) cells in the central nervous system of these mice. CCR2-RFP expression allowed the first unequivocal distinction between infiltrating monocytes/macrophages from resident microglia. CONCLUSION/SIGNIFICANCE: These results refine the concept of monocyte subsets, provide mechanistic insight about monocyte entry into the central nervous system, and present a novel model for imaging and quantifying inflammatory myeloid populations.
Overview
The claims and statistics of this paper haven’t been checked yet.
Run the check — free, no account needed. It reads the open-access text and checks the sources it cites.
Integrity signals
Registry
Cites
Statistics
Figures
Verification
Claims the paper makes
The claims and statistics of this paper haven’t been checked yet.
Run the check — free, no account needed. It reads the open-access text and checks the sources it cites.
Claims other papers make about this one
Each is checked against this paper’s own text: does it say what the citing paper says it does?
The source backs part of the claim, not all of it — or backs it for a different population, condition or comparison.
In the citing paper
“When F4/80+ macrophages were isolated from CNS and analyzed by flow cytometry using cells from double-heterozygous Ccr2rfp::Cx3cr1gfp mice with EAE, GFP was expressed by CD45dim/Ly6C− microglia, whereas RFP was restricted to CD45high/Ly6C+ monocytes (Saederup et al., 2010; Mizutani et al., 2012).”
From Differential roles of microglia and monocytes in the inflamed central nervous system (2014) · cites this paper as Saederup et al., 2010
Experimental — accuracy not yet measuredThe source backs part of the claim, not all of it — or backs it for a different population, condition or comparison.
In the citing paper
“To address the role of MDMs in demyelination at EAE onset, we investigated clinical characteristics in relation to node pathology and demyelination in Ccr2rfp/rfp::Cx3cr1gfp/+ mice in which MDMs were virtually absent from inflamed EAE tissues and replaced in large part by neutrophils (Saederup et al., 2010).”
From Differential roles of microglia and monocytes in the inflamed central nervous system (2014) · cites this paper as Saederup et al., 2010
Experimental — accuracy not yet measuredThe source backs part of the claim, not all of it — or backs it for a different population, condition or comparison.
In the citing paper
“CCR2+Ly6C+ cells constitute the vast majority of infiltrating monocytes at EAE onset (Saederup et al., 2010; Mizutani et al., 2012).”
From Differential roles of microglia and monocytes in the inflamed central nervous system (2014) · cites this paper as Saederup et al., 2010
Experimental — accuracy not yet measuredThe source backs part of the claim, not all of it — or backs it for a different population, condition or comparison.
In the citing paper
“We took advantage of ccr2RFP∷ cx3cr1GFP double heterozygous mice 35 in which adult resident microglia exhibit a ccr2RFP−/cx3cr1GFP+ pattern35, 36, whereas peripheral monocytes, which are recruited in response to inflammation, are characterized by a ccr2RFP+/cx3cr1GFP− pattern35–37.”
From Social stress induces neurovascular pathology promoting depression (2017) · cites this paper as [35]
Experimental — accuracy not yet measuredThe cited source says what the claim attributes to it.
In the citing paper
“Microglia were labeled using the CX3CR1+/GFP mouse line in which all microglia express EGFP under the control of fractalkine receptor, CX3CR1, expression (Figure 1, S1, and S5) (Cardona et al., 2006; Jung et al., 2000; Saederup et al., 2010).”
From Microglia Sculpt Postnatal Neural Circuits in an Activity and Complement-Dependent Manner (2012) · cites this paper as Saederup et al., 2010
The cited source says what the claim attributes to it.
In the citing paper
“we found an increase in CD39−CD11bHi cells which express Ly6C (Fig. 7g) and which represent peripherally infiltrating monocytes9,12.”
From Identification of a unique TGF-β–dependent molecular and functional signature in microglia (2014) · cites this paper as [9]
The cited source says what the claim attributes to it.
In the citing paper
“microglia can be distinguished from monocytes using red-green mice in which microglia and monocyte-derived macrophages are labeled with CX3CR1 (GFP) and CCR2 (RFP) respectively9.”
From Identification of a unique TGF-β–dependent molecular and functional signature in microglia (2014) · cites this paper as [9]
Self-check
Percentages, sums and reported differences re-computed from the paper’s own numbers.
The self-check needs the paper’s full text.
Citations
Cites
Dendritic cells and the control of immunity
Banchereau, J., & Steinman, R. M. (1998) · Nature · doi:10.1038/32588 · Cited by 14,486
Monocyte and macrophage heterogeneity
Gordon, S., & Taylor, P. R. (2005) · Nature Reviews Immunology · doi:10.1038/nri1733 · Cited by 5,190
Blood Monocytes Consist of Two Principal Subsets with Distinct Migratory Properties
Geissmann, F., Jung, S., & Littman, D. R. (2003) · Immunity · doi:10.1016/s1074-7613(03)00174-2 · Cited by 3,504
Jung, S., Aliberti, J., Graemmel, P., Sunshine, M. J., Kreutzberg, G. W., Sher, A., & Littman, D. R. (2000) · Molecular and Cellular Biology · doi:10.1128/mcb.20.11.4106-4114.2000 · Cited by 2,632
The many roles of chemokines and chemokine receptors in inflammation
Charo, I. F., & Ransohoff, R. M. (2006) · New England Journal of Medicine · doi:10.1056/nejmra052723 · Cited by 2,523
Self-citationA monomeric red fluorescent protein
Campbell, R. E., Tour, O., Palmer, A. E., Steinbach, P. A., Baird, G. S., Zacharias, D. A., & Tsien, R. Y. (2002) · Proceedings of the National Academy of Sciences · doi:10.1073/pnas.082243699 · Cited by 2,346
Nahrendorf, M., Swirski, F. K., Aikawa, E., Stangenberg, L., Wurdinger, T., Figueiredo, J.-L., Libby, P., Weissleder, R., & Pittet, M. J. (2007) · The Journal of Experimental Medicine · doi:10.1084/jem.20070885 · Cited by 2,300
Monitoring of Blood Vessels and Tissues by a Population of Monocytes with Patrolling Behavior
Auffray, C., Fogg, D., Garfa, M., Elain, G., Join-Lambert, O., Kayal, S., Sarnacki, S., Cumano, A., Lauvau, G., & Geissmann, F. (2007) · Science · doi:10.1126/science.1142883 · Cited by 1,973
Blood Monocytes: Development, Heterogeneity, and Relationship with Dendritic Cells
Auffray, C., Sieweke, M. H., & Geissmann, F. (2009) · Annual Review of Immunology · doi:10.1146/annurev.immunol.021908.132557 · Cited by 1,745
Serbina, N. V., & Pamer, E. G. (2006) · Nature Immunology · doi:10.1038/ni1309 · Cited by 1,658
Cited by
Sorted by citations
Microglia Sculpt Postnatal Neural Circuits in an Activity and Complement-Dependent Manner
Schafer, D. P., Lehrman, E. K., Kautzman, A. G., Koyama, R., Mardinly, A. R., Yamasaki, R., Ransohoff, R. M., Greenberg, M. E., Barres, B. A., & Stevens, B. (2012) · Neuron · doi:10.1016/j.neuron.2012.03.026 · Cited by 4,089
“Microglia were labeled using the CX3CR1+/GFP mouse line in which all microglia express EGFP under the control of fractalkine receptor, CX3CR1, expression (Figure 1 and see Figures S1 and S5 available online; Cardona et al., 2006; Jung et al., 2000; Saederup et al., 2010).”
Self-citationMonocyte recruitment during infection and inflammation
Shi, C., & Pamer, E. G. (2011) · Nature Reviews Immunology · doi:10.1038/nri3070 · Cited by 3,015
Identification of a unique TGF-β–dependent molecular and functional signature in microglia
Butovsky, O., Jedrychowski, M. P., Moore, C. S., Cialic, R., Lanser, A. J., Gabriely, G., Koeglsperger, T., Dake, B., Wu, P. M., Doykan, C. E., et al. (2014) · Nature Neuroscience · doi:10.1038/nn.3599 · Cited by 2,543
Self-citationPD-1 expression by tumour-associated macrophages inhibits phagocytosis and tumour immunity
Gordon, S. R., Maute, R. L., Dulken, B. W., Hutter, G., George, B. M., McCracken, M. N., Gupta, R., Tsai, J. M., Sinha, R., Corey, D., et al. (2017) · Nature · doi:10.1038/nature22396 · Cited by 2,247
Elmore, M. R. P., Najafi, A. R., Koike, M. A., Dagher, N. N., Spangenberg, E. E., Rice, R. A., Kitazawa, M., Matusow, B., Nguyen, H., West, B. L., et al. (2014) · Neuron · doi:10.1016/j.neuron.2014.02.040 · Cited by 1,968
New tools for studying microglia in the mouse and human CNS
Bennett, M. L., Bennett, F. C., Liddelow, S. A., Ajami, B., Zamanian, J. L., Fernhoff, N. B., Mulinyawe, S. B., Bohlen, C. J., Adil, A., Tucker, A., et al. (2016) · Proceedings of the National Academy of Sciences · doi:10.1073/pnas.1525528113 · Cited by 1,804
M2 microglia and macrophages drive oligodendrocyte differentiation during CNS remyelination
Miron, V. E., Boyd, A., Zhao, J.-W., Yuen, T. J., Ruckh, J. M., Shadrach, J. L., van Wijngaarden, P., Wagers, A. J., Williams, A., Franklin, R. J. M., et al. (2013) · Nature Neuroscience · doi:10.1038/nn.3469 · Cited by 1,777
The role of microglia and macrophages in glioma maintenance and progression
Hambardzumyan, D., Gutmann, D. H., & Kettenmann, H. (2016) · Nature Neuroscience · doi:10.1038/nn.4185 · Cited by 1,683
Bain, C. C., Bravo-Blas, A., Scott, C. L., Gomez Perdiguero, E., Geissmann, F., Henri, S., Malissen, B., Osborne, L. C., Artis, D., & Mowat, A. M. (2014) · Nature Immunology · doi:10.1038/ni.2967 · Cited by 1,178
Microenvironment-induced PTEN loss by exosomal microRNA primes brain metastasis outgrowth
Zhang, L., Zhang, S., Yao, J., Lowery, F. J., Zhang, Q., Huang, W.-C., Li, P., Li, M., Wang, X., Zhang, C., et al. (2015) · Nature · doi:10.1038/nature15376 · Cited by 1,175
Yang, J., Zhang, L., Yu, C., Yang, X.-F., & Wang, H. (2014) · Biomarker Research · doi:10.1186/2050-7771-2-1 · Cited by 1,099
Infiltrating monocytes trigger EAE progression, but do not contribute to the resident microglia pool
Ajami, B., Bennett, J. L., Krieger, C., McNagny, K. M., & Rossi, F. M. V. (2011) · Nature Neuroscience · doi:10.1038/nn.2887 · Cited by 1,061
Social stress induces neurovascular pathology promoting depression
Menard, C., Pfau, M. L., Hodes, G. E., Kana, V., Wang, V. X., Bouchard, S., Takahashi, A., Flanigan, M. E., Aleyasin, H., LeClair, K. B., et al. (2017) · Nature Neuroscience · doi:10.1038/s41593-017-0010-3 · Cited by 1,028
Innate immune memory in the brain shapes neurological disease hallmarks
Wendeln, A.-C., Degenhardt, K., Kaurani, L., Gertig, M., Ulas, T., Jain, G., Wagner, J., Häsler, L. M., Wild, K., Skodras, A., et al. (2018) · Nature · doi:10.1038/s41586-018-0023-4 · Cited by 956
Zhou, W., Ke, S. Q., Huang, Z., Flavahan, W., Fang, X., Paul, J., Wu, L., Sloan, A. E., McLendon, R. E., Li, X., et al. (2015) · Nature Cell Biology · doi:10.1038/ncb3090 · Cited by 940
Inflammation in CNS neurodegenerative diseases
Stephenson, J., Nutma, E., van der Valk, P., & Amor, S. (2018) · Immunology · doi:10.1111/imm.12922 · Cited by 966
Differential roles of microglia and monocytes in the inflamed central nervous system
Yamasaki, R., Lu, H., Butovsky, O., Ohno, N., Rietsch, A. M., Cialic, R., Wu, P. M., Doykan, C. E., Lin, J., Cotleur, A. C., et al. (2014) · Journal of Experimental Medicine · doi:10.1084/jem.20132477 · Cited by 856
Self-citationGlia–neuron interactions in the mammalian retina
Vecino, E., Rodriguez, F. D., Ruzafa, N., Pereiro, X., & Sharma, S. C. (2015) · Progress in Retinal and Eye Research · doi:10.1016/j.preteyeres.2015.06.003 · Cited by 863
Microglia in the TBI brain: The good, the bad, and the dysregulated
Loane, D. J., & Kumar, A. (2015) · Experimental Neurology · doi:10.1016/j.expneurol.2015.08.018 · Cited by 846
Shechter, R., Miller, O., Yovel, G., Rosenzweig, N., London, A., Ruckh, J., Kim, K.-W., Klein, E., Kalchenko, V., Bendel, P., et al. (2013) · Immunity · doi:10.1016/j.immuni.2013.02.012 · Cited by 683
Heterogeneity of CNS myeloid cells and their roles in neurodegeneration
Prinz, M., Priller, J., Sisodia, S. S., & Ransohoff, R. M. (2011) · Nature Neuroscience · doi:10.1038/nn.2923 · Cited by 674
The contribution of astrocytes and microglia to traumatic brain injury
Karve, I. P., Taylor, J. M., & Crack, P. J. (2015) · British Journal of Pharmacology · doi:10.1111/bph.13125 · Cited by 675
Chang, A. L., Miska, J., Wainwright, D. A., Dey, M., Rivetta, C. V., Yu, D., Kanojia, D., Pituch, K. C., Qiao, J., Pytel, P., et al. (2016) · Cancer Research · doi:10.1158/0008-5472.can-16-0144 · Cited by 640
The role of peripheral immune cells in the CNS in steady state and disease
Prinz, M., & Priller, J. (2017) · Nature Neuroscience · doi:10.1038/nn.4475 · Cited by 657
Valdearcos, M., Robblee, M. M., Benjamin, D. I., Nomura, D. K., Xu, A. W., & Koliwad, S. K. (2014) · Cell Reports · doi:10.1016/j.celrep.2014.11.018 · Cited by 629
Hagemeyer, N., Hanft, K.-M., Akriditou, M.-A., Unger, N., Park, E. S., Stanley, E. R., Staszewski, O., Dimou, L., & Prinz, M. (2017) · Acta Neuropathologica · doi:10.1007/s00401-017-1747-1 · Cited by 558
Resolving postoperative neuroinflammation and cognitive decline
Terrando, N., Eriksson, L. I., Ryu, J. K., Yang, T., Monaco, C. G., Feldmann, M., Fagerlund, M. J., Charo, I. F., Akassoglou, K., & Maze, M. (2011) · Annals of Neurology · doi:10.1002/ana.22664 · Cited by 582
Self-citationWohleb, E. S., Powell, N. D., Godbout, J. P., & Sheridan, J. F. (2013) · The Journal of Neuroscience · doi:10.1523/jneurosci.1671-13.2013 · Cited by 563
Davalos, D., Kyu Ryu, J., Merlini, M., Baeten, K. M., Le Moan, N., Petersen, M. A., Deerinck, T. J., Smirnoff, D. S., Bedard, C., Hakozaki, H., et al. (2012) · Nature Communications · doi:10.1038/ncomms2230 · Cited by 568
An acute immune response underlies the benefit of cardiac stem cell therapy
Vagnozzi, R. J., Maillet, M., Sargent, M. A., Khalil, H., Johansen, A. K. Z., Schwanekamp, J. A., York, A. J., Huang, V. H., Nahrendorf, M., Sadayappan, S., et al. (2019) · Nature · doi:10.1038/s41586-019-1802-2 · Cited by 557
Glioblastoma: defining tumor niches
Hambardzumyan, D., & Bergers, G. (2015) · Trends in Cancer · doi:10.1016/j.trecan.2015.10.009 · Cited by 522
Lewis, K. L. T., Caton, M. L., Bogunovic, M., Greter, M., Grajkowska, L. T., Ng, D., Klinakis, A., Charo, I. F., Jung, S., Gommerman, J. L., et al. (2011) · Immunity · doi:10.1016/j.immuni.2011.08.013 · Cited by 557
Self-citationCCR2 recruits an inflammatory macrophage subpopulation critical for angiogenesis in tissue repair
Willenborg, S., Lucas, T., van Loo, G., Knipper, J. A., Krieg, T., Haase, I., Brachvogel, B., Hammerschmidt, M., Nagy, A., Ferrara, N., et al. (2012) · Blood · doi:10.1182/blood-2012-01-403386 · Cited by 534
A combination of ontogeny and CNS environment establishes microglial identity
Bennett, F. C., Bennett, M. L., Yaqoob, F., Mulinyawe, S. B., Grant, G. A., Hayden Gephart, M., Plowey, E. D., & Barres, B. A. (2018) · Neuron · doi:10.1016/j.neuron.2018.05.014 · Cited by 524
Yu, X., Liu, H., Hamel, K. A., Morvan, M. G., Yu, S. W., Leff, J., Guan, Z., Braz, J. M., & Basbaum, A. I. (2020) · Nature Communications · doi:10.1038/s41467-019-13839-2 · Cited by 508
Sublime Microglia: Expanding Roles for the Guardians of the CNS
Salter, M. W., & Beggs, S. (2014) · Cell · doi:10.1016/j.cell.2014.06.008 · Cited by 531
The Cytokine GM-CSF Drives the Inflammatory Signature of CCR2+ Monocytes and Licenses Autoimmunity
Croxford, A. L., Lanzinger, M., Hartmann, F. J., Schreiner, B., Mair, F., Pelczar, P., Clausen, B. E., Jung, S., Greter, M., & Becher, B. (2015) · Immunity · doi:10.1016/j.immuni.2015.08.010 · Cited by 484
Modulating inflammatory monocytes with a unique microRNA gene signature ameliorates murine ALS
Butovsky, O., Siddiqui, S., Gabriely, G., Lanser, A. J., Dake, B., Murugaiyan, G., Doykan, C. E., Wu, P. M., Gali, R. R., Iyer, L. K., et al. (2012) · Journal of Clinical Investigation · doi:10.1172/jci62636 · Cited by 481
Macrophages in inflammatory multiple sclerosis lesions have an intermediate activation status
Vogel, D. Y., Vereyken, E. J., Glim, J. E., Heijnen, P. D., Moeton, M., van der Valk, P., Amor, S., Teunissen, C. E., van Horssen, J., & Dijkstra, C. D. (2013) · Journal of Neuroinflammation · doi:10.1186/1742-2094-10-35 · Cited by 479
Valdearcos, M., Douglass, J. D., Robblee, M. M., Dorfman, M. D., Stifler, D. R., Bennett, M. L., Gerritse, I., Fasnacht, R., Barres, B. A., Thaler, J. P., et al. (2017) · Cell Metabolism · doi:10.1016/j.cmet.2017.05.015 · Cited by 477
Dal-Secco, D., Wang, J., Zeng, Z., Kołaczkowska, E., Wong, C. H. Y., Petri, B., Ransohoff, R. M., Charo, I. F., Jenne, C. N., & Kubes, P. (2015) · The Journal of Experimental Medicine · doi:10.1084/jem.20141539 · Cited by 464
Self-citationMicroglial phagocytosis of living photoreceptors contributes to inherited retinal degeneration
Zhao, L., Zabel, M. K., Wang, X., Ma, W., Shah, P., Fariss, R. N., Qian, H., Parkhurst, C. N., Gan, W., & Wong, W. T. (2015) · EMBO Molecular Medicine · doi:10.15252/emmm.201505298 · Cited by 457
Microglia-organized scar-free spinal cord repair in neonatal mice
Li, Y., He, X., Kawaguchi, R., Zhang, Y., Wang, Q., Monavarfeshani, A., Yang, Z., Chen, B., Shi, Z., Meng, H., et al. (2020) · Nature · doi:10.1038/s41586-020-2795-6 · Cited by 443
Szulzewsky, F., Pelz, A., Feng, X., Synowitz, M., Markovic, D. S., Langmann, T., Holtman, I. R., Wang, X., Eggen, B. J. L., Boddeke, H. W. G. M., et al. (2015) · PLoS ONE · doi:10.1371/journal.pone.0116644 · Cited by 401
The pro-remyelination properties of microglia in the central nervous system
Lloyd, A. F., & Miron, V. E. (2019) · Nature Reviews Neurology · doi:10.1038/s41582-019-0184-2 · Cited by 381
Burguillos, M. A., Svensson, M., Schulte, T., Boza-Serrano, A., Garcia-Quintanilla, A., Kavanagh, E., Santiago, M., Viceconte, N., Oliva-Martin, M. J., Osman, A. M., et al. (2015) · Cell Reports · doi:10.1016/j.celrep.2015.02.012 · Cited by 365
Varvel, N. H., Neher, J. J., Bosch, A., Wang, W., Ransohoff, R. M., Miller, R. J., & Dingledine, R. (2016) · Proceedings of the National Academy of Sciences · doi:10.1073/pnas.1604263113 · Cited by 357
Self-citationMacrophages: An Inflammatory Link Between Angiogenesis and Lymphangiogenesis
Corliss, B. A., Azimi, M. S., Munson, J. M., Peirce, S. M., & Murfee, W. L. (2016) · Microcirculation · doi:10.1111/micc.12259 · Cited by 356
Microglia and ischemic stroke: a double-edged sword.
Patel, A. R., Ritzel, R. M., McCullough, L. D., & Liu, F. (2013) · Europe PMC (PubMed Central) · Cited by 355
Wattananit, S., Tornero, D., Graubardt, N., Memanishvili, T., Monni, E., Tatarishvili, J., Miskinyte, G., Ge, R., Ahlenius, H., Lindvall, O., et al. (2016) · Journal of Neuroscience · doi:10.1523/jneurosci.4317-15.2016 · Cited by 362
Mizutani, M., Pino, P. A., Saederup, N., Charo, I. F., Ransohoff, R. M., & Cardona, A. E. (2012) · The Journal of Immunology · doi:10.4049/jimmunol.1100421 · Cited by 346
Self-citationYan, Z., Gibson, S. A., Buckley, J. A., Qin, H., & Benveniste, E. N. (2018) · Clinical Immunology · doi:10.1016/j.clim.2016.09.014 · Cited by 318
Macrophages in spinal cord injury: Phenotypic and functional change from exposure to myelin debris
Wang, X., Cao, K., Sun, X., Chen, Y., Duan, Z., Sun, L., Guo, L., Bai, P., Sun, D., Fan, J., et al. (2015) · Glia · doi:10.1002/glia.22774 · Cited by 288
Studying the mononuclear phagocyte system in the molecular age
Chow, A. T., Brown, B. D., & Mérad, M. (2011) · Nature reviews. Immunology · doi:10.1038/nri3087 · Cited by 330
Sennlaub, F., Auvynet, C., Calippe, B., Lavalette, S., Poupel, L., Hu, S. J., Dominguez, E., Camelo, S., Levy, O., Guyon, E., et al. (2013) · EMBO Molecular Medicine · doi:10.1002/emmm.201302692 · Cited by 325
Self-citationMicroglial Dysregulation in Psychiatric Disease
Frick, L. R., Williams, K., & Pittenger, C. (2013) · Clinical and Developmental Immunology · doi:10.1155/2013/608654 · Cited by 299
Repeated Social Defeat, Neuroinflammation, and Behavior: Monocytes Carry the Signal
Weber, M. D., Godbout, J. P., & Sheridan, J. F. (2017) · Neuropsychopharmacology · doi:10.1038/npp.2016.102 · Cited by 283
London, A., Cohen, M., & Schwartz, M. (2013) · Frontiers in Cellular Neuroscience · doi:10.3389/fncel.2013.00034 · Cited by 282
The origin, fate, and contribution of macrophages to spinal cord injury pathology
Milich, L. M., Ryan, C. B., & Lee, J. K. (2019) · Acta Neuropathologica · doi:10.1007/s00401-019-01992-3 · Cited by 290
Macrophage subsets and microglia in multiple sclerosis
Bogie, J. F. J., Stinissen, P., & Hendriks, J. J. A. (2014) · Acta Neuropathologica · doi:10.1007/s00401-014-1310-2 · Cited by 251
Ryu, J. K., Petersen, M. A., Murray, S. G., Baeten, K. M., Meyer-Franke, A., Chan, J. P., Vagena, E., Bedard, C., Machado, M. R., Coronado, P. E. R., et al. (2015) · Nature Communications · doi:10.1038/ncomms9164 · Cited by 271
Self-citationYing, W., Lee, Y. S., Dong, Y. W., Seidman, J. S., Yang, M., Isaac, R., Seo, J. B., Yang, B.-H., Wollam, J., Riopel, M., et al. (2018) · Cell Metabolism · doi:10.1016/j.cmet.2018.12.003 · Cited by 281
Recruited Monocytes and Type 2 Immunity Promote Lung Regeneration following Pneumonectomy
Lechner, A. J., Driver, I. H., Lee, J., Conroy, C., Nagle, A., Locksley, R. M., & Rock, J. R. (2017) · Cell stem cell · doi:10.1016/j.stem.2017.03.024 · Cited by 261
Sierro, F., Evrard, M., Rizzetto, S., Melino, M., Mitchell, A. J., Flórido, M., Beattie, L., Walters, S. B., Tay, S. S., Lü, B., et al. (2017) · Immunity · doi:10.1016/j.immuni.2017.07.018 · Cited by 267
Microglia are effector cells of CD47-SIRPα antiphagocytic axis disruption against glioblastoma
Hütter, G., Theruvath, J. L., Graef, C. M., Zhang, M., Schoen, M. K., Manz, E.-M., Bennett, M. L., Olson, A., Azad, T. D., Sinha, R., et al. (2019) · Proceedings of the National Academy of Sciences · doi:10.1073/pnas.1721434116 · Cited by 253
The role of microglia and myeloid immune cells in acute cerebral ischemia
Benakis, C., García‐Bonilla, L., Iadecola, C., & Anrather, J. (2015) · Frontiers in Cellular Neuroscience · doi:10.3389/fncel.2014.00461 · Cited by 259
Glioblastoma-associated microglia and macrophages: targets for therapies to improve prognosis
Poon, C. C., Sarkar, S., Yong, V. W., & Kelly, J. J. (2017) · Brain · doi:10.1093/brain/aww355 · Cited by 246
O’Koren, E. G., Mathew, R., & Saban, D. R. (2016) · Scientific Reports · doi:10.1038/srep20636 · Cited by 220
Microglial repopulation model reveals a robust homeostatic process for replacing CNS myeloid cells
Varvel, N. H., Grathwohl, S. A., Baumann, F., Liebig, C., Bosch, A., Brawek, B., Thal, D. R., Charo, I. F., Heppner, F. L., Aguzzi, A., et al. (2012) · Proceedings of the National Academy of Sciences · doi:10.1073/pnas.1210150109 · Cited by 245
Self-citationHarms, A. S., Thome, A. D., Yan, Z., Schonhoff, A. M., Williams, G. P., Li, X., Liu, Y., Qin, H., Benveniste, E. N., & Standaert, D. G. (2018) · Experimental Neurology · doi:10.1016/j.expneurol.2017.11.010 · Cited by 236
Morganti, J. M., Jopson, T. D., Liu, S., Riparip, L.-K., Guandique, C. K., Gupta, N., Ferguson, A. R., & Rosi, S. (2015) · The Journal of Neuroscience · doi:10.1523/jneurosci.2405-14.2015 · Cited by 253
Resident cardiac macrophages mediate adaptive myocardial remodeling
Wong, N. R., Mohan, J., Kopecky, B. J., Guo, S., Du, L., Leid, J. M., Feng, G., Lokshina, I., Dmytrenko, O., Luehmann, H. P., et al. (2021) · Immunity · doi:10.1016/j.immuni.2021.07.003 · Cited by 239
Wohleb, E. S., McKim, D. B., Sheridan, J. F., & Godbout, J. P. (2015) · Frontiers in Neuroscience · doi:10.3389/fnins.2014.00447 · Cited by 420
Shechter, R., & Schwartz, M. (2012) · The Journal of Pathology · doi:10.1002/path.4106 · Cited by 237
Kamphuis, W., Kooijman, L., Schetters, S., Orre, M., & Hol, E. M. (2016) · Biochimica et Biophysica Acta (BBA) - Molecular Basis of Disease · doi:10.1016/j.bbadis.2016.07.007 · Cited by 209
Fibrin-targeting immunotherapy protects against neuroinflammation and neurodegeneration
Ryu, J. K., Rafalski, V. A., Meyer-Franke, A., Adams, R. A., Poda, S. B., Rios Coronado, P. E., Pedersen, L. Ø., Menon, V., Baeten, K. M., Sikorski, S. L., et al. (2018) · Nature Immunology · doi:10.1038/s41590-018-0232-x · Cited by 213
Fan, H., Tang, H., Shan, L., Liu, S.-C., Huang, D., Chen, X., Chen, Z., Yang, M., Yin, X., Yang, H., et al. (2019) · Journal of Neuroinflammation · doi:10.1186/s12974-019-1613-2 · Cited by 219
Gu, N., Peng, J., Murugan, M., Wang, X., Eyo, U. B., Sun, D., Ren, Y., DiCicco-Bloom, E., Young, W., Dong, H., et al. (2016) · Cell Reports · doi:10.1016/j.celrep.2016.06.018 · Cited by 212
“CCR2:CX3CR1 mice were generated by crossbreeding CCR2 mice (Saederup et al., 2010) with CX3CR1 mice (Jung et al.”
InfluentialThe immunology of neurodegeneration
Czirr, E., & Wyss‐Coray, T. (2012) · Journal of Clinical Investigation · doi:10.1172/jci58656 · Cited by 218
P2Y12 expression and function in alternatively activated human microglia
Moore, C. S., Ase, A. R., Kinsara, A., Rao, V. T. S., Michell-Robinson, M., Leong, S. Y., Butovsky, O., Ludwin, S. K., Séguéla, P., Bar-Or, A., et al. (2015) · Neurology Neuroimmunology & Neuroinflammation · doi:10.1212/nxi.0000000000000080 · Cited by 212
Evans, T. A., Barkauskas, D. S., Myers, J., Hare, E. G., You, J., Ransohoff, R. M., Huang, A. Y.-C., & Silver, J. (2014) · Experimental Neurology · doi:10.1016/j.expneurol.2014.01.013 · Cited by 217
Self-citationTranscriptional profiling and therapeutic targeting of oxidative stress in neuroinflammation
Mendiola, A. S., Ryu, J. K., Bardehle, S., Meyer-Franke, A., Ang, K. K.-H., Wilson, C., Baeten, K. M., Hanspers, K., Merlini, M., Thomas, S., et al. (2020) · Nature Immunology · doi:10.1038/s41590-020-0654-0 · Cited by 199
The Role of Microglia and Macrophages in CNS Homeostasis, Autoimmunity, and Cancer
Yin, J., Valin, K. L., Dixon, M. L., & Leavenworth, J. W. (2017) · Journal of Immunology Research · doi:10.1155/2017/5150678 · Cited by 215
Functional diversity of microglia – how heterogeneous are they to begin with?
Hanisch, U.-K. (2013) · Frontiers in Cellular Neuroscience · doi:10.3389/fncel.2013.00065 · Cited by 195
Macrophages and CNS remyelination
Miron, V. E., & Franklin, R. J. M. (2014) · Journal of Neurochemistry · doi:10.1111/jnc.12705 · Cited by 206
Hammond, M. D., Taylor, R. A., Mullen, M. T., Ai, Y., Aguila, H. L., Mack, M., Kasner, S. E., McCullough, L. D., & Sansing, L. H. (2014) · The Journal of Neuroscience · doi:10.1523/jneurosci.4070-13.2014 · Cited by 226
Nemes-Baran, A. D., White, D. R., & DeSilva, T. M. (2020) · Cell Reports · doi:10.1016/j.celrep.2020.108047 · Cited by 196
Macrophages: A double-edged sword in experimental autoimmune encephalomyelitis
Jiang, Z., Jiang, J., & Zhang, G. (2014) · Immunology Letters · doi:10.1016/j.imlet.2014.03.006 · Cited by 205
On phagocytes and macular degeneration
Guillonneau, X., Eandi, C. M., Paques, M., Sahel, J.-A., Sapieha, P., & Sennlaub, F. (2017) · Progress in Retinal and Eye Research · doi:10.1016/j.preteyeres.2017.06.002 · Cited by 185
β-amyloid, microglia, and the inflammasome in Alzheimer’s disease
Gold, M., & El Khoury, J. (2015) · Seminars in Immunopathology · doi:10.1007/s00281-015-0518-0 · Cited by 187
The innate immune system in demyelinating disease
Mayo, L., Quintana, F. J., & Weiner, H. L. (2012) · Immunological Reviews · doi:10.1111/j.1600-065x.2012.01135.x · Cited by 192
Au, N. P. B., & Ma, C. H. E. (2022) · Frontiers in Immunology · doi:10.3389/fimmu.2022.860070 · Cited by 192
Microglial Phenotype and Adaptation
Eggen, B. J. L., Raj, D. D. A., Hanisch, U., & Boddeke, H. W. G. M. (2013) · Journal of Neuroimmune Pharmacology · doi:10.1007/s11481-013-9490-4 · Cited by 187
Lindborg, J. A., Mack, M., & Zigmond, R. E. (2017) · Journal of Neuroscience · doi:10.1523/jneurosci.2085-17.2017 · Cited by 190
Gata6+ Pericardial Cavity Macrophages Relocate to the Injured Heart and Prevent Cardiac Fibrosis
Deniset, J. F., Belke, D., Lee, W.-Y., Jorch, S. K., Deppermann, C., Hassanabad, A. F., Turnbull, J. D., Teng, G., Rozich, I., Hudspeth, K., et al. (2019) · Immunity · doi:10.1016/j.immuni.2019.06.010 · Cited by 178
Guo, X., Xue, H., Shao, Q., Wang, J., Guo, X., Chen, X., Zhang, J., Xu, S., Li, T., Zhang, P., et al. (2016) · Oncotarget · doi:10.18632/oncotarget.11825 · Cited by 172
Role of CCR2 in Inflammatory Conditions of the Central Nervous System
Chu, H. X., Arumugam, T. V., Gelderblom, M., Magnus, T. U., Drummond, G. R., & Sobey, C. G. (2014) · Journal of Cerebral Blood Flow & Metabolism · doi:10.1038/jcbfm.2014.120 · Cited by 179
Microglia versus Monocytes: Distinct Roles in Degenerative Diseases of the Retina
Chen, Y., Roubeix, C., Sennlaub, F., & Saban, D. R. (2020) · Trends in Neurosciences · doi:10.1016/j.tins.2020.03.012 · Cited by 169
Degos, V., Vacas, S., Han, Z., van Rooijen, N., Gressèns, P., Su, H., Young, W. L., & Maze, M. (2013) · Anesthesiology · doi:10.1097/aln.0b013e3182834d94 · Cited by 163
Hsieh, C. L., Niemi, E. C., Wang, S. H., Lee, C. C., Bingham, D., Zhang, J., Cozen, M. L., Charo, I., Huang, E. J., Liu, J., et al. (2014) · Journal of Neurotrauma · doi:10.1089/neu.2013.3252 · Cited by 174
Self-citation
Metadata
- Authors
- Saederup, N., Cardona, A. E., Croft, K., Mizutani, M., Cotleur, A. C., Tsou, C.-L., Ransohoff, R. M., & Charo, I. F.
- Affiliations
- Gladstone Institutes (US)
- Cleveland Clinic (US)
- Corresponding author
- Ransohoff, Richard M.
- Charo, Israel F.
- Venue
- PLoS ONE
- Publisher
- Public Library of Science (PLoS)
- Published
- 2010-10-27
- Volume
- 5
- Issue
- 10
- Pages
- e13693
- ISSN
- 1932-6203 (ISSN-L)
- PMC
- PMC2965160
- OpenAlex
- W2104003768
- Cited by
- 599
- References
- 46
- Citations by year
- 2026: 19 · 2025: 28 · 2024: 60 · 2023: 32 · 2022: 22 · 2021: 38 · 2020: 49 · 2019: 54 · 2018: 42 · 2017: 51 · 2016: 44 · 2015: 49 · 2014: 46 · 2013: 30 · 2012: 17
- FWCI
- 9.81
- Type
- journal article
- Language
- en
- Update notices
- correction (2017-04-27)
- Open access
- gold
- doi.org
- Locations
- PLoS ONE (publishedVersion, cc-by)
- PubMed Central (publishedVersion, cc-by)
- PubMed (publishedVersion)
- DOAJ (DOAJ: Directory of Open Access Journals) (submittedVersion, cc-by-sa)
- Figshare (submittedVersion, cc-by)
- Funders
- National Multiple Sclerosis Society
- Multiple Sclerosis Society
- National Institutes of Health
- National Heart, Lung, and Blood Institute (R01HL063894, R01HL052773, HL 52773, HL63894)
- National Institute of Neurological Disorders and Stroke (R01NS32151, R01NS032151)
- Topics
- Health Sciences › Medicine › Oncology › Chemokine receptors and signaling
- Life Sciences › Neuroscience › Neurology › Neuroinflammation and Neurodegeneration Mechanisms
- Life Sciences › Immunology and Microbiology › Immunology › Atherosclerosis and Cardiovascular Diseases
- Keywords
- CCR2, CX3CR1, monocyte subsets, monocyte trafficking, experimental autoimmune encephalomyelitis, Ly6C, neutrophils, microglia, red fluorescent protein
- MeSH terms
- Red Fluorescent Protein, Animals, Central Nervous System, Luminescent Proteins, Mice, Receptors, CCR2
About these checks
Registry, retraction, Cites and statistics results are computed, not judged, with one exception: a printed reference that no index lists is read once by a model before it counts as a citation error. Claims are extracted by a model and kept only when their quote appears verbatim in the text; each cited source is then checked, with a model’s help, for whether it says what the claim relies on. Those verdicts can be wrong — read the claim’s quote and the cited source before relying on one.
Statistics and arithmetic are recomputed, not judged.
Confidence bands are shown only for fields calibrated on our annotated test set. None is calibrated yet, so no band is shown.
What counts as a claim ›How we measure confidence ›How we check this ›
Are you an author, or do you see a problem with this page? Request a review
