

The DOI matches its Crossref record; 84 of the 84 references it cites were found in a registry or an index.
Immunological memory to SARS-CoV-2 assessed for up to 8 months after infection.
Open accessAbstract
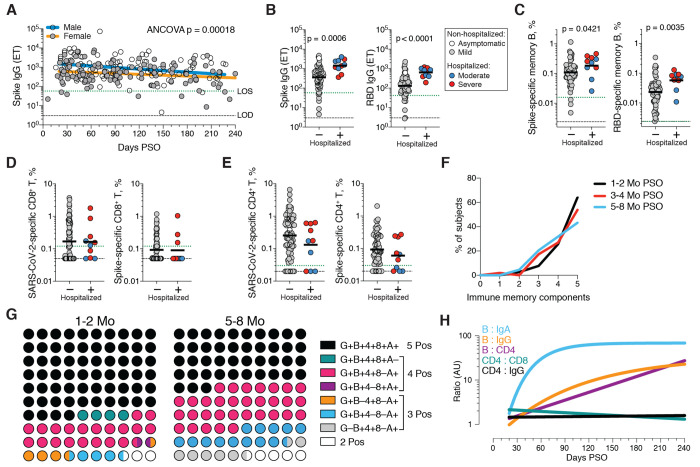
Variable memory: Immune memory against severe acute respiratory syndrome coronavirus 2 (SARS-CoV-2) helps to determine protection against reinfection, disease risk, and vaccine efficacy. Using 188 human cases across the range of severity of COVID-19, Dan et al. analyzed cross-sectional data describing the dynamics of SARS-CoV-2 memory B cells, CD8 + T cells, and CD4 + T cells for more than 6 months after infection. The authors found a high degree of heterogeneity in the magnitude of adaptive immune responses that persisted into the immune memory phase to the virus. However, immune memory in three immunological compartments remained measurable in greater than 90% of subjects for more than 5 months after infection. Despite the heterogeneity of immune responses, these results show that durable immunity against secondary COVID-19 disease is a possibility for most individuals. Science , this issue p. eabf4063
Overview
The claims and statistics of this paper haven’t been checked yet.
Run the check — free, no account needed. It reads the open-access text and checks the sources it cites.
Integrity signals
Registry
Cites
Statistics
Figures
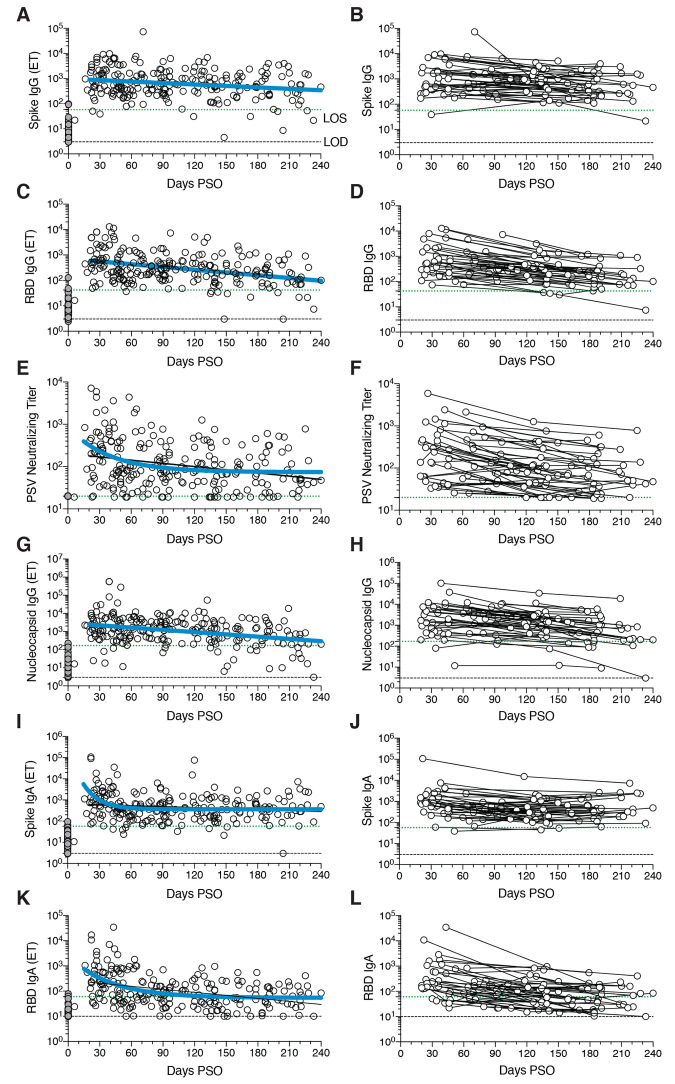
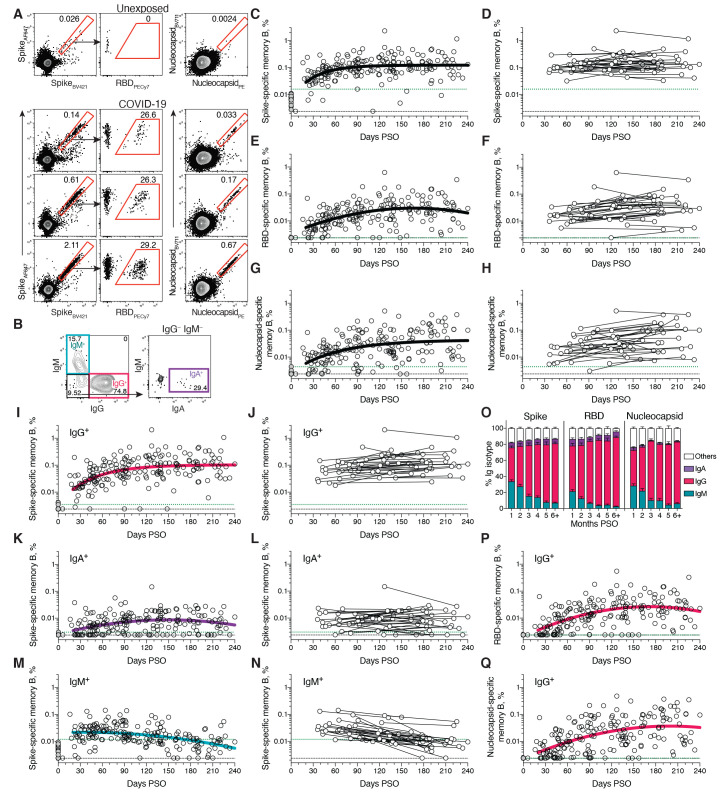
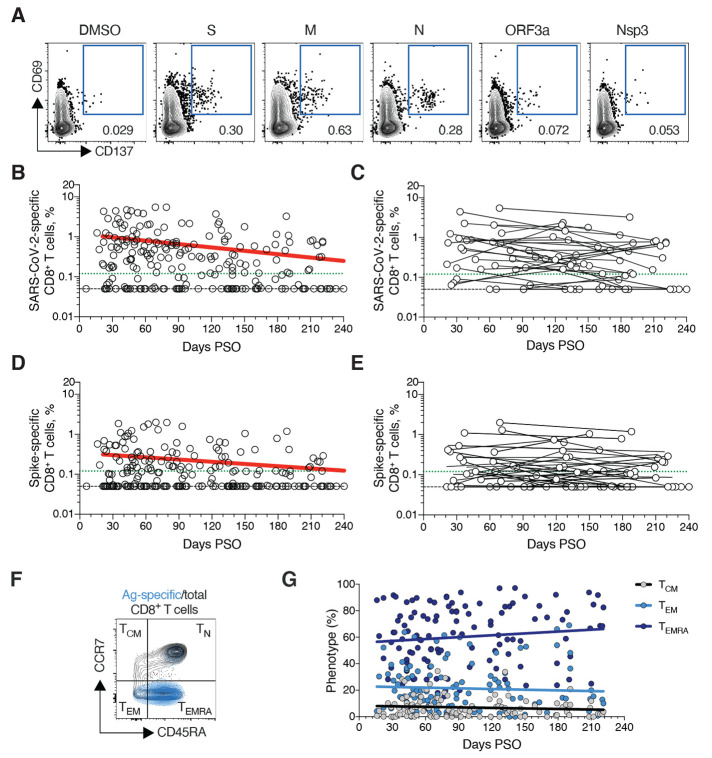
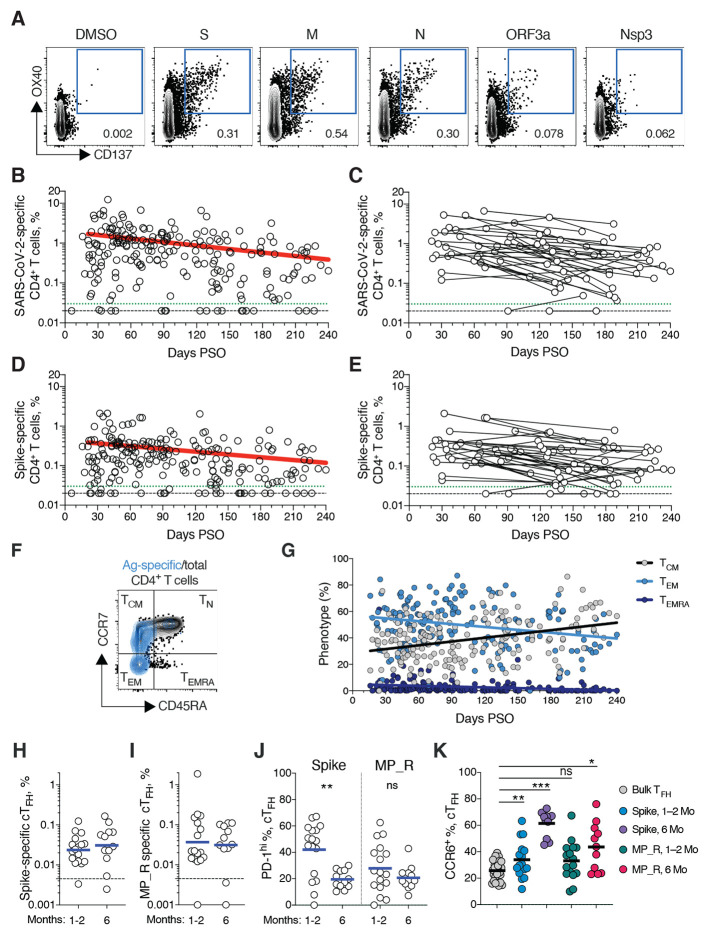
Verification
Claims the paper makes
The claims and statistics of this paper haven’t been checked yet.
Run the check — free, no account needed. It reads the open-access text and checks the sources it cites.
Claims other papers make about this one
Each is checked against this paper’s own text: does it say what the citing paper says it does?
The source backs part of the claim, not all of it — or backs it for a different population, condition or comparison.
In the citing paper
“data so far indicate that T cell memory, B cell memory, and antibodies are all likely to persist for years in most individuals infected by SARS-CoV-2 (Dan et al., 2021; Gaebler et al., 2020; Wajnberg et al., 2020; Zuo et al., 2020a).”
From Adaptive immunity to SARS-CoV-2 and COVID-19 (2021) · cites this paper as Dan et al., 2021
Experimental — accuracy not yet measuredThe source backs part of the claim, not all of it — or backs it for a different population, condition or comparison.
In the citing paper
“Memory B cells might contribute to the durability of antibody responses38,39; B cell germinal centre responses and the durability of protective efficacy following CV2CoV vaccination remain to be determined.”
From Optimization of non-coding regions for a non-modified mRNA COVID-19 vaccine (2022) · cites this paper as [39]
Experimental — accuracy not yet measuredThe cited source says what the claim attributes to it.
In the citing paper
“Although it is unclear how long protective effects last beyond the first few months after vaccination, some studies suggest that the elicited neutralizing activity is maintained for up to 8 months after the natural infection with SARS-CoV-2 (refs. 41,42).”
From Modeling vaccination rollouts, SARS-CoV-2 variants and the requirement for non-pharmaceutical interventions in Italy (2021) · cites this paper as [42]
In the citing paper
“The mRNA vaccine clinical trials were not powered to address severe disease, including complications after hospitalization.29,30”
From Association Between mRNA Vaccination and COVID-19 Hospitalization and Disease Severity (2021) · cites this paper as [30]
In the citing paper
“Data from medium-term follow-up of individuals after infection suggest that T cell responses wane more rapidly than antibody responses80.”
From Immunological mechanisms of vaccine-induced protection against COVID-19 in humans (2021) · cites this paper as [80]
In the citing paper
“Immunological studies of SARS-CoV-2 infection show that memory B and T cell responses appear to persist for at least 8 months after symptom onset (28, 29).”
From mRNA vaccines induce durable immune memory to SARS-CoV-2 and variants of concern (2021) · cites this paper as [28]
In the citing paper
“These results are consistent with published observations of convalescent patients with Covid-19 through 8 months after symptom onset.5”
From Antibody Persistence through 6 Months after the Second Dose of mRNA-1273 Vaccine for Covid-19 (2021) · cites this paper as [5]
In the citing paper
“Robust CD4+ and CD8+ T cell memory is induced after COVID-19,22,39, 40, 41 and multiple COVID-19 vaccines elicit CD4+ and CD8+ T cell responses.26,42, 43, 44, 45”
From Impact of SARS-CoV-2 variants on the total CD4+ and CD8+ T cell reactivity in infected or vaccinated individuals (2021) · cites this paper as [39]
In the citing paper
“SARS-CoV-2 infection rapidly elicits nAbs (16, 21–24) that decline, but remain detectable, over several months (25–29).”
From mRNA vaccination boosts cross-variant neutralizing antibodies elicited by SARS-CoV-2 infection (2021) · cites this paper as [25]
In the citing paper
“Overall, the accumulating evidence from our study and others22-25 shows that long-term humoral response and vaccine effectiveness in previously infected persons were superior to that in recipients of two doses of vaccine.”
From Waning Immune Humoral Response to BNT162b2 Covid-19 Vaccine over 6 Months (2021) · cites this paper as [22]
In the citing paper
“Several studies on the durability of humoral response in persons who have recovered from SARS-CoV-2 infection showed that both IgG and neutralizing antibody levels decrease only modestly at 8 to 10 months after the infection.22,23”
From Waning Immune Humoral Response to BNT162b2 Covid-19 Vaccine over 6 Months (2021) · cites this paper as [22]
In the citing paper
“this measurement does not account for Fc effector functions; Fcγ receptor or complement protein engagement by non-, weakly-, or strongly- neutralizing antibodies that bind the SARS-CoV-2 spike protein on the surface of infected cells could confer substantial protection39–41.”
From Resistance of SARS-CoV-2 variants to neutralization by monoclonal and serum-derived polyclonal antibodies (2021) · cites this paper as [41]
In the citing paper
“Although neutralizing antibody titers have not correlated with reduced COVID-19 severity (Dan et al., 2021; Piccoli et al., 2020; Robbiani et al., 2020), SARS-CoV-2 cTfh cell frequencies have been associated with reduced disease severity (Rydyznski Moderbacher et al., 2020).”
From Adaptive immunity to SARS-CoV-2 and COVID-19 (2021) · cites this paper as Dan et al., 2021
In the citing paper
“However, it should also be noted that circulating SARS-CoV-2 neutralizing antibody titers are relatively low in a substantial fraction of recovered COVID-19 cases (Dan et al., 2021; Robbiani et al., 2020; Wajnberg et al., 2020), indicating that either the neutralizing antibody potency or the serum concentration is suboptimal in this subset.”
From Adaptive immunity to SARS-CoV-2 and COVID-19 (2021) · cites this paper as Dan et al., 2021
In the citing paper
“Serum antibody titers were poorly predictive of the presence of SARS-CoV-2 CD4+ T cells in a study of 188 COVID-19 cases (Dan et al., 2021).”
From Adaptive immunity to SARS-CoV-2 and COVID-19 (2021) · cites this paper as Dan et al., 2021
In the citing paper
“In a cohort of 188 cases, memory B cells specific for Spike, RBD, and nucleocapsid were each detectable in 100% of subjects at 6+ months post-infection (Dan et al., 2021).”
From Adaptive immunity to SARS-CoV-2 and COVID-19 (2021) · cites this paper as Dan et al., 2021
In the citing paper
“Antibody titers were not a surrogate indicator of the magnitude of memory T cells (Dan et al., 2021), suggesting that simple antibody serodiagnostic tests will not be a robust indicator of protective immunity in people previously infected with SARS-CoV-2.”
From Adaptive immunity to SARS-CoV-2 and COVID-19 (2021) · cites this paper as Dan et al., 2021
In the citing paper
“A previous study24 showed a decrease in neutralising antibody titres over the first 8 months of infection, with a half-life of around 3–4 months”
From Neutralising antibody titres as predictors of protection against SARS-CoV-2 variants and the impact of boosting: a meta-analysis (2022) · cites this paper as [24]
Self-check
Percentages, sums and reported differences re-computed from the paper’s own numbers.
The self-check needs the paper’s full text.
Citations
Cites
Zhou, F., Yu, T., Du, R., Fan, G., Liu, Y., Liu, Z., Xiang, J., Wang, Y., Song, B., Gu, X., et al. (2020) · The Lancet · doi:10.1016/s0140-6736(20)30566-3 · Cited by 27,263
Cryo-EM structure of the 2019-nCoV spike in the prefusion conformation
Wrapp, D., Wang, N., Corbett, K. S., Goldsmith, J. A., Hsieh, C.-L., Abiona, O., Graham, B. S., & McLellan, J. S. (2020) · Science · doi:10.1126/science.abb2507 · Cited by 8,897 · cited 1×
“Stabilized spike protein [2P (81)] and the RBD were expressed in HEK293F cells.”
BackgroundRemdesivir for the Treatment of Covid-19 — Final Report
Beigel, J. H., Tomashek, K. M., Dodd, L. E., Mehta, A. K., Zingman, B. S., Kalil, A. C., Hohmann, E., Chu, H. Y., Luetkemeyer, A., Kline, S., et al. (2020) · New England Journal of Medicine · doi:10.1056/nejmoa2007764 · Cited by 7,267 · cited 1×
“COVID-19 disease severity was scored from 0 to 10 using a numerical scoring systembased on the NIH ordinal scale (5, 80).”
MethodImbalanced Host Response to SARS-CoV-2 Drives Development of COVID-19
Blanco-Melo, D., Nilsson-Payant, B. E., Liu, W.-C., Uhl, S., Hoagland, D., Møller, R., Jordan, T. X., Oishi, K., Panis, M., Sachs, D., et al. (2020) · Cell · doi:10.1016/j.cell.2020.04.026 · Cited by 4,222
Grifoni, A., Weiskopf, D., Ramirez, S. I., Mateus, J., Dan, J. M., Moderbacher, C. R., Rawlings, S. A., Sutherland, A., Premkumar, L., Jadi, R. S., et al. (2020) · Cell · doi:10.1016/j.cell.2020.05.015 · Cited by 3,595 · cited 9×
“This could potentially underestimate CD8 T cell memory, as 15-mer peptides can be suboptimal for detection of some antigen-specific CD8 T cells (53); however, pools of predicted SARS-CoV2 class I epitope of optimal size also detected virus-specific CD8 T cells in ~70% of individuals 1 to 2 months PSO, indicating consi…”
MethodResultInfluentialSelf-citationClinical and immunological assessment of asymptomatic SARS-CoV-2 infections
Long, Q.-X., Tang, X.-J., Shi, Q.-L., Li, Q., Deng, H.-J., Yuan, J., Hu, J.-L., Xu, W., Zhang, Y., Lv, F.-J., et al. (2020) · Nature Medicine · doi:10.1038/s41591-020-0965-6 · Cited by 2,686
Autoantibodies against type I IFNs in patients with life-threatening COVID-19
Bastard, P., Rosen, L. B., Zhang, Q., Michailidis, E., Hoffmann, H.-H., Zhang, Y., Dorgham, K., Philippot, Q., Rosain, J., Béziat, V., et al. (2020) · Science · doi:10.1126/science.abd4585 · Cited by 2,662
Single-cell landscape of bronchoalveolar immune cells in patients with COVID-19
Liao, M., Liu, Y., Yuan, J., Wen, Y., Xu, G., Zhao, J., Cheng, L., Li, J., Wang, X., Wang, F., et al. (2020) · Nature Medicine · doi:10.1038/s41591-020-0901-9 · Cited by 2,614
Projecting the transmission dynamics of SARS-CoV-2 through the postpandemic period
Kissler, S. M., Tedijanto, C., Goldstein, E., Grad, Y. H., & Lipsitch, M. (2020) · Science · doi:10.1126/science.abb5793 · Cited by 2,611 · cited 1×
“The findings have implications for immunity against secondary COVID-19, and thus the potential future course of the pandemic (41, 42).”
BackgroundAn inflammatory cytokine signature predicts COVID-19 severity and survival
Del Valle, D. M., Kim-Schulze, S., Huang, H.-H., Beckmann, N. D., Nirenberg, S., Wang, B., Lavin, Y., Swartz, T. H., Madduri, D., Stock, A., et al. (2020) · Nature Medicine · doi:10.1038/s41591-020-1051-9 · Cited by 2,605
Research works printed but not linked: 2
- S. Plotkin W. Orenstein P. Offit Plotkin’s Vaccines (Elsevier ed. 7 2018).
- 10.1126/science.abd7728 · DOI · Paper page
Cited by
Sorted by citations
Khoury, D. S., Cromer, D., Reynaldi, A., Schlub, T. E., Wheatley, A. K., Juno, J. A., Subbarao, K., Kent, S. J., Triccas, J. A., & Davenport, M. P. (2021) · Nature Medicine · doi:10.1038/s41591-021-01377-8 · Cited by 3,742
Adaptive immunity to SARS-CoV-2 and COVID-19
Sette, A., & Crotty, S. (2021) · Cell · doi:10.1016/j.cell.2021.01.007 · Cited by 1,860
“Antibody titers are higher in men in some studies (Dan et al., 2021; Robbiani et al., 2020; Shrock et al., 2020).”
InfluentialSelf-citationWaning Immune Humoral Response to BNT162b2 Covid-19 Vaccine over 6 Months
Levin, E. G., Lustig, Y., Cohen, C., Fluss, R., Indenbaum, V., Amit, S., Doolman, R., Asraf, K., Mendelson, E., Ziv, A., et al. (2021) · New England Journal of Medicine · doi:10.1056/nejmoa2114583 · Cited by 1,703
Evolution of antibody immunity to SARS-CoV-2
Gaebler, C., Wang, Z., Lorenzi, J. C. C., Muecksch, F., Finkin, S., Tokuyama, M., Cho, A., Jankovic, M., Schaefer-Babajew, D., Oliveira, T. Y., et al. (2021) · Nature · doi:10.1038/s41586-021-03207-w · Cited by 1,674
Chen, R. E., Zhang, X., Case, J. B., Winkler, E. S., Liu, Y., VanBlargan, L. A., Liu, J., Errico, J. M., Xie, X., Suryadevara, N., et al. (2021) · Nature Medicine · doi:10.1038/s41591-021-01294-w · Cited by 881
Resurgence of COVID-19 in Manaus, Brazil, despite high seroprevalence
Sabino, E. C., Buss, L. F., Carvalho, M. P. S., Prete, C. A., Crispim, M. A. E., Fraiji, N. A., Pereira, R. H. M., Parag, K. V., da Silva Peixoto, P., Kraemer, M. U. G., et al. (2021) · The Lancet · doi:10.1016/s0140-6736(21)00183-5 · Cited by 758
mRNA vaccines induce durable immune memory to SARS-CoV-2 and variants of concern
Goel, R. R., Painter, M. M., Apostolidis, S. A., Mathew, D., Meng, W., Rosenfeld, A. M., Lundgreen, K. A., Reynaldi, A., Khoury, D. S., Pattekar, A., et al. (2021) · Science · doi:10.1126/science.abm0829 · Cited by 873
“Immunological studies of SARS-CoV-2 infection show that memory B and T cell responses appear to persist for at least 8 months after symptom onset (28, 29).”
BackgroundSelf-citationTarke, A., Coelho, C. H., Zhang, Z., Dan, J. M., Yu, E. D., Methot, N., Bloom, N. I., Goodwin, B., Phillips, E., Mallal, S., et al. (2022) · Cell · doi:10.1016/j.cell.2022.01.015 · Cited by 858
“Flow cytometry-based B cell assays Detection of antigen-specific B cells by flow cytometry was performed using B cell probes consisting of SARS-CoV-2 viral proteins conjugated with fluorescent streptavidin, as previously described by our group (Dan et al., 2021).”
Self-citationModel-informed COVID-19 vaccine prioritization strategies by age and serostatus
Bubar, K. M., Reinholt, K., Kissler, S. M., Lipsitch, M., Cobey, S., Grad, Y. H., & Larremore, D. B. (2021) · Science · doi:10.1126/science.abe6959 · Cited by 775
Association Between mRNA Vaccination and COVID-19 Hospitalization and Disease Severity
Tenforde, M. W., Self, W. H., Adams, K., Gaglani, M., Ginde, A. A., McNeal, T., Ghamande, S., Douin, D. J., Talbot, H. K., Casey, J. D., et al. (2021) · JAMA · doi:10.1001/jama.2021.19499 · Cited by 633
Tarke, A., Sidney, J., Methot, N., Yu, E. D., Zhang, Y., Dan, J. M., Goodwin, B., Rubiro, P., Sutherland, A., Wang, E., et al. (2021) · Cell Reports Medicine · doi:10.1016/j.xcrm.2021.100355 · Cited by 706
Self-citationAntibody Persistence through 6 Months after the Second Dose of mRNA-1273 Vaccine for Covid-19
Doria-Rose, N., Suthar, M. S., Makowski, M., O’Connell, S., McDermott, A. B., Flach, B., Ledgerwood, J. E., Mascola, J. R., Graham, B. S., Lin, B. C., et al. (2021) · New England Journal of Medicine · doi:10.1056/nejmc2103916 · Cited by 673
Hansen, C. H., Michlmayr, D., Gubbels, S. M., Mølbak, K., & Ethelberg, S. (2021) · The Lancet · doi:10.1016/s0140-6736(21)00575-4 · Cited by 586
Homologous and Heterologous Covid-19 Booster Vaccinations
Atmar, R. L., Lyke, K. E., Deming, M. E., Jackson, L. A., Branche, A. R., Sahly, H. M. E., Rostad, C. A., Martin, J. M., Johnston, C., Rupp, R. E., et al. (2022) · New England Journal of Medicine · doi:10.1056/nejmoa2116414 · Cited by 646
Goel, R. R., Apostolidis, S. A., Painter, M. M., Mathew, D., Pattekar, A., Kuthuru, O., Gouma, S., Hicks, P., Meng, W., Rosenfeld, A. M., et al. (2021) · Science Immunology · doi:10.1126/sciimmunol.abi6950 · Cited by 655
T cell responses to SARS-CoV-2 spike cross-recognize Omicron
Keeton, R., Tincho, M. B., Ngomti, A., Baguma, R., Benede, N., Suzuki, A., Khan, K., Cele, S., Bernstein, M. P., Karim, F., et al. (2022) · Nature · doi:10.1038/s41586-022-04460-3 · Cited by 617
Self-citationImmunological mechanisms of vaccine-induced protection against COVID-19 in humans
Sadarangani, M., Marchant, A., & Kollmann, T. R. (2021) · Nature Reviews Immunology · doi:10.1038/s41577-021-00578-z · Cited by 560
Geers, D., Shamier, M. C., Bogers, S., den Hartog, G., Gommers, L., Nieuwkoop, N. N., Schmitz, K. S., Rijsbergen, L. C., van Osch, J. A. T., Dijkhuizen, E., et al. (2021) · Science Immunology · doi:10.1126/sciimmunol.abj1750 · Cited by 529
Cromer, D., Steain, M., Reynaldi, A., Schlub, T. E., Wheatley, A. K., Juno, J. A., Kent, S. J., Triccas, J. A., Khoury, D. S., & Davenport, M. P. (2022) · The Lancet Microbe · doi:10.1016/s2666-5247(21)00267-6 · Cited by 590
Humoral and cellular immune memory to four COVID-19 vaccines
Zhang, Z., Mateus, J., Coelho, C. H., Dan, J. M., Moderbacher, C. R., Gálvez, R. I., Côrtes, F. H., Grifoni, A., Tarke, A., Chang, J., et al. (2022) · Cell · doi:10.1016/j.cell.2022.05.022 · Cited by 576
“These divergent antibody and memory B cell kinetics were also observed in SARS-CoV-2 infection (Dan et al., 2021).”
Self-citationmRNA vaccination boosts cross-variant neutralizing antibodies elicited by SARS-CoV-2 infection
Stamatatos, L., Czartoski, J., Wan, Y.-H., Homad, L. J., Rubin, V., Glantz, H., Neradilek, M., Seydoux, E., Jennewein, M. F., MacCamy, A. J., et al. (2021) · Science · doi:10.1126/science.abg9175 · Cited by 557
SARS-CoV-2 infection induces long-lived bone marrow plasma cells in humans
Turner, J. S., Kim, W., Kalaidina, E., Goss, C. W., Rauseo, A. M., Schmitz, A. J., Hansen, L., Haile, A., Klebert, M. K., Pusic, I., et al. (2021) · Nature · doi:10.1038/s41586-021-03647-4 · Cited by 532
“8) Duration of symptoms in days (median [range]) 14 (1-43) 13 (6-30)”
BackgroundGuidelines for the use of flow cytometry and cell sorting in immunological studies (third edition)
Cossarizza, A., Chang, H., Radbruch, A., Abrignani, S., Addo, R., Akdis, M., Andrä, I., Andreata, F., Annunziato, F., Arranz, E., et al. (2021) · European Journal of Immunology · doi:10.1002/eji.202170126 · Cited by 531
The COVID-19 puzzle: deciphering pathophysiology and phenotypes of a new disease entity
Osuchowski, M. F., Winkler, M. S., Skirecki, T., Cajander, S., Shankar‐Hari, M., Lachmann, G., Monneret, G., Venet, F., Bauer, M. W., Brunkhorst, F. M., et al. (2021) · The Lancet Respiratory Medicine · doi:10.1016/s2213-2600(21)00218-6 · Cited by 528
Apostolidis, S. A., Kakara, M., Painter, M. M., Goel, R. R., Mathew, D., Lenzi, K., Rezk, A., Patterson, K. R., Espinoza, D. A., Kadri, J. C., et al. (2021) · Nature Medicine · doi:10.1038/s41591-021-01507-2 · Cited by 506
Self-citationCohen, K. W., Linderman, S. L., Moodie, Z., Czartoski, J., Lai, L., Mantus, G., Norwood, C., Nyhoff, L. E., Edara, V. V., Floyd, K., et al. (2021) · Cell Reports Medicine · doi:10.1016/j.xcrm.2021.100354 · Cited by 441
“Persistence of 463 RBD memory B cell has been noted.(25-27) We presume this may be explained by 464 sustained production of memory B cells in germinal centers of lymph nodes draining the 465”
Vaccines elicit highly conserved cellular immunity to SARS-CoV-2 Omicron
Liu, J., Chandrashekar, A., Sellers, D., Barrett, J., Jacob-Dolan, C., Lifton, M. A., McMahan, K., Sciacca, M., VanWyk, H., Wu, C., et al. (2022) · Nature · doi:10.1038/s41586-022-04465-y · Cited by 449
The coronavirus is here to stay — here’s what that means
Phillips, N. (2021) · Nature · doi:10.1038/d41586-021-00396-2 · Cited by 444
Covid-19 Vaccines — Immunity, Variants, Boosters
Barouch, D. H. (2022) · New England Journal of Medicine · doi:10.1056/nejmra2206573 · Cited by 451
After the pandemic: perspectives on the future trajectory of COVID-19
Telenti, A., Arvin, A. M., Corey, L., Corti, D., Diamond, M., García‐Sastre, A., Garry, R. F., Holmes, E. C., Pang, P. S., & Virgin, H. W. (2021) · Nature · doi:10.1038/s41586-021-03792-w · Cited by 450
Effect of Immunosuppression on the Immunogenicity of mRNA Vaccines to SARS-CoV-2
Deepak, P., Kim, W., Paley, M., Yang, M. M., Carvidi, A. B., Demissie, E., El‐Qunni, A. A., Haile, A., Huang, K., Kinnett, B., et al. (2021) · Annals of Internal Medicine · doi:10.7326/m21-1757 · Cited by 424
Population Immunity and Covid-19 Severity with Omicron Variant in South Africa
Madhi, S. A., Kwatra, G., Myers, J. E., Jassat, W., Dhar, N., Mukendi, C. K., Nana, A. J., Blumberg, L., Welch, R., Ngorima-Mabhena, N., et al. (2022) · New England Journal of Medicine · doi:10.1056/nejmoa2119658 · Cited by 387
“19 We believe that the evolution of cell-mediated immunity from prior natural infection and vaccination has resulted in the decoupling of the high case rates seen with the Omicron variant and the rates of severe disease.”
Ella, R., Reddy, S., Jogdand, H., Sarangi, V., Ganneru, B., Prasad, S. D., Das, D., Raju, D., Praturi, U., Sapkal, G. N., et al. (2021) · The Lancet Infectious Diseases · doi:10.1016/s1473-3099(21)00070-0 · Cited by 378
Saadat, S., Rikhtegaran Tehrani, Z., Logue, J., Newman, M., Frieman, M. B., Harris, A. D., & Sajadi, M. M. (2021) · JAMA · doi:10.1001/jama.2021.3341 · Cited by 364
Phase 1 randomized trial of a plant-derived virus-like particle vaccine for COVID-19
Ward, B. J., Gobeil, P., Séguin, A., Atkins, J., Boulay, I., Charbonneau, P.-Y., Couture, M., D’Aoust, M., Dhaliwall, J. K., Finkle, C. D., et al. (2021) · Nature Medicine · doi:10.1038/s41591-021-01370-1 · Cited by 371
A Comprehensive Review of the Global Efforts on COVID-19 Vaccine Development
Li, Y., Tenchov, R., Smoot, J., Liu, C., Watkins, S., & Zhou, Q. A. (2021) · ACS Central Science · doi:10.1021/acscentsci.1c00120 · Cited by 349
Low-dose mRNA-1273 COVID-19 vaccine generates durable memory enhanced by cross-reactive T cells
(2021) · doi:10.1126/science.abj9853 · Cited by 327
“After SARS-CoV-2 infection, immunological memory has been observed for ≥8 months for CD4 + T cells, CD8 + T cells, memory B cells, and antibodies (21, 22).”
InfluentialSelf-citationLessons learned 1 year after SARS-CoV-2 emergence leading to COVID-19 pandemic
To, K. K., Sridhar, S., Chiu, K. H., Hung, D. L. L., Li, X., Hung, I. F., Tam, A. R., Chung, T. W., Chan, J. F., Zhang, J., et al. (2021) · Emerging Microbes & Infections · doi:10.1080/22221751.2021.1898291 · Cited by 359
Dispinseri, S., Secchi, M., Pirillo, M. F., Tolazzi, M., Borghi, M., Brigatti, C., Angelis, M. L. D., Baratella, M., Bazzigaluppi, E., Venturi, G., et al. (2021) · Nature Communications · doi:10.1038/s41467-021-22958-8 · Cited by 338
Maturation and persistence of the anti-SARS-CoV-2 memory B cell response
Sokal, A., Chappert, P., Barba-Spaeth, G., Roeser, A., Fourati, S., Azzaoui, I., Vandenberghe, A., Fernandez, I., Meola, A., Bouvier-Alias, M., et al. (2021) · Cell · doi:10.1016/j.cell.2021.01.050 · Cited by 340
“This is also consistent with recent results showing in a large cohort of patients that SARS-CoV-2 antigen-specific MBCs persist up to 8 months after infection (Dan et al., 2021).”
BackgroundResultImmunogenicity of standard and extended dosing intervals of BNT162b2 mRNA vaccine
Payne, R. P., Longet, S., Austin, J. A., Skelly, D. T., Dejnirattisai, W., Adele, S., Meardon, N., Faustini, S., Al-Taei, S., Moore, S. C., et al. (2021) · Cell · doi:10.1016/j.cell.2021.10.011 · Cited by 322
“The sustained T cell response from 1 to 10 weeks after the first dose in the extended dosing interval group contrasts with the waning of T cells we and others (Dan et al., 2021; Tomic et al., 2021) have reported after natural infection.”
Zeng, G., Wu, Q., Pan, H., Li, M., Yang, J., Wang, L., Wu, Z., Jiang, D., Deng, X., Chu, K., et al. (2021) · The Lancet Infectious Diseases · doi:10.1016/s1473-3099(21)00681-2 · Cited by 319
“27,28 This study is the first to show that the antibody response mediated by a third dose of CoronaVac given 2 months after the second dose rebounded only moderately and degraded to near the seropositive threshold after 6 months.”
SARS-CoV-2 501Y.V2 escapes neutralization by South African COVID-19 donor plasma
Wibmer, C. K., Ayres, F., Hermanus, T., Madzivhandila, M., Kgagudi, P., Oosthuysen, B., Lambson, B. E., de Oliveira, T., Vermeulen, M., van der Berg, K., et al. (2021) · doi:10.1101/2021.01.18.427166
SARS-CoV-2 Variants, Vaccines, and Host Immunity
Mistry, P., Barmania, F., Mellet, J., Peta, K. T., Strydom, A., Viljoen, I. M., James, W., Gordon, S., & Pepper, M. S. (2022) · Frontiers in Immunology · doi:10.3389/fimmu.2021.809244 · Cited by 314
“Similarly, it was found that B-lymphocyte memory cells were stable for six months after infection and accumulated more in patients with severe disease with IgG being the most dominant isotype (52, 57, 58).”
BackgroundCorrelates of protection against SARS ‐ CoV ‐2 infection and COVID‐19 disease
Goldblatt, D., Alter, G., Crotty, S., & Plotkin, S. A. (2022) · Immunological Reviews · doi:10.1111/imr.13091 · Cited by 301
Self-citationGenomic characterization and epidemiology of an emerging SARS-CoV-2 variant in Delhi, India
Dhar, M. S., Marwal, R., Radhakrishnan, V. S., Ponnusamy, K., Jolly, B., Bhoyar, R. C., Sardana, V., Naushin, S., Rophina, M., Mellan, T. A., et al. (2021) · Science · doi:10.1126/science.abj9932 · Cited by 300
“About one-third of NAb+ve subjects at Phase I became NAb-ve by Phase II, with most showing declining inhibition on sVNT assays (Fig 2B) (5).”
Genomic characterization and Epidemiology of an emerging SARS-CoV-2 variant in Delhi, India
Dhar, M. S., Marwal, R., Radhakrishnan, V., Ponnusamy, K., Jolly, B., Bhoyar, R. C., Sardana, V., Naushin, S., Rophina, M., Mellan, T. A., et al. (2021) · doi:10.1101/2021.06.02.21258076 · Cited by 296
Modeling transmission of SARS-CoV-2 Omicron in China
Cai, J., Deng, X., Yang, J., Sun, K., Liu, H., Chen, Z., Peng, C., Chen, X., Wu, Q., Zou, J., et al. (2022) · Nature Medicine · doi:10.1038/s41591-022-01855-7 · Cited by 278
SARS-CoV-2 mRNA Vaccines: Immunological Mechanism and Beyond
Bettini, E., & Locci, M. (2021) · Vaccines · doi:10.3390/vaccines9020147 · Cited by 292
Crotty, S. (2021) · Science · doi:10.1126/science.abj2258 · Cited by 277
Self-citationAnti-SARS-CoV-2 receptor-binding domain antibody evolution after mRNA vaccination
Cho, A., Muecksch, F., Schaefer-Babajew, D. J., Wang, Z., Finkin, S., Gaebler, C., Ramos, V., Cipolla, M., Mendoza, P., Agudelo, M., et al. (2021) · Nature · doi:10.1038/s41586-021-04060-7 · Cited by 263
Long-term perturbation of the peripheral immune system months after SARS-CoV-2 infection
Ryan, F. J., Hope, C. M., Masavuli, M. G., Lynn, M. A., Mekonnen, Z. A., Yeow, A. E. L., García-Valtanen, P., Al-Delfi, Z., Gummow, J., Ferguson, C. C., et al. (2022) · BMC Medicine · doi:10.1186/s12916-021-02228-6 · Cited by 288
“Anti-Spike and anti-RBD serology data demonstrated heterogeneity of antibody responses to SARS-CoV-2 consistent with previously published reports showing long-lasting IgG and IgG1 antibody responses to at least 6 months post-infection which were correlated with disease severity [36, 71, 72].”
BackgroundSARS-CoV-2 mRNA vaccination induces functionally diverse antibodies to NTD, RBD, and S2
Amanat, F., Thapa, M., Lei, T., Ahmed, S. M. S., Adelsberg, D. C., Carreño, J. M., Strohmeier, S., Schmitz, A. J., Zafar, S., Zhou, J. Q., et al. (2021) · Cell · doi:10.1016/j.cell.2021.06.005 · Cited by 273
“Similarly, encouraging data have been published on both the plasmablast response and the memory B cell response induced by SARS-CoV-2 infection (Dan et al., 2021; Gaebler et al., 2020; Guthmiller et al., 2021; Huang et al., 2021; Robbiani et al., 2020; Rodda et al., 2021; Wilson et al., 2020).”
Self-citationRincón-Arévalo, H., Choi, M., Stefanski, A., Halleck, F., Weber, U., Szelinski, F., Jahrsdörfer, B., Schrezenmeier, H., Ludwig, C., Sattler, A., et al. (2021) · Science Immunology · doi:10.1126/sciimmunol.abj1031 · Cited by 276
Immunological memory to SARS‐CoV ‐2 infection and COVID ‐19 vaccines
Sette, A., & Crotty, S. (2022) · Immunological Reviews · doi:10.1111/imr.13089 · Cited by 270
Self-citationProspects for durable immune control of SARS-CoV-2 and prevention of reinfection
Cromer, D., Juno, J. A., Khoury, D., Reynaldi, A., Wheatley, A. K., Kent, S. J., & Davenport, M. P. (2021) · Nature Reviews Immunology · doi:10.1038/s41577-021-00550-x · Cited by 265
The germinal centre B cell response to SARS-CoV-2
Laidlaw, B. J., & Ellebedy, A. H. (2022) · Nature Reviews Immunology · doi:10.1038/s41577-021-00657-1 · Cited by 268
A COVID-19 peptide vaccine for the induction of SARS-CoV-2 T cell immunity
Heitmann, J. S., Bilich, T., Tandler, C., Nelde, A., Maringer, Y., Marconato, M., Reusch, J., Jäger, S., Denk, M., Richter, M., et al. (2021) · Nature · doi:10.1038/s41586-021-04232-5 · Cited by 257
Post-COVID syndrome. A case series and comprehensive review
Anaya, J., Rojas, M., Salinas, M. L., Rodríguez, Y., Roa, G., Lozano, M., Rodríguez‐Jiménez, M., Montoya, N., Zapata, E., Post-COVID study group, et al. (2021) · Autoimmunity Reviews · doi:10.1016/j.autrev.2021.102947 · Cited by 269
“Our results confirm the heterogeneous but long-lasting humoral response to SARS-CoV-2 infection [97,98].”
Overview of the Main Anti-SARS-CoV-2 Vaccines: Mechanism of Action, Efficacy and Safety
Mascellino, M. T., Timoteo, F. D., Angelis, M. D., & Oliva, A. (2021) · Infection and Drug Resistance · doi:10.2147/idr.s315727 · Cited by 265
Infection- and vaccine-induced antibody binding and neutralization of the B.1.351 SARS-CoV-2 variant
Edara, V. V., Norwood, C., Floyd, K., Lai, L., Davis-Gardner, M. E., Hudson, W. H., Mantus, G., Nyhoff, L. E., Adelman, M. W., Fineman, R., et al. (2021) · Cell Host & Microbe · doi:10.1016/j.chom.2021.03.009 · Cited by 224
“Recent studies have found that binding and neutralizing antibodies are maintained for at least 8 months following SARSCoV-2 infection (Dan et al., 2021; Pradenas et al., 2021; Sherina et al., 2021).”
Peluso, M. J., Deitchman, A. N., Torres, L., Iyer, N. S., Munter, S. E., Nixon, C. C., Donatelli, J. L., Thanh, C., Takahashi, S., Hakim, J. M. C., et al. (2021) · Cell Reports · doi:10.1016/j.celrep.2021.109518 · Cited by 251
Evolution of antibody responses up to 13 months after SARS-CoV-2 infection and risk of reinfection
Gallais, F., Gantner, P., Bruel, T., Velay, A., Planas, D., Wendling, M.-J., Bayer, S., Solis, M., Laugel, E., Reix, N., et al. (2021) · EBioMedicine · doi:10.1016/j.ebiom.2021.103561 · Cited by 234
“waning of humoral immunity, but rather a contraction of the immune response, whilst antibody affinity maturation occurs, and anti-S memory B cells persist [8].”
Impact of circulating SARS-CoV-2 variants on mRNA vaccine-induced immunity
Lucas, C., Vogels, C. B. F., Yildirim, I., Rothman, J. E., Lu, P., Monteiro, V., Gehlhausen, J. R., Campbell, M., Silva, J., Tabachnikova, A., et al. (2021) · Nature · doi:10.1038/s41586-021-04085-y · Cited by 226
BNT162b2 Protection against the Omicron Variant in Children and Adolescents
Price, A. M., Olson, S. M., Newhams, M. M., Halasa, N., Boom, J. A., Sahni, L. C., Pannaraj, P. S., Irby, K., Bline, K., Maddux, A. B., et al. (2022) · New England Journal of Medicine · doi:10.1056/nejmoa2202826 · Cited by 229
BNT162b2 vaccination induces durable SARS-CoV-2–specific T cells with a stem cell memory phenotype
Guerrera, G., Picozza, M., D’Orso, S., Placido, R., Pirronello, M., Verdiani, A., Termine, A., Fabrizio, C., Giannessi, F., Sambucci, M., et al. (2021) · Science Immunology · doi:10.1126/sciimmunol.abl5344 · Cited by 230
Saini, S. K., Hersby, D. S., Tamhane, T., Povlsen, H. R., Hernandez, S. P. A., Nielsen, M., Gang, A. O., & Hadrup, S. R. (2021) · Science Immunology · doi:10.1126/sciimmunol.abf7550 · Cited by 226
Immune responses to two and three doses of the BNT162b2 mRNA vaccine in adults with solid tumors
Shroff, R. T., Chalasani, P., Wei, R., Pennington, D., Quirk, G., Schoenle, M. V., Peyton, K. L., Uhrlaub, J. L., Ripperger, T. J., Jergović, M., et al. (2021) · Nature Medicine · doi:10.1038/s41591-021-01542-z · Cited by 237
Jung, J. H., Rha, M., Sa, M., Choi, H. K., Jeon, J. H., Seok, H., Park, D. W., Park, S., Jeong, H. W., Choi, W. S., et al. (2021) · Nature Communications · doi:10.1038/s41467-021-24377-1 · Cited by 233
Epidemiological and evolutionary considerations of SARS-CoV-2 vaccine dosing regimes
Saad-Roy, C. M., Morris, S. E., Metcalf, C. J. E., Mina, M. J., Baker, R. E., Farrar, J., Holmes, E. C., Pybus, O. G., Graham, A. L., Levin, S. A., et al. (2021) · Science · doi:10.1126/science.abg8663 · Cited by 221
SARS-CoV-2 infection generates tissue-localized immunological memory in humans
Poon, M. M. L., Rybkina, K., Kato, Y., Kubota, M., Matsumoto, R., Bloom, N. I., Zhang, Z., Hastie, K. M., Grifoni, A., Weiskopf, D., et al. (2021) · Science Immunology · doi:10.1126/sciimmunol.abl9105 · Cited by 220
Self-citationGutiérrez‐Castrellón, P., Gandara-Martí, T., y Abreu, A. T. A., Nieto-Rufino, C. D., López-Orduña, E., Jiménez–Escobar, I., Jiménez-Gutiérrez, C., López‐Velázquez, G., & Espadaler, J. (2022) · Gut Microbes · doi:10.1080/19490976.2021.2018899 · Cited by 220
“Of note, neutralizing antibodies were not measured, but recent research indicates immunoglobulins to spike antigens provide a good correlate to both neutralization(31,32) and efficacy,(33) and spike-specific memory B-cells have been found to persist for months after infection.(34,35) Our findings, together with the re…”
Giordano, G., Colaneri, M., Di Filippo, A., Blanchini, F., Bolzern, P., De Nicolao, G., Sacchi, P., Colaneri, P., & Bruno, R. (2021) · Nature Medicine · doi:10.1038/s41591-021-01334-5 · Cited by 192
Glynne, P. A., Tahmasebi, N., Gant, V. A., & Gupta, R. (2021) · Journal of Investigative Medicine · doi:10.1136/jim-2021-002051 · Cited by 215
Beyond neutralization: Fc-dependent antibody effector functions in SARS-CoV-2 infection
Zhang, A., Stacey, H. D., D’Agostino, M. R., Tugg, Y., Marzok, A., & Miller, M. S. (2022) · Nature reviews. Immunology · doi:10.1038/s41577-022-00813-1 · Cited by 225
Dynamic prioritization of COVID-19 vaccines when social distancing is limited for essential workers
Buckner, J. H., Chowell, G., & Springborn, M. (2021) · Proceedings of the National Academy of Sciences · doi:10.1073/pnas.2025786118 · Cited by 222
“While the longevity of immunity to COVID-19—either following natural infection or vaccination—is not yet well understood, emerging analysis suggests that, following infection, “durable immunity against secondary COVID-19 disease is a possibility for most individuals” in the sense that immune memory was present in appr…”
BackgroundSkelly, D. T., Harding, A. C., Gilbert-Jaramillo, J., Knight, M. L., Longet, S., Brown, A., Adele, S., Adland, E., Brown, H., Team, M. L., et al. (2021) · doi:10.21203/rs.3.rs-226857/v2 · Cited by 216
A guide to adaptive immune memory
Lam, N., Lee, Y. S., & Färber, D. L. (2024) · Nature reviews. Immunology · doi:10.1038/s41577-024-01040-6 · Cited by 236
“These studies have shown that SARS-CoV-2-specific memory CD4 + T cells and CD8 + T cells could be consistently detected in blood following acute infection and decreased in number over the months following infection 43,44 .”
Lineburg, K. E., Grant, E. J., Swaminathan, S., Chatzileontiadou, D. S. M., Szeto, C., Sloane, H., Panikkar, A., Raju, J., Crooks, P., Rehan, S., et al. (2021) · Immunity · doi:10.1016/j.immuni.2021.04.006 · Cited by 183
Efficient recall of Omicron-reactive B cell memory after a third dose of SARS-CoV-2 mRNA vaccine
Goel, R. R., Painter, M. M., Lundgreen, K. A., Apostolidis, S. A., Baxter, A. E., Giles, J. R., Mathew, D., Pattekar, A., Reynaldi, A., Khoury, D. S., et al. (2022) · Cell · doi:10.1016/j.cell.2022.04.009 · Cited by 207
“Antigen-specific B cell responses were quantified from bulk PBMCs by flow cytometry using fluorescently labeled SARSCoV-2 spike and RBD probes as previously described (Dan et al., 2021; Goel et al., 2021b, 2021a).”
Can we predict T cell specificity with digital biology and machine learning?
Hudson, D., Fernandes, R. A., Basham, M., Ogg, G. S., & Koohy, H. (2023) · Nature reviews. Immunology · doi:10.1038/s41577-023-00835-3 · Cited by 209
“For infectious diseases such as SARS-CoV-2, predictors of T cell specificity could be of great use in understanding the magnitude and dynamics of antigen-specific T cell responses to the disease 116 and vaccination 117 .”
BackgroundJassat, W., Karim, S. S. A., Mudara, C., Welch, R., Ozougwu, L., Groome, M. J., Govender, N., von Gottberg, A., Wolter, N., Wolmarans, M., et al. (2022) · The Lancet Global Health · doi:10.1016/s2214-109x(22)00114-0 · Cited by 244
Moor, M. B., Suter‐Riniker, F., Horn, M. P., Aeberli, D., Amsler, J., Möller, B., Njue, L. M., Medri, C., Angelillo‐Scherrer, A., Borradori, L., et al. (2021) · The Lancet Rheumatology · doi:10.1016/s2665-9913(21)00251-4 · Cited by 197
Activation or exhaustion of CD8+ T cells in patients with COVID-19
Rha, M., & Shin, E. (2021) · Cellular and Molecular Immunology · doi:10.1038/s41423-021-00750-4 · Cited by 201
Dowell, A. C., Butler, M., Jinks, E., Tut, G., Lancaster, T., Sylla, P., Begum, J., Bruton, R. K., Pearce, H., Verma, K., et al. (2021) · Nature Immunology · doi:10.1038/s41590-021-01089-8 · Cited by 197
Imprinted SARS-CoV-2-Specific Memory Lymphocytes Define Hybrid Immunity
Rodda, L. B., Morawski, P. A., Pruner, K. B., Fahning, M. L., Howard, C. A., Franko, N., Logue, J. K., Eggenberger, J., Stokes, C., Golez, I., et al. (2022) · Cell · doi:10.1016/j.cell.2022.03.018 · Cited by 200
“Pre-vaccination, PI individuals had significantly more RBD-specific antigen-experienced B cells (CD21CD27 and CD21 CD27 ) (Cancro and Tomayko, 2021; Figures 1B, 1C, and S1C) and plasma RBD-specific IgG and IgA than N individuals (Figures 1D and 1E), reflecting the sustained memory response to their previous SARS-CoV-2…”
BackgroundSherina, N., Piralla, A., Du, L., Wan, H., Kumagai‐Braesch, M., Andréll, J., Braesch‐Andersen, S., Cassaniti, I., Percivalle, E., Sarasini, A., et al. (2021) · Med · doi:10.1016/j.medj.2021.02.001 · Cited by 192
“The difference could be explained by the small number of samples included in our study, especially in the early disease phase, and/or the higher proportion of aged and severe patients in our cohort, as SARS-CoV2-specific T cell response may be stronger and persist longer in patients with severe disease due to a higher…”
Economic Burden of COVID-19: A Systematic Review
Richards, F., Kodjamanova, P., Chen, X., Li, N., Atanasov, P. Y., Bennetts, L. E., Patterson, B. J., Yektashenas, B. H., Mesa‐Frias, M., Tronczyński, K., et al. (2022) · ClinicoEconomics and Outcomes Research · doi:10.2147/ceor.s338225 · Cited by 192
“The study types of interest were observational costing studies and assessments of the economic impact of COVID-19.”
BackgroundInfluentialAdaptive immune determinants of viral clearance and protection in mouse models of SARS-CoV-2
Israelow, B., Mao, T., Klein, J., Song, E., Menasche, B., Omer, S. B., & Iwasaki, A. (2021) · Science Immunology · doi:10.1126/sciimmunol.abl4509 · Cited by 189
“Adaptive immune memory has been detected for as long as 8 months after primary infection with SARS-CoV-2 consisting of memory CD4+ T cells, CD8+ T cells, B cells and antibodies (1, 4, 33, 34).”
The humoral response and antibodies against SARS-CoV-2 infection
Qi, H., Liu, B., Wang, X., & Zhang, L. (2022) · Nature Immunology · doi:10.1038/s41590-022-01248-5 · Cited by 195
Wiendl, H., Gold, R., Berger, T., Derfuss, T. J., Linker, R. A., Mäurer, M., Aktaş, O., Baum, K., Berghoff, M., Bittner, S., et al. (2021) · Therapeutic Advances in Neurological Disorders · doi:10.1177/17562864211039648 · Cited by 207
“127 129 Hence, the measurement of antibody formation is ultimately not the sole information required for expected protection against infection or a more severe disease course.”
BackgroundVijayakumar, B., Boustani, K., Ogger, P. P., Papadaki, A., Tonkin, J., Orton, C. M., Ghai, P., Suveizdytė, K., Hewitt, R. J., Desai, S. R., et al. (2022) · Immunity · doi:10.1016/j.immuni.2022.01.017 · Cited by 188
“…infection results in the formation of longlasting systemic immunological memory, with virus-specific antibodies and T cell responses still detectable in the majority of those infected at least 8 months post-infection and higher titers seen in previously hospitalized individuals (Dan et al., 2021).”
Escandón-Vargas, K., Rasmussen, A. L., Bogoch, I. I., Murray, E. J., Escandón, K., Popescu, S. V., & Kindrachuk, J. (2021) · BMC Infectious Diseases · doi:10.1186/s12879-021-06357-4 · Cited by 206
Adaptive immune determinants of viral clearance and protection in mouse models of SARS-CoV-2
Israelow, B., Mao, T., Klein, J., Song, E., Menasche, B., Omer, S. B., & Iwasaki, A. (2021) · doi:10.1101/2021.05.19.444825 · Cited by 189
(2021) · doi:10.1016/j.eclinm.2021.100861 · Cited by 201
“Other studies of reinfection also indicated lower incidence of infection in those antibody-positive or with a prior PCR-confirmed infection [5,40-46], and a study of immunological memory in a cohort of COVID-19 patients indicated durability of the immune response for at least 6 8 months [47].”
T Cell Responses to SARS-CoV-2
Sette, A., Sidney, J., & Crotty, S. (2023) · Annual Review of Immunology · doi:10.1146/annurev-immunol-101721-061120 · Cited by 191
Self-citationPsychological and Behavioral Predictors of Vaccine Efficacy: Considerations for COVID-19
Madison, A. A., Shrout, M. R., Renna, M. E., & Kiecolt‐Glaser, J. K. (2021) · Perspectives on Psychological Science · doi:10.1177/1745691621989243 · Cited by 187
Antibody Response to the BNT162b2 mRNA COVID-19 Vaccine in Subjects with Prior SARS-CoV-2 Infection
Gobbi, F. G., Buonfrate, D., Moro, L., Rodari, P., Piubelli, C., Caldrer, S., Riccetti, S., Sinigaglia, A., & Barzon, L. (2021) · Viruses · doi:10.3390/v13030422 · Cited by 176
“The rapid and robust neutralizing antibody response to vaccination in these subjects confirms the persistence of the immunological memory of SARS-CoV-2 [5].”
BackgroundKinetics and correlates of the neutralizing antibody response to SARS-CoV-2 infection in humans
Vanshylla, K., Di Cristanziano, V., Kleipass, F., Dewald, F., Schommers, P., Gieselmann, L., Gruell, H., Schlotz, M., Ercanoglu, M. S., Stumpf, R., et al. (2021) · Cell Host & Microbe · doi:10.1016/j.chom.2021.04.015 · Cited by 153
Metadata
- Authors
- Dan, J. M., Mateus, J., Kato, Y., Hastie, K. M., Yu, E. D., Faliti, C. E., Grifoni, A., Ramirez, S. I., Haupt, S., Frazier, A., Nakao, C., Rayaprolu, V., Rawlings, S. A., Peters, B., Krammer, F., Simon, V., Saphire, E. O., Smith, D. M., Weiskopf, D., Sette, A., & Crotty, S.
- Affiliations
- La Jolla Institute for Immunology (US)
- Center for Infectious Disease and Vaccine Research, La Jolla Institute for Immunology (LJI), La Jolla, CA 92037, USA.
- University of California San Diego (US)
- Icahn School of Medicine at Mount Sinai (US)
- Corresponding author
- Dan, Jennifer M.
- Kato, Yu
- Weiskopf, Daniela
- Sette, Alessandro
- Crotty, Shane
- ORCID
- Dan, Jennifer M.
- Mateus, Jose
- Kato, Yu
- Hastie, Kathryn M.
- Yu, Esther Dawen
- Faliti, Caterina E.
- Grifoni, Alba
- Ramirez, Sydney I.
- Haupt, Sonya
- Frazier, April
- Nakao, Catherine
- Rayaprolu, Vamseedhar
- Rawlings, Stephen A.
- Peters, Bjoern
- Krammer, Florian
- Simon, Viviana
- Saphire, Erica Ollmann
- Smith, Davey M.
- Weiskopf, Daniela
- Sette, Alessandro
- Crotty, Shane
- Venue
- Science
- Published
- 2021-02-05
- Volume
- 371
- Issue
- 6529
- ISSN
- 0036-8075 (ISSN-L)
- 1095-9203
- PMC
- PMC7919858
- OpenAlex
- W3121008609
- Cited by
- 2,656
- References
- 80
- Citations by year
- 2026: 84 · 2025: 152 · 2024: 218 · 2023: 384 · 2022: 839 · 2021: 972
- FWCI
- 191.29
- Type
- journal article
- Language
- en
- Open access
- hybrid
- doi.org
- Licence
- Locations
- Science (publishedVersion, cc-by)
- PubMed Central (publishedVersion, cc-by)
- PubMed (publishedVersion)
- Informationszentrum Lebenswissenschaften (ZB MED) (submittedVersion, cc-by)
- eScholarship (California Digital Library) (submittedVersion)
- ImmPort
- Funders
- National Institutes of Health (Nr. 75N9301900065)
- National Institute of Allergy and Infectious Diseases (AI142742, AI135078, HHSN272201400008C, 75N93019C00051, AI007036, U01 AI141995, AI141995-03, U01 CA260541-01, AI007384)
- Bill and Melinda Gates Foundation (INV-006133)
- Wellcome (INV-006133)
- Mastercard Incorporated (INV-006133)
- JPB Foundation
- Open Philanthropy Project (2020-215611)
- Steven and Alexandra Cohen Foundation
- John and Mary Tu Foundation
- Topics
- Health Sciences › Medicine › Infectious Diseases › SARS-CoV-2 and COVID-19 Research
- Life Sciences › Immunology and Microbiology › Immunology › Immune responses and vaccinations
- Health Sciences › Medicine › Infectious Diseases › COVID-19 Clinical Research Studies
- Keywords
- SARS-CoV-2, COVID-19 pandemic, immunological memory, memory B cells, CD8+ T cells, CD4+ T cells, adaptive immune response, long-term immunity, reinfection, vaccine efficacy, immune response heterogeneity
- MeSH terms
- COVID-19, Adult, Aged, Aged, 80 and over, Antibodies, Viral, B-Lymphocytes, Cross-Sectional Studies, Female, Humans, Immunologic Memory, Longitudinal Studies, Male, Middle Aged, United States, CD4-Positive T-Lymphocytes, CD8-Positive T-Lymphocytes, Young Adult, Antibodies, Neutralizing, Spike Glycoprotein, Coronavirus
About these checks
Registry, retraction, Cites and statistics results are computed, not judged, with one exception: a printed reference that no index lists is read once by a model before it counts as a citation error. Claims are extracted by a model and kept only when their quote appears verbatim in the text; each cited source is then checked, with a model’s help, for whether it says what the claim relies on. Those verdicts can be wrong — read the claim’s quote and the cited source before relying on one.
Statistics and arithmetic are recomputed, not judged.
Confidence bands are shown only for fields calibrated on our annotated test set. None is calibrated yet, so no band is shown.
What counts as a claim ›How we measure confidence ›How we check this ›
Are you an author, or do you see a problem with this page? Request a review
