

The DOI matches its Crossref record; 86 of the 86 references it cites were found in a registry or an index; 1 of the 59 sources its claims cite were checked for support.
Adipose tissue transcriptomic signature highlights the pathological relevance of extracellular matrix in human obesity
Open accessAbstract
Background: Investigations performed in mice and humans have acknowledged obesity as a low-grade inflammatory disease. Several molecular mechanisms have been convincingly shown to be involved in activating inflammatory processes and altering cell composition in white adipose tissue (WAT). However, the overall importance of these alterations, and their long-term impact on the metabolic functions of the WAT and on its morphology, remain unclear. Results: Here, we analyzed the transcriptomic signature of the subcutaneous WAT in obese human subjects, in stable weight conditions and after weight loss following bariatric surgery. An original integrative functional genomics approach was applied to quantify relations between relevant structural and functional themes annotating differentially expressed genes in order to construct a comprehensive map of transcriptional interactions defining the obese WAT. These analyses highlighted a significant up-regulation of genes and biological themes related to extracellular matrix (ECM) constituents, including members of the integrin family, and suggested that these elements could play a major mediating role in a chain of interactions that connect local inflammatory phenomena to the alteration of WAT metabolic functions in obese subjects. Tissue and cellular investigations, driven by the analysis of transcriptional interactions, revealed an increased amount of interstitial fibrosis in obese WAT, associated with an infiltration of different types of inflammatory cells, and suggest that phenotypic alterations of human pre-adipocytes, induced by a pro-inflammatory environment, may lead to an excessive synthesis of ECM components. Conclusion: This study opens new perspectives in understanding the biology of human WAT and its pathologic changes indicative of tissue deterioration associated with the development of obesity.
Overview
AI snapshot
Written from the paper’s full text.
TL;DR
In subcutaneous white adipose tissue from obese humans, transcriptomic analysis revealed a segregated signature linking extracellular matrix/inflammatory processes in the stroma-vascular fraction with down-regulated intracellular metabolic/apoptotic processes in mature adipocytes. Histology confirmed increased interstitial fibrosis in obese WAT that persisted three months after bariatric surgery, and macrophage-conditioned medium induced ECM production by pre-adipocytes.
Key findings
- In 35 cDNA microarrays from 25 weight-stable obese subjects (BMI 40.58 ± 1.58 kg/m²) and 10 lean controls (BMI 23.67 ± 0.48 kg/m²), SAM detected 366 up- and 474 down-regulated genes at 5% FDR; up-regulated genes were annotated mainly to membrane/extracellular/immune/inflammatory themes, while down-regulated genes were annotated to intracellular, lipid/energy metabolism, and apoptosis themes.
- Two segregated interaction modules were identified: module 1 grouped ECM, inflammatory, cell adhesion, and signaling themes and was enriched in genes expressed predominantly in the stroma-vascular fraction; module 2 grouped intracellular metabolic, mitochondrial, ribosomal, and apoptotic themes and was enriched in genes expressed predominantly in mature adipocytes. Among over-represented GO categories, 40 ECM-related genes (12.5%; 24 up-regulated and 16 down-regulated) were found.
- Subcutaneous WAT fibrosis was significantly higher in obese subjects than lean controls (6.29% ± 2 versus 2.19% ± 0.25, p < 0.05) and remained high three months after bariatric surgery (5.7% ± 1.63); patients with the highest hepatic fibrosis score also had more WAT fibrosis (p < 0.05).
- After gastric bypass, 10 cDNA microarrays showed 1,744 up- and 1,627 down-regulated genes at 5% FDR, with up-regulated oxidative phosphorylation/mitochondrial and glycan-degradation pathways and down-regulated immune/inflammatory/signaling/ECM themes; in pre-adipocytes treated with activated macrophage-conditioned medium, >5,200 genes were up-regulated, 71.4% of ECM-related genes changed in obese WAT also changed in vitro, 60% shared the same direction (p < 0.05), and TGF-beta showed a 2.5-fold increase (p < 0.05).
Methods
- Prospective recruitment included 55 obese subjects and 15 lean controls; 35 cDNA microarrays compared subcutaneous WAT from 25 weight-stable obese subjects and 10 lean controls, 10 paired arrays compared WAT before and three months after laparoscopic gastric bypass, fraction-comparison arrays used subcutaneous WAT from 9 overweight women, and 8 arrays tested human pre-adipocytes cultured with activated macrophage-conditioned media. Raw data were deposited in GEO (GSE9157).
- Differential expression used print-tip loess normalization and SAM at a 5% FDR; functional annotation used GO and KEGG over-representation, transcriptomic interaction maps were built by quantifying expression similarity between annotated themes and clustering with spectral methods, and gene co-expression networks used Spearman’s correlation with an absolute Rs ≥ 0.8 threshold plus centrality measures.
- Tissue and cellular validation included morphometry, picrosirius red fibrosis quantification, CD3/NKp46 immunohistochemistry, electron microscopy, liver histopathology, RTqPCR, and immunofluorescence for collagen type I and fibronectin in pre-adipocytes.
Limitations
- The paper states that enzymatic digestion used to separate adipocytes and SVF cells may influence their expression profiles, that the precise phenotype of macrophages in human WAT is still unknown, that other SVF cell types such as myofibroblasts or fibroblasts need further characterization, and that WAT fibrosis may be irreversible or may take more than three months to resolve after weight loss.
- Evident from the text: several substudies rely on small samples (10 obese subjects before/after surgery, 10 lean controls for fibrosis, 5 women for pre-adipocyte culture, 9 overweight women for fraction arrays), and the design is observational/correlational, so causal direction is not established.
- Evident from the text: the main findings are microarray-based and require further mechanistic validation, although selected genes were assessed by RTqPCR and cellular/histological follow-up.
Model-written summary. Check it against the paper before relying on it.
Integrity signals
Registry
Cites
Statistics
Figures
Verification
Claims the paper makes
68 Own result · 45 Not checked yet · 14 Own interpretation · 10 Own method · 1 Supported so far · 1 No basis given
A result the paper reports from its own data — it cites no other source for it, so there is none to check. The quote shows it is in the paper.
In the paper
“Analysis of the transcriptomic signature of white adipose tissue in obese human subjects revealed increased interstitial fibrosis and an infiltration of inflammatory cells into the tissue.”
- Also stated in: § Background · plain
“Tissue and cellular investigations, directed by the hypotheses raised by the analysis of gene and functional interactions, show that subcutaneous adipose tissue of obese subjects is characterized by an excessive amount of interstitial fibrosis”
§ Adipose tissue transcriptomic signature highlights the pathological relevance of extracellular matrix in human obesity > Abstract
plaincorrelational- Asserted: passes — The authors put it forward as true.
- Checkable: passes — It can be checked against evidence.
- Load-bearing: passes — The paper’s conclusions depend on it.
- Based: passes — The paper gives a reason why it holds.
- Also stated in: § Background · plain
A result the paper reports from its own data — it cites no other source for it, so there is none to check. The quote shows it is in the paper.
In the paper
“Analysis of the transcriptomic signature of white adipose tissue in obese human subjects revealed increased interstitial fibrosis and an infiltration of inflammatory cells into the tissue.”
§ Adipose tissue transcriptomic signature highlights the pathological relevance of extracellular matrix in human obesity > Abstract
plaincorrelational- Asserted: passes — The authors put it forward as true.
- Checkable: passes — It can be checked against evidence.
- Load-bearing: passes — The paper’s conclusions depend on it.
- Based: passes — The paper gives a reason why it holds.
None of the sources cited for this claim have been checked yet.
In the paper
“Also, the heat shock protein 8 (HSPA8), a surface marker for the undifferentiated cellular state expressed on the surface of human embryonic stem cells [39], performs an important role in the repair processes following harmful tissular assaults (for example, hemorrhage or local ischemia) [40], and was found to be significantly co-expressed with integrin alpha V, annexin I and other ECM components.”
§ Adipose tissue transcriptomic signature highlights the pathological relevance of extracellular matrix in human obesity > Results > The transcriptomic signature of the subcutaneous WAT in obese subjects
What the sources say
- Not checked yetcites [39] Son YS, Park JH, Kang YK, Park JS, Choi HS, Lim JY, Lee JE, Lee JB, Ko MS, Kim YS, Kob JH, Yoonc HS, Leed KW, Seongd RH, Moonf SY, Ryua CJ, Hong HJ: Heat shock 70-kDa protein 8 isoform 1 is expressed on the surface of human embryonic stem cells and downregulated upon differentiation. Stem Cells. 2005, 23: 1502-1513. 10.1634/stemcells.2004-0307. source
- Not checked yetcites [40] Kiang JG: Inducible heat shock protein 70 kD and inducible nitric oxide synthase in hemorrhage/resuscitation-induced injury. Cell Res. 2004, 14: 450-459. 10.1038/sj.cr.7290247. source
plaincorrelational- Asserted: passes — The authors put it forward as true.
- Checkable: passes — It can be checked against evidence.
- Load-bearing: unclear — It is unclear whether the paper’s conclusions depend on it.
- Based: passes — The paper gives a reason why it holds.
A result the paper reports from its own data — it cites no other source for it, so there is none to check. The quote shows it is in the paper.
In the paper
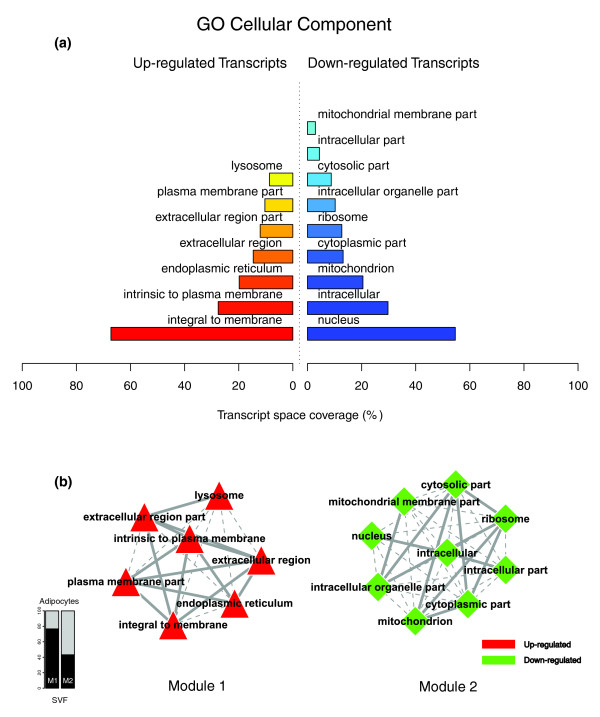
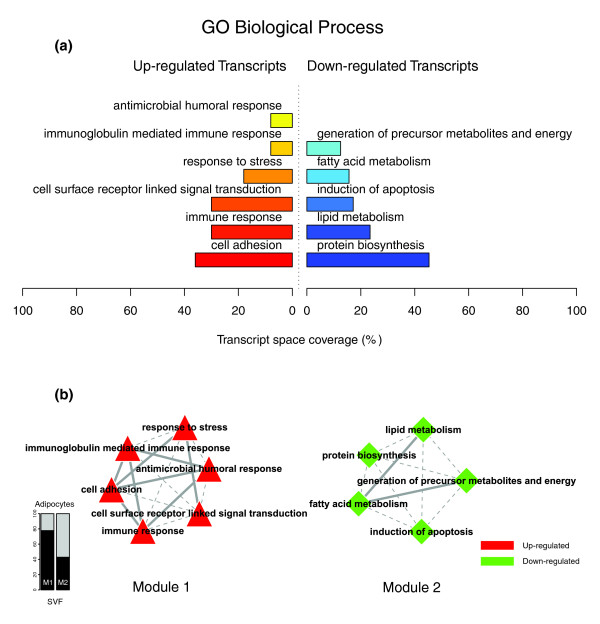
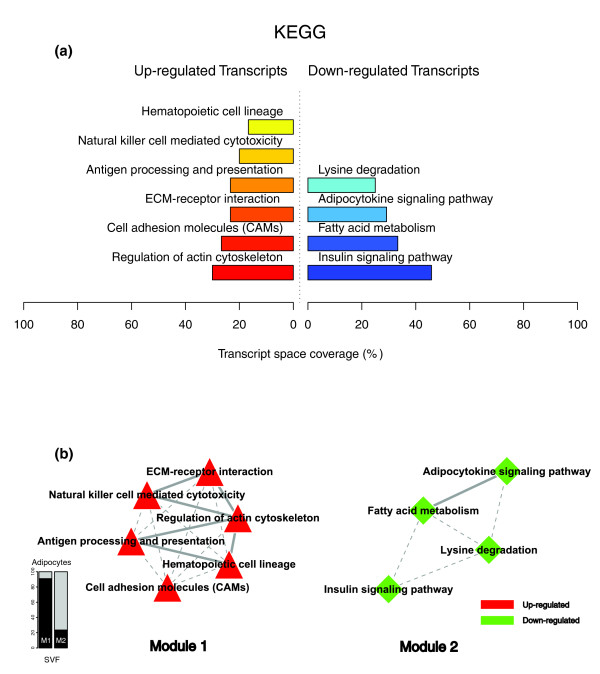
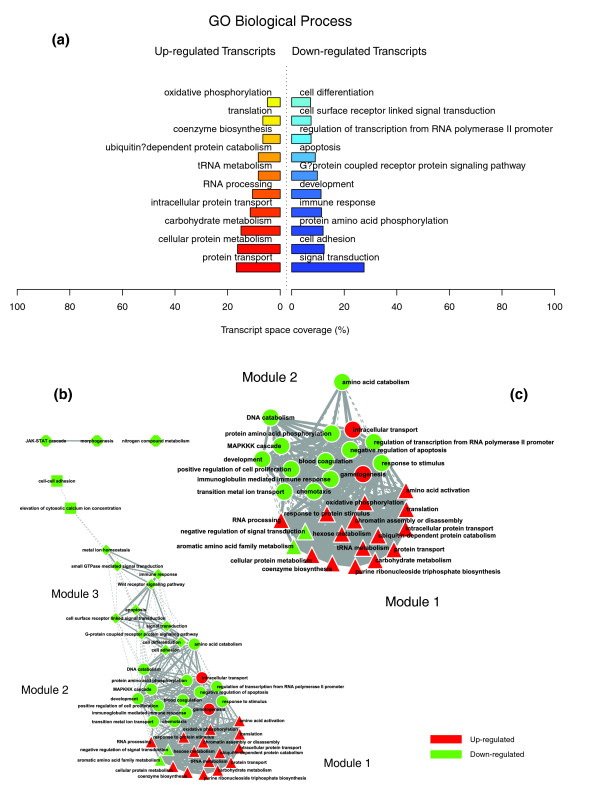
“This analysis uncovered a highly segregated transcriptomic interaction pattern, regardless of the system used to annotate differentially expressed genes (Figures 1b, 2b and 3b).”
§ Adipose tissue transcriptomic signature highlights the pathological relevance of extracellular matrix in human obesity > Results > The transcriptomic signature of the subcutaneous WAT in obese subjects
plain- Asserted: passes — The authors put it forward as true.
- Checkable: passes — It can be checked against evidence.
- Load-bearing: passes — The paper’s conclusions depend on it.
- Based: passes — The paper gives a reason why it holds.
A result the paper reports from its own data — it cites no other source for it, so there is none to check. The quote shows it is in the paper.
In the paper
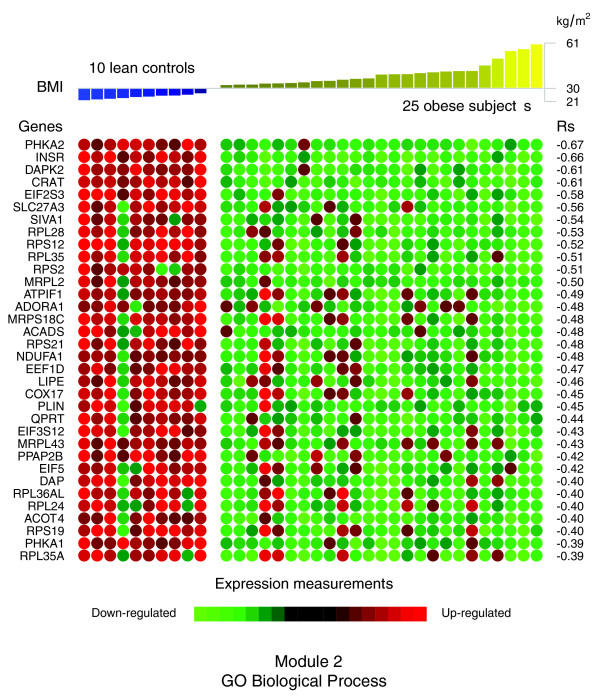
“Also, the expression profiles of numerous components of cytoplasmic or mitochondrial ribosomal subunits showed significant negative correlations with the BMI (RPL28, RPS12, RPL35, RPS2, and RPS21 among others).”
§ Adipose tissue transcriptomic signature highlights the pathological relevance of extracellular matrix in human obesity > Results > The transcriptomic signature of the subcutaneous WAT in obese subjects
plaincorrelational- Asserted: passes — The authors put it forward as true.
- Checkable: passes — It can be checked against evidence.
- Load-bearing: unclear — It is unclear whether the paper’s conclusions depend on it.
- Based: passes — The paper gives a reason why it holds.
A result the paper reports from its own data — it cites no other source for it, so there is none to check. The quote shows it is in the paper.
In the paper
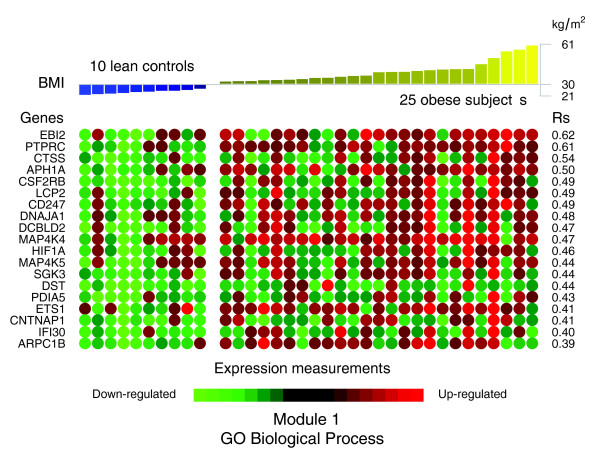
“In contrast with the genes comprising the co-expression module 1, the expression profiles of the majority of the genes comprising module 2 demonstrated significant negative correlations with BMI (Figure 7 and Table 2).”
§ Adipose tissue transcriptomic signature highlights the pathological relevance of extracellular matrix in human obesity > Results > The transcriptomic signature of the subcutaneous WAT in obese subjects
plaincorrelational- Asserted: passes — The authors put it forward as true.
- Checkable: passes — It can be checked against evidence.
- Load-bearing: passes — The paper’s conclusions depend on it.
- Based: passes — The paper gives a reason why it holds.
In the paper
“Among the genes showing the strongest association with the BMI were cathepsin S (CTSS), involved in the degradation of several components of the extracellular matrix [19], lymphocyte cytosolic protein 2 (LCP2) and CD247 (CD247), both related to T cell development and activation, as well as the hypoxia-inducible factor 1 (HIF1A).”
§ Adipose tissue transcriptomic signature highlights the pathological relevance of extracellular matrix in human obesity > Results > The transcriptomic signature of the subcutaneous WAT in obese subjects
What the sources say
- Not checked yetcites [19] Taleb S, Lacasa D, Bastard JP, Poitou C, Cancello R, Pelloux V, Viguerie N, Benis A, Zucker JD, Bouillot JL, Coussieu C, Basdevant A, Langin D, Clement K: Cathepsin S, a novel biomarker of adiposity: relevance to atherogenesis. FASEB J. 2005, 19: 1540-1542. source
plaincorrelational- Asserted: passes — The authors put it forward as true.
- Checkable: passes — It can be checked against evidence.
- Load-bearing: passes — The paper’s conclusions depend on it.
- Based: passes — The paper gives a reason why it holds.
In the paper
“The analysis of the differential gene expression with the Significance analysis of microarrays (SAM) procedure [21], performed on the cDNA measurements with signals recovered in at least 80% of the microarray experiments, detected 366 up- and 474 down-regulated genes, corresponding to a 5% false discovery rate (FDR).”
§ Adipose tissue transcriptomic signature highlights the pathological relevance of extracellular matrix in human obesity > Results > The transcriptomic signature of the subcutaneous WAT in obese subjects
What the sources say
- Not checked yetcites [21] Tusher VG, Tibshirani R, Chu G: Significance analysis of microarrays applied to the ionizing radiation response. Proc Natl Acad Sci USA. 2001, 98: 5116-5121. 10.1073/pnas.091062498. source
plaincorrelationaln = 25- Asserted: passes — The authors put it forward as true.
- Checkable: passes — It can be checked against evidence.
- Load-bearing: passes — The paper’s conclusions depend on it.
- Based: passes — The paper gives a reason why it holds.
A result the paper reports from its own data — it cites no other source for it, so there is none to check. The quote shows it is in the paper.
In the paper
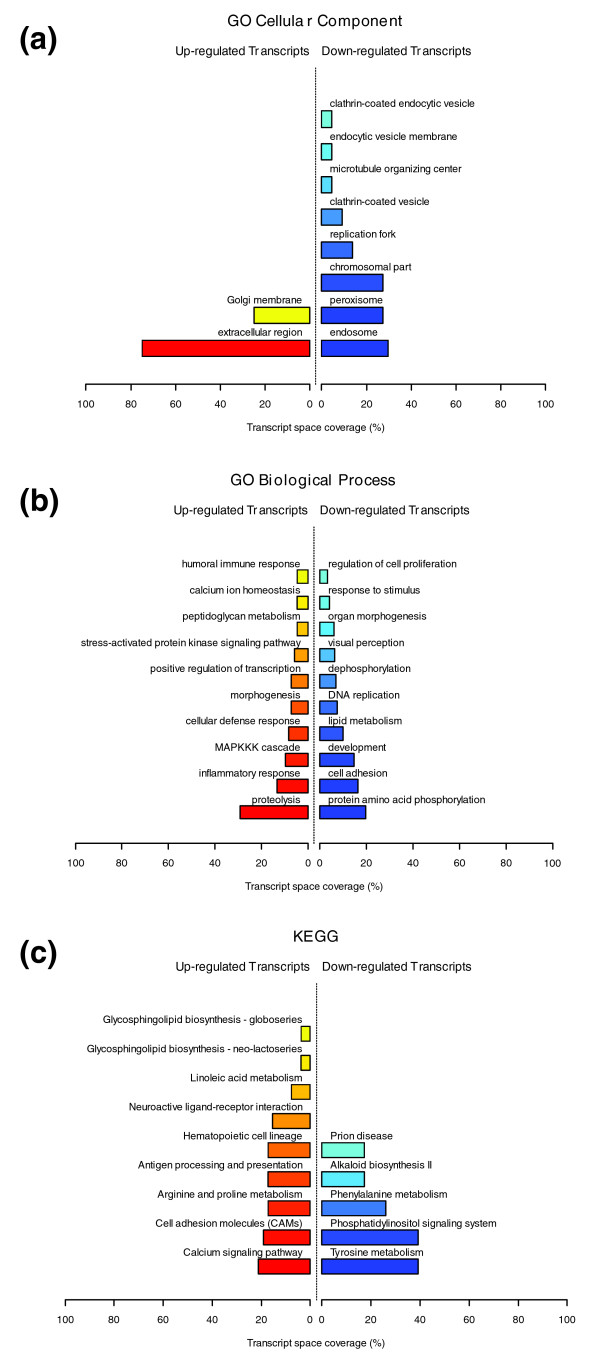
“GO Cellular Component categories annotating up-regulated genes (Figure 1a) formed a first module (Figure 1b, module 1) composed from themes primarily related to membrane components ('integral to membrane', 'plasma membrane part', 'intrinsic to plasma membrane') and to the extracellular region ('extracellular region', 'extracellular region part').”
§ Adipose tissue transcriptomic signature highlights the pathological relevance of extracellular matrix in human obesity > Results > The transcriptomic signature of the subcutaneous WAT in obese subjects
plain- Asserted: passes — The authors put it forward as true.
- Checkable: passes — It can be checked against evidence.
- Load-bearing: passes — The paper’s conclusions depend on it.
- Based: passes — The paper gives a reason why it holds.
A result the paper reports from its own data — it cites no other source for it, so there is none to check. The quote shows it is in the paper.
In the paper
“This module included integrins alpha V (ITGAV), referred to as the vitronectin receptor, and alpha M (ITGAM), as well as integrins beta 1 (ITGB1; also named fibronectin receptor or beta polypeptide), beta 2 (ITGB2) and beta 3 (ITGB5).”
§ Adipose tissue transcriptomic signature highlights the pathological relevance of extracellular matrix in human obesity > Results > The transcriptomic signature of the subcutaneous WAT in obese subjects
plain- Asserted: passes — The authors put it forward as true.
- Checkable: passes — It can be checked against evidence.
- Load-bearing: passes — The paper’s conclusions depend on it.
- Based: passes — The paper gives a reason why it holds.
- Probably not a substantial claim. 38
- It may state two separate claims as one. 43
- The quote only partly states this claim. 5
The sources with a verdict support this claim; the rest weren’t checked yet, have no full text we could read, or their verdicts aren’t rated yet.
In the paper
“Adipose loss leads to the improvement of the inflammatory profile [11], with a concomitant reduction of infiltrating macrophages [13].”
§ Adipose tissue transcriptomic signature highlights the pathological relevance of extracellular matrix in human obesity > Background
What the sources say
- Not checked yetcites [11] Clement K, Viguerie N, Poitou C, Carette C, Pelloux V, Curat CA, Sicard A, Rome S, Benis A, Zucker JD, Vidal H, Laville M, Barsh GS, Basdevant A, Štich V, Stich V, Cancello R, Langin D: Weight loss regulates inflammation-related genes in white adipose tissue of obese subjects. FASEB J. 2004, 18: 1657-1669. 10.1096/fj.04-2204com. source
- Supportedcites [13] Cancello R, Henegar C, Viguerie N, Taleb S, Poitou C, Rouault C, Coupaye M, Pelloux V, Hugol D, Bouillot JL, Bouloumié A, Barbatelli G, Cinti S, Svensson PA, Barsh GS, Zucker JD, Basdevant A, Langin D, Clément K: Reduction of macrophage infiltration and chemoattractant gene expression changes in white adipose tissue of morbidly obese subjects after surgery-induced weight loss. Diabetes. 2005, 54: 2277-2286. 10.2337/diabetes.54.8.2277. source
The citation is attached to the reduction in infiltrating macrophages. The Results report a significant reduction three months after surgery-induced weight loss, and the Discussion describes it as accompanying an improved inflammatory profile in morbidly obese patients. The finding concerns subcutaneous white adipose tissue. (LLM, conf=0.93)
plaindirect- Asserted: passes — The authors put it forward as true.
- Checkable: passes — It can be checked against evidence.
- Load-bearing: fails — The paper’s conclusions may not depend on it.
- Based: passes — The paper gives a reason why it holds.
Probably not a substantial claim. The paper’s conclusions may not depend on it. It may state two separate claims as one.
A result the paper reports from its own data — it cites no other source for it, so there is none to check. The quote shows it is in the paper.
In the paper
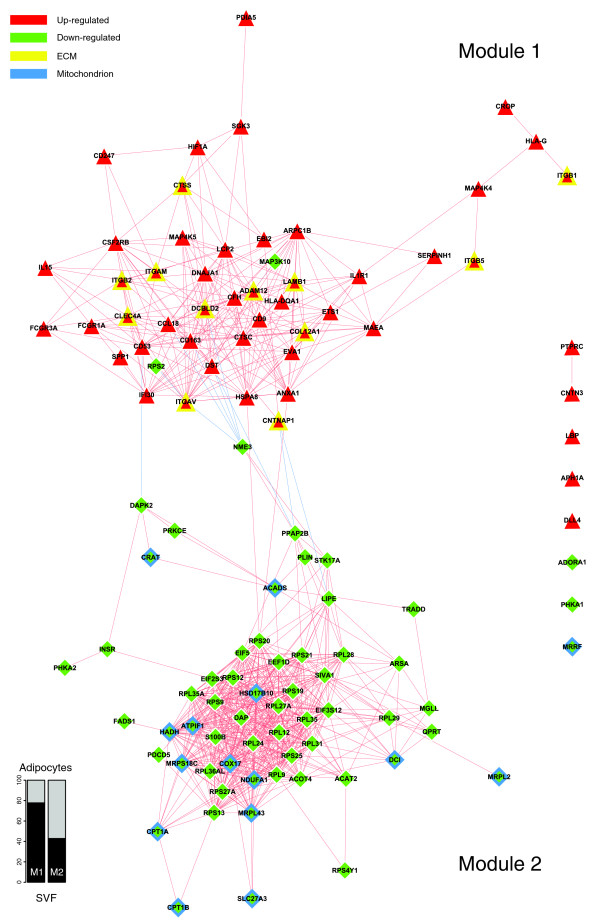
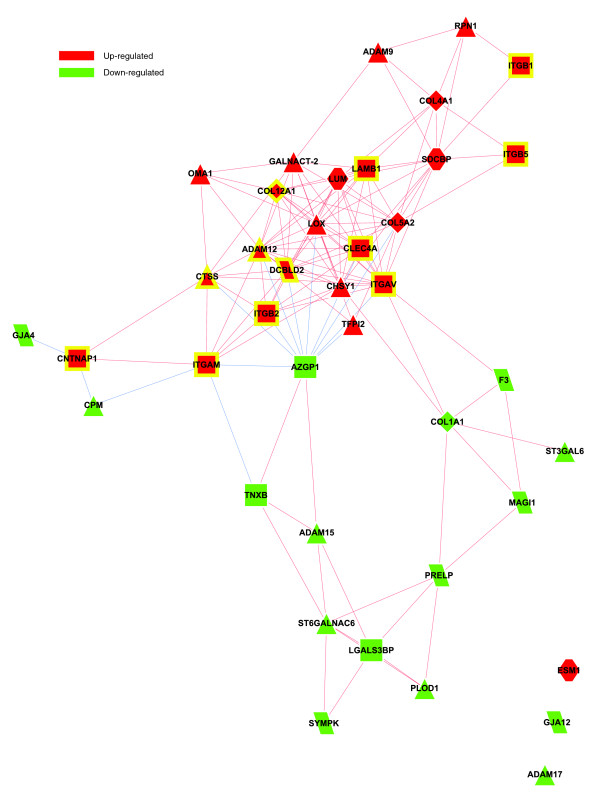
“Among various ECM components, several genes coding for members of the integrin family were found to be significantly induced and co-expressed in obese WAT, occupying central positions in the first co-expression module (Figure 4, module 1).”
§ Adipose tissue transcriptomic signature highlights the pathological relevance of extracellular matrix in human obesity > Results > The transcriptomic signature of the subcutaneous WAT in obese subjects
plaincorrelational- Asserted: passes — The authors put it forward as true.
- Checkable: passes — It can be checked against evidence.
- Load-bearing: passes — The paper’s conclusions depend on it.
- Based: passes — The paper gives a reason why it holds.
It may state two separate claims as one.
A result the paper reports from its own data — it cites no other source for it, so there is none to check. The quote shows it is in the paper.
In the paper
“While the genes up-regulated in the obese WAT were annotated mainly by structural and functional themes associated with the cellular membrane and the extracellular space, the down-regulated genes were annotated mostly by themes related to the intracellular domain.”
§ Adipose tissue transcriptomic signature highlights the pathological relevance of extracellular matrix in human obesity > Results > The transcriptomic signature of the subcutaneous WAT in obese subjects
plaincorrelational- Asserted: passes — The authors put it forward as true.
- Checkable: passes — It can be checked against evidence.
- Load-bearing: passes — The paper’s conclusions depend on it.
- Based: passes — The paper gives a reason why it holds.
It may state two separate claims as one.
None of the sources cited for this claim have been checked yet.
In the paper
“The functional analysis of these genes identified 704 genes (307 up- and 397 down-regulated) annotated with Gene Ontology (GO) categories [22], and 253 genes (101 up- and 152 down-regulated) annotated with categories of the Kyoto Encyclopedia of Genes and Genomes (KEGG) [23].”
§ Adipose tissue transcriptomic signature highlights the pathological relevance of extracellular matrix in human obesity > Results > The transcriptomic signature of the subcutaneous WAT in obese subjects
What the sources say
- Not checked yetcites [22] Gene Ontology. [http://www.geneontology.org]
- Not checked yetcites [23] Kyoto Encyclopedia of Genes and Genomes. [http://www.genome.jp/kegg/]
plainn = 25- Asserted: passes — The authors put it forward as true.
- Checkable: passes — It can be checked against evidence.
- Load-bearing: unclear — It is unclear whether the paper’s conclusions depend on it.
- Based: passes — The paper gives a reason why it holds.
It may state two separate claims as one.
A result the paper reports from its own data — it cites no other source for it, so there is none to check. The quote shows it is in the paper.
In the paper
“The expression levels of two members of the carnitine/choline acetyltransferase family (CPT1A and CPT1B) involved in this rate limiting step across the mitochondrial inner membrane were decreased as well as that of the CRAT gene, which catalyzes the reversible transfer of acyl groups from an acyl-CoA thioester to carnitine and regulates the ratio of acylCoA/CoA in the mitochondrial compartments.”
§ Adipose tissue transcriptomic signature highlights the pathological relevance of extracellular matrix in human obesity > Results > The transcriptomic signature of the subcutaneous WAT in obese subjects
plaincorrelational- Asserted: passes — The authors put it forward as true.
- Checkable: passes — It can be checked against evidence.
- Load-bearing: unclear — It is unclear whether the paper’s conclusions depend on it.
- Based: passes — The paper gives a reason why it holds.
It may state two separate claims as one.
A result the paper reports from its own data — it cites no other source for it, so there is none to check. The quote shows it is in the paper.
In the paper
“Interestingly, module 2 also gathered several genes involved in the induction of apoptosis, such as the death-associated protein (DAP), the death-associated protein kinase 2 (DAPK2), and the serine/threonine kinase 17a (STK17A), a member of the DAP kinase-related apoptosis-inducing protein kinase family, as well as the apoptosis-inducing factor (SIVA1), TNFRSF1A-associated via death domain (TRADD)”
§ Adipose tissue transcriptomic signature highlights the pathological relevance of extracellular matrix in human obesity > Results > The transcriptomic signature of the subcutaneous WAT in obese subjects
plaincorrelational- Asserted: passes — The authors put it forward as true.
- Checkable: passes — It can be checked against evidence.
- Load-bearing: unclear — It is unclear whether the paper’s conclusions depend on it.
- Based: passes — The paper gives a reason why it holds.
It may state two separate claims as one. The quote only partly states this claim.
A result the paper reports from its own data — it cites no other source for it, so there is none to check. The quote shows it is in the paper.
In the paper
“Our analysis revealed major and interrelated changes of WAT transcriptomic signature in obese human subjects, involving extracellular matrix (ECM), and inflammatory and adipose metabolic processes.”
§ Adipose tissue transcriptomic signature highlights the pathological relevance of extracellular matrix in human obesity > Background
plaincorrelational- Asserted: passes — The authors put it forward as true.
- Checkable: passes — It can be checked against evidence.
- Load-bearing: passes — The paper’s conclusions depend on it.
- Based: passes — The paper gives a reason why it holds.
It may state two separate claims as one.
A result the paper reports from its own data — it cites no other source for it, so there is none to check. The quote shows it is in the paper.
In the paper
“A number of these genes showed significant co-expression with members of the integrin family and are known to be involved in the recruitment and activation of immune circulating cells, such as monocytes, lymphocytes or neutrophils.”
§ Adipose tissue transcriptomic signature highlights the pathological relevance of extracellular matrix in human obesity > Results > The transcriptomic signature of the subcutaneous WAT in obese subjects
plaincorrelational- Asserted: passes — The authors put it forward as true.
- Checkable: passes — It can be checked against evidence.
- Load-bearing: passes — The paper’s conclusions depend on it.
- Based: passes — The paper gives a reason why it holds.
It may state two separate claims as one.
A result the paper reports from its own data — it cites no other source for it, so there is none to check. The quote shows it is in the paper.
In the paper
“As shown in Figure 4, some ECM related genes were co-expressed with a set of inflammatory genes (module 1), while showing a significant inverse expression pattern to that of genes belonging to the metabolic module (module 2).”
§ Adipose tissue transcriptomic signature highlights the pathological relevance of extracellular matrix in human obesity > Results > The transcriptomic signature of the subcutaneous WAT in obese subjects
plaincorrelational- Asserted: passes — The authors put it forward as true.
- Checkable: passes — It can be checked against evidence.
- Load-bearing: passes — The paper’s conclusions depend on it.
- Based: passes — The paper gives a reason why it holds.
It may state two separate claims as one.
A result the paper reports from its own data — it cites no other source for it, so there is none to check. The quote shows it is in the paper.
In the paper
“This analysis showed that biological themes related to the extracellular space (module 1) were annotating genes predominantly expressed in the SVF of WAT, while the genes annotated with themes related to the intracellular domain (module 2) were expressed predominantly in mature adipocytes (Figures 1b, 2b and 3b).”
§ Adipose tissue transcriptomic signature highlights the pathological relevance of extracellular matrix in human obesity > Results > The transcriptomic signature of the subcutaneous WAT in obese subjects
plaincorrelational- Asserted: passes — The authors put it forward as true.
- Checkable: passes — It can be checked against evidence.
- Load-bearing: passes — The paper’s conclusions depend on it.
- Based: passes — The paper gives a reason why it holds.
It may state two separate claims as one.
A result the paper reports from its own data — it cites no other source for it, so there is none to check. The quote shows it is in the paper.
In the paper
“Among them, integrin alpha V (ITGAV), CD163 and CCL18, two markers of the alternative pathway of macrophage activation, heat shock protein 8 (HSPA8), and contactin associated protein 1 (CNTNAP1), involved in the activation of intracellular signaling pathways, were strongly related to several genes encoding enzymes of the lipolytic pathway”
- Also stated in: § The transcriptomic signature of the subcutaneous WAT in obese subjects · plain
“and to genes related to apoptosis, such as death-associated protein kinase 2 (DAPK2) and non-metastatic cells 3 protein (NME3).”
§ Adipose tissue transcriptomic signature highlights the pathological relevance of extracellular matrix in human obesity > Results > The transcriptomic signature of the subcutaneous WAT in obese subjects
boostedcorrelational- Asserted: passes — The authors put it forward as true.
- Checkable: passes — It can be checked against evidence.
- Load-bearing: passes — The paper’s conclusions depend on it.
- Based: passes — The paper gives a reason why it holds.
The quote only partly states this claim.
- Also stated in: § The transcriptomic signature of the subcutaneous WAT in obese subjects · plain
A result the paper reports from its own data — it cites no other source for it, so there is none to check. The quote shows it is in the paper.
In the paper
“Two distinct types of biological interaction modules (indicated hereafter as module 1 and module 2) have been identified, one associating structural components, processes and regulatory pathways related to cellular membranes and the extracellular space (module 1), while the other groups components, processes and pathways associated with the intracellular domain (module 2).”
§ Adipose tissue transcriptomic signature highlights the pathological relevance of extracellular matrix in human obesity > Results > The transcriptomic signature of the subcutaneous WAT in obese subjects
plaincorrelational- Asserted: passes — The authors put it forward as true.
- Checkable: passes — It can be checked against evidence.
- Load-bearing: passes — The paper’s conclusions depend on it.
- Based: passes — The paper gives a reason why it holds.
It may state two separate claims as one.
A result the paper reports from its own data — it cites no other source for it, so there is none to check. The quote shows it is in the paper.
In the paper
“Functional analysis of these genes identified 2,687 genes (1,390 up- and 1,297 down-regulated) annotated with GO categories, and 868 genes (450 up- and 418 down-regulated) annotated with KEGG categories.”
§ Adipose tissue transcriptomic signature highlights the pathological relevance of extracellular matrix in human obesity > Results > The transcriptomic signature of the subcutaneous WAT in obese subjects
plain- Asserted: passes — The authors put it forward as true.
- Checkable: passes — It can be checked against evidence.
- Load-bearing: unclear — It is unclear whether the paper’s conclusions depend on it.
- Based: passes — The paper gives a reason why it holds.
It may state two separate claims as one.
A result the paper reports from its own data — it cites no other source for it, so there is none to check. The quote shows it is in the paper.
In the paper
“This analysis also highlighted a segregated transcriptomic interaction pattern in obese WAT, distinguishing two interaction modules: one (module 1) grouping inflammatory and ECM related processes and another (module 2) associating adipose metabolic functions and other themes related to apoptosis and protein synthesis processes.”
§ Adipose tissue transcriptomic signature highlights the pathological relevance of extracellular matrix in human obesity > Discussion > The transcriptomic signature of obese WAT illustrates the central role of ECM components in linking inflammatory and adipose metabolic anomalies
plaincorrelational- Asserted: passes — The authors put it forward as true.
- Checkable: passes — It can be checked against evidence.
- Load-bearing: passes — The paper’s conclusions depend on it.
- Based: passes — The paper gives a reason why it holds.
It may state two separate claims as one.
In the paper
“The examination of the genes grouped in these functions retrieved representatives from all classes of ECM components, such as structural proteins, including members of the collagen family and several precursors of collagen formation, adherent proteins, such as fibronectin 1 and its receptor, as well as laminin family members, glycosaminoglycans and proteoglycans (lumican (LUM)), and specialized”
§ Adipose tissue transcriptomic signature highlights the pathological relevance of extracellular matrix in human obesity > Results > Morphological characterization of the subcutaneous WAT in obese subjects
What the sources say
- Not checked yetcites [20] Companion Website to this Study. [http://corneliu.henegar.info/projects/FunNet/genome_biol_2008/index.htm]
plain- Asserted: passes — The authors put it forward as true.
- Checkable: passes — It can be checked against evidence.
- Load-bearing: passes — The paper’s conclusions depend on it.
- Based: passes — The paper gives a reason why it holds.
The quote only partly states this claim.
A result the paper reports from its own data — it cites no other source for it, so there is none to check. The quote shows it is in the paper.
In the paper
“Sixty percent of these ECM-related genes demonstrated a similar variation of their expression patterns in both in vivo and in vitro conditions, a proportion significantly greater (p value < 0.05) than the overall percentage of genes sharing similar expression patterns among those demonstrating a significant differential expression in the human and cell studies.”
§ Adipose tissue transcriptomic signature highlights the pathological relevance of extracellular matrix in human obesity > Results > Morphological characterization of the subcutaneous WAT in obese subjects
plaincorrelational- Asserted: passes — The authors put it forward as true.
- Checkable: passes — It can be checked against evidence.
- Load-bearing: passes — The paper’s conclusions depend on it.
- Based: passes — The paper gives a reason why it holds.
It may state two separate claims as one.
A result the paper reports from its own data — it cites no other source for it, so there is none to check. The quote shows it is in the paper.
In the paper
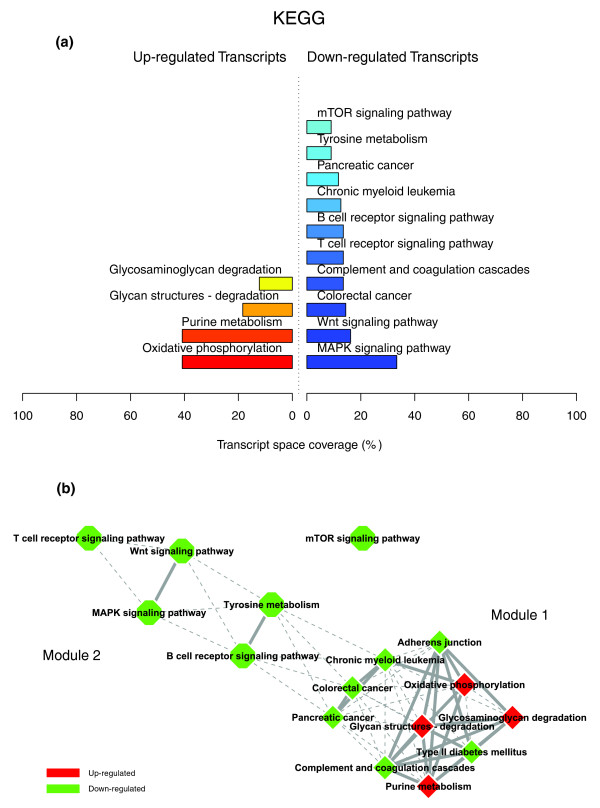
“Associated with the down-regulation of genes coding for inflammation mediators, an important number of genes related to oxidative phosphorylation and various other mitochondrial enzymes, as well as genes coding for enzymes involved in the degradation of glycosaminoglycans and proteoglycans, registered a significantly increased expression after weight loss.”
§ Adipose tissue transcriptomic signature highlights the pathological relevance of extracellular matrix in human obesity > Discussion > The transcriptomic signature of obese WAT illustrates the central role of ECM components in linking inflammatory and adipose metabolic anomalies
plaincorrelational- Asserted: passes — The authors put it forward as true.
- Checkable: passes — It can be checked against evidence.
- Load-bearing: passes — The paper’s conclusions depend on it.
- Based: passes — The paper gives a reason why it holds.
It may state two separate claims as one.
A result the paper reports from its own data — it cites no other source for it, so there is none to check. The quote shows it is in the paper.
In the paper
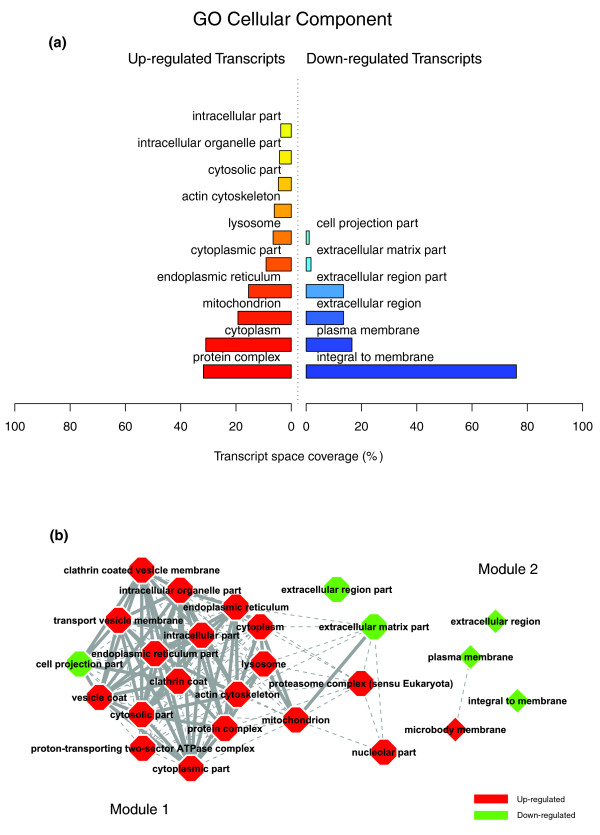
“Indeed, the majority of the genes up-regulated in WAT after gastric bypass were associated with structural themes (GO Cellular Component) related to the intracellular domain and organelles ('protein complex', 'cytoplasm', 'mitochondrion', 'endoplasmic reticulum', 'lysosome', 'actin cytoskeleton', 'cytosolic part'), while the down-regulated genes (Figure 8a) were mostly associated with cellular”
§ Adipose tissue transcriptomic signature highlights the pathological relevance of extracellular matrix in human obesity > Results > The transcriptomic signature of the subcutaneous WAT in obese subjects
plaincorrelational- Asserted: passes — The authors put it forward as true.
- Checkable: passes — It can be checked against evidence.
- Load-bearing: passes — The paper’s conclusions depend on it.
- Based: passes — The paper gives a reason why it holds.
It may state two separate claims as one.
A result the paper reports from its own data — it cites no other source for it, so there is none to check. The quote shows it is in the paper.
In the paper
“In addition, some metallopeptidases implicated in the degradation of other ECM components were equally induced, such as the matrix metallopeptidase 2 (MMP2), concomitantly with several metallopeptidase inhibitors from the tissue inhibitor of metalloproteinase family (TIMP1, TIMP2).”
§ Adipose tissue transcriptomic signature highlights the pathological relevance of extracellular matrix in human obesity > Results > The transcriptomic signature of the subcutaneous WAT in obese subjects
plaindirect- Asserted: passes — The authors put it forward as true.
- Checkable: passes — It can be checked against evidence.
- Load-bearing: unclear — It is unclear whether the paper’s conclusions depend on it.
- Based: passes — The paper gives a reason why it holds.
It may state two separate claims as one.
In the paper
“A number of ECM components showed opposite expression patterns to those noted in the previous condition, some being induced by weight loss while others were down-regulated (online supplementary Table 2 [20]).”
§ Adipose tissue transcriptomic signature highlights the pathological relevance of extracellular matrix in human obesity > Results > The transcriptomic signature of the subcutaneous WAT in obese subjects
What the sources say
- Not checked yetcites [20] Companion Website to this Study. [http://corneliu.henegar.info/projects/FunNet/genome_biol_2008/index.htm]
plaindirect- Asserted: passes — The authors put it forward as true.
- Checkable: passes — It can be checked against evidence.
- Load-bearing: unclear — It is unclear whether the paper’s conclusions depend on it.
- Based: passes — The paper gives a reason why it holds.
It may state two separate claims as one.
A result the paper reports from its own data — it cites no other source for it, so there is none to check. The quote shows it is in the paper.
In the paper
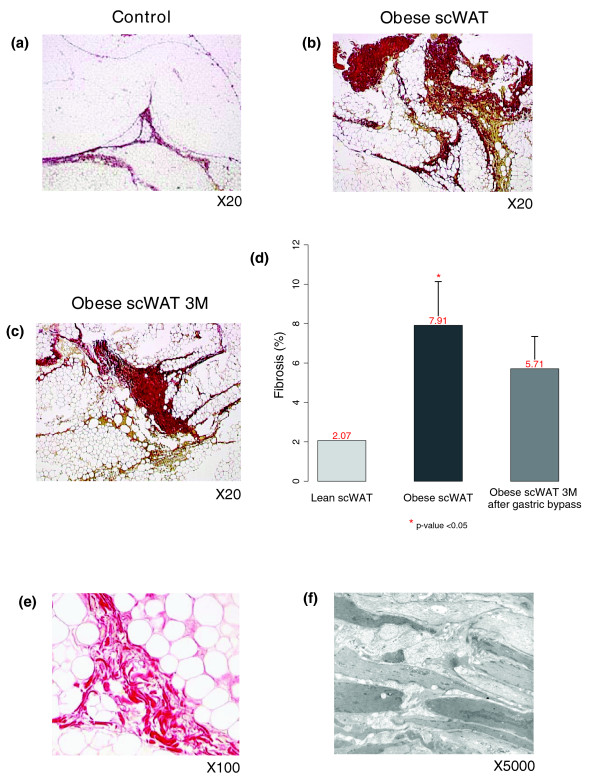
“Ffibrosis quantification in the same subjects three months after bariatric surgery found no significant decrease of interstitial fibrosis, in spite of a significant down-regulation of the genes related to inflammatory and immune responses and extensive variations in the expression of genes involved in ECM remodeling.”
§ Adipose tissue transcriptomic signature highlights the pathological relevance of extracellular matrix in human obesity > Discussion > Interstitial fibrosis in human adipose tissue
plain- Asserted: passes — The authors put it forward as true.
- Checkable: passes — It can be checked against evidence.
- Load-bearing: passes — The paper’s conclusions depend on it.
- Based: passes — The paper gives a reason why it holds.
It may state two separate claims as one.
A result the paper reports from its own data — it cites no other source for it, so there is none to check. The quote shows it is in the paper.
In the paper
“Interestingly, the surgery induced weight loss was associated with a major shift of the WAT regulatory and interaction patterns, which reversed the functional genomic profile of the obese WAT and dramatically increased the intensity of the interactions between up-regulated adipose metabolic processes and down-regulated inflammatory and immune responses.”
§ Adipose tissue transcriptomic signature highlights the pathological relevance of extracellular matrix in human obesity > Discussion > The transcriptomic signature of obese WAT illustrates the central role of ECM components in linking inflammatory and adipose metabolic anomalies
plaincorrelational- Asserted: passes — The authors put it forward as true.
- Checkable: passes — It can be checked against evidence.
- Load-bearing: passes — The paper’s conclusions depend on it.
- Based: passes — The paper gives a reason why it holds.
It may state two separate claims as one.
A result the paper reports from its own data — it cites no other source for it, so there is none to check. The quote shows it is in the paper.
In the paper
“This segregated interaction pattern was also confirmed by the observation that a significant fraction of the genes composing module 1 were positively correlated with BMI, while most of the genes grouped in module 2 showed negative correlation with the degree of obesity.”
§ Adipose tissue transcriptomic signature highlights the pathological relevance of extracellular matrix in human obesity > Discussion > The transcriptomic signature of obese WAT illustrates the central role of ECM components in linking inflammatory and adipose metabolic anomalies
plaincorrelational- Asserted: passes — The authors put it forward as true.
- Checkable: passes — It can be checked against evidence.
- Load-bearing: passes — The paper’s conclusions depend on it.
- Based: passes — The paper gives a reason why it holds.
It may state two separate claims as one.
A result the paper reports from its own data — it cites no other source for it, so there is none to check. The quote shows it is in the paper.
In the paper
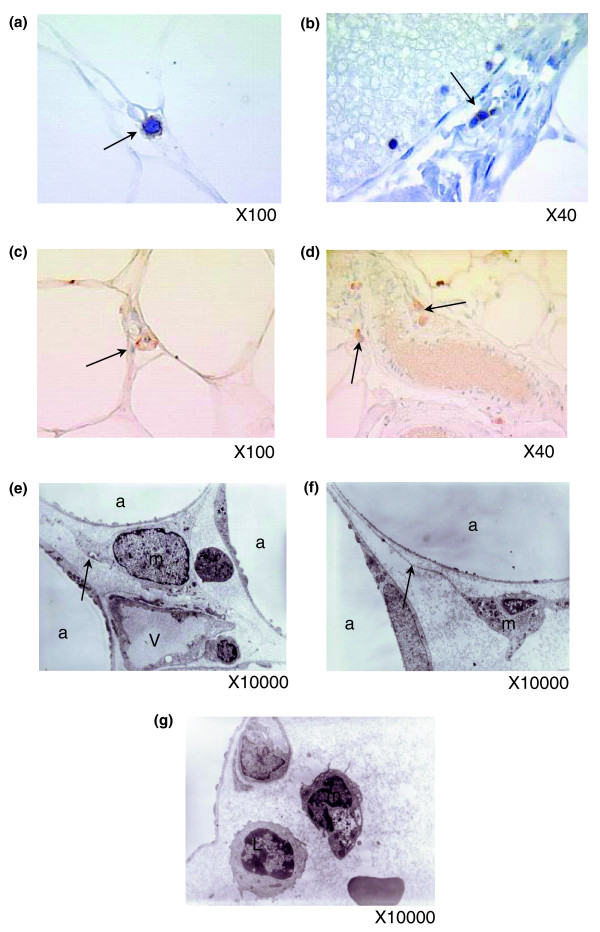
“We observed the presence of NK and T lymphocytes in obese WAT, although they appeared to be less abundant than macrophage cells.”
§ Adipose tissue transcriptomic signature highlights the pathological relevance of extracellular matrix in human obesity > Discussion > Inflammatory cells in human adipose tissue
hedged- Asserted: passes — The authors put it forward as true.
- Checkable: passes — It can be checked against evidence.
- Load-bearing: unclear — It is unclear whether the paper’s conclusions depend on it.
- Based: passes — The paper gives a reason why it holds.
It may state two separate claims as one.
A result the paper reports from its own data — it cites no other source for it, so there is none to check. The quote shows it is in the paper.
In the paper
“Among them, we noted the induction of IL13RA1, a subunit of the IL13 receptor complex reported to play a role in the internalization of IL13, and a major profibrotic protein known to induce transforming growth factor beta, and also of the IL4 receptor, which binds IL13 and IL4 and represents another well recognized profibrotic cytokine.”
§ Adipose tissue transcriptomic signature highlights the pathological relevance of extracellular matrix in human obesity > Results > Morphological characterization of the subcutaneous WAT in obese subjects
plaindirect- Asserted: passes — The authors put it forward as true.
- Checkable: passes — It can be checked against evidence.
- Load-bearing: unclear — It is unclear whether the paper’s conclusions depend on it.
- Based: passes — The paper gives a reason why it holds.
It may state two separate claims as one.
A result the paper reports from its own data — it cites no other source for it, so there is none to check. The quote shows it is in the paper.
In the paper
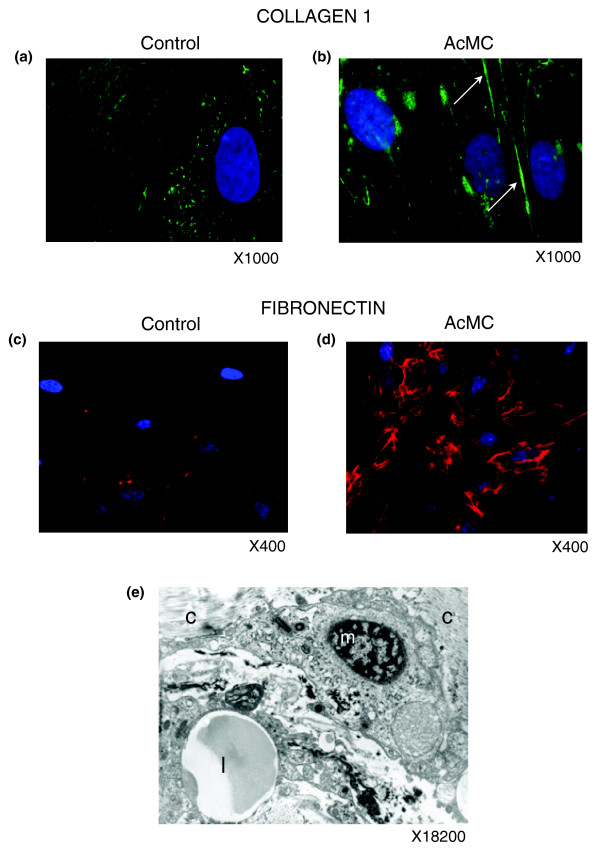
“In agreement, human pre-adipocytes cultured in the presence of AcMCs increased their production of fibronectin and collagen type I, which formed a fibrous network around the pre-adipocytes.”
§ Adipose tissue transcriptomic signature highlights the pathological relevance of extracellular matrix in human obesity > Discussion > Cell types producing ECM components in adipose tissue: the role of pre-adipocytes
plaindirect- Asserted: passes — The authors put it forward as true.
- Checkable: passes — It can be checked against evidence.
- Load-bearing: passes — The paper’s conclusions depend on it.
- Based: passes — The paper gives a reason why it holds.
It may state two separate claims as one.
A result the paper reports from its own data — it cites no other source for it, so there is none to check. The quote shows it is in the paper.
In the paper
“Collagen type I and fibronectin were over-expressed in AcMC-conditioned media and organized in a fiber network structure (Figure 14a-d).”
§ Adipose tissue transcriptomic signature highlights the pathological relevance of extracellular matrix in human obesity > Results > Morphological characterization of the subcutaneous WAT in obese subjects
plaindirect- Asserted: passes — The authors put it forward as true.
- Checkable: passes — It can be checked against evidence.
- Load-bearing: passes — The paper’s conclusions depend on it.
- Based: passes — The paper gives a reason why it holds.
It may state two separate claims as one.
The paper states this without a source or data behind it here, so there is nothing to check it against. The quote shows it is in the paper.
In the paper
“However, the relationship between these genes, the cellular processes in which they are involved, and the tissue structure as a whole remains poorly understood.”
§ Adipose tissue transcriptomic signature highlights the pathological relevance of extracellular matrix in human obesity > Background
plain- Asserted: passes — The authors put it forward as true.
- Checkable: fails — It may be too vague to check against evidence.
- Load-bearing: passes — The paper’s conclusions depend on it.
- Based: fails — The paper may give no reason why it holds.
Probably not a substantial claim. It may be too vague to check against evidence. The paper may give no reason why it holds.
In the paper
“CCL18 is also known to be involved in the recruitment and activation of CD4+ and CD8+ T cells and, more remarkably, is credited with playing a central role in perpetuating fibrotic processes through its involvement in a positive feedback loop that links activated macrophages to fibroblasts [26].”
§ Adipose tissue transcriptomic signature highlights the pathological relevance of extracellular matrix in human obesity > Results > The transcriptomic signature of the subcutaneous WAT in obese subjects
What the sources say
- Not checked yetcites [26] Prasse A, Pechkovsky DV, Toews GB, Jungraithmayr W, Kollert F, Goldmann T, Vollmer E, Muller-Quernheim J, Zissel G: A vicious circle of alveolar macrophages and fibroblasts perpetuates pulmonary fibrosis via CCL18. Am J Respir Crit Care Med. 2006, 173: 781-792. 10.1164/rccm.200509-1518OC. source
boosteddirect- Asserted: passes — The authors put it forward as true.
- Checkable: passes — It can be checked against evidence.
- Load-bearing: fails — The paper’s conclusions may not depend on it.
- Based: passes — The paper gives a reason why it holds.
Probably not a substantial claim. The paper’s conclusions may not depend on it. It may state two separate claims as one.
In the paper
“Co-expressed with Mac-1 components, the hypoxia-inducible factor 1 (HIF1A) is a well characterized transcription factor that performs an essential role in cellular responses to hypoxia. HIF1A is also involved in the regulation of macrophage migration, and modulates the metabolism of immune cells exposed to low oxygen tensions in hypoxic areas of inflamed tissues [30].”
§ Adipose tissue transcriptomic signature highlights the pathological relevance of extracellular matrix in human obesity > Results > The transcriptomic signature of the subcutaneous WAT in obese subjects
What the sources say
- Not checked yetcites [30] Sitkovsky M, Lukashev D: Regulation of immune cells by local-tissue oxygen tension: HIF1 alpha and adenosine receptors. Nat Rev Immunol. 2005, 5: 712-721. 10.1038/nri1685. source
boosteddirect- Asserted: passes — The authors put it forward as true.
- Checkable: passes — It can be checked against evidence.
- Load-bearing: fails — The paper’s conclusions may not depend on it.
- Based: passes — The paper gives a reason why it holds.
Probably not a substantial claim. The paper’s conclusions may not depend on it. It may state two separate claims as one.
In the paper
“We have shown previously that weight loss is associated with improvement in the inflammatory profile, together with regression of macrophage infiltration in WAT [11].”
§ Adipose tissue transcriptomic signature highlights the pathological relevance of extracellular matrix in human obesity > Results > The transcriptomic signature of the subcutaneous WAT in obese subjects
What the sources say
- Not checked yetcites [11] Clement K, Viguerie N, Poitou C, Carette C, Pelloux V, Curat CA, Sicard A, Rome S, Benis A, Zucker JD, Vidal H, Laville M, Barsh GS, Basdevant A, Štich V, Stich V, Cancello R, Langin D: Weight loss regulates inflammation-related genes in white adipose tissue of obese subjects. FASEB J. 2004, 18: 1657-1669. 10.1096/fj.04-2204com. source
boostedcorrelational- Asserted: passes — The authors put it forward as true.
- Checkable: passes — It can be checked against evidence.
- Load-bearing: unclear — It is unclear whether the paper’s conclusions depend on it.
- Based: passes — The paper gives a reason why it holds.
It may state two separate claims as one.
In the paper
“Available data demonstrate that the synthesis of CCL18 by alternatively activated macrophages is induced by Th2 cytokines, integrin beta 2 (ITGB2) and the scavenger receptor (CD163) [26].”
§ Adipose tissue transcriptomic signature highlights the pathological relevance of extracellular matrix in human obesity > Results > The transcriptomic signature of the subcutaneous WAT in obese subjects
What the sources say
- Not checked yetcites [26] Prasse A, Pechkovsky DV, Toews GB, Jungraithmayr W, Kollert F, Goldmann T, Vollmer E, Muller-Quernheim J, Zissel G: A vicious circle of alveolar macrophages and fibroblasts perpetuates pulmonary fibrosis via CCL18. Am J Respir Crit Care Med. 2006, 173: 781-792. 10.1164/rccm.200509-1518OC. source
boosteddirect- Asserted: passes — The authors put it forward as true.
- Checkable: passes — It can be checked against evidence.
- Load-bearing: fails — The paper’s conclusions may not depend on it.
- Based: passes — The paper gives a reason why it holds.
Probably not a substantial claim. The paper’s conclusions may not depend on it.
None of the sources cited for this claim have been checked yet.
In the paper
“Elevated inflammatory proteins in obese individuals [1] suggest that inflammation may play a determinant role in connecting obesity to metabolic, hepatic and cardiovascular diseases [2], and to some cancers [3].”
§ Adipose tissue transcriptomic signature highlights the pathological relevance of extracellular matrix in human obesity > Background
What the sources say
- Not checked yetcites [1] Ridker PM, Buring JE, Cook NR, Rifai N: C-reactive protein, the metabolic syndrome, and risk of incident cardiovascular events: an 8-year follow-up of 14 719 initially healthy American women. Circulation. 2003, 107: 391-397. 10.1161/01.CIR.0000055014.62083.05. source
- Not checked yetcites [2] Hotamisligil GS: Inflammation and metabolic disorders. Nature. 2006, 444: 860-867. 10.1038/nature05485. source
- Not checked yetcites [3] Hursting SD, Nunez NP, Varticovski L, Vinson C: The obesity-cancer link: lessons learned from a fatless mouse. Cancer Res. 2007, 67: 2391-2393. 10.1158/0008-5472.CAN-06-4237. source
hedgedconditional- Asserted: passes — The authors put it forward as true.
- Checkable: passes — It can be checked against evidence.
- Load-bearing: fails — The paper’s conclusions may not depend on it.
- Based: passes — The paper gives a reason why it holds.
Probably not a substantial claim. The paper’s conclusions may not depend on it. It may state two separate claims as one.
In the paper
“However, in spite of substantial evidence demonstrating the existence of a low-grade inflammatory component in obesity [5], the molecular mechanisms that link inflammatory changes to the development, aggravation, maintenance, and resistance to treatment that characterize obesity states remain poorly understood.”
§ Adipose tissue transcriptomic signature highlights the pathological relevance of extracellular matrix in human obesity > Background
What the sources say
- Not checked yetcites [5] Cottam DR, Mattar SG, Barinas-Mitchell E, Eid G, Kuller L, Kelley DE, Schauer PR: The chronic inflammatory hypothesis for the morbidity associated with morbid obesity: implications and effects of weight loss. Obes Surg. 2004, 14: 589-600. 10.1381/096089204323093345. source
plain- Asserted: passes — The authors put it forward as true.
- Checkable: passes — It can be checked against evidence.
- Load-bearing: passes — The paper’s conclusions depend on it.
- Based: passes — The paper gives a reason why it holds.
Probably not a substantial claim.
In the paper
“In obese human subjects, large-scale transcriptomic analyses of WAT, in stable weight conditions or during weight loss, led mostly to the description of inflammatory changes and produced extensive lists of regulated genes involved in a number of biological functions [14].”
§ Adipose tissue transcriptomic signature highlights the pathological relevance of extracellular matrix in human obesity > Background
What the sources say
- Not checked yetcites [14] Viguerie N, Poitou C, Cancello R, Stich V, Clement K, Langin D: Transcriptomics applied to obesity and caloric restriction. Biochimie. 2005, 87: 117-123. 10.1016/j.biochi.2004.12.011. source
plaindirect- Asserted: passes — The authors put it forward as true.
- Checkable: passes — It can be checked against evidence.
- Load-bearing: passes — The paper’s conclusions depend on it.
- Based: passes — The paper gives a reason why it holds.
Probably not a substantial claim. It may state two separate claims as one.
A conclusion the paper draws from its own results — it cites no other source for it, so there is none to check. The quote shows it is in the paper.
In the paper
“suggest that the phenotypic changes in human pre-adipocytes, induced by a pro-inflammatory environment, are associated with excessive synthesis of ECM components, which may contribute to tissue deterioration.”
§ Adipose tissue transcriptomic signature highlights the pathological relevance of extracellular matrix in human obesity > Background
hedgedcorrelational- Asserted: passes — The authors put it forward as true.
- Checkable: passes — It can be checked against evidence.
- Load-bearing: passes — The paper’s conclusions depend on it.
- Based: passes — The paper gives a reason why it holds.
It may state two separate claims as one.
None of the sources cited for this claim have been checked yet.
In the paper
“Although some molecules secreted by WAT, such as leptin and adiponectin, are synthesized by mature adipocytes [8], the non-adipose SVF, comprising infiltrated macrophages among other cellular types, is a source of inflammation-related molecules that may exert a local action on adipose tissue biology, particularly within the enlarged WAT [9-11].”
§ Adipose tissue transcriptomic signature highlights the pathological relevance of extracellular matrix in human obesity > Background
What the sources say
- Not checked yetcites [9] Xu H, Barnes GT, Yang Q, Tan G, Yang D, Chou CJ, Sole J, Nichols A, Ross JS, Tartaglia LA, Chen H: Chronic inflammation in fat plays a crucial role in the development of obesity-related insulin resistance. J Clin Invest. 2003, 112: 1821-1830. 10.1172/JCI200319451. source
- Not checked yetcites [10] Curat CA, Miranville A, Sengenes C, Diehl M, Tonus C, Busse R, Bouloumie A: From blood monocytes to adipose tissue-resident macrophages: induction of diapedesis by human mature adipocytes. Diabetes. 2004, 53: 1285-1292. 10.2337/diabetes.53.5.1285. source
- Not checked yetcites [11] Clement K, Viguerie N, Poitou C, Carette C, Pelloux V, Curat CA, Sicard A, Rome S, Benis A, Zucker JD, Vidal H, Laville M, Barsh GS, Basdevant A, Štich V, Stich V, Cancello R, Langin D: Weight loss regulates inflammation-related genes in white adipose tissue of obese subjects. FASEB J. 2004, 18: 1657-1669. 10.1096/fj.04-2204com. source
hedgedconditional- Asserted: passes — The authors put it forward as true.
- Checkable: passes — It can be checked against evidence.
- Load-bearing: fails — The paper’s conclusions may not depend on it.
- Based: passes — The paper gives a reason why it holds.
Probably not a substantial claim. The paper’s conclusions may not depend on it.
None of the sources cited for this claim have been checked yet.
In the paper
“White adipose tissue (WAT), now considered as a pivotal endocrine organ, contributes to the systemic inflammation by producing biomolecules, including pro-inflammatory mediators, whose estimated number grows constantly and whose synthesis is altered along with the expansion of the adipose tissue [6,7].”
§ Adipose tissue transcriptomic signature highlights the pathological relevance of extracellular matrix in human obesity > Background
What the sources say
- Not checked yetcites [6] Ailhaud G: Adipose tissue as an endocrine organ. Int J Obes Relat Metab Disord. 2000, 24 (Suppl 2): S1-3. source
- Not checked yetcites [7] Lyon CJ, Law RE, Hsueh WA: Minireview: adiposity, inflammation, and atherogenesis. Endocrinology. 2003, 144: 2195-2200. 10.1210/en.2003-0285. source
hedgeddirect- Asserted: passes — The authors put it forward as true.
- Checkable: passes — It can be checked against evidence.
- Load-bearing: fails — The paper’s conclusions may not depend on it.
- Based: passes — The paper gives a reason why it holds.
Probably not a substantial claim. The paper’s conclusions may not depend on it.
In the paper
“Recent data provided by our team showed that human pre-adipocytes in contact with activated macrophage media display a fibroblastic-like appearance, significantly proliferate and acquire pro-inflammatory properties [42].”
§ Adipose tissue transcriptomic signature highlights the pathological relevance of extracellular matrix in human obesity > Discussion > Cell types producing ECM components in adipose tissue: the role of pre-adipocytes
What the sources say
- Not checked yetcites [42] Lacasa D, Taleb S, Keophiphath M, Miranville A, Clement K: Macrophage-secreted factors impair human adipogenesis: involvement of pro-inflammatory state in pre-adipocytes. Endocrinology. 2007, 148: 868-877. 10.1210/en.2006-0687. source
plaindirect- Asserted: passes — The authors put it forward as true.
- Checkable: passes — It can be checked against evidence.
- Load-bearing: passes — The paper’s conclusions depend on it.
- Based: passes — The paper gives a reason why it holds.
It may state two separate claims as one.
A conclusion the paper draws from its own results — it cites no other source for it, so there is none to check. The quote shows it is in the paper.
In the paper
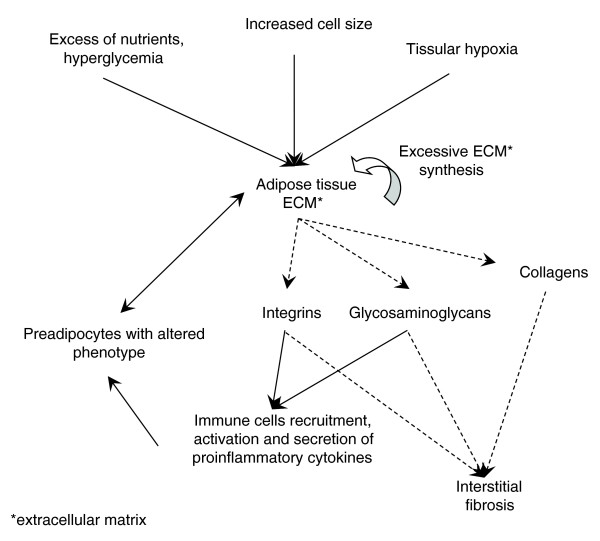
“Our study of functional profiles and transcriptomic interactions characterizing the adipose tissue of subjects in the obese static phase confirm the strong relationship linking inflammatory processes and ECM remodeling, associated with different inflammatory cell types and to some degree of interstitial fibrosis in WAT.”
§ Adipose tissue transcriptomic signature highlights the pathological relevance of extracellular matrix in human obesity > Conclusion
boostedcorrelational- Asserted: passes — The authors put it forward as true.
- Checkable: passes — It can be checked against evidence.
- Load-bearing: passes — The paper’s conclusions depend on it.
- Based: passes — The paper gives a reason why it holds.
It may state two separate claims as one.
In the paper
“A relationship between lymphocyte count and the weight of visceral and subcutaneous fat pads was also noted [48].”
§ Adipose tissue transcriptomic signature highlights the pathological relevance of extracellular matrix in human obesity > Discussion > Inflammatory cells in human adipose tissue
What the sources say
- Not checked yetcites [48] Caspar-Bauguil S, Cousin B, Andre M, Nibbelink M, Galinier A, Periquet B, Casteilla L, Penicaud L: Weight-dependent changes of immune system in adipose tissue: importance of leptin. Exp Cell Res. 2006, 312: 2195-2202. 10.1016/j.yexcr.2006.03.023. source
plaincorrelational- Asserted: passes — The authors put it forward as true.
- Checkable: passes — It can be checked against evidence.
- Load-bearing: fails — The paper’s conclusions may not depend on it.
- Based: passes — The paper gives a reason why it holds.
Probably not a substantial claim. The paper’s conclusions may not depend on it.
In the paper
“In obese mice, a shift in the activation state of WAT macrophages from an M2 'alternatively activated' state to an M1 'pro-inflammatory state' was observed in response to diet-induced obesity [47].”
§ Adipose tissue transcriptomic signature highlights the pathological relevance of extracellular matrix in human obesity > Discussion > Inflammatory cells in human adipose tissue
What the sources say
- Not checked yetcites [47] Lumeng CN, Bodzin JL, Saltiel AR: Obesity induces a phenotypic switch in adipose tissue macrophage polarization. J Clin Invest. 2007, 117: 175-184. 10.1172/JCI29881. source
plaindirect- Asserted: passes — The authors put it forward as true.
- Checkable: passes — It can be checked against evidence.
- Load-bearing: fails — The paper’s conclusions may not depend on it.
- Based: passes — The paper gives a reason why it holds.
Probably not a substantial claim. The paper’s conclusions may not depend on it.
In the paper
“To date, only a few comparative studies have described the lymphoid accumulation in WAT of obese subjects [49].”
§ Adipose tissue transcriptomic signature highlights the pathological relevance of extracellular matrix in human obesity > Discussion > Inflammatory cells in human adipose tissue
What the sources say
- Not checked yetcites [49] Marti A, Marcos A, Martinez JA: Obesity and immune function relationships. Obes Rev. 2001, 2: 131-140. 10.1046/j.1467-789x.2001.00025.x. source
plain- Asserted: passes — The authors put it forward as true.
- Checkable: passes — It can be checked against evidence.
- Load-bearing: fails — The paper’s conclusions may not depend on it.
- Based: passes — The paper gives a reason why it holds.
Probably not a substantial claim. The paper’s conclusions may not depend on it.
In the paper
“From a temporal perspective, human obesity can be considered as a set of phenotypes that develop successively over time. In this sequence one can distinguish: a 'pre-obese static phase' when the individual at risk of obesity has a stable weight and energy balance status; a 'dynamic weight gain phase' during which weight increases as a result of a positive energy balance with intakes exceeding”
§ Adipose tissue transcriptomic signature highlights the pathological relevance of extracellular matrix in human obesity > Conclusion
What the sources say
- Not checked yetcites [60] Obesity: Preventing and Managing the Global Epidemic. Report of a WHO Consultation. World Health Organ Tech Rep Ser. 2000, 894: i-xii. 1-253.
plain- Asserted: passes — The authors put it forward as true.
- Checkable: passes — It can be checked against evidence.
- Load-bearing: fails — The paper’s conclusions may not depend on it.
- Based: passes — The paper gives a reason why it holds.
Probably not a substantial claim. The paper’s conclusions may not depend on it.
In the paper
“In fibrotic diseases it has been shown that the accumulation of ECM components can be driven primarily by inflammatory processes [59].”
§ Adipose tissue transcriptomic signature highlights the pathological relevance of extracellular matrix in human obesity > Discussion > Cell types producing ECM components in adipose tissue: the role of pre-adipocytes
What the sources say
- Not checked yetcites [59] Iredale JP: Models of liver fibrosis: exploring the dynamic nature of inflammation and repair in a solid organ. J Clin Invest. 2007, 117: 539-548. 10.1172/JCI30542. source
plaindirect- Asserted: passes — The authors put it forward as true.
- Checkable: passes — It can be checked against evidence.
- Load-bearing: fails — The paper’s conclusions may not depend on it.
- Based: passes — The paper gives a reason why it holds.
Probably not a substantial claim. The paper’s conclusions may not depend on it.
In the paper
“The co-expression network analysis showed a concomitant up-regulation of genes related to both matrix metalloproteinase and tissue inhibitor of metalloproteinase families (online supplementary Table 2 [20]), which could explain the reduced degradation of ECM components after weight loss.”
§ Adipose tissue transcriptomic signature highlights the pathological relevance of extracellular matrix in human obesity > Discussion > Interstitial fibrosis in human adipose tissue
What the sources say
- Not checked yetcites [20] Companion Website to this Study. [http://corneliu.henegar.info/projects/FunNet/genome_biol_2008/index.htm]
hedgedconditional- Asserted: passes — The authors put it forward as true.
- Checkable: passes — It can be checked against evidence.
- Load-bearing: passes — The paper’s conclusions depend on it.
- Based: passes — The paper gives a reason why it holds.
It may state two separate claims as one.
A conclusion the paper draws from its own results — it cites no other source for it, so there is none to check. The quote shows it is in the paper.
In the paper
“This may be associated with the presence of M1 macrophages, since genes encoding pro-inflammatory factors were also induced.”
§ Adipose tissue transcriptomic signature highlights the pathological relevance of extracellular matrix in human obesity > Discussion > Inflammatory cells in human adipose tissue
hedgedcorrelational- Asserted: passes — The authors put it forward as true.
- Checkable: passes — It can be checked against evidence.
- Load-bearing: fails — The paper’s conclusions may not depend on it.
- Based: passes — The paper gives a reason why it holds.
Probably not a substantial claim. The paper’s conclusions may not depend on it. It may state two separate claims as one.
A conclusion the paper draws from its own results — it cites no other source for it, so there is none to check. The quote shows it is in the paper.
In the paper
“Examination of the functional interaction networks indicated that a similar phenomenon may occur in the obese WAT, involving the presence of inflammatory cells and a possible contribution by fibroblast derived pre-adipocytes in producing ECM components.”
§ Adipose tissue transcriptomic signature highlights the pathological relevance of extracellular matrix in human obesity > Results > Morphological characterization of the subcutaneous WAT in obese subjects
hedgedconditional- Asserted: passes — The authors put it forward as true.
- Checkable: passes — It can be checked against evidence.
- Load-bearing: passes — The paper’s conclusions depend on it.
- Based: passes — The paper gives a reason why it holds.
It may state two separate claims as one. The quote only partly states this claim.
- Rests on an assumption: In chronic low-grade inflammatory diseases, prolonged inflammation stimuli result in tissue injuries that can lead to excessive synthesis of ECM elements and their progressive deposition.
In the paper
“In the initial phase, behavioral and environmental factors could play a key role in the constitution of adipose tissue excess on a genetically predisposed background [61].”
§ Adipose tissue transcriptomic signature highlights the pathological relevance of extracellular matrix in human obesity > Conclusion
What the sources say
- Not checked yetcites [61] Mutch DM, Clement K: Unraveling the genetics of human obesity. PLoS Genet. 2006, 2: e188-10.1371/journal.pgen.0020188. source
hedgedconditional- Asserted: passes — The authors put it forward as true.
- Checkable: passes — It can be checked against evidence.
- Load-bearing: fails — The paper’s conclusions may not depend on it.
- Based: passes — The paper gives a reason why it holds.
Probably not a substantial claim. The paper’s conclusions may not depend on it.
A conclusion the paper draws from its own results — it cites no other source for it, so there is none to check. The quote shows it is in the paper.
In the paper
“Both our functional analysis and cellular studies indicate that such a pathological process might occur in obese WAT.”
§ Adipose tissue transcriptomic signature highlights the pathological relevance of extracellular matrix in human obesity > Discussion > Interstitial fibrosis in human adipose tissue
hedgedconditional- Asserted: passes — The authors put it forward as true.
- Checkable: passes — It can be checked against evidence.
- Load-bearing: passes — The paper’s conclusions depend on it.
- Based: passes — The paper gives a reason why it holds.
The quote only partly states this claim.
- Rests on an assumption: Persistence of tissue injuries can lead over time to an excessive production of ECM components, which accumulate progressively and may result eventually in impaired tissular function.
A conclusion the paper draws from its own results — it cites no other source for it, so there is none to check. The quote shows it is in the paper.
In the paper
“Our full-scale exploratory analysis of the obese WAT transcriptomic signature highlights the central place occupied by inflammatory and immune processes and shows the strong interaction with ECM components grouped in the same module (module 1).”
§ Adipose tissue transcriptomic signature highlights the pathological relevance of extracellular matrix in human obesity > Discussion > The transcriptomic signature of obese WAT illustrates the central role of ECM components in linking inflammatory and adipose metabolic anomalies
boostedcorrelational- Asserted: passes — The authors put it forward as true.
- Checkable: passes — It can be checked against evidence.
- Load-bearing: passes — The paper’s conclusions depend on it.
- Based: passes — The paper gives a reason why it holds.
It may state two separate claims as one.
A conclusion the paper draws from its own results — it cites no other source for it, so there is none to check. The quote shows it is in the paper.
In the paper
“However, these results do not exclude the role of mature adipocytes in the excessive synthesis of some ECM components.”
§ Adipose tissue transcriptomic signature highlights the pathological relevance of extracellular matrix in human obesity > Discussion > Cell types producing ECM components in adipose tissue: the role of pre-adipocytes
hedgedconditional- Asserted: passes — The authors put it forward as true.
- Checkable: passes — It can be checked against evidence.
- Load-bearing: fails — The paper’s conclusions may not depend on it.
- Based: passes — The paper gives a reason why it holds.
Probably not a substantial claim. The paper’s conclusions may not depend on it.
A conclusion the paper draws from its own results — it cites no other source for it, so there is none to check. The quote shows it is in the paper.
In the paper
“Fibrosis may be more than a passive witness of the pathologic state of the tissue, possibly indicating a degree of irreversibility in the evolution of obesity, as seems to be suggested by its persistence after a drastic decrease of the adipose mass, in spite of the regression of the local inflammatory phenomena.”
§ Adipose tissue transcriptomic signature highlights the pathological relevance of extracellular matrix in human obesity > Conclusion
hedgedconditional- Asserted: passes — The authors put it forward as true.
- Checkable: passes — It can be checked against evidence.
- Load-bearing: passes — The paper’s conclusions depend on it.
- Based: passes — The paper gives a reason why it holds.
It may state two separate claims as one.
- Rests on an assumption: Once the obese phase is attained, the new weight status appears to be strongly defended by both biological and psychological regulatory mechanisms.
In the paper
“Major histopathological features were recorded and semi-quantified according to previously published criteria [80].”
§ Adipose tissue transcriptomic signature highlights the pathological relevance of extracellular matrix in human obesity > Materials and methods > Liver histopathology
What the sources say
- Not checked yetcites [80] Kleiner DE, Brunt EM, Van Natta M, Behling C, Contos MJ, Cummings OW, Ferrell LD, Liu YC, Torbenson MS, Unalp-Arida A, Yeh M, McCullough AJ, Sanyal AJ, Nonalcoholic Steatohepatitis Clinical Research Network: Design and validation of a histological scoring system for nonalcoholic fatty liver disease. Hepatology. 2005, 41: 1313-1321. 10.1002/hep.20701. source
plain- Asserted: passes — The authors put it forward as true.
- Checkable: passes — It can be checked against evidence.
- Load-bearing: fails — The paper’s conclusions may not depend on it.
- Based: passes — The paper gives a reason why it holds.
Probably not a substantial claim. The paper’s conclusions may not depend on it.
In the paper
“We validated the gene expression changes by reverse transcription and RTqPCR, performed as described in [63].”
§ Adipose tissue transcriptomic signature highlights the pathological relevance of extracellular matrix in human obesity > Materials and methods > Real time quantitative PCR
What the sources say
- Not checked yetcites [63] Clement K, Viguerie N, Diehn M, Alizadeh A, Barbe P, Thalamas C, Storey JD, Brown PO, Barsh GS, Langin D: In vivo regulation of human skeletal muscle gene expression by thyroid hormone. Genome Res. 2002, 12: 281-291. 10.1101/gr.207702. source
plain- Asserted: passes — The authors put it forward as true.
- Checkable: passes — It can be checked against evidence.
- Load-bearing: passes — The paper’s conclusions depend on it.
- Based: passes — The paper gives a reason why it holds.
Probably not a substantial claim.
What the paper did — it cites no source for this, so there is none to check. The quote shows it is in the paper.
In the paper
“Slides were coded and analyzed by a single expert pathologist blind to the identity of the biopsy.”
§ Adipose tissue transcriptomic signature highlights the pathological relevance of extracellular matrix in human obesity > Materials and methods > Liver histopathology
plain- Asserted: passes — The authors put it forward as true.
- Checkable: passes — It can be checked against evidence.
- Load-bearing: fails — The paper’s conclusions may not depend on it.
- Based: passes — The paper gives a reason why it holds.
Probably not a substantial claim. The paper’s conclusions may not depend on it. It may state two separate claims as one.
What the paper did — it cites no source for this, so there is none to check. The quote shows it is in the paper.
In the paper
“Thin sections (5 μm thick) were haematoxylin-eosin stained and analyzed by three independent observers in a blind fashion with a Zeiss 20 Axiostar Plus microscope (Zeiss, Germany).”
§ Adipose tissue transcriptomic signature highlights the pathological relevance of extracellular matrix in human obesity > Materials and methods > Morphometry
plain- Asserted: passes — The authors put it forward as true.
- Checkable: passes — It can be checked against evidence.
- Load-bearing: fails — The paper’s conclusions may not depend on it.
- Based: passes — The paper gives a reason why it holds.
Probably not a substantial claim. The paper’s conclusions may not depend on it.
What the paper did — it cites no source for this, so there is none to check. The quote shows it is in the paper.
In the paper
“Several quality cross-checks (for total RNA quality, aRNA quality, dye incorporation efficiency, and so on) and microarray 'dye swap' experiments were also performed.”
§ Adipose tissue transcriptomic signature highlights the pathological relevance of extracellular matrix in human obesity > Materials and methods > Microarray experiments
plain- Asserted: passes — The authors put it forward as true.
- Checkable: passes — It can be checked against evidence.
- Load-bearing: fails — The paper’s conclusions may not depend on it.
- Based: passes — The paper gives a reason why it holds.
Probably not a substantial claim. The paper’s conclusions may not depend on it. It may state two separate claims as one.
In the paper
“EntrezGene numbers [72] were used as a standard transcript accession system to ensure a correct over-representation analysis, as they allow one to map gene identifiers to GO or KEGG biological categories.”
§ Adipose tissue transcriptomic signature highlights the pathological relevance of extracellular matrix in human obesity > Materials and methods > Analysis of the biological interactions characterizing the transcriptomic signature of obese WAT
What the sources say
- Not checked yetcites [72] Maglott D, Ostell J, Pruitt KD, Tatusova T: Entrez Gene: gene-centered information at NCBI. Nucleic Acids Res. 2007, 35: D26-31. 10.1093/nar/gkl993. source
plaindirect- Asserted: passes — The authors put it forward as true.
- Checkable: passes — It can be checked against evidence.
- Load-bearing: fails — The paper’s conclusions may not depend on it.
- Based: passes — The paper gives a reason why it holds.
Probably not a substantial claim. The paper’s conclusions may not depend on it.
What the paper did — it cites no source for this, so there is none to check. The quote shows it is in the paper.
In the paper
“There was no significant difference in terms of age between obese subjects and lean controls.”
§ Adipose tissue transcriptomic signature highlights the pathological relevance of extracellular matrix in human obesity > Materials and methods > Subjects and study design
plain- Asserted: passes — The authors put it forward as true.
- Checkable: passes — It can be checked against evidence.
- Load-bearing: fails — The paper’s conclusions may not depend on it.
- Based: passes — The paper gives a reason why it holds.
Probably not a substantial claim. The paper’s conclusions may not depend on it.
What the paper did — it cites no source for this, so there is none to check. The quote shows it is in the paper.
In the paper
“All clinical investigations were performed according to the Declaration of Helsinki and were approved by the Ethics Committees of Hôtel-Dieu hospital (Paris, France).”
§ Adipose tissue transcriptomic signature highlights the pathological relevance of extracellular matrix in human obesity > Materials and methods > Subjects and study design
plain- Asserted: passes — The authors put it forward as true.
- Checkable: passes — It can be checked against evidence.
- Load-bearing: fails — The paper’s conclusions may not depend on it.
- Based: passes — The paper gives a reason why it holds.
Probably not a substantial claim. The paper’s conclusions may not depend on it. It may state two separate claims as one.
A conclusion the paper draws from its own results — it cites no other source for it, so there is none to check. The quote shows it is in the paper.
In the paper
“Regardless of the actual mechanism explaining its persistence, the increase of interstitial fibrosis in the adipose tissue could impair cell-cell contact and, therefore, interfere with cellular signaling mechanisms that regulate adipogenesis and metabolic functions of WAT.”
§ Adipose tissue transcriptomic signature highlights the pathological relevance of extracellular matrix in human obesity > Conclusion
hedgedconditional- Asserted: passes — The authors put it forward as true.
- Checkable: passes — It can be checked against evidence.
- Load-bearing: passes — The paper’s conclusions depend on it.
- Based: fails — The paper may give no reason why it holds.
Probably not a substantial claim. The paper may give no reason why it holds. It may state two separate claims as one.
In the paper
“The resulting p values were adjusted for multiple testing errors by applying the Storey (2002) FDR correction approach [68].”
§ Adipose tissue transcriptomic signature highlights the pathological relevance of extracellular matrix in human obesity > Materials and methods > Analysis of the biological interactions characterizing the transcriptomic signature of obese WAT
What the sources say
- Not checked yetcites [68] Storey JD, Tibshirani R: Statistical significance for genomewide studies. Proc Natl Acad Sci USA. 2003, 100: 9440-9445. 10.1073/pnas.1530509100. source
plain- Asserted: passes — The authors put it forward as true.
- Checkable: passes — It can be checked against evidence.
- Load-bearing: passes — The paper’s conclusions depend on it.
- Based: passes — The paper gives a reason why it holds.
Probably not a substantial claim.
In the paper
“A print-tip loess normalization of the microarray experiments was performed after the log-transformation of the background-corrected expression measurements, as indicated in [67].”
§ Adipose tissue transcriptomic signature highlights the pathological relevance of extracellular matrix in human obesity > Materials and methods > Statistical analyses
What the sources say
- Not checked yetcites [67] Smyth GK, Speed T: Normalization of cDNA microarray data. Methods. 2003, 31: 265-273. 10.1016/S1046-2023(03)00155-5. source
plain- Asserted: passes — The authors put it forward as true.
- Checkable: passes — It can be checked against evidence.
- Load-bearing: fails — The paper’s conclusions may not depend on it.
- Based: passes — The paper gives a reason why it holds.
Probably not a substantial claim. The paper’s conclusions may not depend on it.
In the paper
“This threshold parameter, which represents a co-expression significance indicator, was determined by maximizing a scale-free topology criterion as previously described [78].”
§ Adipose tissue transcriptomic signature highlights the pathological relevance of extracellular matrix in human obesity > Materials and methods > Analysis of the biological interactions characterizing the transcriptomic signature of obese WAT
What the sources say
- Not checked yetcites [78] Zhang B, Horvath S: A general framework for weighted gene co-expression network analysis. Stat Appl Genet Mol Biol. 2005, 4: Article 17-Epub 2005 source
plain- Asserted: passes — The authors put it forward as true.
- Checkable: passes — It can be checked against evidence.
- Load-bearing: fails — The paper’s conclusions may not depend on it.
- Based: passes — The paper gives a reason why it holds.
Probably not a substantial claim. The paper’s conclusions may not depend on it.
In the paper
“Significant differential expression was established by imposing a 5% FDR threshold in the SAM selection procedure for all conditions.”
§ Adipose tissue transcriptomic signature highlights the pathological relevance of extracellular matrix in human obesity > Materials and methods > Statistical analyses
What the sources say
- Not checked yetcites [21] Tusher VG, Tibshirani R, Chu G: Significance analysis of microarrays applied to the ionizing radiation response. Proc Natl Acad Sci USA. 2001, 98: 5116-5121. 10.1073/pnas.091062498. source
plain- Asserted: passes — The authors put it forward as true.
- Checkable: passes — It can be checked against evidence.
- Load-bearing: passes — The paper’s conclusions depend on it.
- Based: passes — The paper gives a reason why it holds.
Probably not a substantial claim.
What the paper did — it cites no source for this, so there is none to check. The quote shows it is in the paper.
In the paper
“After washing in phosphate-buffered saline (PBS), the SVF cells were suspended in DMEM-10% fetal bovine serum and used for cell culture at passage 2 to eliminate non-pre-adipocyte cell contamination as confirmed by negative staining for macrophage markers (Ham 56 and Mac-1).”
§ Adipose tissue transcriptomic signature highlights the pathological relevance of extracellular matrix in human obesity > Materials and methods > Cell culture
plaindirect- Asserted: passes — The authors put it forward as true.
- Checkable: passes — It can be checked against evidence.
- Load-bearing: fails — The paper’s conclusions may not depend on it.
- Based: passes — The paper gives a reason why it holds.
Probably not a substantial claim. The paper’s conclusions may not depend on it. It may state two separate claims as one.
What the paper did — it cites no source for this, so there is none to check. The quote shows it is in the paper.
In the paper
“In all analyses the threshold for statistical significance was considered as corresponding to a p value < 0.05.”
§ Adipose tissue transcriptomic signature highlights the pathological relevance of extracellular matrix in human obesity > Materials and methods > Statistical analyses
plain- Asserted: passes — The authors put it forward as true.
- Checkable: passes — It can be checked against evidence.
- Load-bearing: fails — The paper’s conclusions may not depend on it.
- Based: passes — The paper gives a reason why it holds.
Probably not a substantial claim. The paper’s conclusions may not depend on it.
What the paper did — it cites no source for this, so there is none to check. The quote shows it is in the paper.
In the paper
“We used 18S ribosomal RNA (Ribosomal RNA Control TaqMan Assay kit, Applied Biosystems, Foster City, CA, USA) as a normalization control.”
§ Adipose tissue transcriptomic signature highlights the pathological relevance of extracellular matrix in human obesity > Materials and methods > Real time quantitative PCR
plain- Asserted: passes — The authors put it forward as true.
- Checkable: passes — It can be checked against evidence.
- Load-bearing: fails — The paper’s conclusions may not depend on it.
- Based: passes — The paper gives a reason why it holds.
Probably not a substantial claim. The paper’s conclusions may not depend on it.
In the paper
“In all conditions in which multiple testing errors were expected, due to the high number of consecutive statistical computations, the p values computed from the aforementioned tests were adjusted by applying the Storey (2002) correction approach [68], corresponding to an estimated FDR of 5%.”
§ Adipose tissue transcriptomic signature highlights the pathological relevance of extracellular matrix in human obesity > Materials and methods > Statistical analyses
What the sources say
- Not checked yetcites [68] Storey JD, Tibshirani R: Statistical significance for genomewide studies. Proc Natl Acad Sci USA. 2003, 100: 9440-9445. 10.1073/pnas.1530509100. source
hedged- Asserted: passes — The authors put it forward as true.
- Checkable: passes — It can be checked against evidence.
- Load-bearing: passes — The paper’s conclusions depend on it.
- Based: passes — The paper gives a reason why it holds.
Probably not a substantial claim.
What the paper did — it cites no source for this, so there is none to check. The quote shows it is in the paper.
In the paper
“Signed informed consents were obtained for all subjects involved in the study.”
§ Adipose tissue transcriptomic signature highlights the pathological relevance of extracellular matrix in human obesity > Materials and methods > Subjects and study design
plain- Asserted: passes — The authors put it forward as true.
- Checkable: passes — It can be checked against evidence.
- Load-bearing: fails — The paper’s conclusions may not depend on it.
- Based: passes — The paper gives a reason why it holds.
Probably not a substantial claim. The paper’s conclusions may not depend on it.
In the paper
“It cannot be excluded that this enzymatic digestion technique may have a potential influence on the expression profiles of separated cells, as noted previously in mouse studies [65].”
§ Adipose tissue transcriptomic signature highlights the pathological relevance of extracellular matrix in human obesity > Materials and methods > Microarray experiments
What the sources say
- Not checked yetcites [65] Ruan H, Zarnowski MJ, Cushman SW, Lodish HF: Standard isolation of primary adipose cells from mouse epididymal fat pads induces inflammatory mediators and down-regulates adipocyte genes. J Biol Chem. 2003, 278: 47585-47593. 10.1074/jbc.M305257200. source
hedgedconditional- Asserted: passes — The authors put it forward as true.
- Checkable: passes — It can be checked against evidence.
- Load-bearing: fails — The paper’s conclusions may not depend on it.
- Based: passes — The paper gives a reason why it holds.
Probably not a substantial claim. The paper’s conclusions may not depend on it.
What the paper did — it cites no source for this, so there is none to check. The quote shows it is in the paper.
In the paper
“After expert inspection of automated annotation results, the fourth information-specific level of GO was retained for further analysis, as it provided an optimal trade-off between the specificity of the annotating information and its biological interpretability.”
§ Adipose tissue transcriptomic signature highlights the pathological relevance of extracellular matrix in human obesity > Materials and methods > Analysis of the biological interactions characterizing the transcriptomic signature of obese WAT
plain- Asserted: passes — The authors put it forward as true.
- Checkable: passes — It can be checked against evidence.
- Load-bearing: fails — The paper’s conclusions may not depend on it.
- Based: passes — The paper gives a reason why it holds.
Probably not a substantial claim. The paper’s conclusions may not depend on it.
The paper relies on this without support.
In chronic low-grade inflammatory diseases, prolonged inflammation stimuli result in tissue injuries that can lead to excessive synthesis of ECM elements and their progressive deposition.
“In chronic low-grade inflammatory diseases, prolonged inflammation stimuli result in tissue injuries that can lead to excessive synthesis of ECM elements and their progressive deposition.”
The paper relies on this without support.
ECM modulations are transmitted to integrin complexes that regulate cytoskeleton dynamics and intracellular pathways.
“It is well known that ECM modulations are transmitted to integrin complexes that regulate cytoskeleton dynamics and intracellular pathways.”
The paper relies on this without support.
Persistence of tissue injuries can lead over time to an excessive production of ECM components, which accumulate progressively and may result eventually in impaired tissular function.
“The persistence of tissue injuries can lead over time to an excessive production of ECM components, which accumulate progressively and may result eventually in impaired tissular function.”
The paper relies on this without support.
Once the obese phase is attained, the new weight status appears to be strongly defended by both biological and psychological regulatory mechanisms.
“Once the obese phase is attained, the new weight status appears to be strongly defended by both biological and psychological regulatory mechanisms.”
Claims other papers make about this one
Each is checked against this paper’s own text: does it say what the citing paper says it does?
In the citing paper
“Smokers given 515 mg vitamin C/d for 2 months had a 24 % reduction in plasma CRP concentrations (786) .”
From Dietary factors and low-grade inflammation in relation to overweight and obesity (2011) · cites this paper as [786]
Self-check
Percentages, sums and reported differences re-computed from the paper’s own numbers.
Each contradiction between two passages listed here was confirmed by an independent check.
Rated minor: it would not touch a result — a value no result rests on, a p-value that stays on the same side of the significance level, or a conflict that is clerical, resolved elsewhere in the paper, or outside its own findings.
In the paper
“| HDL < 1.03 mmol/l (M), < 1.29 mmol/l (F) | 26 (47%)* | 1 (6%) |”
§ Adipose tissue transcriptomic signature highlights the pathological relevance of extracellular matrix in human obesity > Results > The transcriptomic signature of the subcutaneous WAT in obese subjects
Reported 6 · recomputed 6.666667
Rated minor: it would not touch a result — a value no result rests on, a p-value that stays on the same side of the significance level, or a conflict that is clerical, resolved elsewhere in the paper, or outside its own findings.
In the paper
§ Adipose tissue transcriptomic signature highlights the pathological relevance of extracellular matrix in human obesity > Results > Morphological characterization of the subcutaneous WAT in obese subjects
“CD3 positive cells between adipocytes (f) and in vessel walls (b)”
§ Adipose tissue transcriptomic signature highlights the pathological relevance of extracellular matrix in human obesity > Results > Morphological characterization of the subcutaneous WAT in obese subjects
“(e-g) Electron microscopy of adipose tissue shows macrophages ('m') with cytoplasmic expansions (arrows) in stromal areas between adipocytes ('a') and sometimes close to lymphocytes ('L').”
Citations
Cites
Cytoscape: A software Environment for integrated models of biomolecular interaction networks
Shannon, P., Markiel, A., Ozier, O., Baliga, N. S., Wang, J. T., Ramage, D., Amin, N., Schwikowski, B., & Ideker, T. (2003) · Genome Research · doi:10.1101/gr.1239303 · Cited by 51,888
Gene Ontology: tool for the unification of biology
Ashburner, M., Ball, C. A., Blake, J. A., Botstein, D., Butler, H., Cherry, J. M., Davis, A. P., Dolinski, K., Dwight, S. S., Eppig, J. T., et al. (2000) · Nature Genetics · doi:10.1038/75556 · Cited by 43,206
Collective dynamics of ‘small-world’ networks
Watts, D. J., & Strogatz, S. H. (1998) · Nature · doi:10.1038/30918 · Cited by 43,060
KEGG: Kyoto Encyclopedia of Genes and Genomes
Kanehisa, M. (2000) · Nucleic Acids Research · doi:10.1093/nar/28.1.27 · Cited by 37,077
KEGG: Kyoto Encyclopedia of Genes and Genomes
Ogata, H., Goto, S., Sato, K., Fujibuchi, W., Bono, H., & Kanehisa, M. (1999) · Nucleic Acids Research · doi:10.1093/nar/27.1.29 · Cited by 31,232
Advances in neural information processing systems 7
Cios, K. J., & Shields, M. E. (1997) · Neurocomputing · doi:10.1016/s0925-2312(97)90018-7 · Cited by 22,093
Hsu, S. M., Raine, L., & Fanger, H. (1981) · Journal of Histochemistry & Cytochemistry · doi:10.1177/29.4.6166661 · Cited by 14,075
(2000) · PubMed · Cited by 13,173
Obesity : Preventing and managing the global epidemic
Akram, D. S., Astrup, A. V., Atinmo, T., Boissin, J.-L., Bray, G. A., Carroll, K. N., Chitson, P., Chen, C., Dietz, W. H., Hill, J. O., et al. (2000) · Research at the University of Copenhagen (University of Copenhagen) · Cited by 12,945
Design and validation of a histological scoring system for nonalcoholic fatty liver disease†
Kleiner, D. E., Brunt, E. M., Van Natta, M., Behling, C., Contos, M. J., Cummings, O. W., Ferrell, L. D., Liu, Y., Torbenson, M. S., Unalp‐Arida, A., et al. (2005) · Hepatology · doi:10.1002/hep.20701 · Cited by 10,791
Research works printed but not linked: 1
- Gene Expression Omnibus. [http://www.ncbi.nlm.nih.gov/geo/]
Cited by
Sorted by citations
Items 301–400 of 468
Johansen, M. L., Ibarrola, J., Fernández‐Celis, A., Schou, M., Sonne, M. P., Holm, M. R., Rasmussen, J., Dela, F., Jaisser, F., Faber, J. O., et al. (2020) · Diabetes · doi:10.2337/db20-0394 · Cited by 11
Molecular Mechanisms of Increased Heart Rate in Shenxianshengmai-treated Bradycardia Rabbits.
Liu, Z.-Y., Huang, J. F., Liu, N., Zheng, M., Zhao, T., Zhao, B., Wang, Y., & Pu, J. (2017) · Europe PMC (PubMed Central) · doi:10.4103/0366-6999.197999 · Cited by 9
Comprehensive Matrisome Profiling of Human Adipose Tissue for Soft Tissue Reconstruction
Major, G. S., Simcock, J., Kumar, A., Kleffmann, T., Woodfield, T. B. F., & Lim, K. S. (2023) · Advanced Biology · doi:10.1002/adbi.202300448 · Cited by 12
Adipose Tissue Inflammation and Insulin Resistance
Francisco, L., Miriam, H., de Oliveira, A. C., & Alonso‐Vale, M. I. C. (2012) · InTech eBooks · doi:10.5772/53974 · Cited by 9
Kępczyńska, M. A., Zaibi, M. S., Alomar, S. Y., & Trayhurn, P. (2016) · Archives of Physiology and Biochemistry · doi:10.1080/13813455.2016.1248979 · Cited by 9
Subcutaneous adipose tissue and skeletal muscle mitochondria following weight loss
van der Kolk, B. W., Pirinen, E., Nicoll, R., Pietiläinen, K. H., & Heinonen, S. (2024) · Trends in Endocrinology and Metabolism · doi:10.1016/j.tem.2024.08.002 · Cited by 8
Matrix density regulates adipocyte phenotype
Ky, A., McCoy, A. J., Flesher, C. G., Friend, N. E., Li, J., Akinleye, K., Patsalis, C., Lumeng, C. N.-K., Putnam, A. J., & O’Rourke, R. W. (2023) · Adipocyte · doi:10.1080/21623945.2023.2268261 · Cited by 8
Gene Expression Profile of Increased Heart Rate in Shensongyangxin‐Treated Bradycardia Rabbits
Liu, Z., Huang, J. F., Hu, R., Huo, Y., Gong, J., Zhang, Y., Wei, C., & Pu, J. (2014) · Evidence-based Complementary and Alternative Medicine · doi:10.1155/2014/715937 · Cited by 8
Lee, S., Choi, N.-H., Koh, I.-U., Kim, B.-J., Lee, S., Kim, S. C., & Choi, S. S. (2020) · Journal of Translational Medicine · doi:10.1186/s12967-020-02611-6 · Cited by 8
Bouazizi, K., Zarai, M., Marquet, F., Aron‐Wisnewsky, J., Clément, K., Redheuil, A. B., & Kachenoura, N. (2021) · Quantitative Imaging in Medicine and Surgery · doi:10.21037/qims-20-879 · Cited by 6
Biglycan Deletion Alters Adiponectin Expression in Murine Adipose Tissue and 3T3-L1 Adipocytes
Ward, M., & Ajuwon, K. M. (2012) · PLoS ONE · doi:10.1371/journal.pone.0050554 · Cited by 8
Azeez, O. I., Myburgh, J. G., Bosman, A.-M., Featherston, J., Sibeko-Matjila, K. P., Oosthuizen, M. C., & Chamunorwa, J. P. (2019) · PLoS ONE · doi:10.1371/journal.pone.0225073 · Cited by 8
A national collection of liver tumours: Lessons learnt from 6 years of biobanking in France
Clément, B., Chêne, G., & Degos, F. (2009) · Cancer Letters · doi:10.1016/j.canlet.2009.04.034 · Cited by 8
How does bariatric surgery remodel adipose tissue?
Lecoutre, S., Rebière, C., Marcelin, G., & Clément, K. (2024) · Annales d Endocrinologie · doi:10.1016/j.ando.2024.05.008 · Cited by 8
Osorio-Conles, Ó., Olbeyra, R. P., Vidal, J., Ibarzábal, A., Balibrea, J. M., & de Hollanda, A. (2023) · Cells · doi:10.3390/cells12091262 · Cited by 9
Azeez, O. I., Myburgh, J. G., Meintjes, R. A., Oosthuizen, M. C., & Chamunorwa, J. P. (2017) · Lipids in Health and Disease · doi:10.1186/s12944-016-0405-2 · Cited by 7
Zoico, E., Policastro, G., Rizzatti, V., Nori, N., Darra, E., Rossi, A. P., Fantin, F., & Zamboni, M. M. (2020) · Mechanisms of Ageing and Development · doi:10.1016/j.mad.2020.111374 · Cited by 8
Unamuno, X., Frühbeck, G., & Catalán, V. (2018) · Elsevier eBooks · doi:10.1016/b978-0-12-801238-3.65163-2 · Cited by 7
Tran, V., Brettle, H., Diep, H., Galvão, H. B. F., Fanson, K. V., Sobey, C. G., Drummond, G. R., Vinh, A., & Jelinic, M. (2025) · The FASEB Journal · doi:10.1096/fj.202401871r · Cited by 6
Obesity Is Associated with Distorted Proteoglycan Expression in Adipose Tissue
Meen, A. J., Doncheva, A. I., Böttcher, Y., Dankel, S. N., Hoffmann, A., Blüher, M., Fernø, J., Mellgren, G., Ghosh, A., Sun, W., et al. (2023) · International Journal of Molecular Sciences · doi:10.3390/ijms24086884 · Cited by 6
Subramanian, N., Hofwimmer, K., Tavira, B., Massier, L., Andersson, D. P., Arner, P., & Laurencikiene, J. (2023) · Cardiovascular Diabetology · doi:10.1186/s12933-023-01803-w · Cited by 6
Bariatric Surgery in Obesity: Metabolic Quality Analysis and Comparison of Surgical Options
Engin, A. (2024) · Advances in experimental medicine and biology · doi:10.1007/978-3-031-63657-8_24 · Cited by 7
Ng, H. F., Chin, K. F., Chan, K., & Ngeow, Y. F. (2015) · Genome · doi:10.1139/gen-2015-0028 · Cited by 6
Yang, Z., Zhao, X., Xiong, X., Bao, L., Pan, K., Zhou, S., LuHua, W., Xu, L., & Qu, M. (2019) · Animal Production Science · doi:10.1071/an18205 · Cited by 6
Florijn, B. W., Duijs, J. M. G. J., Klaver, M., Kuipers, E. N., Kooijman, S., Prins, J., Zhang, H., Sips, H. C. M., Stam, W., Hanegraaf, M. A. J., et al. (2021) · European Journal of Endocrinology · doi:10.1530/eje-21-0267 · Cited by 7
Inflammation du tissu adipeux au cours de l’obésité
Poitou, C., Dalmas, É., & Clément, K. (2013) · Springer eBooks · doi:10.1007/978-2-8178-0332-6_20 · Cited by 6
Self-citationNuclear hormone-sensitive lipase regulates adipose tissue mass and adipocyte metabolism
Dufau, J., Recazens, E., Bottin, L., Bergoglio, C., Mairal, A., Chaoui, K., Marqués, M.-A., Jiménez, V., García, M., Wang, T., et al. (2025) · Cell Metabolism · doi:10.1016/j.cmet.2025.09.014 · Cited by 5
Self-citationHu, S., Kang, H., Bae, M., Kim, M., Jang, H., Corvino, O., Pham, T. X., Lee, Y., Smyth, J. A., Park, Y., et al. (2024) · Journal of Gastroenterology and Hepatology · doi:10.1111/jgh.16856 · Cited by 6
Comprehensive Analyses of Tissue-Specific Networks with Implications to Psychiatric Diseases
Lin, G. N., Corominas, R., Nam, H.-J., Urresti, J., & Iakoucheva, L. M. (2017) · Methods in molecular biology · doi:10.1007/978-1-4939-7027-8_15 · Cited by 5
Bjørklund, G., Tippairote, T., Dadar, M., Lizcano, F., Aaseth, J., & Borisova, O. (2020) · Current Medicinal Chemistry · doi:10.2174/0929867327666200505090449 · Cited by 5
Adipose Structure (White, Brown, Beige)
Peirce, V. J., Pellegrinelli, V., & Vidal‐Puig, A. (2016) · Springer eBooks · doi:10.1007/978-3-319-11251-0_23 · Cited by 6
Dalmas, É., Tordjman, J., Guerre-Millo, M., & Clément, K. (2011) · Springer eBooks · doi:10.1007/978-1-4614-0965-6_6 · Cited by 5
Self-citationChen, X., Gong, L., Li, Q., Hu, J., Liu, X., Wang, Y., Bai, J., Ran, X., Wu, J., Ge, Q., et al. (2018) · Life Sciences · doi:10.1016/j.lfs.2018.12.051 · Cited by 5
Dalmas, É., Tordjman, J., Guerre-Millo, M., & Clément, K. (2017) · Springer eBooks · doi:10.1007/978-3-319-52031-5_7 · Cited by 5
Self-citationMicroRNA Profile of Mouse Adipocyte-Derived Extracellular Vesicles
Rőszer, T. (2024) · Cells · doi:10.3390/cells13151298 · Cited by 4
Xiong, G., He, D., Napier, D. L., Chen, J., Shi, H., Li, C., Hurley, P. J., Wang, C., Zhu, H., Zhou, C., et al. (2025) · Breast Cancer Research · doi:10.1186/s13058-025-02076-9 · Cited by 4
Gastrointestinal weight-loss surgery: glimpses at the molecular level
Freudenberg, J., Rajpal, N., Way, J. M., Magid-Slav, M., & Rajpal, D. K. (2012) · Drug Discovery Today · doi:10.1016/j.drudis.2012.12.006 · Cited by 4
Jacquemier, P., Rétory, Y., Virbel-Fleischman, C., Schmidt, A., Ostertag, A., Cohen-Solal, M. E., Alzaïd, F., Potier, L., Julla, J., Gautier, J., et al. (2023) · Scientific Reports · doi:10.1038/s41598-023-46993-1 · Cited by 4
Wang, Z., Özçam, M., & Abasht, B. (2022) · PLoS ONE · doi:10.1371/journal.pone.0269534 · Cited by 5
Lee, K., & Kuo, C. K. (2013) · Studies in mechanobiology, tissue engineering and biomaterials · doi:10.1007/8415_2013_172 · Cited by 4
Morine, M. J., O’Brien, C. P., & Roche, H. M. (2008) · Proceedings of The Nutrition Society · doi:10.1017/s0029665108008756 · Cited by 4
Carrascoza, V. S. R., Garcia, R. F., Gargaro, L. L., Pedrosa, M. M. D., Brito, N. D. A., Salgueiro‐Pagadigorria, C. L., & Brito, M. D. N. (2019) · Journal of Pharmacy and Pharmacology · doi:10.17265/2328-2150/2019.03.002 · Cited by 3
Hosseini, S. F., Bakhtiarizadeh, M. R., & Salehi, A. (2022) · Research Square · doi:10.21203/rs.3.rs-1770948/v1 · Cited by 4
Kreis, N., Friemel, A., Ritter, A., Hentrich, A. E., Siebelitz, E., Louwen, F., & Yuan, J. (2025) · Communications Biology · doi:10.1038/s42003-025-08986-w · Cited by 5
Differential Methylation Of Inflammatory And Insulinotropic Genes After Metabolic Surgery In Women
Vohl, M., Guénard, F., Tchernof, A., Deshaies, Y., Cianflone, K., Kral, J. G., & Marceau, P. (2015) · Journal of Clinical Epigenetics · Cited by 3
Garcia, M. A. C., Menéndez, R., Baley-Spindel, M., Cadena, A., Carrillo, C., & García-Jiménez, J. (2024) · Aesthetic Plastic Surgery · doi:10.1007/s00266-024-04376-5 · Cited by 3
Histologie du tissu adipeux blanc normal et pathologique
Tordjman, J. (2013) · Obésité · doi:10.1007/s11690-013-0404-7 · Cited by 5
Self-citationFunction of Collagens in Energy Metabolism and Metabolic Diseases
Huang, G. (2014) · Journal of Cell Science & Therapy · doi:10.4172/2157-7013.1000173 · Cited by 3
Does Bariatric Surgery Improve Obesity Associated Comorbid Conditions
Engin, A. (2017) · Advances in experimental medicine and biology · doi:10.1007/978-3-319-48382-5_24 · Cited by 3
Sajid, S., Zariwala, M. G., Mackenzie, R., Turner, M. C., Nell, T. A., Bellary, S., & Renshaw, D. W. (2022) · Nutrients · doi:10.3390/nu14112360 · Cited by 3
Wake, C., Schneider, J. A., Stein, T. D., Bregu, J., Labadorf, A. T., McKee, A. C., Jager, P. L. D., Bennett, D. A., Seshadri, S. S., Myers, R. H., et al. (2022) · bioRxiv (Cold Spring Harbor Laboratory) · doi:10.1101/2022.01.08.473382 · Cited by 4
Inhibition of the mTORC1 pathway alleviates adipose tissue fibrosis
Gong, S., Li, C., Leng, Q., Liu, C., Zhu, Y., Zhang, H., & Li, X. (2023) · Heliyon · doi:10.1016/j.heliyon.2023.e21526 · Cited by 2
Essential Role of Extracellular Type V Collagen for Porcine Adipocyte Development
Nakajima, I., NAKAMURA, F., & CHIKUNI, K. (2021) · Nihon Yoton Gakkaishi · doi:10.5938/youton.58.2_53 · Cited by 2
Adipose Structure (White, Brown, Beige)
Pellegrinelli, V., Vidal‐Puig, A., & Carobbio, S. (2023) · Springer eBooks · doi:10.1007/978-3-031-40116-9_23 · Cited by 2
Sawamoto, A., Okada, M., Matsuoka, N., Okuyama, S., & Nakajima, M. (2024) · The FASEB Journal · doi:10.1096/fj.202301861rr · Cited by 4
IMPROVE 2022 International Meeting on Pathway‐Related Obesity : Vision of Excellence
Kühnen, P., Argente, J., Clément, K., Dollfus, H., Dubern, B., Farooqi, I. S., de Groot, C., Grüters, A., Holm, J., Hopkins, M., et al. (2024) · Clinical Obesity · doi:10.1111/cob.12659 · Cited by 2
Zhao, H., & Tu, X. (2025) · Frontiers in Endocrinology · doi:10.3389/fendo.2025.1469400 · Cited by 3
Cheng, Y., Zhang, K., Liu, J., & Liu, G. (2025) · Journal of Endocrinological Investigation · doi:10.1007/s40618-025-02568-7 · Cited by 2
Network-Based Methods for Computational Diagnostics by Means of R
Mueller, L. A. J., Dehmer, M., & Emmert‐Streib, F. (2012) · Springer eBooks · doi:10.1007/978-3-7091-0947-2_11 · Cited by 2
Fibrose du tissu adipeux : la matrice en mouvement
Divoux, A., Mosbah, H., Tordjman, J., Andréelli, F., & Clément, K. (2012) · Médecine des Maladies Métaboliques · doi:10.1016/s1957-2557(12)70394-2 · Cited by 3
Self-citationAdipose Structure (White, Brown, Beige)
Peirce, V. J., Pellegrinelli, V., & Vidal‐Puig, A. (2015) · Springer eBooks · doi:10.1007/978-3-319-12125-3_23-1 · Cited by 3
Adipocyte Dysfunction, Inflammation, and Insulin Resistance in Obesity
Jahansouz, C. (2015) · Springer eBooks · doi:10.1007/978-1-4939-3220-7_5 · Cited by 2
Cheng, Y., Liu, C.-C., Chu, F., Yang, C., Hsiao, C., Chuang, C.-W., Shiau, M., Lee, H., Tsai, J., & Chang, Y.-H. (2020) · International Journal of Molecular Sciences · doi:10.3390/ijms21155493 · Cited by 2
Esser, D., Matualatupauw, J. C., de Vos, R. C. H., Wehrens, R., van der Stappen, J., Meer, I. M. V. D., & Afman, L. A. (2021) · Nutrients · doi:10.3390/nu13010260 · Cited by 2
Effects of non-vascularized adipose tissue transplantation on its genetic profile
Schreiter, J. S., Kurow, O., Langer, S. W., Steinert, M., & Massier, L. (2021) · Adipocyte · doi:10.1080/21623945.2021.1889815 · Cited by 2
Abstracting Complex Interaction Networks
Saitta, L., Hénégar, C., & Zucker, J. (2010) · Cited by 2
Self-citationThe role of Ad-36 and its E4orf-1 protein in modulating glycemic control
Dhurandhar, E. J. (2011) · Louisiana State University · doi:10.31390/gradschool_dissertations.1411 · Cited by 2
Fang, Y., Hooiveld, G. J. E. J., & Afman, L. A. (2025) · Nutrition & Metabolism · doi:10.1186/s12986-025-01010-2 · Cited by 1
Brøns, C., Elingaard-Larsen, L. O., Justesen, L., Villumsen, S. O., Thuesen, A. C. B., Engelhard, L. M., Gertsen, S. S., Ried‐Larsen, M., Prasad, R. B., Hansen, T. F., et al. (2025) · Diabetes · doi:10.2337/db25-0307 · Cited by 1
A Hydrogel Culture System Regulates Human Adipocyte Function
Kwon, J. J., Li, J., Liu, J. Y.-C., Patsalis, C., Wu, P., Kawase, Y. H., Ky, A., Pasternak, C., Mason, D. D., Bozadjieva-Kramer, N., et al. (2025) · International Journal of Molecular Sciences · doi:10.3390/ijms262210865 · Cited by 1
Rønningen, T., Zeng, Y., Dahl, M. B., Wang, J., Visnovska, T., Tannæs, T. M., Poulsen, L. L. C., Çayır, A., Svensson, S. I. A., Svanevik, M., et al. (2025) · Biomarker Research · doi:10.1186/s40364-025-00857-0 · Cited by 1
Espinoza, C. M., Myers, C., Oppler, S. H., Stone, L. H., Seelig, D. M., Rangarajan, P., Ramachandran, S., & Graham, M. L. (2025) · Surgeries · doi:10.3390/surgeries6040106 · Cited by 1
Effect of bariatric surgery on matrix metalloproteinase activity in patients with morbid obesity
Choromańska, B., Myśliwiec, P., Dadan, J., Tkaczuk, A., Wisniewski, K., Maleckas, A., Zalewska, A., Żendzian‐Piotrowska, M., & Maciejczyk, M. (2026) · Frontiers in Medicine · doi:10.3389/fmed.2026.1836747 · Cited by 1
Functional characterization of obesity using advanced 3D in vitro adipose tissue models
Pieters, V. M., Nguyen, K. S., Gilbert, P. M., & McGuigan, A. P. (2026) · Biomaterials · doi:10.1016/j.biomaterials.2026.124446 · Cited by 1
Adipose Tissue Inflammation in Obesity
Poitou, C., Dalmas, É., & Clément, K. (2012) · Springer eBooks · doi:10.1007/978-2-8178-0343-2_20 · Cited by 2
Self-citationSun, Y., Xie, M., Huang, T., Zhang, X., Lei, S.-C., Shi, Q., Wang, S., Fan, C., & Zhang, J. (2014) · Europe PMC (PubMed Central) · Cited by 1
Apports des approches en «omique» à la physiopathologie des obésités
Viguerie, N. (2013) · Springer eBooks · doi:10.1007/978-2-8178-0332-6_19 · Cited by 1
Self-citationHistology of normal and pathological white adipose tissue
Tordjman, J. (2013) · Obésité · Cited by 1
Self-citationAdaptive Changes in Human Adipose Tissue During Weight Gain
Alligier, M., Disse, E., Vidal, H., & Laville, M. (2012) · Springer eBooks · doi:10.1007/978-2-8178-0343-2_22 · Cited by 1
Adipose Structure (White, Brown, Beige)
Pellegrinelli, V., Vidal‐Puig, A., & Carobbio, S. (2023) · Springer eBooks · doi:10.1007/978-3-319-12125-3_23-2 · Cited by 1
Pathological Alteration of Human Adipose Tissue in Obesity
Clément, K. (2010) · Research and perspectives in endocrine interactions · doi:10.1007/978-3-642-13517-0_1 · Cited by 1
Gmoshinski, I. V., Apryatin, S. A., KhKh, S., Nikityuk, D. B., & Tutelyan, V. A. (2018) · Annals of the Russian academy of medical sciences · doi:10.15690/vramn973 · Cited by 2
Adult Non-alcoholic Fatty Liver Disease (NAFLD)
Pedersen, J. S., & Bendtsen, F. (2018) · Springer eBooks · doi:10.1007/978-3-319-98890-0_2 · Cited by 1
Carillon, J., Saby, M., Barial, S., Sansone, A., Scanferlato, R., Gayrard, N., Lajoix, A., Jover, B. F., Chatgilialoglu, C., & Ferreri, C. (2019) · Journal of Functional Foods · doi:10.1016/j.jff.2019.05.027 · Cited by 1
Fibrose du tissu adipeux chez l’obèse : nouveaux aspects
Marcelin, G., & Clément, K. (2017) · Bulletin de l Académie Nationale de Médecine · doi:10.1016/s0001-4079(19)30458-3 · Cited by 1
Rose, C., & Marcelin, G. (2021) · Elsevier eBooks · doi:10.1016/b978-2-294-76753-1.00031-x · Cited by 2
Gene analysis for studying the process of weight regain after weight loss
Roumans (2017) · Research Publications (Maastricht University) · doi:10.26481/dis.20170623nr · Cited by 1
Trefts, E. (2019) · Cited by 1
A Distinct Form of Subcutaneous Fat Fibrosis Predicts Insulin Resistance in People with HIVPreprint
Alba, D., Choi, M. K., Abdellatif, A., Mayfield, S. B., Pham, T. A. T., Berrios, D. I., Rodriguez, A., Ewing, M., Figueroa, T. R., Gonzalez‐Vargas, J., et al. (2025) · medRxiv · doi:10.1101/2025.05.13.25327547 · Cited by 1
Chaurasiya, V., Li, L., Lluch, A., Fernández-Sánchez, A., Harju, J., Pham, D. D., Perttunen, S., Keskitalo, S., Varjosalo, M. T., Pietiläinen, K. H., et al. (2026) · Research Square · doi:10.21203/rs.3.rs-9485802/v1 · Cited by 1
Efeito da caquexia associada ao câncer em componentes da matriz extracelular do tecido adiposo.
Alves, M. J. (2011) · Digital Library of Theses and Dissertations (Universidade de São Paulo) · doi:10.11606/d.42.2011.tde-19032012-155039
Wabitsch, M., Fuchs, M., Horenburg, S., Denzer, C., von Puttkamer, J., Moß, A., Lahr, G., & Fischer‐Posovszky, P. (2008) · KARGER eBooks · doi:10.1159/000158563
Search for Genes Influencing Complex Traits
Hénégar, C., Hooton, H., & Clément, K. (2010) · doi:10.1002/9781444327335.ch6
A Role for sFRP5 in Adipocyte Biology and Obesity.
Prestwich, T. C. (2009) · Deep Blue (University of Michigan)
Histologie et histopathologie du tissu adipeux dans l’obésité
Tordjman, J. (2013) · Springer eBooks · doi:10.1007/978-2-8178-0332-6_6 · Cited by 1
Self-citationAdipose tissue inflammation, hepatic fat accumulation and insulin resistance
Kolak, M. (2008) · Figshare
Que devient le tissu adipeux dans l’obésité ?
Clément, K., & Guerre-Millo, M. (2011) · Cahiers de Nutrition et de Diététique · doi:10.1016/j.cnd.2011.06.003
Self-citationBoettner, B. (2014) · Science-Business eXchange · doi:10.1038/scibx.2014.159
The role of the farnesoid X receptor in metabolic control
Stroeve, J. H. M. (2011) · University of Groningen research database (University of Groningen / Centre for Information Technology)
Gene expression patterns in human adipose tissue in relation to fat mass and adipose depot
Ekberg, K. (2012) · Figshare
Metadata
- Authors
- Henegar, C., Tordjman, J., Achard, V., Lacasa, D., Cremer, I., Guerre-Millo, M., Poitou, C., Basdevant, A., Stich, V., Viguerie, N., Langin, D., Bedossa, P., Zucker, J.-D., & Clement, K.
- Affiliations
- Inserm (FR)
- Université Toulouse III - Paul Sabatier (FR)
- ORCID
- Venue
- Genome Biology
- Published
- 2008-01-21
- Volume
- 9
- Issue
- 1
- Pages
- R14-R14
- ISSN
- 1465-6906 (ISSN-L)
- 1474-760X
- PMC
- PMC2395253
- OpenAlex
- W2136425420
- Semantic Scholar
- a0031a71b94318afa099bb81af800d1555d245ae
- Cited by
- 471
- References
- 86
- Citations by year
- 2026: 10 · 2025: 17 · 2024: 18 · 2023: 23 · 2022: 27 · 2021: 23 · 2020: 34 · 2019: 25 · 2018: 32 · 2017: 35 · 2016: 29 · 2015: 33 · 2014: 25 · 2013: 31 · 2012: 28
- FWCI
- 19.79
- Type
- journal article
- Language
- en
- Open access
- gold
- doi.org
- Locations
- Genome biology (publishedVersion, cc-by)
- PubMed Central (publishedVersion, cc-by)
- PubMed (publishedVersion)
- HAL (submittedVersion, other-oa)
- Funders
- Agence Nationale de la Recherche (ANR-05)
- Institut National de la Santé et de la Recherche Médicale (4NU10G)
- Assistance Publique - Hôpitaux de Paris
- Topics
- Health Sciences › Medicine › Endocrinology, Diabetes and Metabolism › Adipokines, Inflammation, and Metabolic Diseases
- Health Sciences › Medicine › Physiology (medical) › Adipose Tissue and Metabolism
- Health Sciences › Medicine › Cardiology and Cardiovascular Medicine › Cardiovascular Disease and Adiposity
- Keywords
- obesity, white adipose tissue, extracellular matrix, gene expression signatures, low-grade inflammation, integrins, interstitial fibrosis, bariatric surgery, weight loss, preadipocytes, inflammatory cell infiltration, adipose tissue metabolism, gene co-expression network
- MeSH terms
- Adipose Tissue, Extracellular Matrix, Fibrosis, Humans, Inflammation, Obesity, Weight Loss, Gene Expression Profiling, Bariatric Surgery, Adipose Tissue, White
About these checks
Registry, retraction, Cites and statistics results are computed, not judged, with one exception: a printed reference that no index lists is read once by a model before it counts as a citation error. Claims are extracted by a model and kept only when their quote appears verbatim in the text; each cited source is then checked, with a model’s help, for whether it says what the claim relies on. Those verdicts can be wrong — read the claim’s quote and the cited source before relying on one.
A language model drew the claims from the paper on 2026-10-10, under version 3 of the claim definition (model deepseek-v4.1-flash, prompt extract-v3).
A second model labelled each claim on 2026-10-10 (model jev-1.13-20260917, definition revision gold-guideline-v0.2).
Cited sources are checked with a language model’s help (gpt-6-sol).
Statistics and arithmetic are recomputed, not judged.
Confidence bands are shown only for fields calibrated on our annotated test set. None is calibrated yet, so no band is shown.
What counts as a claim ›How we measure confidence ›How we check this ›
Are you an author, or do you see a problem with this page? Request a review
