

Functional brain networks develop from a local to distributed organization
Open accessThe DOI matches its Crossref record; 103 of the 104 references it cites were found in a registry or an index.
Abstract
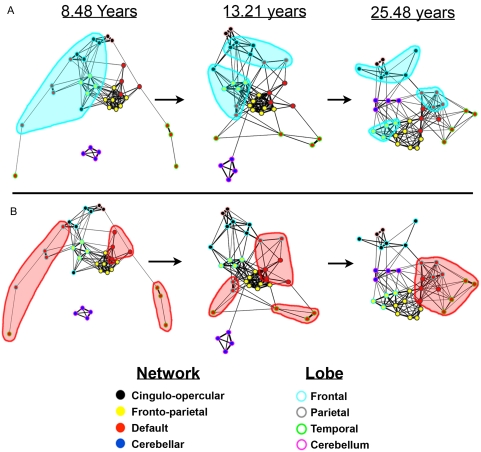
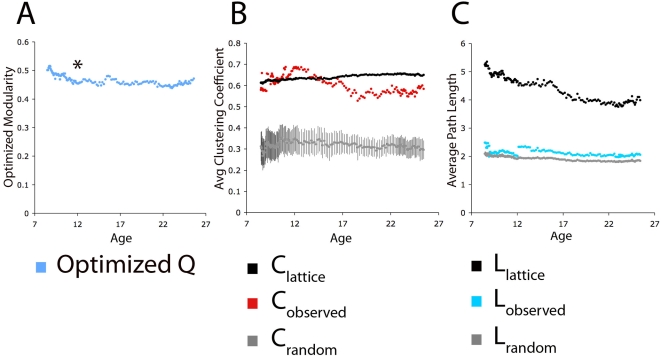
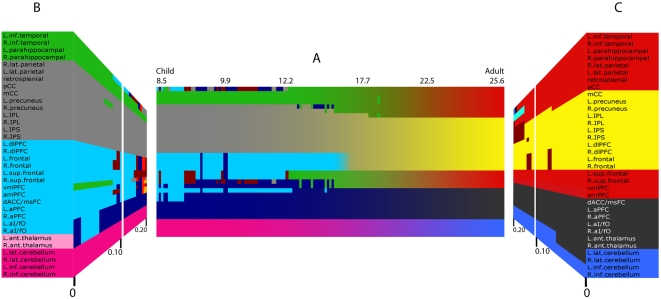
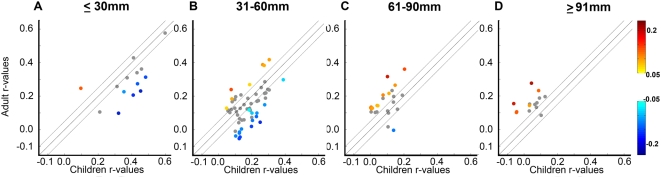
The mature human brain is organized into a collection of specialized functional networks that flexibly interact to support various cognitive functions. Studies of development often attempt to identify the organizing principles that guide the maturation of these functional networks. In this report, we combine resting state functional connectivity MRI (rs-fcMRI), graph analysis, community detection, and spring-embedding visualization techniques to analyze four separate networks defined in earlier studies. As we have previously reported, we find, across development, a trend toward 'segregation' (a general decrease in correlation strength) between regions close in anatomical space and 'integration' (an increased correlation strength) between selected regions distant in space. The generalization of these earlier trends across multiple networks suggests that this is a general developmental principle for changes in functional connectivity that would extend to large-scale graph theoretic analyses of large-scale brain networks. Communities in children are predominantly arranged by anatomical proximity, while communities in adults predominantly reflect functional relationships, as defined from adult fMRI studies. In sum, over development, the organization of multiple functional networks shifts from a local anatomical emphasis in children to a more "distributed" architecture in young adults. We argue that this "local to distributed" developmental characterization has important implications for understanding the development of neural systems underlying cognition. Further, graph metrics (e.g., clustering coefficients and average path lengths) are similar in child and adult graphs, with both showing "small-world"-like properties, while community detection by modularity optimization reveals stable communities within the graphs that are clearly different between young children and young adults. These observations suggest that early school age children and adults both have relatively efficient systems that may solve similar information processing problems in divergent ways.
Overview
The claims and statistics of this paper haven’t been checked yet.
Free: it reads the open-access text and checks the first 5 claims that cite a source we can check. Create a free account to check every claim.
Integrity signals
Registry
Cites
Statistics
Figures

Verification
Claims the paper makes
The claims and statistics of this paper haven’t been checked yet.
Free: it reads the open-access text and checks the first 5 claims that cite a source we can check. Create a free account to check every claim.
Claims other papers make about this one
Each is checked against this paper’s own text: does it say what the citing paper says it does?
The source backs part of the claim, not all of it — or backs it for a different population, condition or comparison.
In the citing paper
“Human neuroimaging studies have shown corresponding patterns of regional brain changes across development [12] with functional connectivity studies [13,14] suggesting refinement of local subcortical circuits precedes refinement of distal cortical ones.”
From Development of the emotional brain (2019) · cites this paper as [13]
Experimental — accuracy not yet measuredThe source backs part of the claim, not all of it — or backs it for a different population, condition or comparison.
In the citing paper
“A plausible temporal mechanism for the shifts in cognitive capacity from childhood to adulthood is a fine-tuning of circuits from subcortico-subcortical to cortico-subcortical to cortico-cortical consistent with postmortem animal studies of regional synaptic changes (Rakic et al., 1994) and functional connectivity studies (Fair et al., 2009) of refinement of local circuits preceding refinement of”
From Beyond simple models of adolescence to an integrated circuit-based account: A commentary (2016) · cites this paper as Fair et al., 2009
Experimental — accuracy not yet measuredThe source backs part of the claim, not all of it — or backs it for a different population, condition or comparison.
In the citing paper
“Evidence has converged on an executive attention network, with the anterior cingulate being the central structure, as the major network responsible for resolving cognitive conflicts (21, 22).”
From Multimodal imaging of the self-regulating developing brain (2012) · cites this paper as [21]
Experimental — accuracy not yet measuredThe source backs part of the claim, not all of it — or backs it for a different population, condition or comparison.
In the citing paper
“Prior work in fMRI using this modularity algorithm required that the researcher set an arbitrary threshold, or cutoff point, for what constitutes similarity between any two given individuals. Researchers would then arrive at thresholds by looking for consistency in community detection results at multiple thresholds (e.g., [2], [21], [22]).”
From Organizing Heterogeneous Samples Using Community Detection of GIMME-Derived Resting State Functional Networks (2014) · cites this paper as [22]
Experimental — accuracy not yet measuredThe source backs part of the claim, not all of it — or backs it for a different population, condition or comparison.
In the citing paper
“The functional network studies have consistently shown no statistical difference in global topological properties between children and adults”
From Developmental Changes in Organization of Structural Brain Networks (2013) · cites this paper as Fair et al. 2009
Experimental — accuracy not yet measured
5 more claims about this paper
Create a free account to see every claim other papers make about this one.
Self-check
Percentages, sums and reported differences re-computed from the paper’s own numbers.
The self-check needs the paper’s full text.
Citations
Cites
Controlling the False Discovery Rate: A Practical and Powerful Approach to Multiple Testing
Benjamini, Y., & Hochberg, Y. (1995) · Journal of the Royal Statistical Society Series B: Statistical Methodology · doi:10.1111/j.2517-6161.1995.tb02031.x · Cited by 109,482 · cited 1×
“To account for multiple comparisons the Benjamini and Hochberg False Discovery Rate [97] was applied.”
MethodCollective dynamics of ‘small-world’ networks
Watts, D. J., & Strogatz, S. H. (1998) · Nature · doi:10.1038/30918 · Cited by 43,060 · cited 1×
“long-range processes. It is this hybrid graph topology (i.e., high clustering coefficients and short path lengths) that matches the observed “small world” networks in many complex systems”
BackgroundModularity and community structure in networks
Newman, M. E. J. (2006) · Proceedings of the National Academy of Sciences · doi:10.1073/pnas.0601602103 · Cited by 12,256 · cited 5×
“As stated by Newman: ‘‘A good division of a graph into communities is not merely one in which there are few edges between communities; it is one in which there are fewer than expected edges between communities.”
BackgroundMethodInfluentialA default mode of brain function
Raichle, M. E., MacLeod, A. M., Snyder, A. Z., Powers, W. J., Gusnard, D. A., & Shulman, G. L. (2001) · Proceedings of the National Academy of Sciences · doi:10.1073/pnas.98.2.676 · Cited by 12,190 · cited 2×
“While the distinct function of the default mode network is often linked to internally directed mental activity [39], this notion continues to be debated [25,32,41–44].”
Functional connectivity in the motor cortex of resting human brain using echo‐planar mri
Biswal, B., Zerrin Yetkin, F., Haughton, V. M., & Hyde, J. S. (1995) · Magnetic Resonance in Medicine · doi:10.1002/mrm.1910340409 · Cited by 9,812
The human brain is intrinsically organized into dynamic, anticorrelated functional networks
Fox, M. D., Snyder, A. Z., Vincent, J. L., Corbetta, M., Van Essen, D. C., & Raichle, M. E. (2005) · Proceedings of the National Academy of Sciences · doi:10.1073/pnas.0504136102 · Cited by 8,553 · cited 3×
“Resting-state fcMRI analyses have repeatedly shown that these regions, along with associated medial temporal regions, are correlated at rest in adults [15,16,32,40].”
Distributed hierarchical processing in the primate cerebral cortex
Felleman, D. J., & Van Essen, D. C. (1991) · Cerebral Cortex · doi:10.1093/cercor/1.1.1 · Cited by 7,783 · cited 1×
“Increased myelination is thought to proceed from primary sensory and motor regions to association areas [68– 71], roughly following the hierarchical organization introduced by Felleman and Van Essen [72] (Note that while the most frequently referenced neuroanatomical changes that occur throughout development have been…”
BackgroundDissociable intrinsic connectivity networks for salience processing and executive control
Seeley, W. W., Menon, V., Schatzberg, A. F., Keller, J., Glover, G. H., Kenna, H., Reiss, A. L., & Greicius, M. D. (2007) · The Journal of Neuroscience · doi:10.1523/jneurosci.5587-06.2007 · Cited by 7,426 · cited 3×
“In addition, several previous findings using this technique [21,22,32] have now been replicated using continuous resting blocks [27,33,34] and other continuous resting data [89].”
BackgroundMethodFunctional connectivity in the resting brain: a network analysis of the default mode hypothesis
Greicius, M. D., Krasnow, B., Reiss, A. L., & Menon, V. (2003) · Proceedings of the National Academy of Sciences · doi:10.1073/pnas.0135058100 · Cited by 6,358 · cited 1×
“Resting-state fcMRI analyses have repeatedly shown that these regions, along with associated medial temporal regions, are correlated at rest in adults [15,16,32,40].”
BackgroundThe brainweb: phase synchronization and large-scale integration
Varela, F., Lachaux, J.-P., Rodriguez, E., & Martinerie, J. (2001) · Nature Reviews Neuroscience · doi:10.1038/35067550 · Cited by 4,761 · cited 1×
“In adults, spontaneous correlated activity has been suggested to be important for gating information flow [54], building internal representations [43,44,54], and maintaining mature network relationships [43,44,54].”
Background
Cited by
Items 301–400 of 1,003
Nguyen, T.-V., McCracken, J. T., Ducharme, S., Cropp, B. F., Botteron, K. N., Evans, A. C., & Karama, S. (2013) · Journal of Neuroscience · doi:10.1523/jneurosci.5747-12.2013 · Cited by 105
Posner, J., Maia, T. V., Fair, D., Peterson, B. S., Sonuga-Barke, E. J., & Nagel, B. J. (2011) · Psychiatry Research: Neuroimaging · doi:10.1016/j.pscychresns.2011.02.005 · Cited by 104
“For example, regional interactions of the mPFC change significantly over development (Fair et al., 2008; Fair et al., 2009), which may lead to functional modifications of this region with maturation.”
BackgroundSelf-citationResting-state functional connectivity differences in premature children
Damaraju, E. (2010) · Frontiers in Systems Neuroscience · doi:10.3389/fnsys.2010.00023 · Cited by 118
Fransson, P., Metsäranta, M., Blennow, M., Åden, U., Lagercrantz, H., & Vanhatalo, S. (2013) · Cerebral Cortex · doi:10.1093/cercor/bhs047 · Cited by 104
On development of functional brain connectivity in the young brain
Hoff, G. E. A.-J., Van den Heuvel, M. P., Benders, M. J. N. L., Kersbergen, K. J., & De Vries, L. S. (2013) · Frontiers in Human Neuroscience · doi:10.3389/fnhum.2013.00650 · Cited by 103
“As for the DMN, a more integrated network is found in teenagers and young adults (Fair et al., 2008, 2009).”
BackgroundMethodAtypical developmental of dorsal and ventral attention networks in autism
Farrant, K., & Uddin, L. Q. (2015) · Developmental Science · doi:10.1111/desc.12359 · Cited by 109
Visualizing the human connectome
Margulies, D. S., Böttger, J., Watanabe, A., & Gorgolewski, K. J. (2013) · NeuroImage · doi:10.1016/j.neuroimage.2013.04.111 · Cited by 113
Altered fronto-cerebellar connectivity in alcohol-naïve youth with a family history of alcoholism
Herting, M. M., Fair, D. A., & Nagel, B. J. (2010) · NeuroImage · doi:10.1016/j.neuroimage.2010.10.030 · Cited by 113
“Furthermore, aberrant fronto-cerebellar functional connectivity in FH+youth may reflect an overall developmental delay, as long range functional connections, such as those between the cerebellum and the cerebral cortex, emerge across development (Fair et al., 2009, 2007a).”
BackgroundSelf-citationThermenos, H. W., Keshavan, M. S., Juelich, R. J., Molokotos, E., Whitfield‐Gabrieli, S., Brent, B. K., Makris, N., & Seidman, L. J. (2013) · American Journal of Medical Genetics Part B: Neuropsychiatric Genetics · doi:10.1002/ajmg.b.32170 · Cited by 102
“[2009] demonstrated that there is progression during normal brain development from local to distributed connectivity, with strong local (anatomically close) connections, and weak distant connections (termed “segregation”) in children, and increasingly “distributed” or long-range connectivity (and decreased shortrange…”
BackgroundGraph theoretical modeling of baby brain networks
Zhao, T., Xu, Y., & He, Y. (2019) · NeuroImage · doi:10.1016/j.neuroimage.2018.06.038 · Cited by 99
“This hypothesis is supported by the “local to distributed” developmental pattern of the human brain, which is proposed as an interactive specialization framework initially and further extended to brain network modeling studies (Fair et al., 2009; Johnson, 2000; V ertes and Bullmore, 2015).”
MethodQian, X., Loo, B. R. Y., Castellanos, F. X., Liu, S., Koh, H. L., Poh, X. W. W., Krishnan, R. K. R., Fung, D. S. S., Chee, M. W. L., Guan, C., et al. (2018) · Translational Psychiatry · doi:10.1038/s41398-018-0213-8 · Cited by 111
Zimmermann, J., Perry, A., Breakspear, M. J., Schirner, M., Sachdev, P. S., Wen, W., Kochan, N. A., Mapstone, M., Ritter, P., McIntosh, A. R., et al. (2018) · NeuroImage Clinical · doi:10.1016/j.nicl.2018.04.017 · Cited by 110
Early human brain development: Starring the subplate
Hadders-Algra, M. (2018) · Neuroscience & Biobehavioral Reviews · doi:10.1016/j.neubiorev.2018.06.017 · Cited by 100
Vaessen, M. J., Braakman, H. M. H., Heerink, J. S., Jansen, J. F. A., Hall, M. H. J. A. D.-V., Hofman, P. A. M., Aldenkamp, A. P., & Backes, W. H. (2012) · Cerebral Cortex · doi:10.1093/cercor/bhs186 · Cited by 102
“This is in agreement with prior studies that showed that in early (normal) development mainly the long-range connections increase in strength, whereas the strength of the short-range connections decreased (Fair et al. 2009; Supekar et al. 2009; Hagmann et al. 2010).”
BackgroundMethodResultKlapwijk, E. T., Goddings, A.-L., Burnett Heyes, S., Bird, G., Viner, R. M., & Blakemore, S.-J. (2013) · Hormones and Behavior · doi:10.1016/j.yhbeh.2013.03.012 · Cited by 100
Global Functional Connectivity Abnormalities in Children with F etal A lcohol S pectrum D isorders
Wozniak, J. R., Mueller, B. A., Bell, C. J., Muetzel, R. L., Hoecker, H. L., Boys, C. J., & Lim, K. O. (2012) · Alcoholism Clinical and Experimental Research · doi:10.1111/acer.12024 · Cited by 111
“These networks follow developmental trajectories; child “task” networks are characterized by high local connectivity and lower long-distance connectivity than adults (Fair et al., 2009).”
BackgroundFirst-year development of modules and hubs in infant brain functional networks
Wen, X., Zhang, H., Li, G., Liu, M., Yin, W., Lin, W., Zhang, J., & Shen, D. G. (2018) · NeuroImage · doi:10.1016/j.neuroimage.2018.10.019 · Cited by 116
“This is similar to “robust mean” (Fair et al., 2009; Meunier et al., 2009; Lynall et al., 2010) that derives more robust group means by removing outliers.”
Functional connectivity to a right hemisphere language center in prematurely born adolescents
Myers, E. H., Hampson, M., Vohr, B. R., Lacadie, C., Frost, S. J., Pugh, K. R., Katz, K. H., Schneider, K. C., Makuch, R., Constable, R. T., et al. (2010) · NeuroImage · doi:10.1016/j.neuroimage.2010.03.049 · Cited by 114
“As maturation progresses, the developing brain increases the strength of connections that exist in spatially remote regions in an anterior– posterior direction to create highly cohesive functional circuits, while simultaneously reducing the strength of connections between adjacent regions and contralateral homologues…”
Age related changes in striatal resting state functional connectivity in autism
Padmanabhan, A., Lynn, A., Foran, W., Luna, B., & O'Hearn, K. (2013) · Frontiers in Human Neuroscience · doi:10.3389/fnhum.2013.00814 · Cited by 97
The development of neural correlates for memory formation
Ofen, N. (2012) · Neuroscience & Biobehavioral Reviews · doi:10.1016/j.neubiorev.2012.02.016 · Cited by 97
“Such exploration is important, considering the mounting evidence documenting developmental trends in functional brain connectivity (Fair et al., 2009, 2007).”
MR connectomics: a conceptual framework for studying the developing brain
Hagmann, P., Grant, P. E., & Fair, D. A. (2012) · Frontiers in Systems Neuroscience · doi:10.3389/fnsys.2012.00043 · Cited by 96
“The maturation of functional systems as described by Fair et al. (2007, 2009b) was the basis of the work by Zielinski et al. (2010).”
BackgroundMethodInfluentialSelf-citationThe Teenage Brain: Cognitive Control and Motivation
Luna, B., Paulsen, D. J., Padmanabhan, A., & Geier, C. (2013) · Current Directions in Psychological Science · doi:10.1177/0963721413478416 · Cited by 92
“Throughout development, the basic architecture of the brain remained stable (e.g. areas that served as hubs and the regions they connected to did not change) and were organized in an optimal small world arrangement as has been found previously (Fair et al., 2009).”
InfluentialBoylan, C., Trueswell, J. C., & Thompson‐Schill, S. L. (2015) · Neuropsychologia · doi:10.1016/j.neuropsychologia.2015.10.007 · Cited by 100
Zimmermann, J., Ritter, P., Shen, K., Rothmeier, S., Schirner, M., & McIntosh, A. R. (2016) · Human Brain Mapping · doi:10.1002/hbm.23200 · Cited by 103
“Aging effects are not uniform across the brain [Ferreira and Busatto, 2013; Salat et al., 2005], thus a regionwise analysis may elucidate novel patterns.”
BackgroundStructurally-Constrained Relationships between Cognitive States in the Human Brain
Hermundstad, A. M., Brown, K. S., Bassett, D. S., Aminoff, E. M., Frithsen, A., Johnson, A., Tipper, C. M., Miller, M. B., Grafton, S. T., & Carlson, J. M. (2014) · PLoS Computational Biology · doi:10.1371/journal.pcbi.1003591 · Cited by 93
“Furthermore, interactions within and between these networks have been shown to change throughout development [37,38] and aging [39], suggesting that the state-space of relationships found here could exhibit different characteristics across subjects of different ages.”
BackgroundHerting, M. M., Younan, D., Campbell, C. E., & Chen, J.-C. (2019) · Frontiers in Public Health · doi:10.3389/fpubh.2019.00332 · Cited by 94
Sacchet, M. D., Ho, T. C., Connolly, C. G., Tymofiyeva, O., LeWinn, K. Z., Han, L. K. M., Blom, E. H., Tapert, S. F., Max, J. E., Frank, G., et al. (2016) · Neuropsychopharmacology · doi:10.1038/npp.2016.76 · Cited by 107
“Although this was surprising, it may be explained by findings that functional network development during adolescence is concentrated primarily in attention, central executive, salience, and default mode networks (Fair et al, 2009; Grayson et al, 2014; Kelly et al, 2009; Power et al, 2010).”
BackgroundInfluentialNeural signatures of phonological deficits in Chinese developmental dyslexia
Cao, F., Yan, X., Wang, Z., Liu, Y., Wang, J., Spray, G. J., & Deng, Y. (2016) · NeuroImage · doi:10.1016/j.neuroimage.2016.11.051 · Cited by 95
“This finding is in general consistent with the previous finding that the long-range connectivity in the brain increases with age including the connectivity between the visual association and auditory association areas (Fair et al., 2009; Supekar et al., 2009; Hoff et al., 2013).”
ResultChanges in the brain intrinsic organization in both on-task state and post-task resting state
Wang, Z., Liu, J., Zhong, N., Qin, Y., Zhou, H., & Li, K. (2012) · NeuroImage · doi:10.1016/j.neuroimage.2012.04.051 · Cited by 102
“This activity is also related to the establishment of early cortical patterns (Price et al., 2006; Sur and Leamey, 2001) and the development of intrinsic functional networks over ages (Fair et al., 2008, 2009).”
BackgroundInfluentialLi, F., He, N., Li, Y., Chen, L., Huang, X., Lui, S., Guo, L., Kemp, G. J., & Gong, Q. (2014) · Radiology · doi:10.1148/radiol.14131622 · Cited by 94
Sudre, G., Szekely, E., Sharp, W., Kasparek, S., & Shaw, P. (2017) · Proceedings of the National Academy of Sciences · doi:10.1073/pnas.1705229114 · Cited by 93
Prenatal Drug Exposure Affects Neonatal Brain Functional Connectivity
Salzwedel, A. P., Grewen, K. M., Vachet, C., Gerig, G., Lin, W., & Gao, W. (2015) · The Journal of Neuroscience · doi:10.1523/jneurosci.4333-14.2015 · Cited by 93
“However, although the functional development of the brain is most dynamic during infancy, later growth/reorganization is also significant (Fair et al., 2009; Supekar et al., 2009).”
BackgroundResolving Structural Variability in Network Models and the Brain
Klimm, F., Bassett, D. S., Carlson, J. M., & Mucha, P. J. (2014) · PLoS Computational Biology · doi:10.1371/journal.pcbi.1003491 · Cited by 91
Heller, A. S., & Casey, B. J. (2015) · Developmental Science · doi:10.1111/desc.12373 · Cited by 108
Functional and Structural Brain Correlates of Socioeconomic Status
Yaple, Z. A., & Yu, R. (2019) · Cerebral Cortex · doi:10.1093/cercor/bhz080 · Cited by 108
Wee, C.-Y., Zhao, Z., Yap, P.-T., Wu, G., Shi, F., Price, T., Du, Y., Xu, J., Zhou, Y., & Shen, D. (2014) · PLoS ONE · doi:10.1371/journal.pone.0107306 · Cited by 92
“Impairment of long-range connections can be seen as a failure of the integration process within a distributed functional network of the human brain [63,64,75], a deviation from the normal neurodevelopmental trajectory.”
BackgroundDisrupted Functional Brain Networks in Autistic Toddlers
Boersma, M., Kemner, C., de Reus, M. A., Collin, G., Snijders, T. M., Hofman, D., Buitelaar, J. K., Stam, C. J., & van den Heuvel, M. P. (2013) · Brain Connectivity · doi:10.1089/brain.2012.0127 · Cited by 92
“…like pruning of synapses and myelination of long-range axons, and leading to decreasing (local) segregation and increasing (global) integration with development (Barry et al., 2004; Fair et al., 2009; Giedd et al., 1999; Hag-mann et al., 2010; Thatcher, 1992; Uddin et al., 2010; Yap et al., 2011).”
Dynamics of the human structural connectome underlying working memory training
Caeyenberghs, K., Metzler-Baddeley, C., Foley, S., & Jones, D. K. (2016) · The Journal of Neuroscience · doi:10.1523/jneurosci.1973-15.2016 · Cited by 91
Complexity in Relational Processing Predicts Changes in Functional Brain Network Dynamics
Cocchi, L., Halford, G. S., Zalesky, A., Harding, I. H., Ramm, B. J., Cutmore, T., Shum, D. H. K., & Mattingley, J. B. (2014) · Cerebral Cortex · doi:10.1093/cercor/bht075 · Cited by 91
“…functional architecture of both the fronto-parietal network (trial-by-trial control) and the cingulo-opercular network (task set; Dosenbach et al. 2007, 2008; Dosenbach et al. 2010; also Power et al. 2011 and Fair et al. 2009; see Supplementary Table S1 for a comparison of the coordinates) (Fig.”
BackgroundBrain connectivity in normally developing children and adolescents
Khundrakpam, B. S., Lewis, J. D., Zhao, L., Chouinard-Decorte, F., & Evans, A. C. (2016) · NeuroImage · doi:10.1016/j.neuroimage.2016.03.062 · Cited by 91
Nielsen, A. N., Greene, D. J., Gratton, C., Dosenbach, N. U. F., Petersen, S. E., & Schlaggar, B. L. (2019) · Cerebral Cortex · doi:10.1093/cercor/bhy117 · Cited by 89
Self-citationQian, X., Castellanos, F. X., Uddin, L. Q., Loo, B. R. Y., Liu, S., Koh, H. L., Poh, X. W. W., Fung, D. S. S., Guan, C., Lee, T.-S., et al. (2018) · NeuroImage Clinical · doi:10.1016/j.nicl.2018.11.010 · Cited by 100
“Abnormalities in brain network maturation play a significant role in ADHD (5, 18).”
InfluentialProcess-based framework for precise neuromodulation
Lubianiker, N., Goldway, N., Fruchtman-Steinbok, T., Paret, C., Keynan, J. N., Singer, N., Cohen, A., Kadosh, K. C., Linden, D. E. J., & Hendler, T. (2019) · Nature Human Behaviour · doi:10.1038/s41562-019-0573-y · Cited by 88
Self-citationNeural Markers of Resilience in Adolescent Females at Familial Risk for Major Depressive Disorder
Fischer, A. S., Camacho, M. C., Ho, T. C., Whitfield, S., & Gotlib, I. H. (2018) · JAMA Psychiatry · doi:10.1001/jamapsychiatry.2017.4516 · Cited by 98
Developmental imaging genetics: Linking dopamine function to adolescent behavior
Padmanabhan, A., & Luna, B. (2014) · Brain and Cognition · doi:10.1016/j.bandc.2013.09.011 · Cited by 87
Mavigner, M., Raper, J., Kovacs-Balint, Z., Gumber, S., O’Neal, J. T., Bhaumik, S. K., Zhang, X., Habib, J. G., Mattingly, C., McDonald, C. E., et al. (2018) · Science Translational Medicine · doi:10.1126/scitranslmed.aao6975 · Cited by 96
Self-citationAnomalous network architecture of the resting brain in children who stutter
Chang, S., Angstadt, M., Chow, H. M., Etchell, A. C., Garnett, E. O., Choo, A. L., Kessler, D. A., Welsh, R. C., & Sripada, C. (2017) · Journal of Fluency Disorders · doi:10.1016/j.jfludis.2017.01.002 · Cited by 143
Buzzell, G. A., Richards, J. E., White, L. K., Barker, T. V., Pine, D. S., & Fox, N. A. (2017) · NeuroImage · doi:10.1016/j.neuroimage.2017.05.045 · Cited by 87
“Additionally, analyses of executive functioning development have demonstrated dramatic changes in network dynamics with increasing age (Fair et al., 2007, 2009).”
Temperament and brain networks of attention
Posner, M. I., & Rothbart, M. K. (2018) · Philosophical Transactions of the Royal Society B Biological Sciences · doi:10.1098/rstb.2017.0254 · Cited by 99
Horowitz‐Kraus, T., Toro‐Serey, C., & DiFrancesco, M. W. (2015) · PLoS ONE · doi:10.1371/journal.pone.0133762 · Cited by 95
“MNI coordinates were modeled (after [22] and have been described previously ([64, 65].”
MethodFunctional embedding predicts the variability of neural activity
Mišić, B. (2011) · Frontiers in Systems Neuroscience · doi:10.3389/fnsys.2011.00090 · Cited by 86
“This may reflect intensified global integration relative to local segregation and a gradual shift from local, clustered information processing in children to distributed processing in adults (Fair et al., 2009; Supekar et al., 2009; Hagmann et al., 2010).”
BackgroundReliability correction for functional connectivity: Theory and implementation
Mueller, S., Wang, D., Fox, M., Pan, R., Lu, J., Li, K., Sun, W., Buckner, R. L., & Liu, H. (2015) · Human Brain Mapping · doi:10.1002/hbm.22947 · Cited by 99
“…2007; Andrews-Hanna et al., 2010; Buckner et al., 2008; Liu et al., 2008; Sanz-Arigita et al., 2010; Stam et al., 2007; Supekar et al., 2008], and the local and distant connectivity that are often examined when studying neural development [Fair et al., 2009] and aging [Rowe et al., 2006].”
BackgroundDivergent brain functional network alterations in dementia with Lewy bodies and Alzheimer's disease
Peraza, L. R., Taylor, J.-P., & Kaiser, M. (2015) · Neurobiology of Aging · doi:10.1016/j.neurobiolaging.2015.05.015 · Cited by 84
“…na t33 ¼ 1.10, p ¼ 0.277c 0.0 0.0f na t33 ¼ 3.81, p < 0.001c G, Cambridge Cognitive Examination; DLB, dementia with Lewy bodies; HC, healthy ric Inventory; UPDRS, Unified Parkinson’s Disease Rating Scale. among cortical regions tends to arrange in communities (Fair et al., 2009; Newman, 2006b).”
BackgroundInfluentialFunctional network alterations and their structural substrate in drug-resistant epilepsy
Caciagli, L., Bernhardt, B. C., Hong, S., Bernasconi, A., & Bernasconi, N. (2014) · Frontiers in Neuroscience · doi:10.3389/fnins.2014.00411 · Cited by 94
“It is tempting to interpret these findings in light of the fine-tuning in global network properties taking place during brain maturation (Fair et al., 2009; Dosenbach et al., 2010), which could account for shifts in brain topology across lifespan.”
BackgroundEarly life stress is associated with default system integrity and emotionality during infancy
Graham, A. M., Pfeifer, J. H., Fisher, P. A., Carpenter, S., & Fair, D. A. (2015) · Journal of Child Psychology and Psychiatry · doi:10.1111/jcpp.12409 · Cited by 84
“, 2005), and used in work documenting the developmental trajectory of the DMN from childhood to adulthood (Fair et al., 2009).”
InfluentialSelf-citationFunctional network architecture of reading-related regions across development
Vogel, A. C., Church, J. A., Power, J. D., Miezin, F. M., Petersen, S. E., & Schlaggar, B. L. (2013) · Brain and Language · doi:10.1016/j.bandl.2012.12.016 · Cited by 84
Self-citationSex differences in network controllability as a predictor of executive function in youth
Cornblath, E. J., Tang, E., Baum, G. L., Moore, T. M., Adebimpe, A., Roalf, D. R., Gur, R. C., Gur, R. E., Pasqualetti, F., Satterthwaite, T. D., et al. (2018) · NeuroImage · doi:10.1016/j.neuroimage.2018.11.048 · Cited by 91
“…studies highlight the fact that suchmaturation, and sex differences in that maturation, span structure (Gogtay et al., 2004), anatomical connectivity (Baum et al., 2017), activity (Schmithorst et al., 2015; Nomi et al., 2017; Keulers et al., 2011), and functional connectivity (Fair et al., 2009).”
BackgroundBittersweet: The Neuroscience of Ambivalent Affect
Vaccaro, A. G., Kaplan, J., & Damásio, A. R. (2020) · Perspectives on Psychological Science · doi:10.1177/1745691620927708 · Cited by 89
“broader central executive and salience networks (Fair et al., 2009).”
Maturation trajectories of cortical resting-state networks depend on the mediating frequency band
Khan, S., Hashmi, J. A., Mamashli, F., Michmizos, K. P., Kitzbichler, M. G., Bharadwaj, H., Bekhti, Y., Ganesan, S., Garel, K.-L. A., Whitfield, S., et al. (2018) · NeuroImage · doi:10.1016/j.neuroimage.2018.02.018 · Cited by 99
“Furthermore, contrary to prior suggestions from fMRI based studies (Fair et al., 2009; Hwang et al., 2013), we found that the small world property, which assesses the overall balance of the network in optimizing local versus distant connections, did not remain constant through this age range, and similarly, network re…”
Fu, X., & Pérez‐Edgar, K. E. (2018) · Developmental Review · doi:10.1016/j.dr.2018.11.002 · Cited by 96
“As the executive attention network becomes more integrated and efficient over childhood (Fair et al., 2009; Gao et al., 2009), it plays a more influential role in top-down regulatory control of attention and behavior (Posner et al.”
Decision-making ability, psychopathology, and brain connectivity
Moutoussis, M., Garzón, B., Neufeld, S., Bach, D. R., Rigoli, F., Goodyer, I. M., Bullmore, E. T., Fonagy, P., Jones, P. B., Hauser, T. U., et al. (2021) · Neuron · doi:10.1016/j.neuron.2021.04.019 · Cited by 95
Lydon‐Staley, D. M., Ćirić, R., Satterthwaite, T. D., & Bassett, D. S. (2018) · Network Neuroscience · doi:10.1162/netn_a_00071 · Cited by 90
Oscillations, networks, and their development: MEG connectivity changes with age
Schäfer, C. B., Morgan, B. R., Ye, A. X., Taylor, M. J., & Doesburg, S. M. (2014) · Human Brain Mapping · doi:10.1002/hbm.22547 · Cited by 82
“…can be viewed in the online issue, which is available at wileyonlinelibrary.com.] r 5257 r network connectivity during childhood and adolescence [Dosenbach et al., 2010; Fair et al., 2009] by providing evidence of how neuromagnetic interactions at physiologically relevant rates mature within RSNs.”
BackgroundMethodInfluentialBiophoton signal transmission and processing in the brain
Tang, R., & Dai, J. (2013) · Journal of Photochemistry and Photobiology B Biology · doi:10.1016/j.jphotobiol.2013.12.008 · Cited by 90
Mehnert, J., Akhrif, A., Telkemeyer, S., Rossi, S., Schmitz, C., Steinbrink, J. M., Wartenburger, I., Obrig, H., & Neufang, S. (2012) · Brain and Development · doi:10.1016/j.braindev.2012.11.006 · Cited by 102
“org/1 anisms of network maturation: integration and segregation [10].”
BackgroundHippocampal functional connectivity and episodic memory in early childhood
Riggins, T., Geng, F., Blankenship, S. L., & Redcay, E. (2016) · Developmental Cognitive Neuroscience · doi:10.1016/j.dcn.2016.02.002 · Cited by 97
“…pruning of local connectivity and strengthening of long-range connectivity with age (see Johnson, 2001; Supekar et al., 2009; Uddin et al., 2010; for theoretical argument; Fair et al., 2009 for empirical example in humans, and Webster et al., 1991 for empirical example in non-human primates ).”
Ryali, S., Supekar, K., Chen, T., Kochalka, J., Cai, W., Nicholas, J., Padmanabhan, A., & Menon, V. (2016) · PLoS Computational Biology · doi:10.1371/journal.pcbi.1005138 · Cited by 84
Human functional connectivity: new tools, unresolved questions
Buckner, R. L. (2010) · Proceedings of the National Academy of Sciences · doi:10.1073/pnas.1005987107 · Cited by 80
Global and local brain network reorganization in attention-deficit/hyperactivity disorder
Lin, P., Sun, J., Yu, G., Wu, Y., Yang, Y., Liang, M., & Liu, X. (2013) · Brain Imaging and Behavior · doi:10.1007/s11682-013-9279-3 · Cited by 84
“Previous brain development studies have indicated that increased functional segregations in brain networks has been consistently found in adults and children (Fair et al. 2008, 2009, 2010; Power et al. 2010; Vogel et al. 2010).”
BackgroundUnschuld, P. G., Buchholz, A. S., Varvaris, M., van Zijl, P. C. M., Ross, C. A., Pekar, J. J., Hock, C., Sweeney, J. A., Tamminga, C. A., Keshavan, M. S., et al. (2014) · Schizophrenia Bulletin · doi:10.1093/schbul/sbt077 · Cited by 81
Neurocognitive networks: Findings, models, and theory
Meehan, T. P., & Bressler, S. L. (2012) · Neuroscience & Biobehavioral Reviews · doi:10.1016/j.neubiorev.2012.08.002 · Cited by 92
“Meanwhile, consistency across subjects might still be due to developmental (Fair et al., 2009) and environmental factors common to the species, as well as to species-specific anatomical connectivity.”
Bos, D. J., Oranje, B., Achterberg, M., Vlaskamp, C., Ambrosino, S., de Reus, M. A., van den Heuvel, M. P., Rombouts, S. A. R. B., & Durston, S. (2017) · Journal of Child Psychology and Psychiatry · doi:10.1111/jcpp.12712 · Cited by 89
“…of functional connectivity is thought to be characterized by both segregation and integration of brain areas into coherent and efficient networks (Fair et al., 2007, 2009; Supekar, Musen, & Menon, 2009) and seems to involve a shift from a diffuse to a more focal pattern of activation in…”
Mapping connectivity in the developing brain
Dennis, E. L., & Thompson, P. M. (2013) · International Journal of Developmental Neuroscience · doi:10.1016/j.ijdevneu.2013.05.007 · Cited by 79
“In a larger sample including the same subjects, Fair et al. (2009) found that the pattern of functional connectivity matures from being more anatomically based to being more functionally based.”
BackgroundTranslating Developmental Neuroscience to Understand Risk for Psychiatric Disorders
Meyer, H. C., & Lee, F. S. (2019) · American Journal of Psychiatry · doi:10.1176/appi.ajp.2019.19010091 · Cited by 79
Default mode network connectivity in children with a history of preschool onset depression
Gaffrey, M. S., Luby, J. L., Botteron, K., Repovš, G., & Barch, D. M. (2012) · Journal of Child Psychology and Psychiatry · doi:10.1111/j.1469-7610.2012.02552.x · Cited by 78
“…a developmental ‘curve’ where connections between anatomically close regions weaken and more distal connections gain in strength, eventuating in a distributed (i.e., across the brain) and cohesive interconnected DMN that stabilizes in adulthood (Dosenbach et al., 2010; Fair et al., 2009).”
BackgroundResultInfluentialAdolescent brain development and contextual influences: a decade in review
Galván, A. (2021) · Journal of Research on Adolescence · doi:10.1111/jora.12687 · Cited by 77
Solomon, M., Yoon, J. H., Ragland, J. D., Niendam, T. A., Lesh, T. A., Fairbrother, W., & Carter, C. S. (2014) · Biological Psychiatry · doi:10.1016/j.biopsych.2013.08.036 · Cited by 78
Common and distinct brain networks underlying panic and social anxiety disorders
Kim, Y.-K., & Yoon, H.-K. (2018) · Progress in Neuro-Psychopharmacology and Biological Psychiatry · doi:10.1016/j.pnpbp.2017.06.017 · Cited by 78
“Graph-based analysis also provides a distinct alternative to seed-based analyses and ICA (Fair et al., 2009; Salvador et al., 2005; van den Heuvel et al., 2008).”
Altered structural connectivity in ADHD: a network based analysis
Beare, R. J., Adamson, C. L., Bellgrove, M. A., Vilgis, V., Vance, A. L. A., Seal, M. L., & Silk, T. J. (2016) · Brain Imaging and Behavior · doi:10.1007/s11682-016-9559-9 · Cited by 88
The Hierarchical Structure of the Face Network Revealed by Its Functional Connectivity Pattern
Wang, X., Zhen, Z., Song, Y., Huang, L., Kong, X., & Liu, J. (2016) · Journal of Neuroscience · doi:10.1523/jneurosci.2789-15.2016 · Cited by 81
Traveling Slow Oscillations During Sleep: A Marker of Brain Connectivity in Childhood
Kurth, S., Riedner, B. A., Dean, D., O’Muircheartaigh, J., Huber, R., Jenni, O. G., Deoni, S., & LeBourgeois, M. K. (2017) · SLEEP · doi:10.1093/sleep/zsx121 · Cited by 85
Adolescent sleep and the foundations of prefrontal cortical development and dysfunction
Anastasiades, P. G., de Vivo, L., Bellesi, M., & Jones, M. W. (2022) · Progress in Neurobiology · doi:10.1016/j.pneurobio.2022.102338 · Cited by 93
“Across adolescence, the DMN and FPN transition to support greater long-range integration at the expense of local connections (Fair et al., 2009).”
Brent, B. K., Seidman, L. J., Thermenos, H. W., Holt, D. J., & Keshavan, M. S. (2014) · Schizophrenia Research · doi:10.1016/j.schres.2013.07.038 · Cited by 76
“Resting-state fMRI studies in children and adolescents initially reported that inter-hemispheric (“short-range”) connectivity appeared to decrease, while anterior-posterior (“long-range”) connectivity increased over the course of adolescence (Fair et al., 2009).”
BackgroundGraph theoretical analysis of developmental patterns of the white matter network
Chen, Z., Liu, M., Gross, D. W., & Beaulieu, C. (2013) · Frontiers in Human Neuroscience · doi:10.3389/fnhum.2013.00716 · Cited by 77
The use of functional and effective connectivity techniques to understand the developing brain
Goldenberg, D., & Galván, A. (2015) · Developmental Cognitive Neuroscience · doi:10.1016/j.dcn.2015.01.011 · Cited by 84
A precision functional atlas of personalized network topography and probabilities
Hermosillo, R. J. M., Moore, L. A., Feczko, E., Miranda-Domínguez, Ó., Pines, A. R., Dworetsky, A., Conan, G. M., Mooney, M. A., Randolph, A., Graham, A. M., et al. (2024) · Nature Neuroscience · doi:10.1038/s41593-024-01596-5 · Cited by 110
“Using participants from the HCP-D dataset, we calculated probabilistic maps for 2-year age bins (8–9, 10–11, 12–13, 14–15, 16–17, 18–19, 20–21 (Fig.”
BackgroundMethodSelf-citationLuo, A. C., Sydnor, V. J., Pines, A. R., Larsen, B., Alexander‐Bloch, A. F., Cieslak, M., Covitz, S. C., Chen, A. A., Esper, N. B., Feczko, E., et al. (2024) · Nature Communications · doi:10.1038/s41467-024-47748-w · Cited by 115
“While prominent earlier work has suggested that long-range connectivity strengthens and short-range connectivity weakens in development 47 , this was later shown to be largely driven by motion artifact 48,49 .”
Self-citationRudolph, M. D., Miranda-Domínguez, O., Cohen, A. O., Breiner, K., Steinberg, L., Bonnie, R. J., Scott, E. S., Taylor-Thompson, K., Chein, J., Fettich, K. C., et al. (2017) · Developmental Cognitive Neuroscience · doi:10.1016/j.dcn.2017.01.010 · Cited by 76
Self-citationCai, L., Dong, Q., & Niu, H. (2018) · Developmental Cognitive Neuroscience · doi:10.1016/j.dcn.2018.03.003 · Cited by 80
“To date, almost all extant literature focusing on topological developmental changes in functional networks has been performed over a relatively broad age range (Cao et al., 2014; Fair et al., 2009; Supekar et al., 2009; Wu et al., 2013).”
InfluentialAltered Intrinsic Functional Brain Architecture in Children at Familial Risk of Major Depression
Chai, X. J., Hirshfeld-Becker, D., Biederman, J., Uchida, M., Doehrmann, O., Leonard, J. A., Salvatore, J., Kenworthy, T., Brown, A., Kagan, E., et al. (2016) · Biological Psychiatry · doi:10.1016/j.biopsych.2015.12.003 · Cited by 75
“The DMN and DLPFC seeds were defined as 6-mm spheres around peak coordinates from (43).”
Richmond, S., Johnson, K. A., Seal, M. L., Allen, N. B., & Whittle, S. (2016) · Neuroscience & Biobehavioral Reviews · doi:10.1016/j.neubiorev.2016.08.024 · Cited by 70
Teeuw, J., Brouwer, R. M., Guimaraes, J., Brandner, P., Koenis, M. M. G., Swagerman, S. C., Verwoert, M., Boomsma, D. I., & Pol, H. E. H. (2019) · NeuroImage · doi:10.1016/j.neuroimage.2019.116073 · Cited by 84
Modulations of functional connectivity in the healthy and schizophrenia groups during task and rest
Ma, S., Calhoun, V. D., Eichele, T., Du, W., & Adalı, T. (2012) · NeuroImage · doi:10.1016/j.neuroimage.2012.05.048 · Cited by 75
“In addition, further investigation of the age effect to the graph-theoretical analysis is needed to supply more information since previous studies suggested a dynamic development trend of brain functional connectivity over age (Dosenbach et al., 2010; Fair et al., 2009).”
Disrupted resting‐state functional connectivity and its changing trend in migraine suffers
Liu, J., Zhao, L., Lei, F., Zhang, Y., Yuan, K., Gong, Q., Liang, F., & Tian, J. (2015) · Human Brain Mapping · doi:10.1002/hbm.22744 · Cited by 80
“…organization of multiple functional networks shifts from a local anatomical emphasis in children to a more “distributed” architecture in young adults [Fair et al., 2009], which may reflect a learning mechanism on how environmental processes are altered in using more widely distributed processing…”
BackgroundBasic Units of Inter-Individual Variation in Resting State Connectomes
Sripada, C., Angstadt, M., Rutherford, S. E., Kessler, D. A., Kim, Y., Yee, M. A., & Levina, E. (2019) · Scientific Reports · doi:10.1038/s41598-018-38406-5 · Cited by 89
Changes in global and regional modularity associated with increasing working memory load
Stanley, M. L., Dagenbach, D., Lyday, R. G., Burdette, J. H., & Laurienti, P. J. (2014) · Frontiers in Human Neuroscience · doi:10.3389/fnhum.2014.00954 · Cited by 79
Default mode network connectivity and reciprocal social behavior in 22q11.2 deletion syndrome
Schreiner, M. J., Karlsgodt, K. H., Uddin, L. Q., Chow, C., Congdon, E., Jalbrzikowski, M., & Bearden, C. E. (2014) · Social Cognitive and Affective Neuroscience · doi:10.1093/scan/nst114 · Cited by 74
“, 2010), we investigated age effects on DMN connectivity, with the hypothesis that 22q11DS patients would fail to show the typical developmental pattern of ‘local to distributed’ organization with increasing age (Fair et al., 2009).”
BackgroundSleep quality and adolescent default mode network connectivity
Tashjian, S. M., Goldenberg, D., Monti, M. M., & Galván, A. (2018) · Social Cognitive and Affective Neuroscience · doi:10.1093/scan/nsy009 · Cited by 80
“…functional connectivity becomes more integrated as correlations among network nodes strengthen (Fair et al., 2008) and this intra-network integration is accompanied by inter-network segregation, both of which have important implications for the development of complex cognition (Fair et al., 2009).”
BackgroundResultDevelopmental Maturation of the Precuneus as a Functional Core of the Default Mode Network
Li, R., Utevsky, A. V., Huettel, S. A., Braams, B. R., Peters, S., Crone, E. A., & van Duijvenvoorde, A. C. K. (2019) · Journal of Cognitive Neuroscience · doi:10.1162/jocn_a_01426 · Cited by 85
Abnormal structural and functional brain connectivity in gray matter heterotopia
Christodoulou, J. A., Walker, L. M., Tufo, S. N. D., Katzir, T., Gabrieli, J. D. E., Whitfield, S., & Chang, B. S. (2012) · Epilepsia · doi:10.1111/j.1528-1167.2012.03466.x · Cited by 75
“Pinard JM, Feydy A, Carlier R, Perez N, Pierot L, Burnod Y. (2000) Functional MRI in double cortex: functionality of heterotopia.”
BackgroundMethodInfluential
Metadata
- Authors
- Fair, D. A., Cohen, A. L., Power, J. D., Dosenbach, N. U. F., Church, J. A., Miezin, F. M., Schlaggar, B. L., & Petersen, S. E.
- Affiliations
- Oregon Health & Science University (US)
- Washington University in St. Louis (US)
- Corresponding author
- Fair, Damien A.
- Petersen, Steven E.
- ORCID
- Venue
- PLoS Computational Biology
- Publisher
- Public Library of Science (PLoS)
- Published
- 2009-05-01
- Volume
- 5
- Issue
- 5
- Pages
- e1000381
- ISSN
- 1553-734X (ISSN-L)
- 1553-7358
- PMC
- PMC2671306
- OpenAlex
- W2159549823
- Cited by
- 1,530
- References
- 104
- Citations by year
- 2026: 69 · 2025: 78 · 2024: 89 · 2023: 66 · 2022: 87 · 2021: 78 · 2020: 86 · 2019: 103 · 2018: 109 · 2017: 95 · 2016: 102 · 2015: 107 · 2014: 106 · 2013: 113 · 2012: 84
- FWCI
- 39.01
- Type
- journal article
- Language
- en
- Open access
- gold
- doi.org
- Locations
- PLoS Computational Biology (publishedVersion, cc-by)
- PubMed Central (publishedVersion, cc-by)
- PubMed (publishedVersion)
- Digital Commons@Becker (Washington University School of Medicine) (submittedVersion)
- RePEc: Research Papers in Economics (submittedVersion)
- DOAJ (DOAJ: Directory of Open Access Journals) (submittedVersion, cc-by-sa)
- Figshare (submittedVersion, cc-by)
- Funders
- National Science Foundation (0548890)
- Dana Foundation
- Wellcome Trust
- National Institutes of Health
- National Institute of Neurological Disorders and Stroke (R01NS046424, K02NS053425, F30NS062489, NS46424, NS 41255, NS062489, R21NS041255, NS053425)
- Topics
- Life Sciences › Neuroscience › Cognitive Neuroscience › Functional Brain Connectivity Studies
- Health Sciences › Medicine › Radiology, Nuclear Medicine and Imaging › Advanced Neuroimaging Techniques and Applications
- Physical Sciences › Physics and Astronomy › Statistical and Nonlinear Physics › Complex Network Analysis Techniques
- Keywords
- functional brain networks, brain development, resting-state functional connectivity, integration and segregation, community detection, small-world networks, graph theory, children and young adults, modularity optimization, cognitive development
- MeSH terms
- Adolescent, Adult, Brain, Child, Humans, Magnetic Resonance Imaging, Models, Neurological, Nerve Net, Neural Pathways
About these checks
Registry, retraction, Cites and statistics results are computed, not judged, with one exception: a printed reference that no index lists is read once by a model before it counts as a citation error. Claims are extracted by a model and kept only when their quote appears verbatim in the text; each cited source is then checked, with a model’s help, for whether it says what the claim relies on. Those verdicts can be wrong — read the claim’s quote and the cited source before relying on one.
Statistics and arithmetic are recomputed, not judged.
Confidence bands are shown only for fields calibrated on our annotated test set. None is calibrated yet, so no band is shown.
What counts as a claim ›How we measure confidence ›How we check this ›
Are you an author, or do you see a problem with this page? Request a review
Data sources
Bibliographic data: Semantic Scholar, OpenAlex, Crossref.
Contains information from the Semantic Scholar Academic Graph Datasets, made available under the ODC Attribution License (ODC-BY 1.0).
Semantic Scholar’s data is described in: Kinney, R., et al. (2023). The Semantic Scholar Open Data Platform. arXiv:2301.10140.
