

The DOI matches its Crossref record; 77 of the 77 references it cites were found in a registry or an index.
Antigen-Specific Adaptive Immunity to SARS-CoV-2 in Acute COVID-19 and Associations with Age and Disease Severity
Open accessAbstract
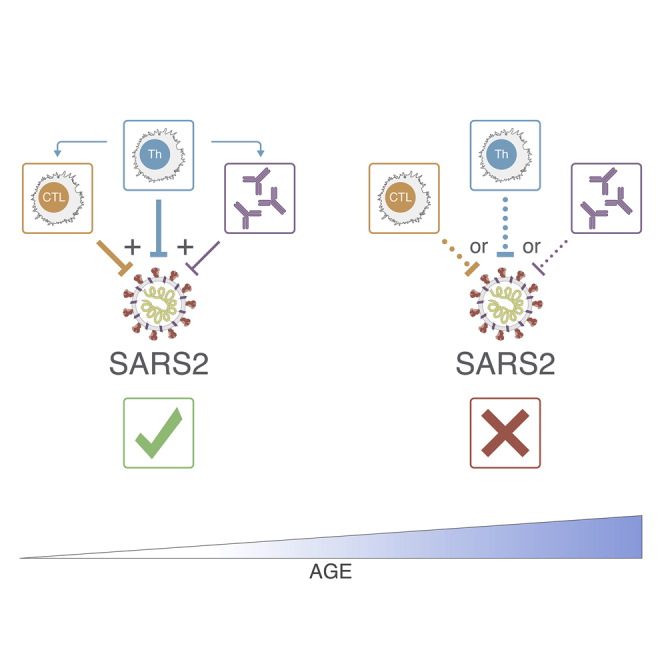
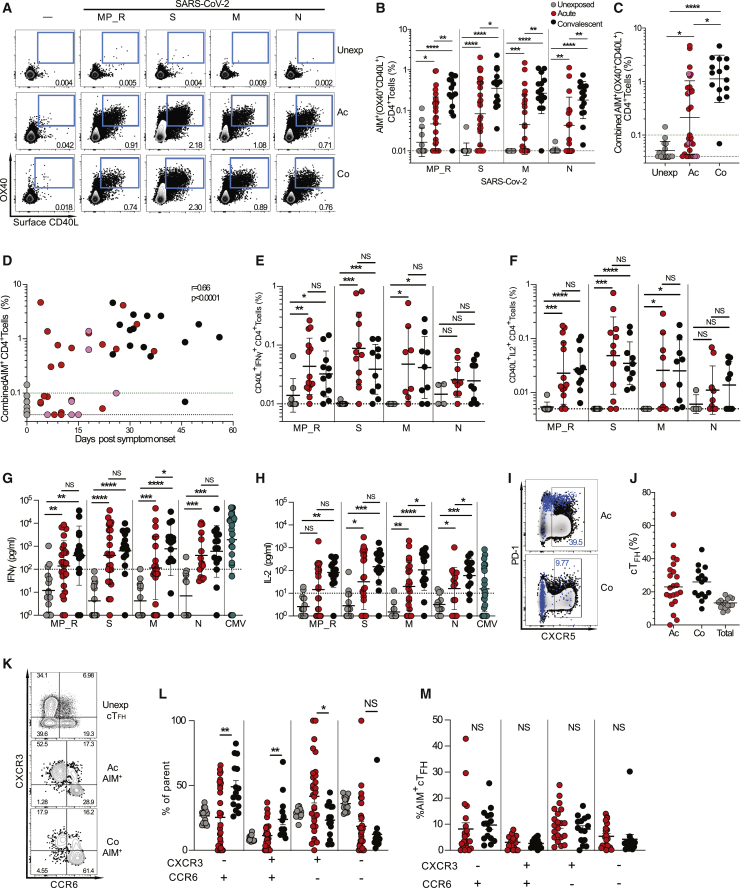
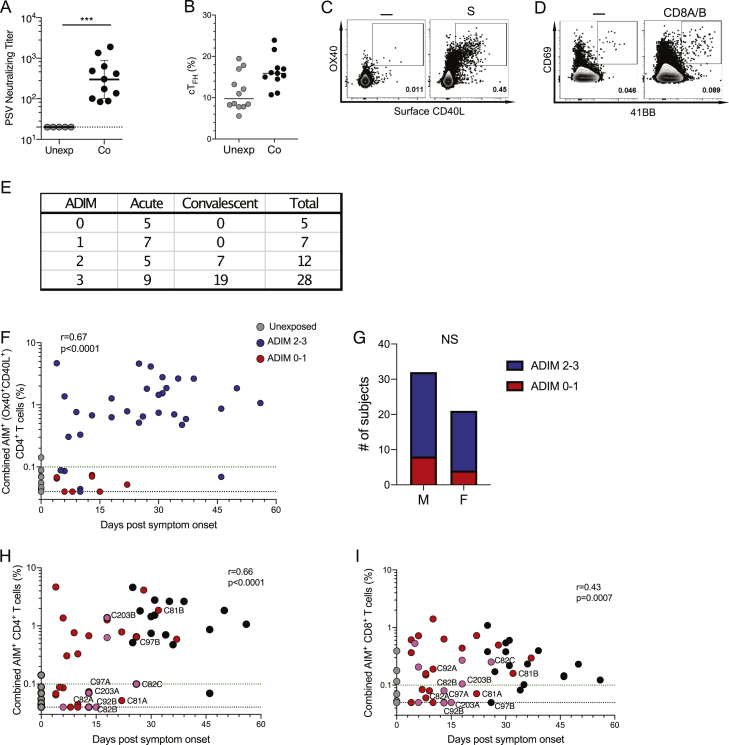
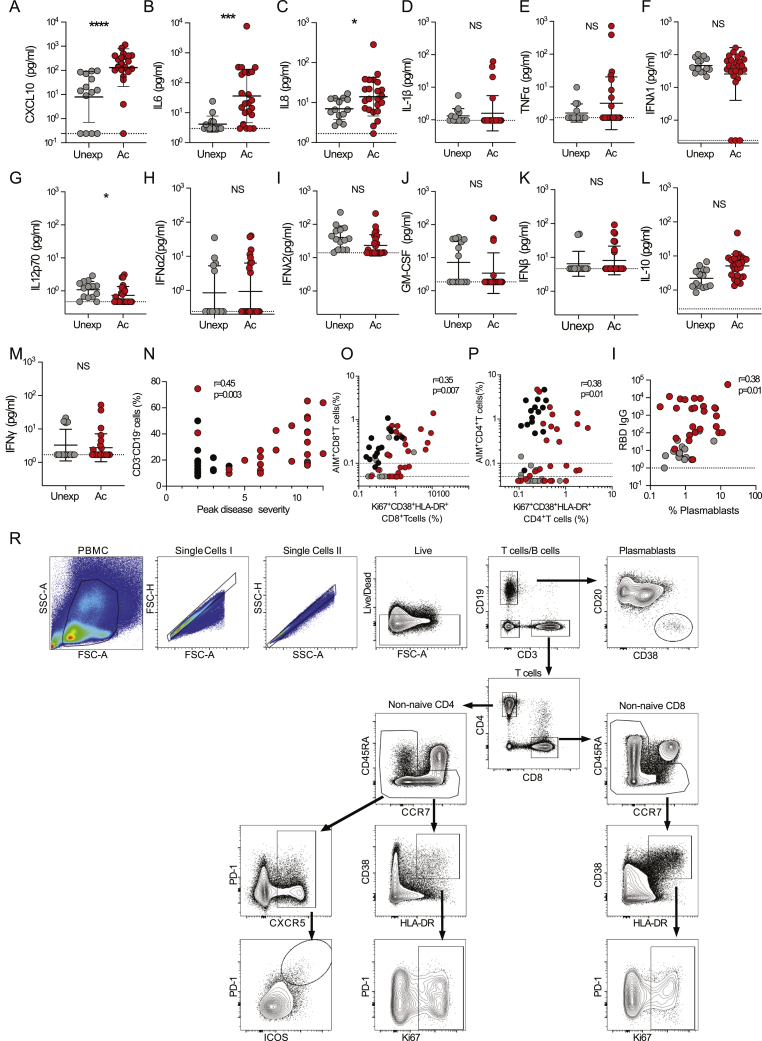
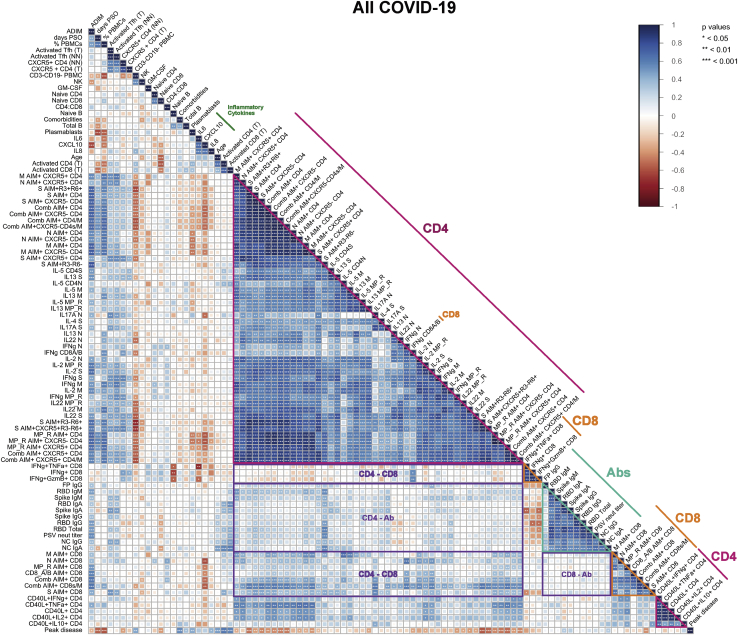
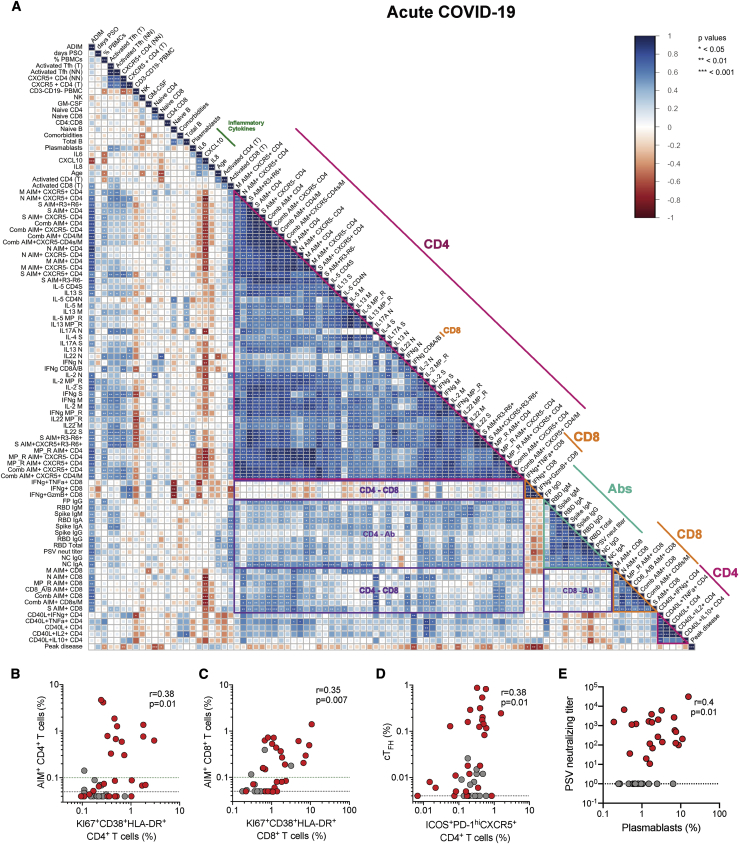
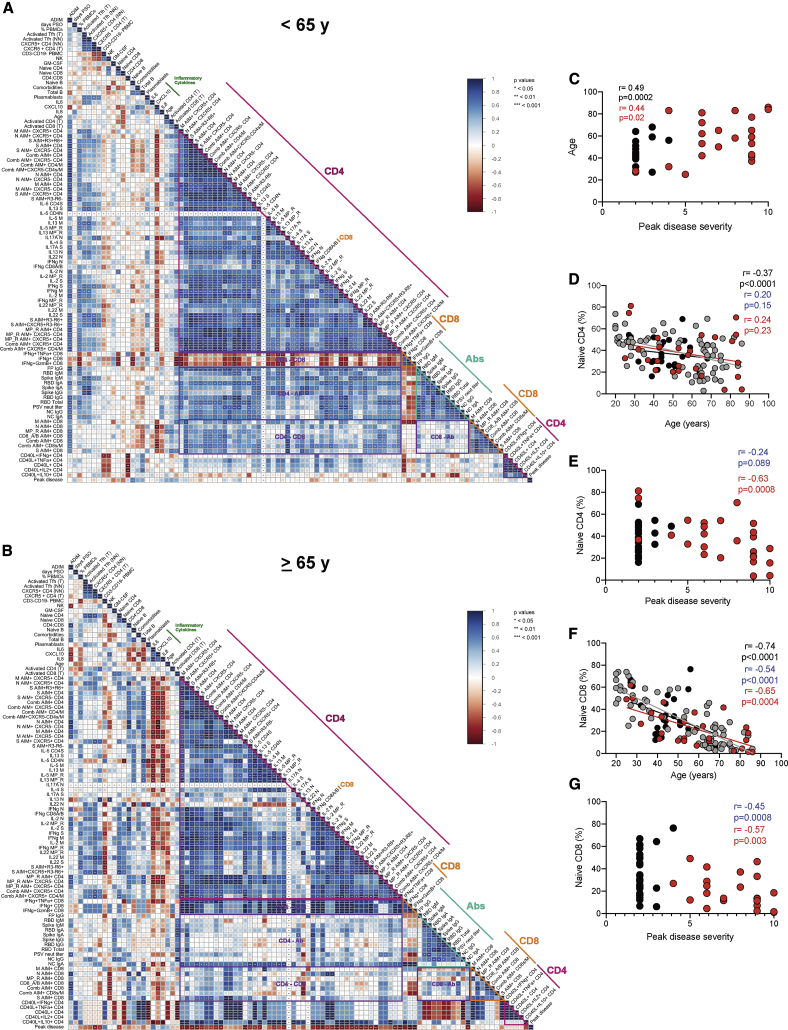
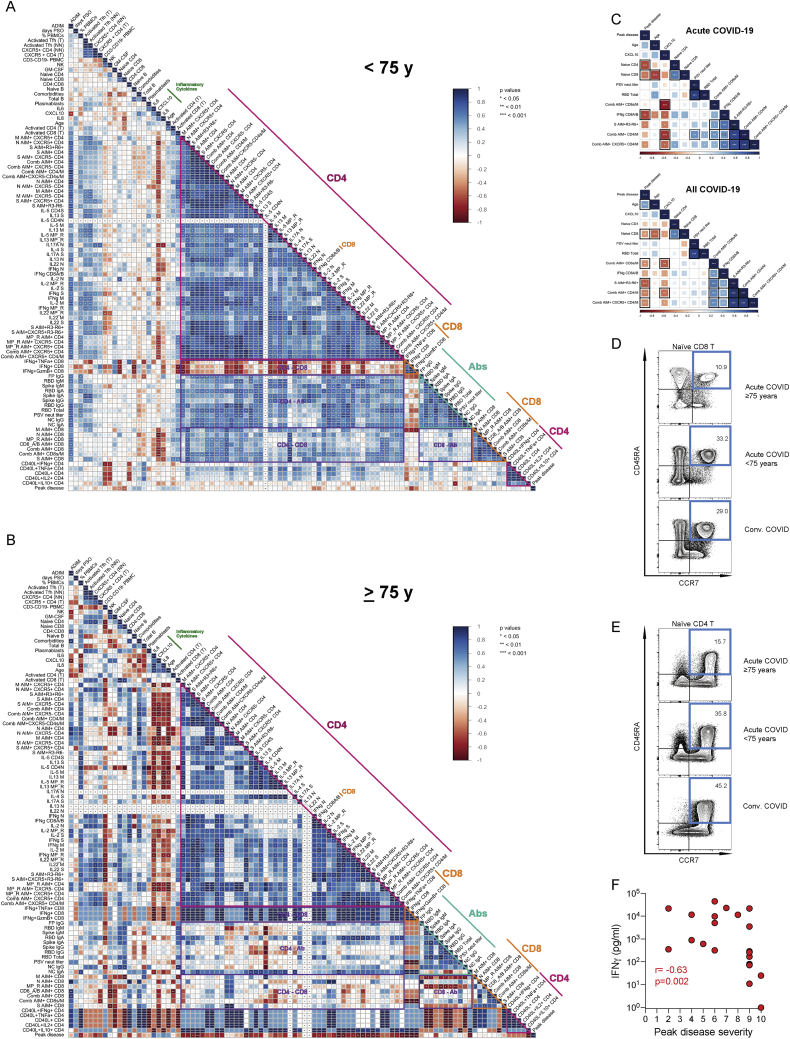
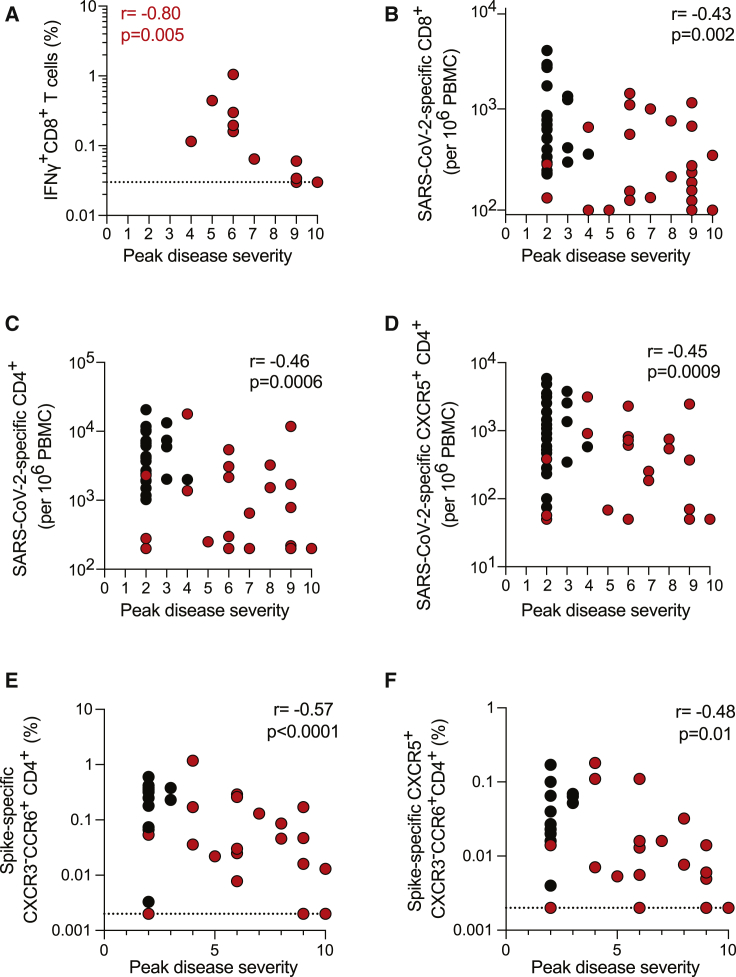
Limited knowledge is available on the relationship between antigen-specific immune responses and COVID-19 disease severity. We completed a combined examination of all three branches of adaptive immunity at the level of SARS-CoV-2-specific CD4 + and CD8 + T cell and neutralizing antibody responses in acute and convalescent subjects. SARS-CoV-2-specific CD4 + and CD8 + T cells were each associated with milder disease. Coordinated SARS-CoV-2-specific adaptive immune responses were associated with milder disease, suggesting roles for both CD4 + and CD8 + T cells in protective immunity in COVID-19. Notably, coordination of SARS-CoV-2 antigen-specific responses was disrupted in individuals ≥ 65 years old. Scarcity of naive T cells was also associated with aging and poor disease outcomes. A parsimonious explanation is that coordinated CD4 + T cell, CD8 + T cell, and antibody responses are protective, but uncoordinated responses frequently fail to control disease, with a connection between aging and impaired adaptive immune responses to SARS-CoV-2.
Overview
The claims and statistics of this paper haven’t been checked yet.
Run the check — free, no account needed. It reads the open-access text and checks the sources it cites.
Integrity signals
Registry
Cites
Statistics
Figures
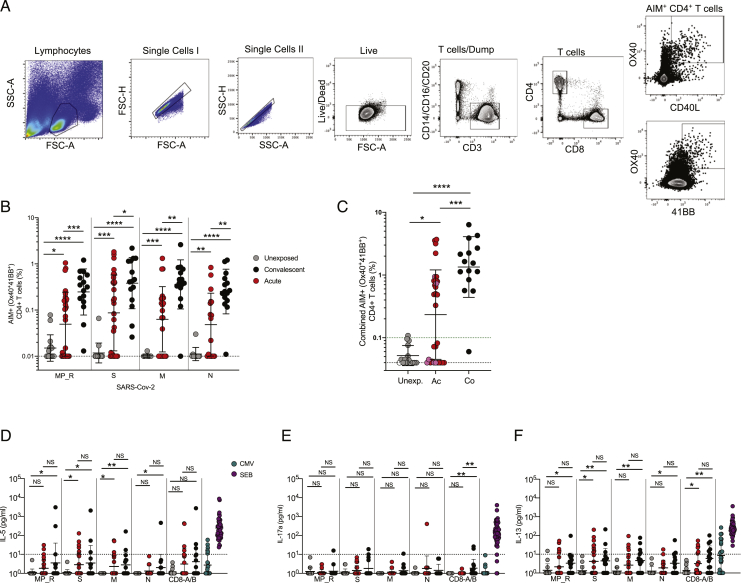
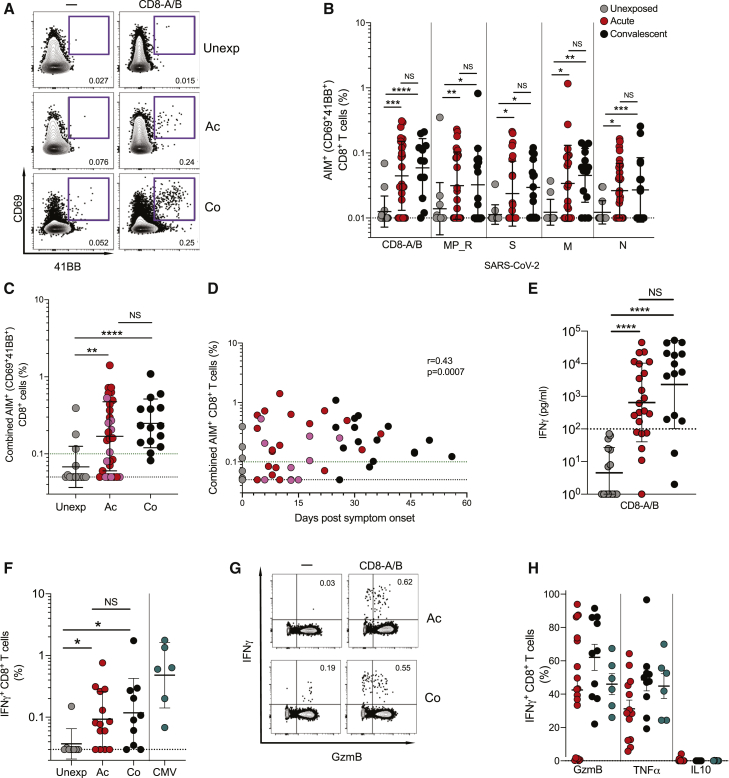
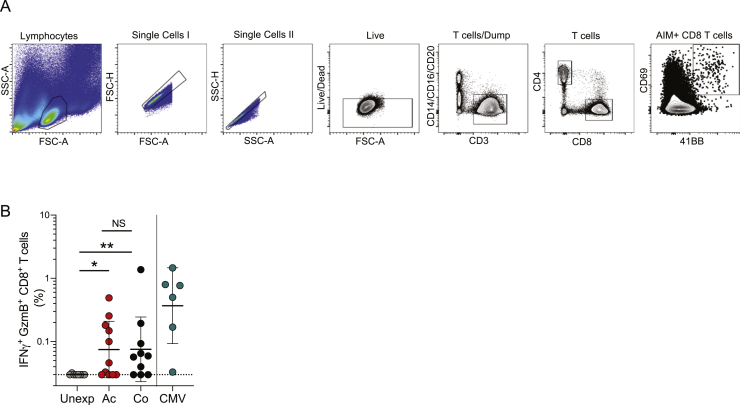
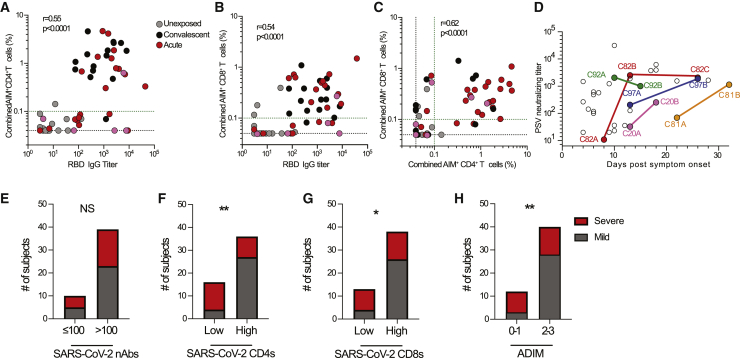
Verification
Claims the paper makes
The claims and statistics of this paper haven’t been checked yet.
Run the check — free, no account needed. It reads the open-access text and checks the sources it cites.
Claims other papers make about this one
Each is checked against this paper’s own text: does it say what the citing paper says it does?
The source backs part of the claim, not all of it — or backs it for a different population, condition or comparison.
In the citing paper
“SARS-CoV-2 infection elicits a Th1 CD4+ T cell response, with IFNγ and IL-2 being the primary cytokines produced by these cells and some TNFα production as well112,126-129.”
From SARS-CoV-2, COVID-19 and the aging immune system (2021) · cites this paper as [126]
Experimental — accuracy not yet measuredThe cited source says what the claim attributes to it.
In the citing paper
“Several lines of evidence suggest that CD4+ and CD8+ T cell responses play important roles in the resolution of SARS-CoV-2 infection and COVID-19,33 including modulating disease severity in humans34,35 and reducing viral loads in non-human primates.36”
From Impact of SARS-CoV-2 variants on the total CD4+ and CD8+ T cell reactivity in infected or vaccinated individuals (2021) · cites this paper as [34]
The cited source says what the claim attributes to it.
In the citing paper
“suggesting a link between individual patient predisposition with respect to age and comorbidity [127, 128].”
From Guidelines for the use of flow cytometry and cell sorting in immunological studies (third edition) (2021) · cites this paper as [128]
In the citing paper
“there is some evidence linking robust T cell responses to mild disease outcome31.”
From Prospects for durable immune control of SARS-CoV-2 and prevention of reinfection (2021) · cites this paper as [31]
In the citing paper
“Studies of acute and convalescent COVID-19 patients have observed that SARS-CoV-2-specific T cell responses are significantly associated with milder disease (Liao et al., 2020; Rydyznski Moderbacher et al., 2020; Sekine et al., 2020; Zhou et al., 2020b), suggesting that T cell responses may be important for control and resolution of a primary SARS-CoV-2 infection.”
From Adaptive immunity to SARS-CoV-2 and COVID-19 (2021) · cites this paper as Rydyznski Moderbacher et al., 2020
In the citing paper
“In contrast, the strikingly extended absence of SARS-CoV-2-specific CD4+ T cells was associated with severe or fatal COVID-19 (>day 22 PSO in some cases) (Braun et al., 2020; Rydyznski Moderbacher et al., 2020; Tan et al., 2020a).”
From Adaptive immunity to SARS-CoV-2 and COVID-19 (2021) · cites this paper as Rydyznski Moderbacher et al., 2020
In the citing paper
“Notably, SARS-CoV-2-specific CD4+ T cells had the strongest association with lessened COVID-19 disease severity, compared with antibodies and CD8+ T cells (Rydyznski Moderbacher et al., 2020).”
From Adaptive immunity to SARS-CoV-2 and COVID-19 (2021) · cites this paper as Rydyznski Moderbacher et al., 2020
In the citing paper
“In contrast, IL-22, which can also be made by mucosal CD4+ T cells, appears to be robustly expressed by SARS-CoV-2-specific CD4+ T cells (Grifoni et al., 2020; Rydyznski Moderbacher et al., 2020; Weiskopf et al., 2020).”
From Adaptive immunity to SARS-CoV-2 and COVID-19 (2021) · cites this paper as Rydyznski Moderbacher et al., 2020
In the citing paper
“T cell responses are detected after almost all SARS-CoV-2 infections (Grifoni et al., 2020; Rydyznski Moderbacher et al., 2020; Peng et al., 2020; Sekine et al., 2020).”
From Adaptive immunity to SARS-CoV-2 and COVID-19 (2021) · cites this paper as Rydyznski Moderbacher et al., 2020
In the citing paper
“CD4+ T cell responses to SARS-CoV-2 are more prominent than CD8+ T cell responses (Grifoni et al., 2020; Sekine et al., 2020) and have been associated with control of primary SARS-CoV-2 infection (Rydyznski Moderbacher et al., 2020).”
From Adaptive immunity to SARS-CoV-2 and COVID-19 (2021) · cites this paper as Rydyznski Moderbacher et al., 2020
In the citing paper
“Overall, circulating SARS-CoV-2-specific CD8+ T cells are less consistently observed than CD4+ T cells (Grifoni et al., 2020; Rydyznski Moderbacher et al., 2020; Sekine et al., 2020).”
From Adaptive immunity to SARS-CoV-2 and COVID-19 (2021) · cites this paper as Rydyznski Moderbacher et al., 2020
In the citing paper
“Although neutralizing antibody titers have not correlated with reduced COVID-19 severity (Dan et al., 2021; Piccoli et al., 2020; Robbiani et al., 2020), SARS-CoV-2 cTfh cell frequencies have been associated with reduced disease severity (Rydyznski Moderbacher et al., 2020).”
From Adaptive immunity to SARS-CoV-2 and COVID-19 (2021) · cites this paper as Rydyznski Moderbacher et al., 2020
In the citing paper
“In SARS-CoV-2 infections, the presence of virus-specific CD8+ T cells has been associated with better COVID-19 outcomes (Rydyznski Moderbacher et al., 2020; Peng et al., 2020).”
From Adaptive immunity to SARS-CoV-2 and COVID-19 (2021) · cites this paper as Rydyznski Moderbacher et al., 2020
In the citing paper
“The dominant cytokine produced by SARS-CoV-2-specific CD4+ T cells from COVID-19 patients is IFNγ (Braun et al., 2020; Grifoni et al., 2020; Rydyznski Moderbacher et al., 2020; Weiskopf et al., 2020), with a clear IFNγ, tumor necrosis factor (TNF), IL-2 protein signature of canonical Th1 cells (Braun et al., 2020; Rydyznski Moderbacher et al., 2020; Peng et al., 2020; Sekine et al., 2020).”
From Adaptive immunity to SARS-CoV-2 and COVID-19 (2021) · cites this paper as Rydyznski Moderbacher et al., 2020
In the citing paper
“SARS-CoV-2-specific CD4+ T cells can be detected as early as days 2–4 post-symptom onset (PSO) (Rydyznski Moderbacher et al., 2020; Tan et al., 2020a; Weiskopf et al., 2020).”
From Adaptive immunity to SARS-CoV-2 and COVID-19 (2021) · cites this paper as Rydyznski Moderbacher et al., 2020
In the citing paper
“The vast majority of SARS-CoV-2 infected individuals seroconvert within 5–15 days PSO, with ∼90% seroconversion by day 10 PSO (Long et al., 2020; Rydyznski Moderbacher et al., 2020; Premkumar et al., 2020; Ripperger et al., 2020; Suthar et al., 2020).”
From Adaptive immunity to SARS-CoV-2 and COVID-19 (2021) · cites this paper as Rydyznski Moderbacher et al., 2020
In the citing paper
“Last, there were initially great concerns about potential immune deviation to Th2 and immunopathogenesis (Peeples, 2020), but SARS-CoV-2-specific CD4+ T cells from patients consistently do not have Th2 characteristics (Grifoni et al., 2020; Rydyznski Moderbacher et al., 2020; Sekine et al., 2020).”
From Adaptive immunity to SARS-CoV-2 and COVID-19 (2021) · cites this paper as Rydyznski Moderbacher et al., 2020
In the citing paper
“Separately, there are multiple reports of healthy individuals successfully controlling a SARS-CoV-2 infection with little to no neutralizing (or RBD IgG) antibodies detectable post-infection, while having significant SARS-CoV-2-specific T cell memory (Rydyznski Moderbacher et al., 2020; Nelde et al., 2021; Schulien et al., 2020; Sekine et al., 2020).”
From Adaptive immunity to SARS-CoV-2 and COVID-19 (2021) · cites this paper as Rydyznski Moderbacher et al., 2020
In the citing paper
“There is an ∼1,000-fold range in the magnitude of antibody responses to SARS-CoV-2, as well as heterogeneity in the magnitude of SARS-CoV-2-specific CD4+ T cell and CD8+ T cell responses (Grifoni et al., 2020; Rydyznski Moderbacher et al., 2020).”
From Adaptive immunity to SARS-CoV-2 and COVID-19 (2021) · cites this paper as Rydyznski Moderbacher et al., 2020
In the citing paper
“data indicate that T cell responses are important for prevention of severe COVID-19 (Rydyznski Moderbacher et al., 2020)”
From Adaptive immunity to SARS-CoV-2 and COVID-19 (2021) · cites this paper as Rydyznski Moderbacher et al., 2020
In the citing paper
“Older individuals are less likely to make a coordinated adaptive immune response to SARS-CoV-2 (Rydyznski Moderbacher et al., 2020).”
From Adaptive immunity to SARS-CoV-2 and COVID-19 (2021) · cites this paper as Rydyznski Moderbacher et al., 2020
In the citing paper
“COVID-19 disease severity was inversely correlated with the frequency of naive T cells (Mathew et al., 2020; Rydyznski Moderbacher et al., 2020).”
From Adaptive immunity to SARS-CoV-2 and COVID-19 (2021) · cites this paper as Rydyznski Moderbacher et al., 2020
In the citing paper
“it appears that one component of the risk is poor T cell responses due in part to a more limited naive T cell repertoire”
From Adaptive immunity to SARS-CoV-2 and COVID-19 (2021) · cites this paper as Rydyznski Moderbacher et al., 2020
In the citing paper
“the findings that Spike is a good target for CD4+ T cell responses, Tfh cell responses, and CD8+ T cell responses in SARS-CoV-2-infected people”
From Adaptive immunity to SARS-CoV-2 and COVID-19 (2021) · cites this paper as Rydyznski Moderbacher et al., 2020
In the citing paper
“Current evidence suggests an early, robust, and diverse T cell response directed against SARS-CoV-2 correlates with milder COVID-19 outcomes126,131,132”
From SARS-CoV-2, COVID-19 and the aging immune system (2021) · cites this paper as [126]
In the citing paper
“Adaptive responses to SARS-CoV-2 begin around one week after symptoms (Figure 2), with SARS-CoV-2 specific CD4+ and CD8+ T cells being observed as early as four days post-symptom onset126.”
From SARS-CoV-2, COVID-19 and the aging immune system (2021) · cites this paper as [126]
In the citing paper
“Low frequencies of naive T cells have also been correlated with severe COVID-19 outcomes126.”
From SARS-CoV-2, COVID-19 and the aging immune system (2021) · cites this paper as [126]
In the citing paper
“For CD8+ T cells, there are reports of diminished CD8+ cytotoxicity and cytokine production in severe cases126,132, while others report the opposite141, and still others find no differences142.”
From SARS-CoV-2, COVID-19 and the aging immune system (2021) · cites this paper as [126]
In the citing paper
“Consistent with this hypothesis, one study identified the presence of IFNγ producing CD8+ T cells during the acute stages of disease as the strongest predictor of mild COVID-19 outcomes126.”
From SARS-CoV-2, COVID-19 and the aging immune system (2021) · cites this paper as [126]
In the citing paper
“Many studies have reported a correlation between higher IgG antibody titers and severe disease, but others have seen either the opposite or no correlation between antibody production and disease severity126.”
From SARS-CoV-2, COVID-19 and the aging immune system (2021) · cites this paper as [126]
In the citing paper
“This response occurs concurrently with the detection of circulating SARS-CoV-2 specific T Follicular Helper cells, suggesting a role for T-dependent antibody production126.”
From SARS-CoV-2, COVID-19 and the aging immune system (2021) · cites this paper as [126]
In the citing paper
“Many studies have reported a correlation between higher IgG antibody titers and severe disease, but others have seen either the opposite or no correlation between antibody production and disease severity126.”
From SARS-CoV-2, COVID-19 and the aging immune system (2021) · cites this paper as [126]
In the citing paper
“In COVID-19 patients, a coordinated adaptive immunity of CD4+ T cells, CD8+ T cells, and antibody responses was correlated to milder disease, whereas an uncoordinated response frequently failed to control disease [68]”
From The dawn of mRNA vaccines: the COVID-19 case (2021) · cites this paper as [68]
Self-check
Percentages, sums and reported differences re-computed from the paper’s own numbers.
The self-check needs the paper’s full text.
Citations
Cites
Zhou, F., Yu, T., Du, R., Fan, G., Liu, Y., Liu, Z., Xiang, J., Wang, Y., Song, B., Gu, X., et al. (2020) · The Lancet · doi:10.1016/s0140-6736(20)30566-3 · Cited by 27,263
Wang, D., Hu, B., Hu, C., Zhu, F., Liu, X., Zhang, J., Wang, B., Xiang, H., Cheng, Z., Xiong, Y., et al. (2020) · JAMA · doi:10.1001/jama.2020.1585 · Cited by 20,148 · cited 2×
“…titers were associated with protection against SARS-CoV-2 in non-human primate infection and rechallenge studies (Chandra-shekar et al., 2020; Gao et al., 2020), as well as in three candidate COVID-19 vaccine studies in non-human primates (Gao et al., 2020; Wang et al., 2020c; Yu et al., 2020).”
La certeza de lo impredecible: Cultura Educación y Sociedad en tiempos de COVID19
Martínez González, M. (2020) · DSPACE System - Metalibrary (University of the Coast) · Cited by 18,463
Richardson, S., Hirsch, J. S., Narasimhan, M., Crawford, J. M., McGinn, T., Davidson, K. W., and the Northwell COVID-19 Research Consortium, Barnaby, D. P., Becker, L. B., Chelico, J. D., et al. (2020) · JAMA · doi:10.1001/jama.2020.6775 · Cited by 9,254 · cited 2×
“…increased rates of severe and fatal disease among older individuals (> 65 years old) (Docherty et al., 2020; Grasselli et al., 2020) and those with pre-existing medical conditions like cardiovascular disease, obesity, and type 2 diabetes mellitus (Docherty et al., 2020; Richardson et al., 2020).”
Remdesivir for the Treatment of Covid-19 — Final Report
Beigel, J. H., Tomashek, K. M., Dodd, L. E., Mehta, A. K., Zingman, B. S., Kalil, A. C., Hohmann, E., Chu, H. Y., Luetkemeyer, A., Kline, S., et al. (2020) · New England Journal of Medicine · doi:10.1056/nejmoa2007764 · Cited by 7,267
Virological assessment of hospitalized patients with COVID-2019
Wölfel, R., Corman, V. M., Guggemos, W., Seilmaier, M., Zange, S., Müller, M. A., Niemeyer, D., Jones, T. C., Vollmar, P., Rothe, C., et al. (2020) · Nature · doi:10.1038/s41586-020-2196-x · Cited by 6,661
Grasselli, G., Zangrillo, A., Zanella, A., Antonelli, M., Cabrini, L., Castelli, A., Cereda, D., Coluccello, A., Foti, G., Fumagalli, R., et al. (2020) · JAMA · doi:10.1001/jama.2020.5394 · Cited by 5,469 · cited 3×
“…and many fatalities occur, with increased rates of severe and fatal disease among older individuals (> 65 years old) (Docherty et al., 2020; Grasselli et al., 2020) and those with pre-existing medical conditions like cardiovascular disease, obesity, and type 2 diabetes mellitus (Docherty…”
Meijer, L., Nelson, D. J., Riazanski, V., Gabdoulkhakova, A. G., Héry-Arnaud, G., Berre, R. L., Loaëc, N., Oumata, N., Galons, H., Nowak, E., et al. (2016) · Journal of Innate Immunity · doi:10.1159/000444256 · Cited by 5,008
Clinical and immunological features of severe and moderate coronavirus disease 2019
Chen, G., Wu, D., Guo, W., Cao, Y., Huang, D., Wang, H., Wang, T., Zhang, X., Chen, H., Yu, H., et al. (2020) · Journal of Clinical Investigation · doi:10.1172/jci137244 · Cited by 4,750 · cited 1×
“001; Figures S5A–S5C) and correlated with disease severity (Figure 5A), consistent with large cohort studies of plasma cytokines (Chen et al., 2020; Laing et al., 2020; Mathew et al., 2020; Yang et al., 2020).”
Imbalanced Host Response to SARS-CoV-2 Drives Development of COVID-19
Blanco-Melo, D., Nilsson-Payant, B. E., Liu, W.-C., Uhl, S., Hoagland, D., Møller, R., Jordan, T. X., Oishi, K., Panis, M., Sachs, D., et al. (2020) · Cell · doi:10.1016/j.cell.2020.04.026 · Cited by 4,222 · cited 2×
“Elevated innate immune cytokines detected in peripheral blood including interleukin (IL)-1, IL-6, IL-8, or C-X-C Motif Chemokine Ligand 10 (CXCL10) have been associated with severe or fatal COVID-19 (Blanco-Melo et al., 2020; Laing et al., 2020; Lucas et al., 2020; Vabret et al., 2020; Del Valle et al., 2020).”
Grifoni, A., Weiskopf, D., Ramirez, S. I., Mateus, J., Dan, J. M., Moderbacher, C. R., Rawlings, S. A., Sutherland, A., Premkumar, L., Jadi, R. S., et al. (2020) · Cell · doi:10.1016/j.cell.2020.05.015 · Cited by 3,595 · cited 10×
“Assays were conducted as previously described (Grifoni et al., 2020a; Morou et al., 2019; Reiss et al., 2017).”
InfluentialSelf-citationDocherty, A. B., Harrison, E. M., Green, C. A., Hardwick, H. E., Pius, R., Norman, L., Holden, K. A., Read, J. M., Dondelinger, F., Carson, G., et al. (2020) · BMJ · doi:10.1136/bmj.m1985 · Cited by 3,481
Differentiation of Effector CD4 T Cell Populations
Zhu, J., Yamane, H., & Paul, W. E. (2010) · Annual Review of Immunology · doi:10.1146/annurev-immunol-030409-101212 · Cited by 3,452 · cited 2×
“Additionally, CD4 + T cells have a range of different functionalities beyond helping antibody responses that can be valuable in the context of antiviral immunity (Zhu et al., 2010).”
An mRNA Vaccine against SARS-CoV-2 — Preliminary Report
Jackson, L. A., Anderson, E. J., Rouphael, N. G., Roberts, P. C., Makhene, M., Coler, R. N., McCullough, M. P., Chappell, J. D., Denison, M. R., Stevens, L. J., et al. (2020) · New England Journal of Medicine · doi:10.1056/nejmoa2022483 · Cited by 3,237 · cited 1×
“…on the elicitation of neutralizing antibodies (Amanat and Kram-mer, 2020; Corey et al., 2020; Thanh Le et al., 2020), with additional interest in elicitation of CD4 + or CD8 + T cells (Corbett et al., 2020; Folegatti et al., 2020; Jackson et al., 2020; Mercado et al., 2020; Sahin et al., 2020).”
Ou, X., Liu, Y., Lei, X., Li, P., Mi, D., Ren, L., Guo, L., Guo, R., Chen, T., Hu, J., et al. (2020) · Nature Communications · doi:10.1038/s41467-020-15562-9 · Cited by 3,097 · cited 1×
“, 2020), measurements of common leukocyte types, or inflammatory proteins in blood (Giamarellos-Bourboulis et al., 2020; Laing et al., 2020; Mathew et al., 2020; Meckiff et al., 2020; Ou et al., 2020; Sekine et al., 2020) to obtain powerful information about the status of COVID-19 patients.”
Single-cell landscape of bronchoalveolar immune cells in patients with COVID-19
Liao, M., Liu, Y., Yuan, J., Wen, Y., Xu, G., Zhao, J., Cheng, L., Li, J., Wang, X., Wang, F., et al. (2020) · Nature Medicine · doi:10.1038/s41591-020-0901-9 · Cited by 2,614 · cited 1×
“Additionally, while immunological data from lungs of COVID-19 cases are limited, the data on total abundance of CD8 + T cells in COVID-19 lungs (Liao et al., 2020) are consistent with our conclusion that weaker SARS-CoV-2-specific T cell responses are associated with worse disease.”
An inflammatory cytokine signature predicts COVID-19 severity and survival
Del Valle, D. M., Kim-Schulze, S., Huang, H.-H., Beckmann, N. D., Nirenberg, S., Wang, B., Lavin, Y., Swartz, T. H., Madduri, D., Stock, A., et al. (2020) · Nature Medicine · doi:10.1038/s41591-020-1051-9 · Cited by 2,605
Folegatti, P. M., Ewer, K. J., Aley, P. K., Angus, B., Becker, S., Belij-Rammerstorfer, S., Bellamy, D., Bibi, S., Bittaye, M., Clutterbuck, E. A., et al. (2020) · The Lancet · doi:10.1016/s0140-6736(20)31604-4 · Cited by 2,419
MURPHY, K. M. M., & Weaver, C. T. (2016) · W.W. Norton eBooks · doi:10.1201/9781315533247 · Cited by 2,262
Longitudinal analyses reveal immunological misfiring in severe COVID-19
Lucas, C., Wong, P., Klein, J., Castro, T. B. R., Silva, J., Sundaram, M., Ellingson, M. K., Mao, T., Oh, J. E., Israelow, B., et al. (2020) · Nature · doi:10.1038/s41586-020-2588-y · Cited by 2,074
Complex Immune Dysregulation in COVID-19 Patients with Severe Respiratory Failure
Giamarellos-Bourboulis, E. J., Netea, M. G., Rovina, N., Akinosoglou, K., Antoniadou, A., Antonakos, N., Damoraki, G., Gkavogianni, T., Adami, M.-E., Katsaounou, P., et al. (2020) · Cell Host & Microbe · doi:10.1016/j.chom.2020.04.009 · Cited by 2,045
The COVID-19 vaccine development landscape
Le, T. T., Andreadakis, Z., Kumar, A., Román, R. G., Tollefsen, S., Saville, M. K., & Mayhew, S. (2020) · Nature Reviews Drug Discovery · doi:10.1038/d41573-020-00073-5 · Cited by 2,002
COVID-19 vaccine BNT162b1 elicits human antibody and TH1 T cell responses
Sahin, U., Muik, A., Derhovanessian, E., Vogler, I., Kranz, L. M., Vormehr, M., Baum, A., Pascal, K., Quandt, J., Maurus, D., et al. (2020) · Nature · doi:10.1038/s41586-020-2814-7 · Cited by 1,977
Convergent Antibody Responses to SARS-CoV-2 in Convalescent Individuals
Robbiani, D. F., Gaebler, C., Muecksch, F., Lorenzi, J. C. C., Wang, Z., Cho, A., Agudelo, M., Barnes, C. O., Gazumyan, A., Finkin, S., et al. (2020) · Nature · doi:10.1038/s41586-020-2456-9 · Cited by 1,853 · cited 2×
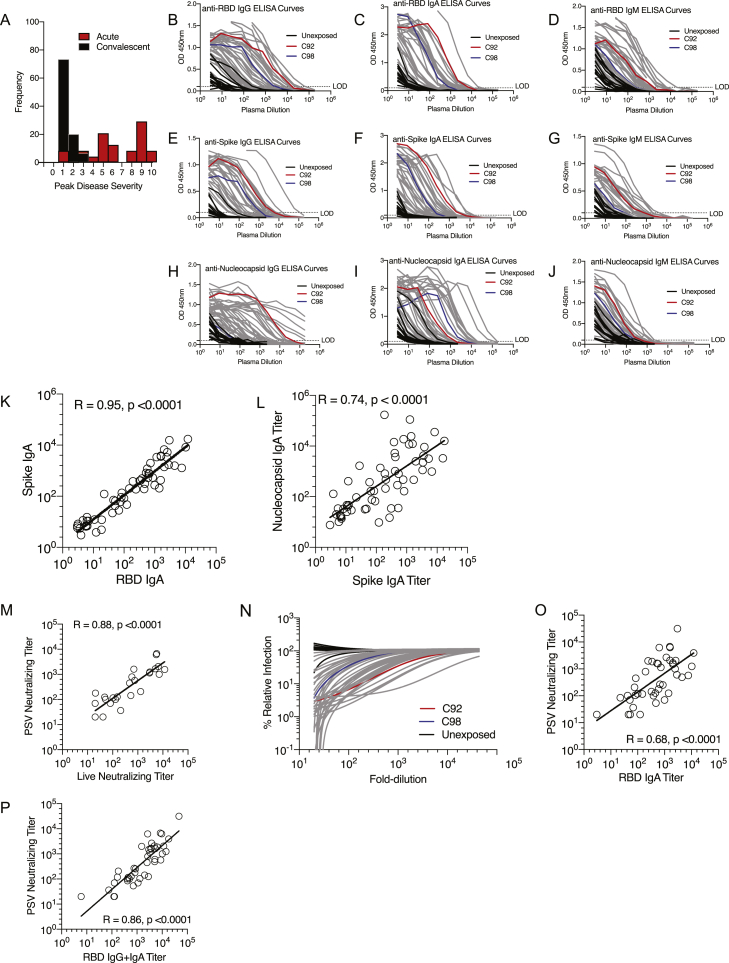
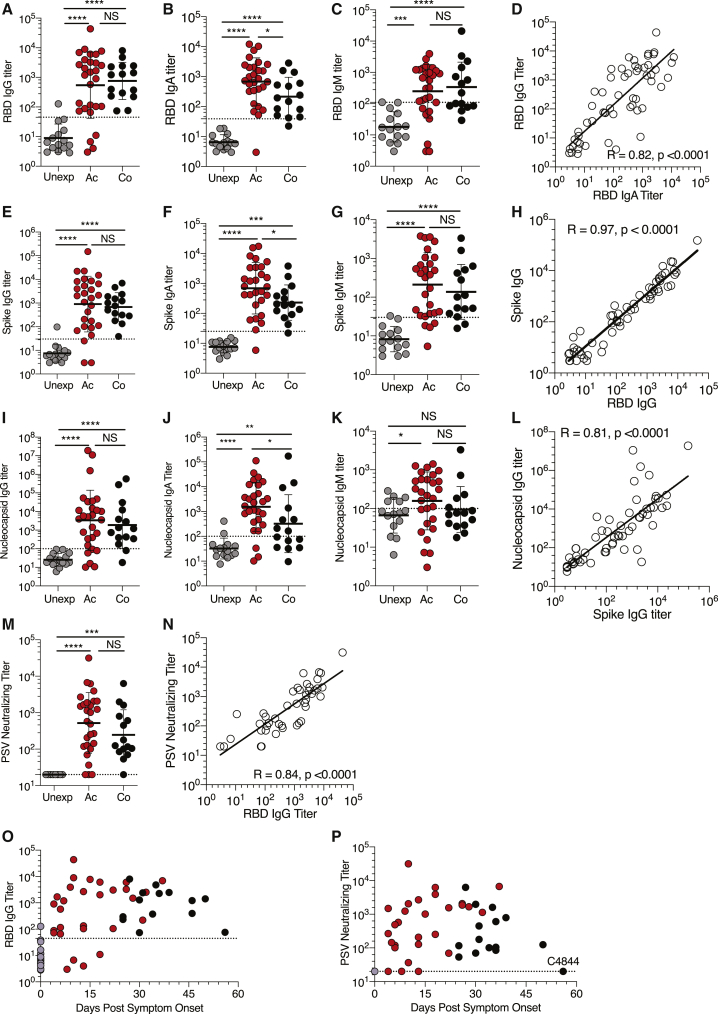
“Distinguishable RBD IgM was observed less often (Figures 1C and S1D) for both acute and convalescent cases, consistent with other recent reports (Robbiani et al., 2020).”
Robust T Cell Immunity in Convalescent Individuals with Asymptomatic or Mild COVID-19
Sekine, T., Perez-Potti, A., Rivera-Ballesteros, O., Strålin, K., Gorin, J.-B., Olsson, A., Llewellyn-Lacey, S., Kamal, H., Bogdanovic, G., Muschiol, S., et al. (2020) · Cell · doi:10.1016/j.cell.2020.08.017 · Cited by 1,788
Correlates of protection induced by vaccination
Plotkin, S. A. (2010) · Clinical and Vaccine Immunology · doi:10.1128/cvi.00131-10 · Cited by 1,745 · cited 1×
“The vast majority of licensed human vaccines work on the basis of protective antibody responses, with neutralizing antibodies being the most common mechanism of action (Piot et al., 2019; Plotkin, 2010; Plotkin et al., 2018).”
Human neutralizing antibodies elicited by SARS-CoV-2 infection
Ju, B., Zhang, Q., Ge, J., Wang, R., Sun, J., Ge, X., Yu, J., Shan, S., Zhou, B., Song, S., et al. (2020) · Nature · doi:10.1038/s41586-020-2380-z · Cited by 1,667 · cited 1×
“The RBD domain is the primary target of SARS-CoV-2-neutralizing antibodies (Ju et al., 2020; Rogers et al., 2020), much like what was found for SARS-CoV (Subbarao, 2020).”
Immunology of COVID-19: Current State of the Science
Vabret, N., Britton, G. J., Gruber, C., Hegde, S., Kim, J., Kuksin, M., Levantovsky, R., Malle, L., Moreira, A., Park, M. D., et al. (2020) · Immunity · doi:10.1016/j.immuni.2020.05.002 · Cited by 1,623
Okba, N. M. A., Müller, M. A., Li, W., Wang, C., GeurtsvanKessel, C. H., Corman, V. M., Lamers, M. M., Sikkema, R. S., de Bruin, E., Chandler, F. D., et al. (2020) · Emerging Infectious Diseases · doi:10.3201/eid2607.200841 · Cited by 1,614
T follicular helper cell biology: a decade of discovery and diseases
Crotty, S. (2019) · Immunity · doi:10.1016/j.immuni.2019.04.011 · Cited by 1,591 · cited 4×
“…Antigen-Specific Adaptive Immunity to SARS-CoV-2 in Acute COVID-19 and Associations with Age and Disease Severity, Cell (2020), https://doi.org/10.1016/j.cell.2020.09.038 Article TFH cells are the CD4 + T cells required for most IgG responses and high-quality neutralizing antibodies (Crotty, 2019).”
InfluentialSelf-citationMathew, D., Giles, J. R., Baxter, A. E., Oldridge, D. A., Greenplate, A. R., Wu, J. E., Alanio, C., Kuri-Cervantes, L., Pampena, M. B., D’Andrea, K., et al. (2020) · Science · doi:10.1126/science.abc8511 · Cited by 1,509 · cited 8×
“, 2020), measurements of common leukocyte types, or inflammatory proteins in blood (Giamarellos-Bourboulis et al., 2020; Laing et al., 2020; Mathew et al., 2020; Meckiff et al., 2020; Ou et al., 2020; Sekine et al., 2020) to obtain powerful information about the status of COVID-19 patients.”
InfluentialSARS-CoV-2 Reverse Genetics Reveals a Variable Infection Gradient in the Respiratory Tract
Hou, Y. J., Okuda, K., Edwards, C. E., Martinez, D. R., Asakura, T., Dinnon, K. H., Kato, T., Lee, R. E., Yount, B. L., Mascenik, T. M., et al. (2020) · Cell · doi:10.1016/j.cell.2020.05.042 · Cited by 1,488
Self-citationDevelopment of an inactivated vaccine candidate for SARS-CoV-2
Gao, Q., Bao, L., Mao, H., Wang, L., Xu, K., Yang, M., Li, Y., Zhu, L., Wang, N., Lv, Z., et al. (2020) · Science · doi:10.1126/science.abc1932 · Cited by 1,434 · cited 2×
“…titers were associated with protection against SARS-CoV-2 in non-human primate infection and rechallenge studies (Chandrashekar et al., 2020; Gao et al., 2020), as well as in three candidate COVID-19 vaccine studies in non-human primates (Gao et al., 2020; Wang et al., 2020c; Yu et al., 2020).”
SARS-CoV-2-reactive T cells in healthy donors and patients with COVID-19
Braun, J., Loyal, L., Frentsch, M., Wendisch, D., Georg, P., Kurth, F., Hippenstiel, S., Dingeldey, M., Kruse, B., Fauchere, F., et al. (2020) · Nature · doi:10.1038/s41586-020-2598-9 · Cited by 1,310
Rogers, T. F., Zhao, F., Huang, D., Beutler, N., Burns, A., He, W.-T., Limbo, O., Smith, C., Song, G., Woehl, J., et al. (2020) · Science · doi:10.1126/science.abc7520 · Cited by 1,230 · cited 3×
“The RBD domain is the primary target of SARS-CoV-2-neutralizing antibodies (Ju et al., 2020; Rogers et al., 2020), much like what was found for SARS-CoV (Subbarao, 2020).”
Self-citationRobust neutralizing antibodies to SARS-CoV-2 infection persist for months
Wajnberg, A., Amanat, F., Firpo, A., Altman, D. R., Bailey, M. J., Mansour, M., McMahon, M., Meade, P., Mendu, D. R., Muellers, K., et al. (2020) · Science · doi:10.1126/science.abd7728 · Cited by 1,195
Robust neutralizing antibodies to SARS-CoV-2 infection persist for months
(2020) · Science · doi:10.1101/2020.07.14.20151126 · Cited by 1,192 · cited 1×
“…et al., 2020; (legend continued on next page) Weiskopf et al., 2020) or neutralizing antibody data (Robbiani et al., 2020; Rogers et al., 2020; Wajnberg et al., 2020) are available, but combined assessments of antigen-specific CD4 + T cells, CD8 + T cells, and neutralizing antibodies in…”
Characteristics of Peripheral Lymphocyte Subset Alteration in COVID-19 Pneumonia
Wang, F., Nie, J., Wang, H., Zhao, Q., Xiong, Y., Deng, L., Song, S., Ma, Z., Mo, P., & Zhang, Y. (2020) · The Journal of Infectious Diseases · doi:10.1093/infdis/jiaa150 · Cited by 1,149
SARS-CoV-2 Vaccines: Status Report
Amanat, F., & Krammer, F. (2020) · Immunity · doi:10.1016/j.immuni.2020.03.007 · Cited by 1,120 · cited 1×
“Thus, most COVID-19 vaccine efforts focus on the elicitation of neutralizing antibodies (Amanat and Krammer, 2020; Corey et al., 2020; Thanh Le et al., 2020), with additional interest in elicitation of CD4 or CD8 T cells (Corbett et al.”
Evaluation of the mRNA-1273 Vaccine against SARS-CoV-2 in Nonhuman Primates
Corbett, K. S., Flynn, B., Foulds, K. E., Francica, J. R., Boyoglu-Barnum, S., Werner, A. P., Flach, B., O’Connell, S., Bock, K. W., Minai, M., et al. (2020) · New England Journal of Medicine · doi:10.1056/nejmoa2024671 · Cited by 1,066 · cited 1×
“, 2020), with additional interest in elicitation of CD4 or CD8 T cells (Corbett et al., 2020; Folegatti et al., 2020; Jackson et al., 2020; Mercado et al., 2020; Sahin et al., 2020).”
Self-citationDNA vaccine protection against SARS-CoV-2 in rhesus macaques
Yu, J., Tostanoski, L. H., Peter, L., Mercado, N. B., McMahan, K., Mahrokhian, S. H., Nkolola, J. P., Liu, J., Li, Z., Chandrashekar, A., et al. (2020) · Science · doi:10.1126/science.abc6284 · Cited by 997
Self-citationA dynamic COVID-19 immune signature includes associations with poor prognosis
Laing, A. G., Lorenc, A., del Molino del Barrio, I., Das, A., Fish, M., Monin, L., Muñoz-Ruiz, M., McKenzie, D. R., Hayday, T. S., Francos-Quijorna, I., et al. (2020) · Nature Medicine · doi:10.1038/s41591-020-1038-6 · Cited by 946 · cited 5×
“…(IP-10), IL-8, and IL-6 were elevated in acute COVID-19 (p < 0.0001, p < 0.05, p < 0.001; Figures S5A–S5C) and correlated with disease severity (Figure 5A), consistent with large cohort studies of plasma cytokines (Chen et al., 2020; Laing et al., 2020; Mathew et al., 2020; Yang et al., 2020).”
InfluentialGrifoni, A., Sidney, J., Zhang, Y., Scheuermann, R. H., Peters, B., & Sette, A. (2020) · Cell Host & Microbe · doi:10.1016/j.chom.2020.03.002 · Cited by 920
Self-citationWeiskopf, D., Schmitz, K. S., Raadsen, M. P., Grifoni, A., Okba, N. M. A., Endeman, H., van den Akker, J. P. C., Molenkamp, R., Koopmans, M. P. G., van Gorp, E. C. M., et al. (2020) · Science Immunology · doi:10.1126/sciimmunol.abd2071 · Cited by 907
Self-citationComparative pathogenesis of COVID-19, MERS, and SARS in a nonhuman primate model
Rockx, B., Kuiken, T., Herfst, S., Bestebroer, T., Lamers, M. M., Oude Munnink, B. B., de Meulder, D., van Amerongen, G., van den Brand, J., Okba, N. M. A., et al. (2020) · Science · doi:10.1126/science.abb7314 · Cited by 901 · cited 2×
“, 2020), similar to what was observed for SARS (Rockx et al., 2020).”
Yang, Y., Shen, C., Li, J., Yuan, J., Wei, J., Huang, F., Wang, F., Li, G., Li, Y., Xing, L., et al. (2020) · Journal of Allergy and Clinical Immunology · doi:10.1016/j.jaci.2020.04.027 · Cited by 872 · cited 2×
“CXCL10 (IP-10), IL-8, and IL-6 were elevated in acute COVID19 (p < 0.0001, p < 0.05, p < 0.001; Figures S5A–S5C) and correlated with disease severity (Figure 5A), consistent with large cohort studies of plasma cytokines (Chen et al., 2020; Laing et al., 2020; Mathew et al., 2020; Yang et al., 2020).”
InfluentialPremkumar, L., Segovia-Chumbez, B., Jadi, R., Martinez, D. R., Raut, R., Markmann, A. J., Cornaby, C., Bartelt, L., Weiss, S., Park, Y., et al. (2020) · Science Immunology · doi:10.1126/sciimmunol.abc8413 · Cited by 868 · cited 2×
“This RBD sequence is 346 amino acids in length, corresponding to amino acids 319-591 of the Spike protein sequences in the Protein Data Bank (PDB) deposited by Premkumar et al., 2020 (PDB 6VSB) and for the reference strain Wuhan-Hu-1 (PDB 6XR8).”
Self-citationSARS-CoV-2 infection protects against rechallenge in rhesus macaques
Chandrashekar, A., Liu, J., Martinot, A. J., McMahan, K., Mercado, N. B., Peter, L., Tostanoski, L. H., Yu, J., Maliga, Z., Nekorchuk, M., et al. (2020) · Science · doi:10.1126/science.abc4776 · Cited by 816 · cited 2×
“Neutralizing antibody titers were associated with protection against SARS-CoV-2 in non-human primate infection and rechallenge studies (Chandrashekar et al., 2020; Gao et al., 2020), as well as in three candidate COVID-19 vaccine studies in non-human primates (Gao et al.”
Self-citationSingle-Shot Ad26 Vaccine Protects Against SARS-CoV-2 in Rhesus Macaques
Mercado, N. B., Zahn, R., Wegmann, F., Loos, C., Chandrashekar, A., Yu, J., Liu, J., Peter, L., McMahan, K., Tostanoski, L. H., et al. (2020) · Nature · doi:10.1038/s41586-020-2607-z · Cited by 789 · cited 2×
“Activation induced cell marker assay Assays were conducted as previously described (Grifoni et al., 2020a; Morou et al., 2019; Reiss et al., 2017).”
Self-citationDiversity and clonal selection in the human T-cell repertoire
Qi, Q., Liu, Y., Cheng, Y., Glanville, J., Zhang, D., Lee, J.-Y., Olshen, R. A., Weyand, C. M., Boyd, S. D., & Goronzy, J. J. (2014) · Proceedings of the National Academy of Sciences · doi:10.1073/pnas.1409155111 · Cited by 755 · cited 1×
“A repertoire of fewer naive T cells in older individuals (Briceño et al., 2016; Qi et al., 2014) may be exacerbated as a risk factor specifically for severe COVID19, because early innate immune evasion by SARS-CoV-2 may limit T cell priming (Blanco-Melo et al.”
Wu, F., Wang, A., Liu, M., Wang, Q., Chen, J., Xia, S., Ling, Y., Zhang, Y., Xun, J., Lu, L., et al. (2020) · doi:10.1101/2020.03.30.20047365 · Cited by 754 · cited 6×
“S IgG and IgA responses were robust in most COVID-19 cases (25/28 acute, 15/15 convalescent S IgG; Figures 1E and S1E) (27/28 acute, 14/15 convalescent S IgA; Figures 1F and S1F), though (cid:1) 17% of cases had relatively low titers (within 3-fold of the LOD).”
InfluentialWang, H., Zhang, Y., Huang, B., Deng, W., Quan, Y., Wang, W., Xu, W., Zhao, Y., Li, N., Zhang, J., et al. (2020) · Cell · doi:10.1016/j.cell.2020.06.008 · Cited by 748 · cited 1×
“…titers were associated with protection against SARS-CoV-2 in non-human primate infection and rechallenge studies (Chandra-shekar et al., 2020; Gao et al., 2020), as well as in three candidate COVID-19 vaccine studies in non-human primates (Gao et al., 2020; Wang et al., 2020c; Yu et al., 2020).”
Visualization of a Correlation Matrix [R package corrplot version 0.84]
Wei, T., & Šimko, V. (2017) · Cited by 726
Tissue-Resident T Cells and Other Resident Leukocytes
Masopust, D., & Soerens, A. G. (2019) · Annual Review of Immunology · doi:10.1146/annurev-immunol-042617-053214 · Cited by 608 · cited 2×
“While blood sampling is a necessity for the vast majority of human immunology studies, it is established that certain cell types of ADIMs can be restricted to organs, such as the lungs, and not be detectable in the circulation (Masopust and Soerens, 2019).”
Molecular regulation of effector and memory T cell differentiation
Chang, J. T., Wherry, E. J., & Goldrath, A. W. (2014) · Nature Immunology · doi:10.1038/ni.3031 · Cited by 604
Imbalance of Regulatory and Cytotoxic SARS-CoV-2-Reactive CD4+ T Cells in COVID-19
Meckiff, B. J., Ramírez-Suástegui, C., Fajardo, V., Chee, S., Kusnadi, A., Simon, H. A., Eschweiler, S., Grifoni, A., Pelosi, E., Weiskopf, D., et al. (2020) · Cell · doi:10.1016/j.cell.2020.10.001 · Cited by 581 · cited 4×
“…reported here do not assess the role of pre-existing cross-reactive T cells in response to SARS-CoV-2 (Braun et al., 2020; Grifoni et al., 2020a; Meckiff et al., 2020; Weiskopf et al., 2020), as the anti-gen-specific tools used in this study did not distinguish between T cell responses…”
InfluentialSelf-citationAcute SARS-CoV-2 Infection Impairs Dendritic Cell and T Cell Responses
Zhou, R., To, K. K.-W., Wong, Y.-C., Liu, L., Zhou, B., Li, X., Huang, H., Mo, Y., Luk, T.-Y., Lau, T. T.-K., et al. (2020) · Immunity · doi:10.1016/j.immuni.2020.07.026 · Cited by 531 · cited 1×
“…2020) or neutralizing antibody data (Robbiani et al., 2020; Rogers et al., 2020; Wajnberg et al., 2020) are available, but combined assessments of antigen-specific CD4 + T cells, CD8 + T cells, and neutralizing antibodies in acute COVID-19 are still lacking (except 3 subjects in Zhou et al., 2020b).”
A strategic approach to COVID-19 vaccine R&D
Corey, L., Mascola, J. R., Fauci, A. S., & Collins, F. S. (2020) · Science · doi:10.1126/science.abc5312 · Cited by 509 · cited 2×
“Thus, most COVID-19 vaccine efforts focus on the elicitation of neutralizing antibodies (Amanat and Krammer, 2020; Corey et al., 2020; Thanh Le et al., 2020), with additional interest in elicitation of CD4 or CD8 T cells (Corbett et al.”
Rapid Generation of Neutralizing Antibody Responses in COVID-19 Patients
Suthar, M. S., Zimmerman, M. G., Kauffman, R. C., Mantus, G., Linderman, S. L., Hudson, W. H., Vanderheiden, A., Nyhoff, L., Davis, C. W., Adekunle, O., et al. (2020) · Cell Reports Medicine · doi:10.1016/j.xcrm.2020.100040 · Cited by 508 · cited 7×
“Neutralizing antibodies and RBD IgG were detectable in the majority of patients in all time windows (Figures 1O and 1P) (Suthar et al., 2020).”
InfluentialAirway Memory CD4+ T Cells Mediate Protective Immunity against Emerging Respiratory Coronaviruses
Zhao, J., Zhao, J., Mangalam, A. K., Channappanavar, R., Fett, C., Meyerholz, D. K., Agnihothram, S., Baric, R. S., David, C. S., & Perlman, S. (2016) · Immunity · doi:10.1016/j.immuni.2016.05.006 · Cited by 496 · cited 1×
“In a mouse model of SARS, it was demonstrated that CD4+ T cells alone, in the absence of antibodies or CD8+ T cells, could provide protection against lethal challenge with SARS-CoV (Zhao et al., 2016).”
Self-citationHumoral and circulating follicular helper T cell responses in recovered patients with COVID-19
Juno, J. A., Tan, H.-X., Lee, W. S., Reynaldi, A., Kelly, H. G., Wragg, K., Esterbauer, R., Kent, H. E., Batten, C. J., Mordant, F. L., et al. (2020) · Nature Medicine · doi:10.1038/s41591-020-0995-0 · Cited by 437
Chen, J., Lau, Y. F., Lamirande, E. W., Paddock, C. D., Bartlett, J. H., Zaki, S. R., & Subbarao, K. (2009) · Journal of Virology · doi:10.1128/jvi.01281-09 · Cited by 402
Reiss, S., Baxter, A. E., Cirelli, K. M., Dan, J. M., Morou, A., Daigneault, A., Brassard, N., Silvestri, G., Routy, J.-P., Havenar-Daughton, C., et al. (2017) · PLOS ONE · doi:10.1371/journal.pone.0186998 · Cited by 343 · cited 2×
“Activation induced cell marker assay Assays were conducted as previously described (Grifoni et al., 2020a; Morou et al., 2019; Reiss et al., 2017).”
Self-citationSevere immunosuppression and not a cytokine storm characterizes COVID-19 infections
Remy, K. E., Mazer, M. B., Striker, D. A., Ellebedy, A. H., Walton, A. H., Unsinger, J., Blood, T. M., Mudd, P. A., Yi, D. J., Mannion, D. A., et al. (2020) · JCI Insight · doi:10.1172/jci.insight.140329 · Cited by 309 · cited 1×
“, 2020), polyclonally stimulated T cells (Lucas et al., 2020; Remy et al., 2020), measurements of common leukocyte types, or inflammatory proteins in blood (Giamarellos-Bourboulis et al.”
Zhao, J., Zhao, J., Legge, K., & Perlman, S. (2011) · Journal of Clinical Investigation · doi:10.1172/jci59777 · Cited by 265 · cited 1×
“…immune evasion by SARS-CoV-2 may limit T cell priming (Blanco-Melo et al., 2020; Vabret et al., 2020), and there is the possibility of fewer professional antigen presenting cells in the lungs with advanced age, as has been seen in small animal models of SARS (Chen et al., 2010; Zhao et al., 2011).”
Immunity and immunological memory following smallpox vaccination
Amanna, I. J., Slifka, M. K., & Crotty, S. (2006) · Immunological Reviews · doi:10.1111/j.0105-2896.2006.00392.x · Cited by 233 · cited 2×
“For example, neutralizing antibodies, CD4 T cells, and CD8 T cells have each individually been shown to have protective roles against poxvirus infections in mice, and depletion of any one of the three components of the adaptive immune system can still result in protection from vaccinia virus infection (Amanna et al.,…”
Self-citationThe Innate Immune System: Fighting on the Front Lines or Fanning the Flames of COVID-19?
McKechnie, J. L., & Blish, C. A. (2020) · Cell Host & Microbe · doi:10.1016/j.chom.2020.05.009 · Cited by 218 · cited 1×
“Cell 183, 1–17, Nov This is an open access article und direct viral effects in the respiratory system and other organ systems has been questioned, with the possibility of immunopathogenesis being a major causal component of severe COVID-19 (McKechnie and Blish, 2020; Vabret et al., 2020).”
Immunization: vital progress, unfinished agenda
Piot, P., Larson, H. J., O’Brien, K. L., N’kengasong, J., Ng, E., Sow, S., & Kampmann, B. (2019) · Nature · doi:10.1038/s41586-019-1656-7 · Cited by 206 · cited 1×
“The vast majority of licensed human vaccines work on the basis of protective antibody responses, with neutralizing antibodies being the most common mechanism of action (Piot et al., 2019; Plotkin, 2010; Plotkin et al., 2018).”
Reduced naïve CD 8 + T ‐cell priming efficacy in elderly adults
Briceño, O., Lissina, A., Wanke, K., Afonso, G., Braun, A., Ragon, K., Miquel, T., Gostick, E., Papagno, L., Stiasny, K., et al. (2016) · Aging Cell · doi:10.1111/acel.12384 · Cited by 151
Mathew, D., Giles, J. R., Baxter, A. E., et al. (2020) · bioRxiv (Cold Spring Harbor Laboratory) · doi:10.1101/2020.05.20.106401 · Cited by 115
Altered differentiation is central to HIV-specific CD4+ T cell dysfunction in progressive disease
Morou, A., Brunet‐Ratnasingham, E., Dubé, M., Charlebois, R., Mercier, E., Darko, S. W., Brassard, N., Nganou‐Makamdop, K., Arumugam, S. A., Gendron‐Lepage, G., et al. (2019) · Nature Immunology · doi:10.1038/s41590-019-0418-x · Cited by 99 · cited 2×
“Activation induced cell marker assay Assays were conducted as previously described (Grifoni et al., 2020a; Morou et al., 2019; Reiss et al., 2017).”
OX40 Drives Protective Vaccinia Virus-Specific CD8 T Cells,
Salek‐Ardakani, S., Moutaftsi, M., Crotty, S., Sette, A., & Croft, M. (2008) · The Journal of Immunology · doi:10.4049/jimmunol.181.11.7969 · Cited by 76 · cited 1×
“…+ T cells have each individually been shown to have protective roles against poxvirus infections in mice, and depletion of any one of the three components of the adaptive immune system can still result in protection from vaccinia virus infection (Amanna et al., 2006; Salek-Ardakani et al., 2008).”
Self-citationAuthor Correction: A dynamic COVID-19 immune signature includes associations with poor prognosis
Laing, A. G., Lorenc, A., del Barrio, I. D. M., Das, A., Fish, M., Monin, L., Muñoz‐Ruiz, M., McKenzie, D. R., Hayday, T. S., Francos-Quijorna, I., et al. (2020) · Nature Medicine · doi:10.1038/s41591-020-01186-5 · Cited by 68 · cited 5×
“, 2020), measurements of common leukocyte types, or inflammatory proteins in blood (Giamarellos-Bourboulis et al., 2020; Laing et al., 2020; Mathew et al., 2020; Meckiff et al., 2020; Ou et al., 2020; Sekine et al., 2020) to obtain powerful information about the status of COVID-19 patients.”
InfluentialConcurrent human antibody and T H 1 type T-cell responses elicited by a COVID-19 RNA vaccinePreprint
Şahin, U., Muik, A., Derhovanessian, E., et al. (2020) · medRxiv · doi:10.1101/2020.07.17.20140533 · Cited by 67 · cited 1×
“…focus on the elicitation of neutralizing antibodies (Amanat and Krammer, 2020; Corey et al., 2020; Thanh Le et al., 2020), with additional interest in elicitation of CD4+ or CD8+ T cells (Corbett et al., 2020; Folegatti et al., 2020; Jackson et al., 2020; Mercado et al., 2020; Sahin et al., 2020).”
Plotkin, S. A. 1., Orenstein, W. A., & Offit, P. A. (2017) · Elsevier eBooks · doi:10.1016/c2013-0-18914-3 · Cited by 51 · cited 2×
“The different arms of adaptive immunity can compensate for each other in protective immunity in some contexts (Amanna et al., 2006; Plotkin et al., 2018).”
Single-Cell Transcriptomic Analysis of SARS-CoV-2 Reactive CD4 + T CellsPreprint
Meckiff, B. J., Ramírez-Suástegui, C., Fajardo, V., Chee, S., Kusnadi, A., Simon, H. A., Grifoni, A., Pelosi, E., Weiskopf, D., Sette, A., et al. (2020) · SSRN Electronic Journal · doi:10.2139/ssrn.3641939 · Cited by 47 · cited 4×
“…reported here do not assess the role of pre-existing cross-reactive T cells in response to SARS-CoV-2 (Braun et al., 2020; Grifoni et al., 2020a; Meckiff et al., 2020; Weiskopf et al., 2020), as the anti-gen-specific tools used in this study did not distinguish between T cell responses…”
InfluentialSelf-citationSARS-CoV-2: A New Song Recalls an Old Melody
Subbarao, K. (2020) · Cell Host & Microbe · doi:10.1016/j.chom.2020.04.019 · Cited by 20 · cited 2×
“The RBD domain is the primary target of SARS-CoV-2-neutralizing antibodies (Ju et al., 2020; Rogers et al., 2020), much like what was found for SARS-CoV (Subbarao, 2020).”
Cited by
Sorted by citations
Khoury, D. S., Cromer, D., Reynaldi, A., Schlub, T. E., Wheatley, A. K., Juno, J. A., Subbarao, K., Kent, S. J., Triccas, J. A., & Davenport, M. P. (2021) · Nature Medicine · doi:10.1038/s41591-021-01377-8 · Cited by 3,742
Immunological memory to SARS-CoV-2 assessed for up to 8 months after infection.
Dan, J. M., Mateus, J., Kato, Y., Hastie, K. M., Yu, E. D., Faliti, C. E., Grifoni, A., Ramirez, S. I., Haupt, S., Frazier, A., et al. (2021) · Science · doi:10.1126/science.abf4063 · Cited by 2,656
“Neutralizing antibodies have generally not correlated with lessenedCOVID-19disease severity (5, 19,20), which was also observed for Middle Eastern respiratory syndrome (MERS), causedbyMERSCoV (21).”
BackgroundMethodResultInfluentialSelf-citationAdaptive immunity to SARS-CoV-2 and COVID-19
Sette, A., & Crotty, S. (2021) · Cell · doi:10.1016/j.cell.2021.01.007 · Cited by 1,860
“Notably, frequencies of RBD (and Spike) memory B cells increased over time, with more RBDmemory B cells at 6 months PSO than at 1 month PSO (Dan et al., 2021; Gaebler et al., 2020), consistent with observations at 3 months PSO (Rodda et al., 2021).”
InfluentialSelf-citationThe T cell immune response against SARS-CoV-2
Moss, P. A. H. (2022) · Nature Immunology · doi:10.1038/s41590-021-01122-w · Cited by 1,243
Tarke, A., Coelho, C. H., Zhang, Z., Dan, J. M., Yu, E. D., Methot, N., Bloom, N. I., Goodwin, B., Phillips, E., Mallal, S., et al. (2022) · Cell · doi:10.1016/j.cell.2022.01.015 · Cited by 858
“SARS-CoV-2 serology and PSV neutralization assay SARS-CoV-2 serology was performed for all plasma samples collected as previously described(Rydyznski Moderbacher et al., 2020).”
Self-citation
Metadata
- Authors
- Rydyznski Moderbacher, C., Ramirez, S. I., Dan, J. M., Grifoni, A., Hastie, K. M., Weiskopf, D., Belanger, S., Abbott, R. K., Kim, C., Choi, J., Kato, Y., Crotty, E. G., Kim, C., Rawlings, S. A., Mateus, J., Tse, L. P. V., Frazier, A., Baric, R., Peters, B., Greenbaum, J., Saphire, E. O., Smith, D. M., Sette, A., & Crotty, S.
- Affiliations
- La Jolla Institute for Immunology (US)
- University of California San Diego (US)
- University of North Carolina at Chapel Hill (US)
- Corresponding author
- Sette, Alessandro
- Crotty, Shane
- ORCID
- Ramirez, Sydney I.
- Dan, Jennifer M.
- Grifoni, Alba
- Hastie, Kathryn M.
- Weiskopf, Daniela
- Abbott, Robert K.
- Kim, Christina
- Choi, Jinyong
- Kato, Yu
- Kim, Cheryl
- Rawlings, Stephen A.
- Mateus, Jose
- Tse, Long Ping Victor
- Frazier, April
- Baric, Ralph
- Peters, Bjoern
- Greenbaum, Jason
- Saphire, Erica Ollmann
- Smith, Davey M.
- Sette, Alessandro
- Crotty, Shane
- Venue
- Cell
- Publisher
- Elsevier BV
- Published
- 2020-11
- Volume
- 183
- Issue
- 4
- Pages
- 996-1012.e19
- ISSN
- 0092-8674 (ISSN-L)
- PMC
- PMC7494270
- OpenAlex
- W3084879098
- Cited by
- 1,790
- References
- 77
- Citations by year
- 2026: 54 · 2025: 144 · 2024: 180 · 2023: 288 · 2022: 543 · 2021: 517 · 2020: 62
- FWCI
- 46.45
- Type
- journal article
- Language
- en
- Open access
- hybrid
- doi.org
- Licence
- Locations
- Cell (publishedVersion, cc-by)
- PubMed Central (publishedVersion, cc-by)
- PubMed (publishedVersion)
- eScholarship (California Digital Library) (submittedVersion)
- Funders
- Bill and Melinda Gates Foundation (INV-006133)
- National Institute of Allergy and Infectious Diseases (U19 AI118626, AI100625, 75N9301900065, AI142742, AI145762, AI135078)
- National Institutes of Health
- Pontificia Universidad Javeriana
- University of California, San Diego
- Departamento Administrativo de Ciencia, Tecnología e Innovación
- Wellcome
- Topics
- Health Sciences › Medicine › Infectious Diseases › SARS-CoV-2 and COVID-19 Research
- Health Sciences › Medicine › Infectious Diseases › COVID-19 Clinical Research Studies
- Life Sciences › Immunology and Microbiology › Immunology › Immune responses and vaccinations
- Keywords
- SARS-CoV-2, COVID-19 pandemic, CD4+ T cells, CD8+ T cells, neutralizing antibodies, disease severity, age, naive T cells, immunosenescence
- MeSH terms
- Betacoronavirus, COVID-19, SARS-CoV-2, Acute Disease, Adult, Aged, Aged, 80 and over, Antibodies, Viral, Antigens, Viral, Female, Humans, Male, Middle Aged, Pneumonia, Viral, Severity of Illness Index, CD4-Positive T-Lymphocytes, Cytokines, Coronavirus Infections, CD8-Positive T-Lymphocytes, Young Adult, Adaptive Immunity, Antibodies, Neutralizing, Pandemics
About these checks
Registry, retraction, Cites and statistics results are computed, not judged, with one exception: a printed reference that no index lists is read once by a model before it counts as a citation error. Claims are extracted by a model and kept only when their quote appears verbatim in the text; each cited source is then checked, with a model’s help, for whether it says what the claim relies on. Those verdicts can be wrong — read the claim’s quote and the cited source before relying on one.
Statistics and arithmetic are recomputed, not judged.
Confidence bands are shown only for fields calibrated on our annotated test set. None is calibrated yet, so no band is shown.
What counts as a claim ›How we measure confidence ›How we check this ›
Are you an author, or do you see a problem with this page? Request a review
