

The DOI matches its Crossref record; 125 of the 125 references it cites were found in a registry or an index; 83 of the 109 sources its claims cite were checked for support.
Single-cell multiregion dissection of Alzheimer’s disease
Open accessAbstract
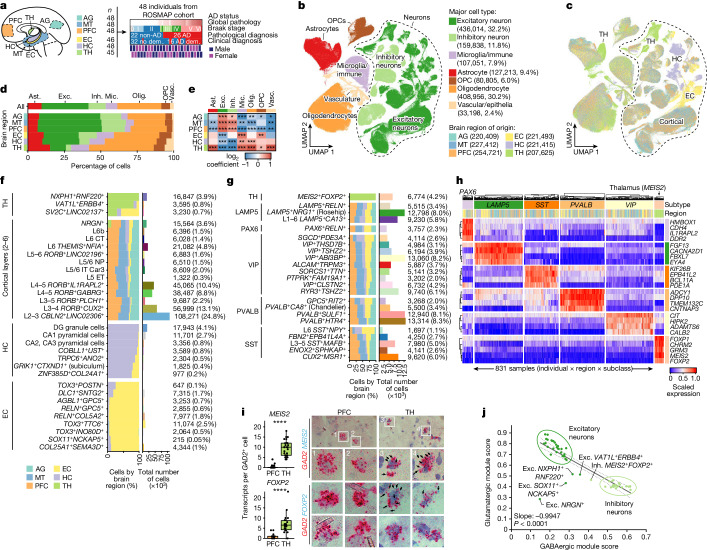
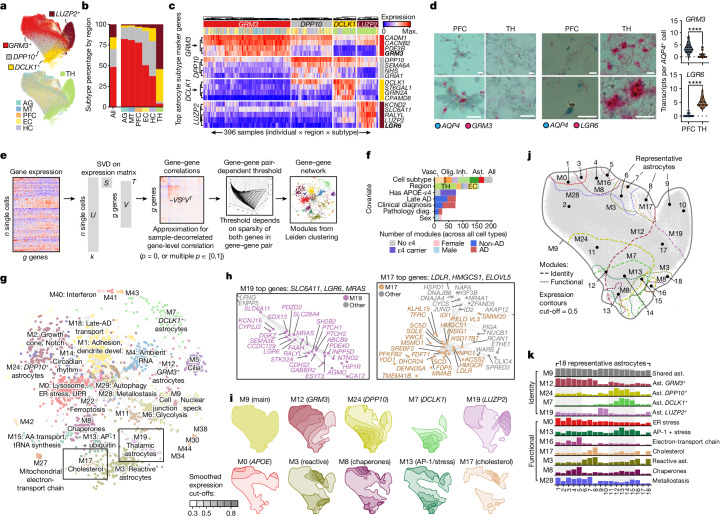
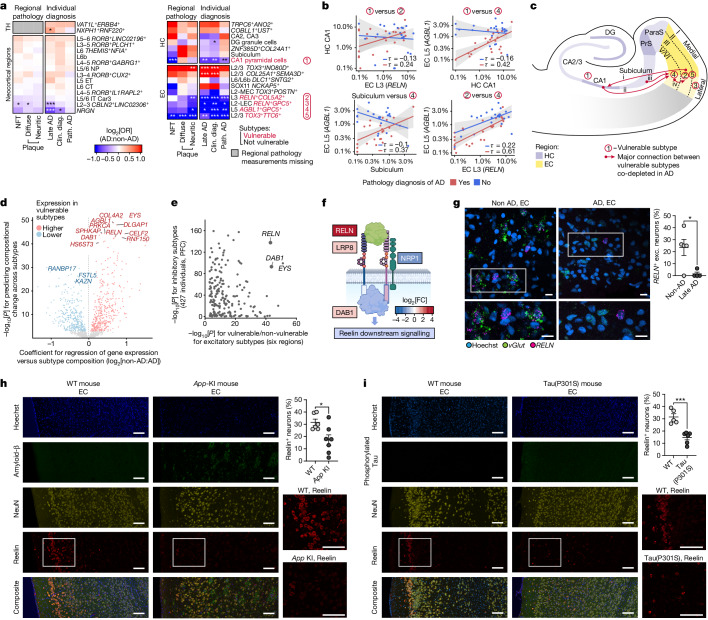
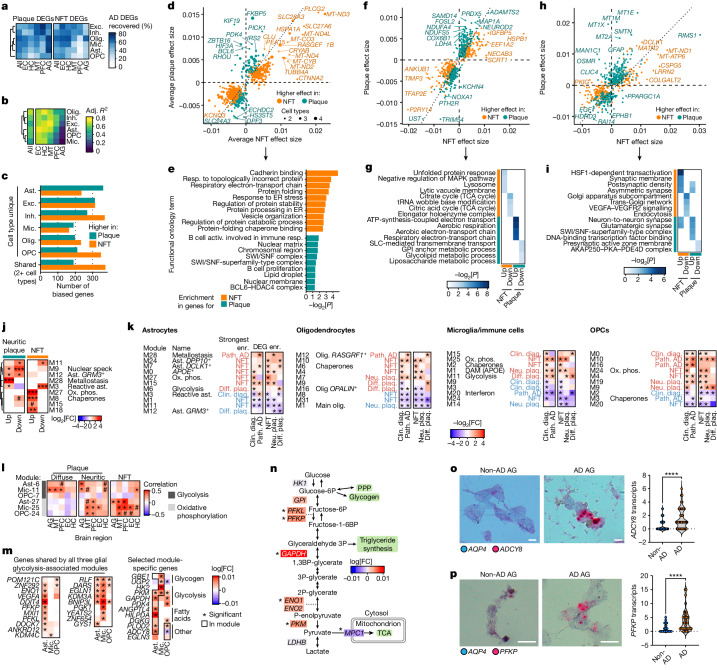
Alzheimer’s disease is the leading cause of dementia worldwide, but the cellular pathways that underlie its pathological progression across brain regions remain poorly understood 1–3 . Here we report a single-cell transcriptomic atlas of six different brain regions in the aged human brain, covering 1.3 million cells from 283 post-mortem human brain samples across 48 individuals with and without Alzheimer’s disease. We identify 76 cell types, including region-specific subtypes of astrocytes and excitatory neurons and an inhibitory interneuron population unique to the thalamus and distinct from canonical inhibitory subclasses. We identify vulnerable populations of excitatory and inhibitory neurons that are depleted in specific brain regions in Alzheimer’s disease, and provide evidence that the Reelin signalling pathway is involved in modulating the vulnerability of these neurons. We develop a scalable method for discovering gene modules, which we use to identify cell-type-specific and region-specific modules that are altered in Alzheimer’s disease and to annotate transcriptomic differences associated with diverse pathological variables. We identify an astrocyte program that is associated with cognitive resilience to Alzheimer’s disease pathology, tying choline metabolism and polyamine biosynthesis in astrocytes to preserved cognitive function late in life. Together, our study develops a regional atlas of the ageing human brain and provides insights into cellular vulnerability, response and resilience to Alzheimer’s disease pathology.
Overview
AI snapshot
Written from the paper’s full text.
TL;DR
This paper presents a single-cell transcriptomic atlas of six brain regions from 48 ROSMAP participants, covering 1.35 million nuclei and 76 cell types, to dissect regional cellular vulnerability, response, and resilience in Alzheimer’s disease. It identifies region-specific neuronal and glial subtypes, vulnerable Reelin-associated neuronal populations, and an astrocyte choline/polyamine program linked to cognitive resilience.
Key findings
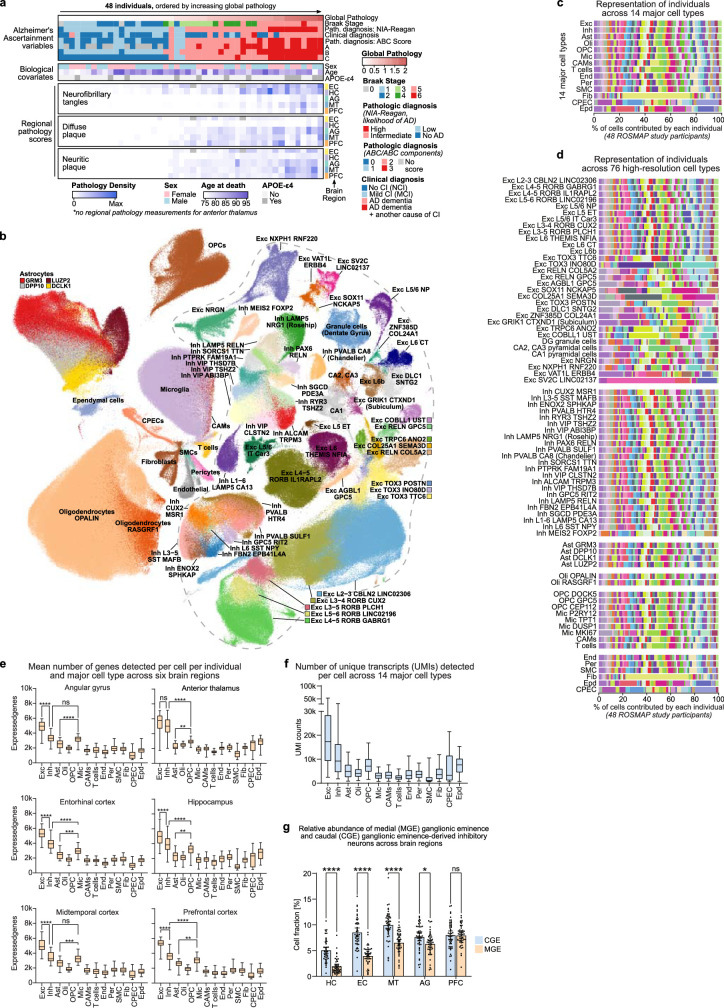
- The atlas covers 283 post-mortem samples from six regions (EC, HC, TH, AG, MT, PFC) across 48 individuals (26 pathologic AD, 22 non-AD; 16 AD dementia, 32 no dementia), yielding 1.35 million nuclei and 76 high-resolution cell types in 14 major groups, including 32 excitatory and 23 inhibitory neuron subtypes.
- Regional diversity includes a thalamus-specific inhibitory MEIS2+FOXP2+ subtype, a thalamic excitatory NXPH1+RNF220+ subtype comprising 74% of thalamic excitatory neurons, and astrocyte subtypes such as neocortex-enriched GRM3+DPP10+ and thalamus-enriched LUZP2+DCLK1+ astrocytes.
- In AD, one HC-specific (CA1 pyramidal) and four EC-specific excitatory subtypes were significantly less abundant (OR = 0.38–0.66); vulnerable subtypes shared Reelin signalling and heparan sulfate proteoglycan genes, and Reelin+ EC neuron depletion was validated by RNAscope and in App-KI and Tau(P301S) mice.
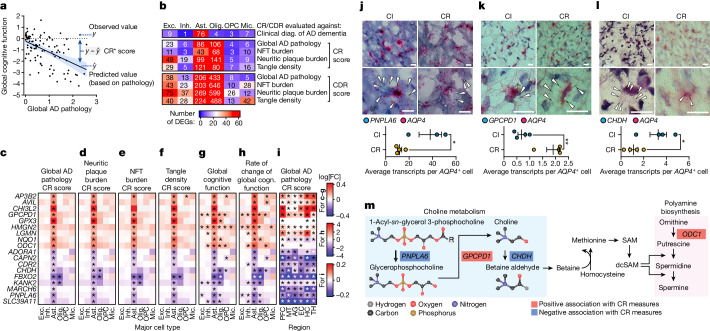
- Astrocytes were the only cell type with consistently high numbers of genes associated with cognitive resilience across measures; these converged on choline metabolism and polyamine biosynthesis, including positive association of GPCPD1 and negative associations of PNPLA6 and CHDH.
Methods
- Single-nucleus RNA-seq was performed on nuclei isolated from frozen post-mortem ROSMAP brain tissue across six regions; libraries used 10x Genomics Chromium 3′ v3, with Cell Ranger preprocessing, QC, SCANPY/Seurat clustering, and annotation into 76 cell types.
- Compositional differences were modelled with quasi-binomial regression; differential expression used MAST, Nebula, and Wilcoxon methods; gene modules were identified with scdemon, with additional cNMF, SCENIC, LIANA, scDRS, and muscat/edgeR analyses.
- Participants were selected from ROSMAP based on modified NIA-Reagan diagnosis and Braak stage, with 26 pathologic AD and 22 non-AD individuals, balanced by sex and matched for age and post-mortem interval.
Limitations
- The paper states that isotropic fractionation and read-depth cut-offs may bias cell recovery based on nuclear content; nuclear RNA may not fully capture microglial states or localized transcriptomic changes; and pathology burden is based on per-sample averages rather than the spatial context of each cell.
- Evident from the text: the study is an observational post-mortem design using bulk/pseudobulk pathology averages, so it cannot establish causality; the authors also note that additional individuals and data modalities will strengthen future analyses of region-specific AD alterations.
Model-written summary. Check it against the paper before relying on it.
Integrity signals
Registry
Cites
Statistics
Figures
Verification
Claims the paper makes
105 Own result · 25 Own method · 18 Own interpretation · 16 Partly supported · 10 Supported · 6 No full text of the sources · 4 Couldn’t confirm · 4 No basis given · 2 Mixed support · 1 Supported so far · 1 Not supported · accuracy not yet measured
Some cited sources support this claim and some don’t — read each source’s verdict below.
In the paper
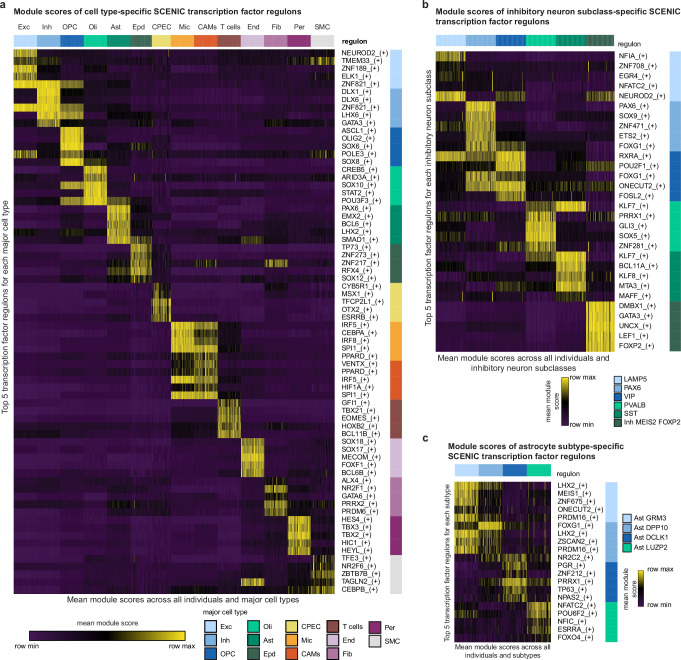
“We developed a method which accounts for these pitfalls to call multiresolution gene expression programs from single-cell data using an SVD-based approximation of zero-phase component analysis (ZCA) and gene sparsity-dependent thresholding99,100.”
§ Single-cell multiregion dissection of Alzheimer’s disease > Methods > Gene expression and regulon modules
What the sources say
- Disputedcites [99] Wainberg, M. et al. A genome-wide atlas of co-essential modules assigns function to uncharacterized genes. Nat. Genet. 53, 638–649 (2021). sourceExperimental — accuracy not yet measured
The Results and Methods (pages not given) describe a method based on generalized least squares for co-essentiality analysis of CRISPR screens across cancer cell lines, not a method for calling single-cell gene-expression programs using ZCA and sparsity-dependent thresholding. The cited paper addresses cell-line nonindependence and inflated P values, which are different from the specific pitfalls and approach described in the claim. (LLM, conf=0.87)
Checked by a reasoning model — may be wrong.
- Partly supportedcites [100] Bell, A. J. & Sejnowski, T. J. The ‘independent components’ of natural scenes are edge filters. Vision Res. 37, 3327–3338 (1997). sourceExperimental — accuracy not yet measured
The section on the symmetrical (local) solution (page unavailable) describes ZCA as a zero-phase whitening transform, and Methods reports using it on natural-scene images. The cited paper does not describe an SVD-based approximation, single-cell gene-expression programs, cell-type composition, or gene sparsity-dependent thresholding. The citing sentence says the citing authors developed that broader method; this source supports only its ZCA component. (LLM, conf=0.86)
plaindirect- Asserted: passes — The authors put it forward as true.
- Checkable: passes — It can be checked against evidence.
- Load-bearing: passes — The paper’s conclusions depend on it.
- Based: passes — The paper gives a reason why it holds.
- Rests on an assumption: Single-cell data often contain an unbalanced composition of cell types, so modules computed using gene–gene correlations will be dominated by the most common cell type markers and pathways.
- Rests on an assumption: Correlation values will often be inflated for pairs of sparsely expressed genes.
- Disputed
The cited sources that could be checked couldn’t confirm or dispute this claim.
In the paper
“but the cellular pathways that underlie its pathological progression across brain regions remain poorly understood1–3.”
§ Single-cell multiregion dissection of Alzheimer’s disease > Abstract
What the sources say
- Not checked — no full text of the sourcecites [1] Braak, H. & Braak, E. Staging of Alzheimer’s disease-related neurofibrillary changes. Neurobiol. Aging 16, 271–278 (1995). source
- Could not verifycites [2] Wilson, R. S. et al. Temporal course and pathologic basis of unawareness of memory loss in dementia. Neurology 85, 984–991 (2015). sourceExperimental — accuracy not yet measured
The Neuropathologic examination section measures dementia-related pathology in several brain regions, while the Discussion links pathology to declining awareness of memory loss. Neither addresses whether the cellular pathways driving Alzheimer’s pathological progression across regions are poorly understood (searched for cellular pathways and mechanisms of regional progression). Page numbers were not available in our copy. (LLM, conf=0.72)
- Could not verifycites [3] Stern, Y. et al. Whitepaper: defining and investigating cognitive reserve, brain reserve, and brain maintenance. Alzheimers Dement. 133, 484–491 (2020). sourceExperimental — accuracy not yet measured
The Research Considerations sections discuss cellular-level mechanisms of brain maintenance and reserve, and how to study changes in Alzheimer’s pathology. They do not address whether the cellular pathways driving pathological progression across brain regions are poorly understood. Searches for that phrase and for mechanisms of pathology spreading across regions found no passage on the claim. (LLM, conf=0.72)
plain- Asserted: passes — The authors put it forward as true.
- Checkable: passes — It can be checked against evidence.
- Load-bearing: passes — The paper’s conclusions depend on it.
- Based: passes — The paper gives a reason why it holds.
The cited sources support only part of this claim — read each source’s verdict below.
In the paper
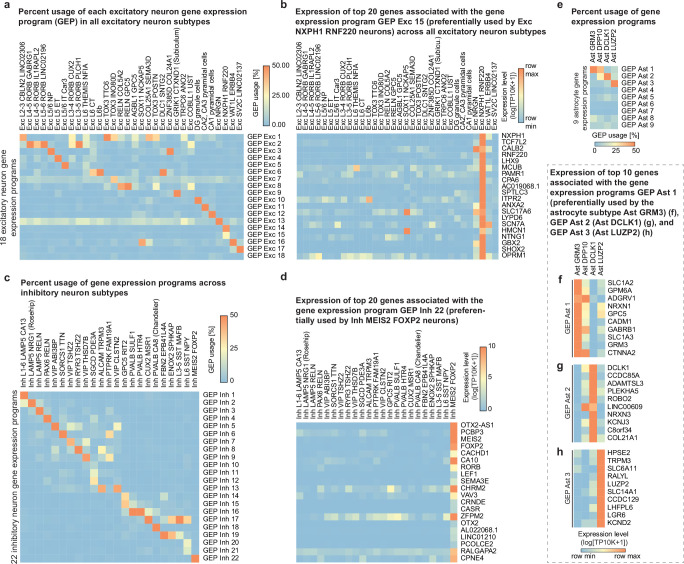
“These genes were in a single inhibitory program (Inh-22, from NMF) that included the SCENIC-predicted subtype regulators FOXP2 and LEF134,36”
§ Single-cell multiregion dissection of Alzheimer’s disease > Neuronal diversity across brain regions
What the sources say
- Could not verifycites [34] Kotliar, D. et al. Identifying gene expression programs of cell-type identity and cellular activity with single-cell RNA-Seq. eLife 8, e43803 (2019). sourceExperimental — accuracy not yet measured
The Results section describes cNMF-derived gene-expression programs in mouse visual-cortex neurons, but does not identify an Inh-22 program or link FOXP2 and LEF1 to one. Searches for “Inh-22,” “FOXP2 LEF1,” and “SCENIC” found no passage in our copy addressing that specific claim; page numbers are unavailable. (LLM, conf=0.72)
- Supportedcites [36] Aibar, S. et al. SCENIC: single-cell regulatory network inference and clustering. Nat. Methods 14, 1083–1086 (2017). source
The Abstract (page not provided) identifies SCENIC as a method for inferring regulatory networks and identifying potential regulators by cell type. This supports the citation’s identification of the method used for the citing authors’ predictions; the sentence does not attribute the Inh-22 program or its FOXP2 and LEF1 findings to this source. (LLM, conf=0.88)
plaincorrelational- Asserted: passes — The authors put it forward as true.
- Checkable: passes — It can be checked against evidence.
- Load-bearing: unclear — It is unclear whether the paper’s conclusions depend on it.
- Based: passes — The paper gives a reason why it holds.
- Rests on an assumption: Gene module expression scores reflect functional biological programs.
- Could not verify
The cited sources support only part of this claim — read each source’s verdict below.
In the paper
“Although some brain regions relevant to AD have been studied individually at scale or jointly in samples from a few individuals8–16, a comprehensive molecular characterization of region-specific differences in AD is currently lacking”
§ Single-cell multiregion dissection of Alzheimer’s disease > Main
What the sources say
- Supportedcites [8] Hawrylycz, M. J. et al. An anatomically comprehensive atlas of the adult human brain transcriptome. Nature 489, 391–399 (2012). source
The citation range attaches to the preceding statement that brain regions have been studied jointly in samples from a few individuals, not to the citing authors’ conclusion that a comprehensive AD characterization is lacking. The source’s Global mapping of transcript distributions section describes profiling approximately 900 sites in two normal human brains; its Discussion calls this an anatomically comprehensive map from a small number of clinically unremarkable specimens. It does not characterize Alzheimer’s disease tissue. (LLM, conf=0.88)
- Supportedcites [9] Habib, N. et al. Massively parallel single-nucleus RNA-seq with DroNc-seq. Nat. Methods 14, 955–958 (2017). source
The citation is attached to the statement that brain regions were studied jointly in samples from a few individuals, not to the concluding statement about what is lacking in Alzheimer’s disease research. The paper reports profiling human hippocampus and prefrontal cortex samples from five adults (Abstract; Online Methods, Experimental Procedures), so it supports the cited example. (LLM, conf=0.93)
- Supportedcites [10] Lake, B. B. et al. Integrative single-cell analysis of transcriptional and epigenetic states in the human adult brain. Nat. Biotechnol. 36, 70–80 (2018). source
The citation range is attached to the preceding clause about brain regions studied jointly in samples from a few individuals, not to the quoted conclusion about what is lacking in AD research. The Results section, “Single-Cell Interrogation of Human Cortex and Cerebellum” (page unavailable), reports profiling visual cortex, frontal cortex and cerebellum from six individuals, supporting that cited example. The paper does not itself establish the citing authors’ subsequent conclusion about AD-specific characterization. (LLM, conf=0.88)
- Not checked — no full text of the sourcecites [11] Grubman, A. et al. A single-cell atlas of entorhinal cortex from individuals with Alzheimer’s disease reveals cell-type-specific gene expression regulation. Nat. Neurosci. 22, 2087–2097 (2019). source
- Could not verifycites [12] Mathys, H. et al. Single-cell transcriptomic analysis of Alzheimer’s disease. Nature 570, 332–337 (2019). sourceExperimental — accuracy not yet measured
The Abstract says that AD’s molecular and cellular complexity remains poorly understood, and the section on single-nucleus profiling describes an analysis of prefrontal cortex. Neither passage addresses whether a comprehensive molecular characterization of differences between brain regions was lacking; searches for brain regions and regional comparisons found no such statement. (LLM, conf=0.72)
- Supportedcites [13] Franjic, D. et al. Transcriptomic taxonomy and neurogenic trajectories of adult human, macaque, and pig hippocampal and entorhinal cells. Neuron 110, 452–469 (2022). source
The citation range is attached to the sentence’s first clause, which identifies studies of AD-relevant brain regions, rather than to the citing authors’ conclusion that a comprehensive characterization is lacking. The source’s Results section (page not provided) reports molecular profiling of five hippocampal–entorhinal subregions from six adult human donors, so it is an example of the limited-region studies described in that clause. (LLM, conf=0.88)
- Could not verifycites [14] Siletti, K. et al. Transcriptomic diversity of cell types across the adult human brain. Science 382, eadd7046 (2023). sourceExperimental — accuracy not yet measured
The paper describes a transcriptomic survey across the adult human brain in three postmortem donors (opening summary; page unavailable). Its Methods specify donors with no known neurological conditions. The passages do not assess whether a comprehensive molecular characterization of region-specific differences in Alzheimer’s disease was lacking (searched: Alzheimer’s disease, AD, and region-specific molecular characterization). (LLM, conf=0.75)
- Supportedcites [15] Gabitto, M. I. et al. Integrated multimodal cell atlas of Alzheimer’s disease. Preprint at bioRxiv https://doi.org/10.1101/2023.05.08.539485 (2023). source
The Introduction says earlier single-cell AD studies have not produced a coherent understanding of cellular vulnerabilities and molecular mechanisms. The Discussion notes that this study examined only the middle temporal gyrus and calls for studies across brain regions within individuals to define their commonalities. Together, these passages support the stated gap in region-specific molecular characterization. (LLM, conf=0.88)
- Partly supportedcites [16] Sziraki, A. et al. A global view of aging and Alzheimer’s pathogenesis-associated cell population dynamics and molecular signatures in human and mouse brains. Nat. Genet. 55, 2104–2116 (2023). sourceExperimental — accuracy not yet measured
The Main section says prior studies sampled brain cell populations relatively shallowly, supporting a general gap in comprehensive characterization. The Results section identifies region-specific AD gene signatures in two human brain regions, but the paper does not explicitly say that a comprehensive molecular characterization of region-specific differences in AD is currently lacking. No page numbers are available in our copy. (LLM, conf=0.77)
plain- Asserted: passes — The authors put it forward as true.
- Checkable: passes — It can be checked against evidence.
- Load-bearing: passes — The paper’s conclusions depend on it.
- Based: passes — The paper gives a reason why it holds.
- Supported
The cited sources support only part of this claim — read each source’s verdict below.
In the paper
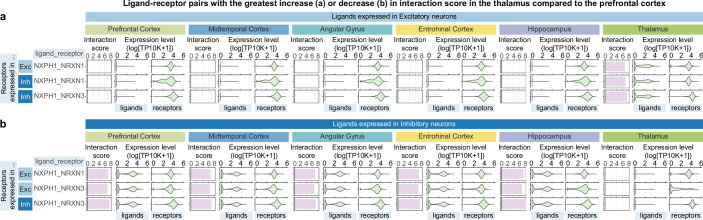
“Notably, the thalamic MEIS2+FOXP2+ interneurons shared multiple markers with neocortical GRM3 astrocytes, including GRM3, MEIS2 and VAV339,40,43”
§ Single-cell multiregion dissection of Alzheimer’s disease > Glial diversity annotated by gene modules
What the sources say
- Could not verifycites [39] Saunders, A. et al. Molecular diversity and specializations among the cells of the adult mouse brain. Cell 174, 1015–1030 (2018). sourceExperimental — accuracy not yet measured
The Results section on basal ganglia neuron types (page not provided) mentions thalamic cells and Foxp2-expressing pallidal neurons, but does not compare thalamic interneurons with neocortical astrocytes. Searches for GRM3, MEIS2, VAV3, and the proposed shared-marker combination found no passage in our copy establishing that comparison. (LLM, conf=0.75)
- Partly supportedcites [40] Zeisel, A. et al. Molecular architecture of the mouse nervous system. Cell 174, 999–1014 (2018). sourceExperimental — accuracy not yet measured
The Results section “Central Nervous Systems Neurons” (page unavailable) reports that thalamic inhibitory neurons express Meis2. “Astroependymal Cells Are Diverse and Spatially Patterned” (page unavailable) identifies astrocytes in the cerebral cortex. Neither passage establishes a MEIS2+FOXP2+ interneuron population sharing GRM3, MEIS2, and VAV3 with neocortical GRM3 astrocytes; searches for those genes and the proposed comparison found no such statement in our copy. (LLM, conf=0.80)
- Could not verifycites [43] Yao, Z. et al. A taxonomy of transcriptomic cell types across the isocortex and hippocampal formation. Cell 184, 3222–3241 (2021). sourceExperimental — accuracy not yet measured
The Results section on the transcriptomic cell type taxonomy identifies Meis2 GABAergic neurons and astrocyte clusters, but does not describe thalamic MEIS2+FOXP2+ interneurons sharing markers with neocortical GRM3 astrocytes. Searches for GRM3, MEIS2, VAV3, FOXP2, and their proposed overlap found no passage establishing the claim. (LLM, conf=0.72)
plaincorrelational- Asserted: passes — The authors put it forward as true.
- Checkable: passes — It can be checked against evidence.
- Load-bearing: unclear — It is unclear whether the paper’s conclusions depend on it.
- Based: passes — The paper gives a reason why it holds.
- Rests on an assumption: Cell type clusters annotated from transcriptomes correspond to bona fide biological cell types.
- Could not verify
Every source the paper cites for this claim was checked and supports it.
In the paper
“we performed single-nucleus RNA-sequencing (snRNA-seq) analysis of nuclei isolated from 283 post-mortem brain samples across six brain regions from 48 participants in the Religious Order Study (ROS) or the Rush Memory and Aging Project (MAP)28”
§ Single-cell multiregion dissection of Alzheimer’s disease > A multiregion atlas of AD
What the sources say
- Supportedcites [28] Bennett, D. A. et al. Religious orders study and rush memory and aging project. J. Alzheimers Dis. 64, S161–S189 (2018). source
The citation identifies the participant cohorts, rather than attributing the citing authors’ snRNA-seq analysis or its sample counts to this source. The Introduction identifies ROS and MAP together as ROSMAP, and the Materials > Participants section describes their participants and brain donation. (LLM, conf=0.91)
plainn = 48- Asserted: passes — The authors put it forward as true.
- Checkable: passes — It can be checked against evidence.
- Load-bearing: passes — The paper’s conclusions depend on it.
- Based: passes — The paper gives a reason why it holds.
- Rests on an assumption: Single-nucleus RNA-sequencing of post-mortem nuclei accurately reflects the cellular composition and transcriptomes of the human brain regions sampled.
- Rests on an assumption: The 48 individuals and 283 samples are representative of the broader aged human population with and without Alzheimer’s disease.
- Supported
The cited sources support only part of this claim — read each source’s verdict below.
In the paper
“Hippocampal subtypes included neurons from the highly structured CA1 and CA2/CA3 subfields and dentate gyrus and the more entorhinal-proximal subiculum and para/presubiculum areas9.”
§ Single-cell multiregion dissection of Alzheimer’s disease > Neuronal diversity across brain regions
What the sources say
- Partly supportedcites [9] Habib, N. et al. Massively parallel single-nucleus RNA-seq with DroNc-seq. Nat. Methods 14, 955–958 (2017). sourceExperimental — accuracy not yet measured
The paper’s section labelled Abstract (page unavailable in our copy) reports hippocampal clusters associated with CA1 and CA3 and describes subtypes of CA pyramidal neurons. It does not identify CA2, dentate gyrus, subiculum, or para/presubiculum neuronal subtypes, or describe the latter areas as more entorhinal-proximal. (LLM, conf=0.85)
plain- Asserted: passes — The authors put it forward as true.
- Checkable: passes — It can be checked against evidence.
- Load-bearing: unclear — It is unclear whether the paper’s conclusions depend on it.
- Based: passes — The paper gives a reason why it holds.
- Rests on an assumption: Cell type clusters annotated from transcriptomes correspond to bona fide biological cell types.
- Partly supported
The cited sources support only part of this claim — read each source’s verdict below.
In the paper
“Several CR-associated genes, including GPX3, HMGN2, NQO1 and ODC1 (encoding a rate-limiting enzyme of polyamine biosynthesis), possess or promote antioxidant activities61–66 (Fig. 5c–f and Supplementary Fig. 43a–d).”
§ Single-cell multiregion dissection of Alzheimer’s disease > Astrocytes and cognitive resilience
What the sources say
- Not checked — no full text of the sourcecites [61] Liu, K. et al. Nuclear protein HMGN2 attenuates pyocyanin-induced oxidative stress via Nrf2 signaling and inhibits Pseudomonas aeruginosa internalization in A549 cells. Free Radic. Biol. Med. 108, 404–417 (2017). source
- Not checked — no full text of the sourcecites [62] Stringer, J. L. et al. Presence and induction of the enzyme NAD(P)H: quinone oxidoreductase 1 in the central nervous system. J. Comp. Neurol. https://doi.org/10.1002/cne.20048 (2004). source
- Supportedcites [63] Jaber, S. M. et al. Idebenone has distinct effects on mitochondrial respiration in cortical astrocytes as compared to cortical neurons due to differential NQO1 activity. J. Neurosci. https://doi.org/10.1523/JNEUROSCI.1632-17.2020 (2020). source
The Introduction identifies NQO1 as an enzyme regulated by the Nrf2 antioxidant-response pathway and says it reduces idebenone to idebenol. The Discussion describes reduced idebenone as an antioxidant. Within the citation cluster, this supports the NQO1 example; the paper is not being cited for the other listed genes. (LLM, conf=0.86)
- Supportedcites [64] Ross, D. & Siegel, D. The diverse functionality of NQO1 and its roles in redox control. Redox Biol. 41, 101950 (2021). source
The “NQO1 and aging” section states that caloric restriction upregulates NQO1 and confers protection against oxidative stress. It supports the NQO1 portion of the statement, for which this source is cited among several references. (LLM, conf=0.92)
- Partly supportedcites [65] Huang, J. et al. Spermidine exhibits protective effects against traumatic brain injury. Cell. Mol. Neurobiol. https://doi.org/10.1007/s10571-019-00783-4 (2020). sourceExperimental — accuracy not yet measured
The Introduction identifies ODC1 as the rate-limiting enzyme in spermidine biosynthesis, and the Results implicate the ODC1–spermidine pathway in recovery after brain injury. The passages do not establish that ODC1 possesses or promotes antioxidant activity; this paper also does not address the other named genes. (LLM, conf=0.83)
- Not checked — no full text of the sourcecites [66] Madeo, F., Eisenberg, T., Pietrocola, F. & Kroemer, G. Spermidine in health and disease. Science 29, 1243–1252 (2018). source
plaindirect- Asserted: passes — The authors put it forward as true.
- Checkable: passes — It can be checked against evidence.
- Load-bearing: passes — The paper’s conclusions depend on it.
- Based: passes — The paper gives a reason why it holds.
Every source the paper cites for this claim was checked and supports it.
In the paper
“Finally, we noticed that the glycolysis pathway genes were maximally expressed at different points in global AD progression for each region (pathology diagnosis by ABC score)29,30.”
§ Single-cell multiregion dissection of Alzheimer’s disease > Pathology-specific expression changes
What the sources say
- Supportedcites [29] Agrawal, S. et al. Brain autopsies of critically ill COVID-19 patients demonstrate heterogeneous profile of acute vascular injury, inflammation and age-linked chronic brain diseases. Acta Neuropathol. Commun. 10, 186 (2022). source
The citation follows the parenthetical about pathological AD diagnosis, while the glycolysis finding is presented as the citing authors’ own observation. The source’s Methods (Neurodegenerative pathology; page unavailable) describe classifying AD pathology using Thal phases, Braak staging, and CERAD assessments under NIA-AA criteria—the components of ABC scoring. It does not report glycolysis-gene expression. (LLM, conf=0.83)
- Supportedcites [30] Hyman, B. T. et al. National Institute on Aging—Alzheimer’s Association guidelines for the neuropathologic assessment of Alzheimer’s disease. Alzheimers Dement. 8, 1–13 (2012). source
The citing authors present the region-specific glycolysis finding as their own observation; this citation supports the parenthetical identification of the ABC score as a pathology measure. The source’s AD Neuropathologic Change—Classification section defines the ABC score using amyloid plaques, neurofibrillary tangles, and neuritic plaques; Reporting describes its use to assign levels of AD neuropathologic change. (LLM, conf=0.91)
plaincorrelational- Asserted: passes — The authors put it forward as true.
- Checkable: passes — It can be checked against evidence.
- Load-bearing: passes — The paper’s conclusions depend on it.
- Based: passes — The paper gives a reason why it holds.
- Supported
The cited sources support only part of this claim — read each source’s verdict below.
In the paper
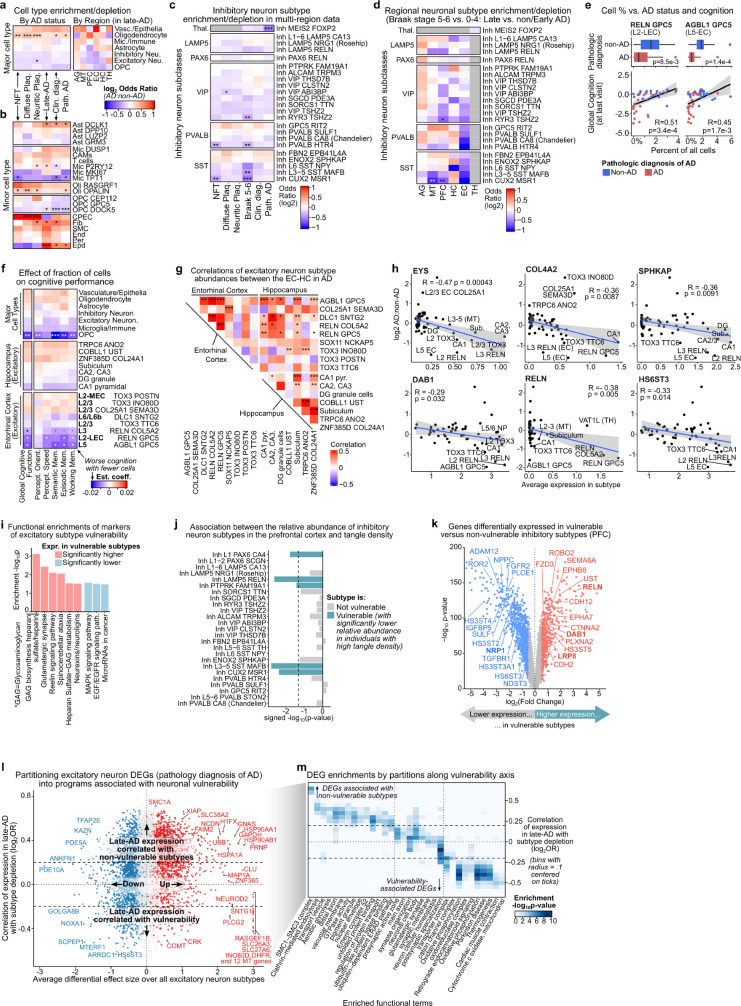
“We identified five excitatory neuron subtypes that were reduced in patients with AD (vulnerable subtypes) in the early-affected EC and HC1,17,18, including EC layer II (L2), RORB-positive L5 (AGBL1+GPC5+)19 and hippocampal CA1 subfield neurons20–23.”
§ Single-cell multiregion dissection of Alzheimer’s disease > Discussion
What the sources say
- Not checked — no full text of the sourcecites [1] Braak, H. & Braak, E. Staging of Alzheimer’s disease-related neurofibrillary changes. Neurobiol. Aging 16, 271–278 (1995). source
- Supportedcites [17] Chin, J. et al. Reelin depletion in the entorhinal cortex of human amyloid precursor protein transgenic mice and humans with Alzheimer’s disease. J. Neurosci. 27, 2727–2733 (2007). source
The citation is attached to the description of the entorhinal cortex (EC) and hippocampus (HC) as early-affected regions, not to the citing authors’ identification of five subtypes. The Introduction describes EC layer II glutamatergic neurons as affected early and severely by AD and the hippocampus as very vulnerable to AD. (LLM, conf=0.90)
- Supportedcites [18] Kobro-Flatmoen, A. et al. Re-emphasizing early Alzheimer’s disease pathology starting in select entorhinal neurons, with a special focus on mitophagy. Ageing Res. Rev. 67, 101307 (2021). source
The citation is attached to the description of the entorhinal cortex (EC) and hippocampus (HC) as early-affected regions, not to the citing authors’ identification of five subtypes. Section 2.1 says EC degeneration occurs early in pre-clinical AD and is typically followed by degeneration in parts of the hippocampal formation. No page number is available in our copy. (LLM, conf=0.91)
- Partly supportedcites [19] Leng, K. et al. Molecular characterization of selectively vulnerable neurons in Alzheimer’s disease. Nat. Neurosci. 24, 276–287 (2021). sourceExperimental — accuracy not yet measured
The Results report that three excitatory neuron subpopulations associated with entorhinal cortex layer II declined in relative abundance early in AD. The paper studies the entorhinal cortex and superior frontal gyrus, not the hippocampus; it does not establish the claimed five subtypes across EC and HC or identify vulnerable hippocampal CA1 neurons. (LLM, conf=0.88)
- Not checked — no full text of the sourcecites [20] Kordower, J. H. et al. Loss and atrophy of layer II entorhinal cortex neurons in elderly people with mild cognitive impairment. Ann. Neurol. 49, 202–213 (2001). source
- Not checked — no full text of the sourcecites [21] Van Hoesen, G. W., Hyman, B. T. & Damasio, A. R. Entorhinal cortex pathology in Alzheimer’s disease. Hippocampus 1, 1–8 (1991). source
- Supportedcites [22] Gómez-Isla, T. et al. Profound loss of layer II entorhinal cortex neurons occurs in very mild Alzheimer’s disease. J. Neurosci. 16, 4491–4500 (1996). source
The Results report substantial loss of entorhinal cortex layer II neurons in AD, and the Discussion says this loss is evident even in very mild AD. The paper also discusses CA1 vulnerability, but the citing authors attribute their identification of five subtypes to their own study and attach other citations to the named molecular subtype and CA1 neurons. (LLM, conf=0.91)
- Not checked — no full text of the sourcecites [23] Price, J. L. et al. Neuron number in the entorhinal cortex and CA1 in preclinical Alzheimer disease. Arch. Neurol. 58, 1395–1402 (2001). source
plaincorrelational- Asserted: passes — The authors put it forward as true.
- Checkable: passes — It can be checked against evidence.
- Load-bearing: passes — The paper’s conclusions depend on it.
- Based: passes — The paper gives a reason why it holds.
- It may state two separate claims as one. 79
- Probably not a substantial claim. 37
At least one cited source doesn’t support this claim or points to a different paper, and none confirmed it — see the verdicts below.
In the paper
“In parallel, astrocytes uniquely upregulated DDIT4, PFKP and ADCY8, along with genes that suppress fatty acid metabolism (ANGPTL4) and promote lipid droplet storage of fatty acids (HILPDA), while microglia upregulated multiple glycogen-related genes (GBE1, UGP2 and PYGL)48 (Fig. 4m).”
§ Single-cell multiregion dissection of Alzheimer’s disease > Pathology-specific expression changes
What the sources say
- Disputedcites [48] Zhou, Y. et al. Human and mouse single-nucleus transcriptomics reveal TREM2-dependent and TREM2-independent cellular responses in Alzheimer’s disease. Nat. Med. 26, 131–142 (2020). sourceExperimental — accuracy not yet measured
Split into 2 atoms — 0 confirmed, 0 partially supported, 1 disputed, 0 misattributed, 1 unverifiable. Expand the claim to see per-atom verdicts.
Checked by a reasoning model — may be wrong.
plaincorrelational- Asserted: passes — The authors put it forward as true.
- Checkable: passes — It can be checked against evidence.
- Load-bearing: passes — The paper’s conclusions depend on it.
- Based: passes — The paper gives a reason why it holds.
It may state two separate claims as one.
- Disputed
Some cited sources support this claim and some don’t — read each source’s verdict below.
In the paper
“AD DEGs were consistent with published results both for region-specific DEGs and for DEGs computed jointly over all regions for multiple AD variables, and were further corroborated by comparisons with various independent studies11,12,15,19,47–53”
§ Single-cell multiregion dissection of Alzheimer’s disease > Regional expression differences in AD
What the sources say
- Not checked — no full text of the sourcecites [11] Grubman, A. et al. A single-cell atlas of entorhinal cortex from individuals with Alzheimer’s disease reveals cell-type-specific gene expression regulation. Nat. Neurosci. 22, 2087–2097 (2019). source
- Partly supportedcites [12] Mathys, H. et al. Single-cell transcriptomic analysis of Alzheimer’s disease. Nature 570, 332–337 (2019). sourceExperimental — accuracy not yet measured
The differential-expression results section reports that bulk RNA-seq from the ROSMAP cohort validated the paper’s single-nucleus DEGs, and notes that an APOE finding was consistent with published model studies. But the study profiled one region—prefrontal cortex (Brodmann area 10)—and does not establish agreement for both region-specific and jointly analyzed multi-region DEGs across multiple AD variables, or comparisons with various independent studies. (LLM, conf=0.86)
- Disputedcites [15] Gabitto, M. I. et al. Integrated multimodal cell atlas of Alzheimer’s disease. Preprint at bioRxiv https://doi.org/10.1101/2023.05.08.539485 (2023). sourceExperimental — accuracy not yet measured
The Discussion (page unavailable) describes a “near complete lack of overlap” in gene-expression results across studies and says differences in brain regions preclude proper comparisons with this temporal-cortex analysis. It notes that some individual effects were recapitulated, but does not report the claimed consistency of region-specific and jointly computed, all-region AD DEGs across multiple variables. (LLM, conf=0.85)
Checked by a reasoning model — may be wrong.
- Partly supportedcites [19] Leng, K. et al. Molecular characterization of selectively vulnerable neurons in Alzheimer’s disease. Nat. Neurosci. 24, 276–287 (2021). sourceExperimental — accuracy not yet measured
The Results (page unavailable) report that synapse-related DEGs in entorhinal-cortex excitatory neurons were consistent with findings from two earlier studies. Our copy does not support the more specific claim about DEGs computed jointly across all regions for multiple AD variables, or corroboration of those DEGs against various independent studies. (LLM, conf=0.84)
- Partly supportedcites [47] Lau, S.-F., Cao, H., Fu, A. K. Y. & Ip, N. Y. Single-nucleus transcriptome analysis reveals dysregulation of angiogenic endothelial cells and neuroprotective glia in Alzheimer’s disease. Proc. Natl Acad. Sci. USA 117, 25800–25809 (2020). sourceExperimental — accuracy not yet measured
The Results section, “Cross-Study Validation of the Transcriptomic Changes in AD Brains” (page unavailable), reports concordance between the paper’s AD DEGs and independent prefrontal- and temporal-cortex datasets, as well as another single-nucleus study. It does not report DEGs computed jointly over all brain regions for multiple AD variables, so that part of the attributed claim is unsupported. (LLM, conf=0.86)
- Partly supportedcites [48] Zhou, Y. et al. Human and mouse single-nucleus transcriptomics reveal TREM2-dependent and TREM2-independent cellular responses in Alzheimer’s disease. Nat. Med. 26, 131–142 (2020). sourceExperimental — accuracy not yet measured
The Discussion (page unavailable) reports partial agreement between this paper’s AD gene signatures and a published study, and Extended Data Fig. 10 describes corroboration across independent cohorts. The paper does not establish consistency for both region-specific DEGs and DEGs computed jointly across all regions for multiple AD variables. (LLM, conf=0.82)
- Partly supportedcites [49] Su, Y. et al. A single-cell transcriptome atlas of glial diversity in the human hippocampus across the postnatal lifespan. Cell Stem Cell 29, 1594–1610 (2022). sourceExperimental — accuracy not yet measured
The Results section (page unavailable) compares hippocampal AD DEGs with several published cortex studies and reports region-specific differences, supporting the claim that independent studies were consulted. It does not report DEGs computed jointly across all regions for multiple AD variables; it also says few DEGs were shared across regions and that variable findings in prior studies need confirmation. (LLM, conf=0.85)
- Partly supportedcites [50] Morabito, S. et al. Single-nucleus chromatin accessibility and transcriptomic characterization of Alzheimer’s disease. Nat. Genet. 53, 1143–1155 (2021). sourceExperimental — accuracy not yet measured
The Results section, ‘Multi-omic characterization of AD cellular heterogeneity’ (page unavailable), reports late-stage AD DEGs by cell cluster and notes that NEAT1 upregulation agrees with a previous finding. This makes the paper a relevant independent AD DEG study, but our copy does not establish consistency with the citing authors’ region-specific and jointly computed DEGs across multiple AD variables. (LLM, conf=0.78)
- Partly supportedcites [51] Johnson, E. C. B. et al. Large-scale proteomic analysis of Alzheimer’s disease brain and cerebrospinal fluid reveals early changes in energy metabolism associated with microglia and astrocyte activation. Nat. Med. 26, 769–780 (2020). sourceExperimental — accuracy not yet measured
The Results sections on regional preservation and network validation report similar AD-related protein co-expression patterns across brain regions and confirmation in an independent cohort (page not provided). The paper does not establish that region-specific or jointly computed differentially expressed genes (DEGs) agree with published DEG results; its analyses concern proteins rather than those gene-level comparisons. (LLM, conf=0.78)
- Partly supportedcites [52] Zeng, H. et al. Integrative in situ mapping of single-cell transcriptional states and tissue histopathology in a mouse model of Alzheimer’s disease. Nat. Neurosci. 26, 430–446 (2023). sourceExperimental — accuracy not yet measured
The Results sections on microglia and astrocytes report correspondence between disease-associated cell populations and previously published human and mouse AD datasets. That supports a limited comparison with independent studies, but the cited paper does not establish that region-specific DEGs and DEGs pooled across all regions were consistent with published results for multiple AD variables. Page numbers were not available in our copy. (LLM, conf=0.82)
plaincorrelational- Asserted: passes — The authors put it forward as true.
- Checkable: passes — It can be checked against evidence.
- Load-bearing: unclear — It is unclear whether the paper’s conclusions depend on it.
- Based: passes — The paper gives a reason why it holds.
It may state two separate claims as one.
The cited sources support only part of this claim — read each source’s verdict below.
In the paper
“Tangles are first seen in the entorhinal cortex (EC) (Braak stages I–II), then the hippocampus and thalamus (Braak stages III–IV) and finally the neocortex (Braak stages V–VI), a sequence that is typically synchronous with cognitive decline from mild cognitive impairment to severe dementia1,2,4–7.”
§ Single-cell multiregion dissection of Alzheimer’s disease > Main
What the sources say
- Not checked — no full text of the sourcecites [1] Braak, H. & Braak, E. Staging of Alzheimer’s disease-related neurofibrillary changes. Neurobiol. Aging 16, 271–278 (1995). source
- Partly supportedcites [2] Wilson, R. S. et al. Temporal course and pathologic basis of unawareness of memory loss in dementia. Neurology 85, 984–991 (2015). sourceExperimental — accuracy not yet measured
Split into 2 atoms — 0 confirmed, 1 partially supported, 0 disputed, 0 misattributed, 1 unverifiable. Expand the claim to see per-atom verdicts.
- Not checked — no full text of the sourcecites [4] Sonnen, J. A. et al. Pathological correlates of dementia in a longitudinal, population-based sample of aging. Ann. Neurol. 62, 406–413 (2007). source
- Not checked — no full text of the sourcecites [5] Bennett, D. A. et al. Natural history of mild cognitive impairment in older persons. Neurology 59, 198–205 (2002). source
- Not checked — no full text of the sourcecites [6] Bennett, D. A., Schneider, J. A., Wilson, R. S., Bienias, J. L. & Arnold, S. E. Neurofibrillary tangles mediate the association of amyloid load with clinical Alzheimer disease and level of cognitive function. Arch. Neurol. 61, 378–384 (2004). source
- Not checked — no full text of the sourcecites [7] Braak, H. & Braak, E. Alzheimer’s disease affects limbic nuclei of the thalamus. Acta Neuropathol. 81, 261–268 (1991). source
plaincorrelational- Asserted: passes — The authors put it forward as true.
- Checkable: passes — It can be checked against evidence.
- Load-bearing: fails — The paper’s conclusions may not depend on it.
- Based: passes — The paper gives a reason why it holds.
Probably not a substantial claim. The paper’s conclusions may not depend on it. It may state two separate claims as one.
The cited sources support only part of this claim — read each source’s verdict below.
In the paper
“Region-specific astrocyte subtypes were experimentally validated using RNA in situ hybridization (Fig. 2d) and confirmed by analysing a separate snRNA-seq dataset14”
§ Single-cell multiregion dissection of Alzheimer’s disease > Glial diversity annotated by gene modules
What the sources say
- Partly supportedcites [14] Siletti, K. et al. Transcriptomic diversity of cell types across the adult human brain. Science 382, eadd7046 (2023). sourceExperimental — accuracy not yet measured
The main text (Fig. 6A; Fig. S9E–F; page unavailable) identifies astrocyte clusters with distinct regional distributions. But our copy does not say those astrocyte subtypes were validated by RNA in situ hybridization or confirmed using a separate snRNA-seq dataset. Its in situ hybridization passages describe other cell populations, not validation of the astrocyte clusters. (LLM, conf=0.85)
plain- Asserted: passes — The authors put it forward as true.
- Checkable: passes — It can be checked against evidence.
- Load-bearing: passes — The paper’s conclusions depend on it.
- Based: passes — The paper gives a reason why it holds.
It may state two separate claims as one.
- Partly supported
The cited sources support only part of this claim — read each source’s verdict below.
In the paper
“We found that the thalamic–neocortex separation is conserved in mice and recapitulated both this divide and thalamic marker genes in independent single-cell, bulk and microarray data in both mice and humans8,39,40,43”
§ Single-cell multiregion dissection of Alzheimer’s disease > Neuronal diversity across brain regions
What the sources say
- Partly supportedcites [8] Hawrylycz, M. J. et al. An anatomically comprehensive atlas of the adult human brain transcriptome. Nature 489, 391–399 (2012). sourceExperimental — accuracy not yet measured
The ‘Global transcriptional architecture of the adult brain’ section reports distinct regional expression patterns in human microarray data, including a module specific to part of the thalamus and other modules enriched in neocortex. It does not establish the claimed thalamic–neocortical separation in mice or its recapitulation across independent single-cell and bulk datasets. Page numbers were not available in our copy. (LLM, conf=0.78)
- Supportedcites [39] Saunders, A. et al. Molecular diversity and specializations among the cells of the adult mouse brain. Cell 174, 1015–1030 (2018). source
The Results section, “Isolation and Molecular Analysis of Cells for an Adult Brain Cell Atlas” (page unavailable), identifies this work as an adult-mouse single-cell RNA-expression dataset spanning nine brain regions. The Results also discuss thalamic neurons and cortical cells. In this multi-citation sentence, the paper supports the mouse single-cell dataset used for the citing authors’ replication; the replication itself is the citing authors’ finding, and the human, bulk, and microarray datasets are not attributed to this source alone. (LLM, conf=0.85)
- Partly supportedcites [40] Zeisel, A. et al. Molecular architecture of the mouse nervous system. Cell 174, 999–1014 (2018). sourceExperimental — accuracy not yet measured
The Results sections on astroependymal cells and CNS neurons describe a molecular distinction between mouse telencephalic regions, including cortex, and the diencephalon, including thalamus. The paper also compares its mouse single-cell clusters with previously published datasets. Our copy does not report that the thalamic–neocortex divide was recapitulated across independent single-cell, bulk, and microarray data in both mice and humans. (LLM, conf=0.84)
- Could not verifycites [43] Yao, Z. et al. A taxonomy of transcriptomic cell types across the isocortex and hippocampal formation. Cell 184, 3222–3241 (2021). sourceExperimental — accuracy not yet measured
The Introduction (page unavailable) describes a taxonomy of adult mouse isocortex and hippocampal formation, not a thalamus–neocortex comparison. Searches for thalamic marker genes and for independent single-cell, bulk, and microarray data did not find a passage establishing the claimed separation in mice or humans. (LLM, conf=0.76)
plaincorrelational- Asserted: passes — The authors put it forward as true.
- Checkable: passes — It can be checked against evidence.
- Load-bearing: unclear — It is unclear whether the paper’s conclusions depend on it.
- Based: passes — The paper gives a reason why it holds.
It may state two separate claims as one.
- Partly supported
The cited sources support only part of this claim — read each source’s verdict below.
In the paper
“EC-specific subtypes that clustered separately from neocortical subtypes for the same layers were often marked by expression of RELN, TOX3 and GPC5, and contained subtypes from both the lateral (L2 RELN+GPC5+) and medial (L2 TOX3+POSTN+) EC41–43”
§ Single-cell multiregion dissection of Alzheimer’s disease > Neuronal diversity across brain regions
What the sources say
- Partly supportedcites [41] Franjic, D. et al. Transcriptomic taxonomy and neurogenic trajectories of adult human, macaque, and pig hippocampal and entorhinal cells. Neuron 110, 452–469.e14 (2022). sourceExperimental — accuracy not yet measured
The Results (Taxonomic relationship of neural cells across allo-, meso- and neo-cortex; page unavailable) identify EC-specific excitatory-neuron subtypes, including two layer-2 RELN-expressing subtypes that did not closely correspond to neocortical subtypes. The STAR Methods (Method details; page unavailable) also classify two layer-2 EC subtypes as RELN+. Our copy does not substantiate the claimed TOX3, GPC5 or POSTN markers, the specified marker combinations, or their lateral-versus-medial EC assignments. (LLM, conf=0.88)
- Partly supportedcites [42] Ortiz, C. et al. Molecular atlas of the adult mouse brain. Sci. Adv. 6, eabb3446 (2020). sourceExperimental — accuracy not yet measured
The Discussion (page not available) says the atlas identifies layers in the entorhinal area and proposes molecular layer definitions with subregional information. It does not report EC-specific subtypes clustering separately from neocortical subtypes for the same layers, or identify the claimed lateral and medial layer-2 subtypes by RELN, TOX3, GPC5, and POSTN. (LLM, conf=0.76)
- Partly supportedcites [43] Yao, Z. et al. A taxonomy of transcriptomic cell types across the isocortex and hippocampal formation. Cell 184, 3222–3241 (2021). sourceExperimental — accuracy not yet measured
The Results section, “Comparison of glutamatergic cell types between hippocampal formation and isocortex” (page unavailable), identifies distinct layer-2 supertypes in medial and lateral entorhinal cortex. It names them L2 IT ENTm Lef1 and L2 IT ENTl Chn2 (Grik1+), however; the searched passages do not establish the claimed RELN/GPC5 and TOX3/POSTN marker combinations or that these subtypes clustered separately from neocortical subtypes of the same layers. (LLM, conf=0.84)
plaincorrelational- Asserted: passes — The authors put it forward as true.
- Checkable: passes — It can be checked against evidence.
- Load-bearing: unclear — It is unclear whether the paper’s conclusions depend on it.
- Based: passes — The paper gives a reason why it holds.
It may state two separate claims as one.
- Rests on an assumption: Cell type clusters annotated from transcriptomes correspond to bona fide biological cell types.
- Partly supported
The cited sources that could be checked couldn’t confirm or dispute this claim.
In the paper
“Excitatory neurons in the TH were predominantly composed (74%) of a subtype (NXPH1+RNF220+) that was not observed in the neocortex and is predicted to be regulated by LHX9, SOX2, SHOX2 and TCF7L234,36”
§ Single-cell multiregion dissection of Alzheimer’s disease > Neuronal diversity across brain regions
What the sources say
- Could not verifycites [34] Kotliar, D. et al. Identifying gene expression programs of cell-type identity and cellular activity with single-cell RNA-Seq. eLife 8, e43803 (2019). sourceExperimental — accuracy not yet measured
The Results section on mouse visual cortex neurons discusses cortical activity programs, not the composition of thalamic excitatory neurons. Searches for NXPH1/RNF220, the 74% figure, and the proposed regulators found no passage in our copy addressing the claimed thalamic subtype or its absence from the neocortex. (LLM, conf=0.76)
- Could not verifycites [36] Aibar, S. et al. SCENIC: single-cell regulatory network inference and clustering. Nat. Methods 14, 1083–1086 (2017). sourceExperimental — accuracy not yet measured
The paper’s human-brain analysis describes DLX1/2-driven interneurons, and its Online Methods describe brain datasets, but neither passage addresses the claimed thalamic excitatory-neuron subtype. Searches for NXPH1, RNF220, the 74% figure, the listed regulators, and a thalamus–neocortex comparison found no supporting passage in our copy. (LLM, conf=0.76)
plaincorrelational- Asserted: passes — The authors put it forward as true.
- Checkable: passes — It can be checked against evidence.
- Load-bearing: unclear — It is unclear whether the paper’s conclusions depend on it.
- Based: passes — The paper gives a reason why it holds.
It may state two separate claims as one.
- Rests on an assumption: Cell type clusters annotated from transcriptomes correspond to bona fide biological cell types.
- Could not verify
The cited sources that could be checked couldn’t confirm or dispute this claim.
In the paper
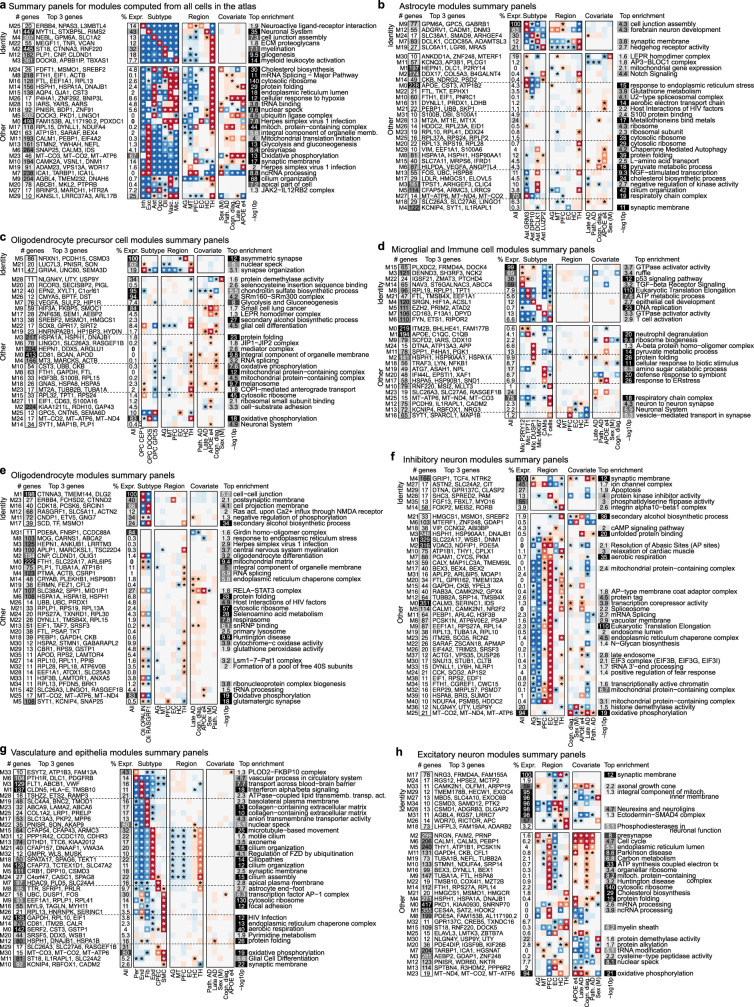
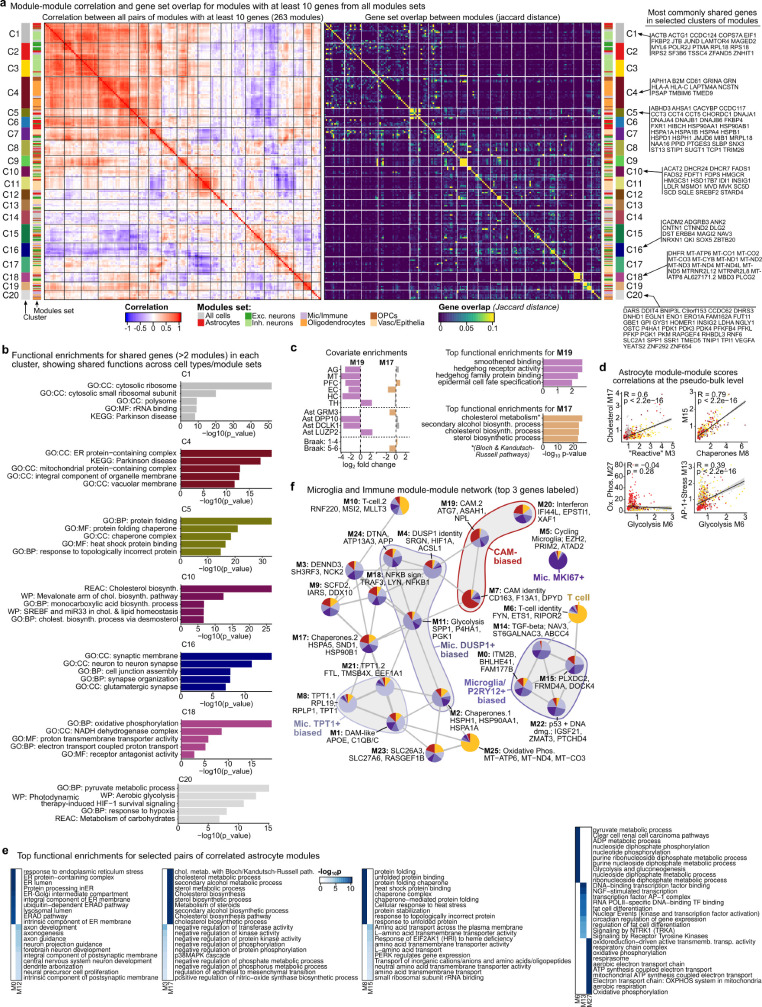
“To further examine the cellular and regional heterogeneity of the human brain, we developed a scalable method, scdemon, which uses sample decorrelation to annotate both ubiquitous and rare gene expression programs in each major cell type, and used annotated modules to identify functional programs associated with specific pathological variables, including a glycolysis- and energy-metabolism-linked”
§ Single-cell multiregion dissection of Alzheimer’s disease > Discussion
What the sources say
- Could not verifycites [48] Zhou, Y. et al. Human and mouse single-nucleus transcriptomics reveal TREM2-dependent and TREM2-independent cellular responses in Alzheimer’s disease. Nat. Med. 26, 131–142 (2020). sourceExperimental — accuracy not yet measured
Split into 2 atoms — 0 confirmed, 0 partially supported, 0 disputed, 0 misattributed, 2 unverifiable. Expand the claim to see per-atom verdicts.
- Not checked — no full text of the sourcecites [60] Magistretti, P. J. & Allaman, I. A cellular perspective on brain energy metabolism and functional imaging. Neuron 86, 883–901 (2015). source
plaincorrelational- Asserted: passes — The authors put it forward as true.
- Checkable: passes — It can be checked against evidence.
- Load-bearing: passes — The paper’s conclusions depend on it.
- Based: passes — The paper gives a reason why it holds.
It may state two separate claims as one.
- Could not verify
The cited sources support only part of this claim — read each source’s verdict below.
In the paper
“Microglia and immune cells showed consistently high scores across regions, with the top scores for the microglia TPT1+ subtype and macrophages in the HC, thalamus and AG (Extended Data Fig. 9c).”
§ Single-cell multiregion dissection of Alzheimer’s disease > Regional expression differences in AD
What the sources say
- Partly supportedcites [54] Jansen, I. E. et al. Genome-wide meta-analysis identifies new loci and functional pathways influencing Alzheimer’s disease risk. Nat. Genet. 51, 404–413 (2019). sourceExperimental — accuracy not yet measured
The Results section (‘Gene-sets implicated in AD and AD-by-proxy’; page unavailable) reports suggestive associations for immune-related tissues and microglia in two single-cell datasets. It does not report consistently high scores across brain regions or identify TPT1+ microglia and macrophages as top-scoring cells in the HC, thalamus or AG. (LLM, conf=0.84)
- Could not verifycites [55] Zhang, M. J. et al. Polygenic enrichment distinguishes disease associations of individual cells in single-cell RNA-seq data. Nat. Genet. 54, 1572–1580 (2022). sourceExperimental — accuracy not yet measured
The Results section on brain traits discusses hippocampal CA1 neurons, not high microglial or macrophage scores across the HC, thalamus and AG. Searches for TPT1, macrophages and those regions found no passage supporting the claimed ranking. This paper’s Extended Data Fig. 9c concerns metabolic pathways, not brain immune cells. (LLM, conf=0.77)
plaincorrelational- Asserted: passes — The authors put it forward as true.
- Checkable: passes — It can be checked against evidence.
- Load-bearing: passes — The paper’s conclusions depend on it.
- Based: passes — The paper gives a reason why it holds.
It may state two separate claims as one.
- Partly supported
Every source the paper cites for this claim was checked and supports it.
In the paper
“We found that AD-risk genes were highly perturbed in AD—in particular for microglia, consistent with their enrichment for GWAS signal68—but few risk genes showed region-specific expression.”
§ Single-cell multiregion dissection of Alzheimer’s disease > Discussion
What the sources say
- Supportedcites [68] Gjoneska, E. et al. Conserved epigenomic signals in mice and humans reveal immune basis of Alzheimer’s disease. Nature 518, 365–369 (2015). source
The paper reports that AD-associated GWAS variants are enriched in immune-cell enhancer regions, with CD14+ immune cells showing the strongest enrichment (Abstract; page not provided). Citation 68 is attached to the GWAS-enrichment context; the sentence presents the gene-perturbation and region-specific-expression findings as the citing authors’ own results. (LLM, conf=0.88)
plaincorrelational- Asserted: passes — The authors put it forward as true.
- Checkable: passes — It can be checked against evidence.
- Load-bearing: passes — The paper’s conclusions depend on it.
- Based: passes — The paper gives a reason why it holds.
It may state two separate claims as one.
- Supported
The cited sources that could be checked couldn’t confirm or dispute this claim.
In the paper
“DEGs linked to non-vulnerable subtypes were enriched for a diverse set of functions, including ubiquitin-ligase binding, heat-shock-family chaperones, ER protein processing and mediators of neuronal death, whereas vulnerability-associated DEGs were highly enriched only for mitochondrial oxidative phosphorylation but included CRK and NEUROD2, which are both associated with Reelin signalling17,18”
§ Single-cell multiregion dissection of Alzheimer’s disease > Vulnerable neuronal subtypes in AD
What the sources say
- Could not verifycites [17] Chin, J. et al. Reelin depletion in the entorhinal cortex of human amyloid precursor protein transgenic mice and humans with Alzheimer’s disease. J. Neurosci. 27, 2727–2733 (2007). sourceExperimental — accuracy not yet measured
Split into 2 atoms — 0 confirmed, 0 partially supported, 0 disputed, 0 misattributed, 2 unverifiable. Expand the claim to see per-atom verdicts.
- Could not verifycites [18] Kobro-Flatmoen, A. et al. Re-emphasizing early Alzheimer’s disease pathology starting in select entorhinal neurons, with a special focus on mitophagy. Ageing Res. Rev. 67, 101307 (2021). sourceExperimental — accuracy not yet measured
Split into 2 atoms — 0 confirmed, 0 partially supported, 0 disputed, 0 misattributed, 2 unverifiable. Expand the claim to see per-atom verdicts.
plaincorrelational- Asserted: passes — The authors put it forward as true.
- Checkable: passes — It can be checked against evidence.
- Load-bearing: passes — The paper’s conclusions depend on it.
- Based: passes — The paper gives a reason why it holds.
It may state two separate claims as one.
- Could not verify
Every source the paper cites for this claim was checked and supports it.
In the paper
“Notably, choline oxidation to betaine generates a labile methyl group that can be used for homocysteine remethylation, resulting in methionine formation, which is subsequently transformed into the universal methyl donor S-adenosylmethionine67.”
§ Single-cell multiregion dissection of Alzheimer’s disease > Astrocytes and cognitive resilience
What the sources say
- Supportedcites [67] Korsmo, H. W. et al. Maternal choline supplementation and high-fat feeding interact to influence DNA methylation in offspring in a time-specific manner. Front. Nutr. 9, 841787 (2022). source
The Introduction states that choline is oxidized to betaine, its labile methyl group can be used to remethylate homocysteine to methionine, and methionine is then converted to S-adenosylmethionine. This directly supports the attributed pathway. (LLM, conf=0.95)
plaindirect- Asserted: passes — The authors put it forward as true.
- Checkable: passes — It can be checked against evidence.
- Load-bearing: passes — The paper’s conclusions depend on it.
- Based: passes — The paper gives a reason why it holds.
Probably not a substantial claim. It may state two separate claims as one.
- Supported
The cited sources support only part of this claim — read each source’s verdict below.
In the paper
“We found that 74 genes (49%) were differentially expressed for at least one cell type, and multiple genes showed region-specific expression, including the lipid transporter ABCA7 (enriched in thalamus), the zinc-finger protein ZNF655 (EC) and the complement receptor CR1 (neocortex)56 (Extended Data Fig. 10).”
§ Single-cell multiregion dissection of Alzheimer’s disease > Regional expression differences in AD
What the sources say
- Partly supportedcites [56] Lambert, J.-C. et al. Genome-wide association study identifies variants at CLU and CR1 associated with Alzheimer’s disease. Nat. Genet. 41, 1094–1099 (2009). sourceExperimental — accuracy not yet measured
The GWAS discussion (page unavailable in our copy) identifies CR1 as a complement-receptor gene with suggestive evidence of association with Alzheimer’s disease. It does not report CR1 expression in neocortex or the stated regional enrichment of ABCA7 and ZNF655; searches for those genes and brain regions found no supporting passage. (LLM, conf=0.85)
plaincorrelational- Asserted: passes — The authors put it forward as true.
- Checkable: passes — It can be checked against evidence.
- Load-bearing: passes — The paper’s conclusions depend on it.
- Based: passes — The paper gives a reason why it holds.
It may state two separate claims as one.
- Partly supported
Every source the paper cites for this claim was checked and supports it.
In the paper
“ZCA is the transformation which maximizes the similarity of the transformed data to the original, which is achieved by setting W = C−1/2, where C is the covariance of X.”
§ Single-cell multiregion dissection of Alzheimer’s disease > Methods > Gene expression and regulon modules
What the sources say
- Supportedcites [101] Kessy, A., Lewin, A. & Strimmer, K. Optimal whitening and decorrelation. Am. Stat. 72, 309–314 (2018). source
Section 6.1, “ZCA-Mahalanobis whitening,” defines similarity as the squared distance between the original and whitened vectors and shows that minimizing it uniquely yields ZCA whitening. Its proof gives W = Σ⁻¹ᐟ², where Σ is the covariance matrix. (LLM, conf=0.93)
plaindirect- Asserted: passes — The authors put it forward as true.
- Checkable: passes — It can be checked against evidence.
- Load-bearing: fails — The paper’s conclusions may not depend on it.
- Based: passes — The paper gives a reason why it holds.
Probably not a substantial claim. The paper’s conclusions may not depend on it. It may state two separate claims as one.
- Supported
Every source the paper cites for this claim was checked and supports it.
In the paper
“We performed differential expression analyses using the R package muscat to identify genes associated with CR in the PFC117. Low-expressed genes were excluded and only genes with more than one count in at least ten cells were considered. To take advantage of robust bulk RNA-seq differential expression frameworks, such as edgeR118, in a first step, muscat aggregates measurements for each sample (in”
§ Single-cell multiregion dissection of Alzheimer’s disease > Methods > Differential gene expression
What the sources say
- Supportedcites [117] Crowell, H. L. et al. muscat detects subpopulation-specific state transitions from multi-sample multi-condition single-cell transcriptomics data. Nat. Commun. 11, 6077 (2020). source
The citation identifies muscat as the R package used in the citing authors’ analysis. The source’s Methods (‘Aggregation-based methods,’ page unavailable) describes muscat’s sample-by-subpopulation pseudobulk aggregation and edgeR-based testing. The PFC/CR analysis, covariates, and correction procedure describe the citing authors’ own implementation, rather than findings attributed to this source. (LLM, conf=0.88)
- Supportedcites [118] Robinson, M. D., McCarthy, D. J. & Smyth, G. K. edgeR: a Bioconductor package for differential expression analysis of digital gene expression data. Bioinformatics 26, 139–140 (2010). source
Citation 118 identifies edgeR as an example of a differential-expression framework, not as the source for the authors’ PFC analysis choices. The Introduction describes edgeR as software for replicated count-based expression data applicable to RNA-seq, and the Model section describes its differential-expression analysis. (LLM, conf=0.94)
plaincorrelationaln = 427- Asserted: passes — The authors put it forward as true.
- Checkable: passes — It can be checked against evidence.
- Load-bearing: passes — The paper’s conclusions depend on it.
- Based: passes — The paper gives a reason why it holds.
Probably not a substantial claim. It may state two separate claims as one.
- Supported
The sources with a verdict support this claim; the rest weren’t checked yet, have no full text we could read, or their verdicts aren’t rated yet.
In the paper
“Similarly, dietary supplementation with the polyamine spermidine prolongs life span and health span in several animal models66, and spermidine has also been shown to enhance memory performance and counteract age-related cognitive decline79–81.”
§ Single-cell multiregion dissection of Alzheimer’s disease > Discussion
What the sources say
- Not checked — no full text of the sourcecites [66] Madeo, F., Eisenberg, T., Pietrocola, F. & Kroemer, G. Spermidine in health and disease. Science 29, 1243–1252 (2018). source
- Supportedcites [79] Sigrist, S. J. et al. Spermidine-triggered autophagy ameliorates memory during aging. Autophagy 10, 178–179 (2014). source
The opening passage (p. 178) reports that spermidine treatment rescued age-induced memory impairment in fruit flies. A later passage (p. 178) says spermidine-fed 30-day-old flies maintained short- and intermediate-term memory performance comparable to young flies. This supports the memory claim to which this source is cited; the demonstrated effect is in flies. (LLM, conf=0.91)
- Supportedcites [80] Schroeder, S. et al. Dietary spermidine improves cognitive function. Cell Rep. 35, 108985 (2021). source
The cognition claim is the part of the sentence attributed to this source; the lifespan claim carries a separate citation. The Summary (p. 2) reports improved spatial learning in aged mice and enhanced cognition in flies, while the Introduction (p. 3) reports that dietary spermidine suppresses age-induced memory impairment in flies. (LLM, conf=0.93)
- Supportedcites [81] Pekar, T. et al. The positive effect of spermidine in older adults suffering from dementia: first results of a 3-month trial. Wien. Klin. Wochenschr. 133, 484–491 (2021). source
The lifespan claim is separately cited to reference 66; this source supports the memory and cognitive-decline clause. Its Introduction (‘Spermidine and its effects’; page not supplied) reports improved memory in supplemented fruit flies compared with same-age controls and describes positive effects on age-related memory loss. Its Abstract also reports improved cognitive performance among older adults with mild or moderate dementia receiving the higher dose. (LLM, conf=0.91)
plaindirect- Asserted: passes — The authors put it forward as true.
- Checkable: passes — It can be checked against evidence.
- Load-bearing: passes — The paper’s conclusions depend on it.
- Based: passes — The paper gives a reason why it holds.
Probably not a substantial claim. It may state two separate claims as one.
The cited sources support only part of this claim — read each source’s verdict below.
In the paper
“This finding aligns with studies showing benefits of dietary choline intake and supplementation on cognitive performance in human individuals and in animal models71–78.”
§ Single-cell multiregion dissection of Alzheimer’s disease > Discussion
What the sources say
- Not checked — no full text of the sourcecites [71] Teather, L. A. & Wurtman, R. J. Dietary cytidine (5′)-diphosphocholine supplementation protects against development of memory deficits in aging rats. Prog. Neuropsychopharmacol. Biol. Psychiatry 27, 711–717 (2003). source
- Not checked — no full text of the sourcecites [72] Poly, C. et al. The relation of dietary choline to cognitive performance and white-matter hyperintensity in the Framingham Offspring Cohort. Am. J. Clin. Nutr. 94, 1584–1591 (2011). source
- Supportedcites [73] Teather, L. A. & Wurtman, R. J. Dietary CDP-choline supplementation prevents memory impairment caused by impoverished environmental conditions in rats. Learn. Mem. 12, 39 (2005). source
The Discussion (page not available in our copy) reports that long-term dietary CDP-choline supplementation protected rats reared in impoverished conditions from spatial-memory impairment. This supports the animal-model part of the claim; this citation is one of several attached to the broader sentence and need not itself establish a benefit in humans. (LLM, conf=0.90)
- Partly supportedcites [74] Nurk, E. et al. Plasma free choline, betaine and cognitive performance: the Hordaland Health Study. Br. J. Nutr. 109, 511–519 (2013). sourceExperimental — accuracy not yet measured
The passages indexed under Abstract (page unavailable) report improved memory performance after choline supplementation in rats and an association between higher dietary choline intake and better cognitive performance in a human cohort. They do not establish that choline intake caused the human benefit; they also say controlled trials found no clinical value for choline or phosphatidylcholine in treating cognitive dysfunction in Alzheimer’s disease. This source therefore supports the animal supplementation finding and a human dietary association, but not a general claim of supplementation benefits in humans. (LLM, conf=0.87)
- Supportedcites [75] Blusztajn, J. K., Slack, B. E. & Mellott, T. J. Neuroprotective actions of dietary choline. Nutrients 9, 815 (2017). source
The Conclusions state that high choline intake enhances cognitive performance in multiple animal models and some human studies. Section 2.1 describes improved cognition in prenatally choline-supplemented rats and an association between higher maternal choline intake and better childhood memory in humans; the human finding is observational. (LLM, conf=0.91)
- Supportedcites [76] Liu, L. et al. Choline intake correlates with cognitive performance among elder adults in the United States. Behav. Neurol. 2021, 2962245 (2021). source
The Introduction reports improved spatial memory with choline supplementation in an animal study and an association between supplementation and improved cognitive function in human adults. The Discussion also reports an association between dietary choline intake and better cognitive performance among older adults. The paper cautions that its own cross-sectional findings cannot establish causation. (LLM, conf=0.90)
- Supportedcites [77] Yuan, J. et al. Is dietary choline intake related to dementia and Alzheimer’s disease risks? Results from the Framingham Heart Study. Am. J. Clin. Nutr. 116, 1201–1207 (2022). source
The Introduction reports that animal experiments found improved cognitive performance with dietary choline supplementation. It also reports positive associations between dietary choline intake and cognitive performance in two human populations. (LLM, conf=0.92)
- Partly supportedcites [78] Sienski, G. et al. APOE4 disrupts intracellular lipid homeostasis in human iPSC-derived glia. Sci. Transl. Med. 13, eaaz4564 (2021). sourceExperimental — accuracy not yet measured
The Discussion (page not provided) reports greater efficacy of choline supplementation in clinical trials involving people with Alzheimer’s disease who carry APOE4; the cited trial’s title identifies cognitive performance as an outcome. The paper’s own Results concern lipid defects in cultured cells, while the animal-related study listed in its References reports improved Alzheimer’s pathology, not cognitive performance. The claim’s animal-cognition component is therefore not supported by our copy. (LLM, conf=0.82)
plaindirect- Asserted: passes — The authors put it forward as true.
- Checkable: passes — It can be checked against evidence.
- Load-bearing: fails — The paper’s conclusions may not depend on it.
- Based: passes — The paper gives a reason why it holds.
Probably not a substantial claim. The paper’s conclusions may not depend on it.
Every source the paper cites for this claim was checked and supports it.
In the paper
“We calculated the disease-relevance score of each cell in the dataset against a recent Alzheimer’s GWAS, using scDRS (based on MAGMA)54,55,116. For the scDRS results, we counted the fraction of cells with significant scDRS scores (FDR < 0.05) in each cell type, subtype and region. To test for overlap with microglia/immune modules, we compared the set of immune cells with significant expression of”
§ Single-cell multiregion dissection of Alzheimer’s disease > Methods > Differential gene expression
What the sources say
- Supportedcites [54] Jansen, I. E. et al. Genome-wide meta-analysis identifies new loci and functional pathways influencing Alzheimer’s disease risk. Nat. Genet. 51, 404–413 (2019). source
The Results section (‘Genome-wide meta-analysis for AD status’; page unavailable) reports a genome-wide meta-analysis of Alzheimer’s disease, confirming that this source is an AD GWAS. The citation identifies the GWAS used by the citing authors; their scDRS scoring and overlap test are not attributed to this source. (LLM, conf=0.92)
- Supportedcites [55] Zhang, M. J. et al. Polygenic enrichment distinguishes disease associations of individual cells in single-cell RNA-seq data. Nat. Genet. 54, 1572–1580 (2022). source
The Results section (“Overview of methods”) identifies scDRS as a method for scoring individual cells against GWAS-derived disease genes and states that it uses MAGMA to select those genes. The citation supports the method identification; the citing authors describe the Alzheimer’s analysis and overlap test as their own procedures. (LLM, conf=0.94)
- Supportedcites [116] de Leeuw, C. A., Mooij, J. M., Heskes, T. & Posthuma, D. MAGMA: generalized gene-set analysis of GWAS data. PLoS Comput. Biol. 11, e1004219 (2015). source
This citation identifies MAGMA, the GWAS analysis tool named as a basis for scDRS. The Materials and Methods section (‘Analysis of summary SNP statistics’; page unavailable) describes MAGMA’s use of GWAS SNP statistics for gene analysis. The Alzheimer’s cell scores and overlap test are the citing authors’ own procedures, not findings attributed to this paper. (LLM, conf=0.88)
plaincorrelational- Asserted: passes — The authors put it forward as true.
- Checkable: passes — It can be checked against evidence.
- Load-bearing: passes — The paper’s conclusions depend on it.
- Based: passes — The paper gives a reason why it holds.
Probably not a substantial claim. It may state two separate claims as one.
- Supported
Every source the paper cites for this claim was checked and supports it.
In the paper
“Our study has several limitations: isotropic fractionation and read depth cut-offs may bias cell recovery based on their nuclear content; nuclear RNA may not fully capture microglial states82 or localized transcriptomic changes; and pathology burden is based on per-sample averages instead of on the spatial context of each cell.”
§ Single-cell multiregion dissection of Alzheimer’s disease > Discussion
What the sources say
- Supportedcites [82] Thrupp, N. et al. Single-nucleus RNA-seq is not suitable for detection of microglial activation genes in humans. Cell Rep. 32, 108189 (2020). source
The Discussion says that single-nucleus RNA-seq misses genes associated with microglial activation and is therefore not suitable for assessing cellular state in human microglia. The Results section also reports that differences among some microglial subpopulations were not convincingly recovered. Citation 82 is attached to the microglial-states claim, not the separate point about localized transcriptomic changes. (LLM, conf=0.93)
hedged- Asserted: passes — The authors put it forward as true.
- Checkable: passes — It can be checked against evidence.
- Load-bearing: fails — The paper’s conclusions may not depend on it.
- Based: passes — The paper gives a reason why it holds.
Probably not a substantial claim. The paper’s conclusions may not depend on it. It may state two separate claims as one.
- Supported
The cited sources support only part of this claim — read each source’s verdict below.
In the paper
“Notably, the RELN variant enhanced its binding to glycosaminoglycans (GAGs) and NRP1, and the APOE variant decreased binding to GAGs, potentially affecting their ability to compete for receptor binding69,70.”
§ Single-cell multiregion dissection of Alzheimer’s disease > Discussion
What the sources say
- Partly supportedcites [69] Arboleda-Velasquez, J. F. et al. Resistance to autosomal dominant Alzheimer’s disease in an APOE3 Christchurch homozygote: a case report. Nat. Med. 25, 1680–1683 (2019). sourceExperimental — accuracy not yet measured
The Abstract (page not provided) reports that ApoE3 Christchurch had the lowest heparin binding among the ApoE isoforms tested, supporting reduced APOE-variant binding to a GAG-related molecule. The paper does not report enhanced RELN-variant binding to GAGs or NRP1, or test whether the variants compete for receptor binding. (LLM, conf=0.88)
- Supportedcites [70] Lopera, F. et al. Resilience to autosomal dominant Alzheimer’s disease in a Reelin-COLBOS heterozygous man. Nat. Med. 29, 1243–1252 (2023). source
The Discussion states that the RELN-COLBOS variant enhances RELN binding to GAGs and NRP1, while the APOECh variant impairs APOE binding to GAGs. It also describes a possible competitive advantage for RELN in receptor binding, matching the claim’s uncertainty. Page numbers are not provided in the supplied copy. (LLM, conf=0.94)
hedgeddirect- Asserted: passes — The authors put it forward as true.
- Checkable: passes — It can be checked against evidence.
- Load-bearing: passes — The paper’s conclusions depend on it.
- Based: passes — The paper gives a reason why it holds.
It may state two separate claims as one.
- Partly supported
Every source the paper cites for this claim was checked and supports it.
In the paper
“Differential expression analysis of bulk RNA-seq data from the ROSMAP cohorts was performed using DESeq2119 (plotted) and edgeR118. Age at death and post-mortem interval were converted into z scores and included as covariates in the regression equation.”
§ Single-cell multiregion dissection of Alzheimer’s disease > Methods > Differential gene expression
What the sources say
- Supportedcites [119] Love, M. I., Huber, W. & Anders, S. Moderated estimation of fold change and dispersion for RNA-seq data with DESeq2. Genome Biol. 15, 550 (2014). source
The citation is attached to DESeq2, identifying the method used by the citing authors; it is not offered as evidence for their ROSMAP analysis or covariate choices. The cited paper’s Materials and methods section identifies DESeq2 as an R/Bioconductor package for differential expression analysis. (LLM, conf=0.92)
- Supportedcites [118] Robinson, M. D., McCarthy, D. J. & Smyth, G. K. edgeR: a Bioconductor package for differential expression analysis of digital gene expression data. Bioinformatics 26, 139–140 (2010). source
The citation is attached to “edgeR,” identifying the software used rather than documenting the citing authors’ ROSMAP analysis. The Introduction identifies edgeR as a package for count-based expression data applicable to RNA-seq. The ROSMAP dataset and covariate choices are the citing authors’ own methods, not claims attributed to this source. (LLM, conf=0.94)
plain- Asserted: passes — The authors put it forward as true.
- Checkable: passes — It can be checked against evidence.
- Load-bearing: fails — The paper’s conclusions may not depend on it.
- Based: passes — The paper gives a reason why it holds.
Probably not a substantial claim. The paper’s conclusions may not depend on it. It may state two separate claims as one.
- Supported
A result the paper reports from its own data — it cites no other source for it, so there is none to check. The quote shows it is in the paper.
In the paper
“Among glial cell types, astrocytes had the highest regional heterogeneity, containing both highly neocortex-enriched (GRM3+DPP10+) and thalamus-enriched (LUZP2+DCLK1+) subtypes”
§ Single-cell multiregion dissection of Alzheimer’s disease > Glial diversity annotated by gene modules
plaincorrelational- Asserted: passes — The authors put it forward as true.
- Checkable: passes — It can be checked against evidence.
- Load-bearing: passes — The paper’s conclusions depend on it.
- Based: passes — The paper gives a reason why it holds.
It may state two separate claims as one.
- Rests on an assumption: Cell type clusters annotated from transcriptomes correspond to bona fide biological cell types.
A result the paper reports from its own data — it cites no other source for it, so there is none to check. The quote shows it is in the paper.
In the paper
“present an online resource for navigating this atlas (http://compbio.mit.edu/ad_multiregion)”
§ Single-cell multiregion dissection of Alzheimer’s disease > Main
plain- Asserted: passes — The authors put it forward as true.
- Checkable: passes — It can be checked against evidence.
- Load-bearing: fails — The paper’s conclusions may not depend on it.
- Based: passes — The paper gives a reason why it holds.
Probably not a substantial claim. The paper’s conclusions may not depend on it.
A result the paper reports from its own data — it cites no other source for it, so there is none to check. The quote shows it is in the paper.
In the paper
“The top thalamus-specific interactions were between excitatory NXPH1 and neuronal NRXN1 or NRXN3, whereas inhibitory neurons expressed NXPH1 in the other regions”
§ Single-cell multiregion dissection of Alzheimer’s disease > Neuronal diversity across brain regions
plaincorrelational- Asserted: passes — The authors put it forward as true.
- Checkable: passes — It can be checked against evidence.
- Load-bearing: passes — The paper’s conclusions depend on it.
- Based: passes — The paper gives a reason why it holds.
It may state two separate claims as one.
A result the paper reports from its own data — it cites no other source for it, so there is none to check. The quote shows it is in the paper.
In the paper
“In contrast to astrocytes, immune cells showed little regional specificity and oligodendrocyte-lineage cells had thalamus-enriched subtypes with minor transcriptomic differences to neocortex-enriched subtypes”
§ Single-cell multiregion dissection of Alzheimer’s disease > Glial diversity annotated by gene modules
plain- Asserted: passes — The authors put it forward as true.
- Checkable: passes — It can be checked against evidence.
- Load-bearing: unclear — It is unclear whether the paper’s conclusions depend on it.
- Based: passes — The paper gives a reason why it holds.
It may state two separate claims as one.
- Rests on an assumption: Cell type clusters annotated from transcriptomes correspond to bona fide biological cell types.
A result the paper reports from its own data — it cites no other source for it, so there is none to check. The quote shows it is in the paper.
In the paper
“Moreover, in the HC, EC and MT, caudal ganglionic eminence-derived GABAergic neurons (VIP+LAMP5+) were significantly more abundant than medial ganglionic eminence-derived neurons (SST+PVALB+), but these two major clades were not significantly different in the PFC”
§ Single-cell multiregion dissection of Alzheimer’s disease > Neuronal diversity across brain regions
plain- Asserted: passes — The authors put it forward as true.
- Checkable: passes — It can be checked against evidence.
- Load-bearing: unclear — It is unclear whether the paper’s conclusions depend on it.
- Based: passes — The paper gives a reason why it holds.
It may state two separate claims as one.
- Rests on an assumption: Cell type clusters annotated from transcriptomes correspond to bona fide biological cell types.
A result the paper reports from its own data — it cites no other source for it, so there is none to check. The quote shows it is in the paper.
In the paper
“Predicted cell–cell communication interactions were mostly shared across multiple regions, but the thalamus had multiple differential interactions”
§ Single-cell multiregion dissection of Alzheimer’s disease > Neuronal diversity across brain regions
plaincorrelational- Asserted: passes — The authors put it forward as true.
- Checkable: passes — It can be checked against evidence.
- Load-bearing: unclear — It is unclear whether the paper’s conclusions depend on it.
- Based: passes — The paper gives a reason why it holds.
It may state two separate claims as one.
A result the paper reports from its own data — it cites no other source for it, so there is none to check. The quote shows it is in the paper.
In the paper
“Cortical astrocytes were enriched for markers involved in glutamate processing and transport, whereas hippocampus- and anterior thalamus-enriched DCLK1 astrocytes had lower glutamate transporter activity and were enriched instead for focal-adhesion-related genes”
§ Single-cell multiregion dissection of Alzheimer’s disease > Glial diversity annotated by gene modules
plaincorrelational- Asserted: passes — The authors put it forward as true.
- Checkable: passes — It can be checked against evidence.
- Load-bearing: passes — The paper’s conclusions depend on it.
- Based: passes — The paper gives a reason why it holds.
It may state two separate claims as one.
- Rests on an assumption: Cell type clusters annotated from transcriptomes correspond to bona fide biological cell types.
A result the paper reports from its own data — it cites no other source for it, so there is none to check. The quote shows it is in the paper.
In the paper
“Cells expressing these modules were enriched for diverse aspects of our dataset, including cellular subtype identity (205 modules), brain region (156, with 77 thalamus specific and 34 EC specific), AD status (73), APOE genotype (78) and sex (24)”
§ Single-cell multiregion dissection of Alzheimer’s disease > Glial diversity annotated by gene modules
plaincorrelational- Asserted: passes — The authors put it forward as true.
- Checkable: passes — It can be checked against evidence.
- Load-bearing: passes — The paper’s conclusions depend on it.
- Based: passes — The paper gives a reason why it holds.
It may state two separate claims as one.
- Rests on an assumption: Gene module expression scores reflect functional biological programs.
A result the paper reports from its own data — it cites no other source for it, so there is none to check. The quote shows it is in the paper.
In the paper
“Oligodendrocyte-lineage modules showed high regional specificity, and two OPC modules—thalamus-enriched M11 and EC-enriched M25—were marked by synapse-associated genes such as neural adhesion-related SEMA3D, SEMA6D and CNTN5, and glutamate receptor GRIA4”
§ Single-cell multiregion dissection of Alzheimer’s disease > Glial diversity annotated by gene modules
plaincorrelational- Asserted: passes — The authors put it forward as true.
- Checkable: passes — It can be checked against evidence.
- Load-bearing: passes — The paper’s conclusions depend on it.
- Based: passes — The paper gives a reason why it holds.
It may state two separate claims as one.
- Rests on an assumption: Gene module expression scores reflect functional biological programs.
A result the paper reports from its own data — it cites no other source for it, so there is none to check. The quote shows it is in the paper.
In the paper
“These scores matched the cortical excitatory and inhibitory split and were negatively correlated both across and within broad neuronal classes”
§ Single-cell multiregion dissection of Alzheimer’s disease > Neuronal diversity across brain regions
plaincorrelational- Asserted: passes — The authors put it forward as true.
- Checkable: passes — It can be checked against evidence.
- Load-bearing: unclear — It is unclear whether the paper’s conclusions depend on it.
- Based: passes — The paper gives a reason why it holds.
It may state two separate claims as one.
- Rests on an assumption: Gene module expression scores reflect functional biological programs.
A result the paper reports from its own data — it cites no other source for it, so there is none to check. The quote shows it is in the paper.
In the paper
“Immune modules included identity programs, such as for T cells (M6), macrophages (M7) and cycling microglia (MKI67+, M5) as well as modules found across immune cells and enriched for genes involved in NF-κB signalling (M18), interferon (M20), p53 and DNA damage response (M22) and TGFβ signalling (M14)”
§ Single-cell multiregion dissection of Alzheimer’s disease > Glial diversity annotated by gene modules
plain- Asserted: passes — The authors put it forward as true.
- Checkable: passes — It can be checked against evidence.
- Load-bearing: unclear — It is unclear whether the paper’s conclusions depend on it.
- Based: passes — The paper gives a reason why it holds.
It may state two separate claims as one.
- Rests on an assumption: Gene module expression scores reflect functional biological programs.
A result the paper reports from its own data — it cites no other source for it, so there is none to check. The quote shows it is in the paper.
In the paper
“Module–module correlations across samples revealed co-expressed programs, such as reactive astrocytes (M3, marked by TPST1, CLIC4 and EMP1) with cholesterol biosynthesis module M17 (r = 0.60), and glycolysis (M6) with AP-1 module M13 (r = 0.39, including FOS/JUN and ubiquitin)”
§ Single-cell multiregion dissection of Alzheimer’s disease > Glial diversity annotated by gene modules
plaincorrelational- Asserted: passes — The authors put it forward as true.
- Checkable: passes — It can be checked against evidence.
- Load-bearing: unclear — It is unclear whether the paper’s conclusions depend on it.
- Based: passes — The paper gives a reason why it holds.
It may state two separate claims as one.
- Rests on an assumption: Gene module expression scores reflect functional biological programs.
A result the paper reports from its own data — it cites no other source for it, so there is none to check. The quote shows it is in the paper.
In the paper
“From these 48 individuals, we profiled six brain regions: the EC (221,493 cells), which is affected in early AD (stages I–II); the HC (221,415) and TH (207,625), which are affected in mid-AD (stages III–IV); and the AG (220,409), MT (227,412) and PFC (254,721), which are affected in late AD (stages V–VI), for a total of 1.35 million transcriptomes of independent nuclei after removing doublets, low”
§ Single-cell multiregion dissection of Alzheimer’s disease > A multiregion atlas of AD
plainn = 48- Asserted: passes — The authors put it forward as true.
- Checkable: passes — It can be checked against evidence.
- Load-bearing: passes — The paper’s conclusions depend on it.
- Based: passes — The paper gives a reason why it holds.
It may state two separate claims as one.
- Rests on an assumption: Single-nucleus RNA-sequencing of post-mortem nuclei accurately reflects the cellular composition and transcriptomes of the human brain regions sampled.
A result the paper reports from its own data — it cites no other source for it, so there is none to check. The quote shows it is in the paper.
In the paper
“although some inhibitory subtypes had regional biases, including PVALB+HTR4+ and CUX2+MSR1+ (enriched in neocortex), layer 6 SST+NPY+ (EC and HC) and GPC5+RIT2+ (EC)”
§ Single-cell multiregion dissection of Alzheimer’s disease > Neuronal diversity across brain regions
plaincorrelational- Asserted: passes — The authors put it forward as true.
- Checkable: passes — It can be checked against evidence.
- Load-bearing: passes — The paper’s conclusions depend on it.
- Based: passes — The paper gives a reason why it holds.
It may state two separate claims as one.
- Rests on an assumption: Cell type clusters annotated from transcriptomes correspond to bona fide biological cell types.
A result the paper reports from its own data — it cites no other source for it, so there is none to check. The quote shows it is in the paper.
In the paper
“We first characterized the regional diversity of excitatory neuron subtypes, which were consistent across individuals and were either highly region-specific to the HC, EC and TH (7, 9 and 2 subtypes, respectively) or were predominantly shared across neocortical regions (12 subtypes)”
§ Single-cell multiregion dissection of Alzheimer’s disease > Neuronal diversity across brain regions
plain- Asserted: passes — The authors put it forward as true.
- Checkable: passes — It can be checked against evidence.
- Load-bearing: passes — The paper’s conclusions depend on it.
- Based: passes — The paper gives a reason why it holds.
It may state two separate claims as one.
- Rests on an assumption: Cell type clusters annotated from transcriptomes correspond to bona fide biological cell types.
A result the paper reports from its own data — it cites no other source for it, so there is none to check. The quote shows it is in the paper.
In the paper
“We identified multiple transcriptionally distinct subsets for each major glial cell type and determined their characteristic marker genes”
§ Single-cell multiregion dissection of Alzheimer’s disease > Glial diversity annotated by gene modules
plain- Asserted: passes — The authors put it forward as true.
- Checkable: passes — It can be checked against evidence.
- Load-bearing: passes — The paper’s conclusions depend on it.
- Based: passes — The paper gives a reason why it holds.
It may state two separate claims as one.
- Rests on an assumption: Cell type clusters annotated from transcriptomes correspond to bona fide biological cell types.
A result the paper reports from its own data — it cites no other source for it, so there is none to check. The quote shows it is in the paper.
In the paper
“Thalamic astrocytes (LUZP2+) expressed GABA-uptake genes SLC6A1 and SLC6A11 at much higher levels compared with other subtypes, even though the proportion of inhibitory neurons was not markedly higher in the thalamus”
§ Single-cell multiregion dissection of Alzheimer’s disease > Glial diversity annotated by gene modules
plaincorrelational- Asserted: passes — The authors put it forward as true.
- Checkable: passes — It can be checked against evidence.
- Load-bearing: unclear — It is unclear whether the paper’s conclusions depend on it.
- Based: passes — The paper gives a reason why it holds.
It may state two separate claims as one.
- Rests on an assumption: Cell type clusters annotated from transcriptomes correspond to bona fide biological cell types.
A result the paper reports from its own data — it cites no other source for it, so there is none to check. The quote shows it is in the paper.
In the paper
“Neuritic-plaque-associated genes (190 genes) included the energy-homeostasis-regulating genes IRS2, PDK4 and HIF3A, and genes enriched for immune response, chromatin regulation and lipid droplets.”
§ Single-cell multiregion dissection of Alzheimer’s disease > Pathology-specific expression changes
plaincorrelational- Asserted: passes — The authors put it forward as true.
- Checkable: passes — It can be checked against evidence.
- Load-bearing: unclear — It is unclear whether the paper’s conclusions depend on it.
- Based: passes — The paper gives a reason why it holds.
It may state two separate claims as one.
A result the paper reports from its own data — it cites no other source for it, so there is none to check. The quote shows it is in the paper.
In the paper
“The glycolysis modules were enriched among diffuse plaque DEGs in microglia and astrocytes and shared a set of genes that included canonical glycolysis genes (PDK1/3/4, PFKL/P, PKM and PGK1), anaerobic glycolysis enzymes (TPI1 and LDHA) and stress-induced genes (EGLN1, DDIT4, VEGFA and BNIP3L) (Fig. 4k–m and Extended Data Fig. 6a,b).”
§ Single-cell multiregion dissection of Alzheimer’s disease > Pathology-specific expression changes
plaincorrelational- Asserted: passes — The authors put it forward as true.
- Checkable: passes — It can be checked against evidence.
- Load-bearing: passes — The paper’s conclusions depend on it.
- Based: passes — The paper gives a reason why it holds.
It may state two separate claims as one.
A result the paper reports from its own data — it cites no other source for it, so there is none to check. The quote shows it is in the paper.
In the paper
“We used region-specific measurements of AD pathology to identify changes in gene expression associated with neurofibrillary tau tangle or amyloid-β plaque burden, including plaque-associated upregulation of metallostasis in astrocytes and of the electron-transport chain in excitatory neurons.”
§ Single-cell multiregion dissection of Alzheimer’s disease > Discussion
plaincorrelational- Asserted: passes — The authors put it forward as true.
- Checkable: passes — It can be checked against evidence.
- Load-bearing: passes — The paper’s conclusions depend on it.
- Based: passes — The paper gives a reason why it holds.
It may state two separate claims as one.
A result the paper reports from its own data — it cites no other source for it, so there is none to check. The quote shows it is in the paper.
In the paper
“Conversely, PNPLA6, which encodes a phospholipase that catalyses the hydrolysis of intracellular phosphatidylcholine, a major membrane lipid, generating GPC, and CHDH, which encodes choline dehydrogenase, an enzyme that catalyses the conversion of choline to betaine aldehyde, were both negatively associated with multiple measures of CR in astrocytes (Fig. 5c–f and Supplementary Fig. 43a–d).”
§ Single-cell multiregion dissection of Alzheimer’s disease > Astrocytes and cognitive resilience
plaincorrelational- Asserted: passes — The authors put it forward as true.
- Checkable: passes — It can be checked against evidence.
- Load-bearing: passes — The paper’s conclusions depend on it.
- Based: passes — The paper gives a reason why it holds.
It may state two separate claims as one.
- The authors state this as an assumption: The CR score, defined as the difference between observed cognition and cognition expected on the basis of pathology level, validly measures cognitive resilience.
- The authors state this as an assumption: Pathology measurements can be used to predict global cognitive function or rate of cognitive decline.
A result the paper reports from its own data — it cites no other source for it, so there is none to check. The quote shows it is in the paper.
In the paper
“In microglia, these included PPARG and MSR1, upregulated in the HC, each associated with microglia polarization, as well as upregulation of lipoprotein modifier APOC1 and downregulation of transcription factor FOXP2 in the EC (Extended Data Fig. 8f and Supplementary Fig. 40).”
§ Single-cell multiregion dissection of Alzheimer’s disease > Regional expression differences in AD
plaincorrelational- Asserted: passes — The authors put it forward as true.
- Checkable: passes — It can be checked against evidence.
- Load-bearing: unclear — It is unclear whether the paper’s conclusions depend on it.
- Based: passes — The paper gives a reason why it holds.
It may state two separate claims as one.
A result the paper reports from its own data — it cites no other source for it, so there is none to check. The quote shows it is in the paper.
In the paper
“Consistently, NFT-associated genes (374 genes, differentially expressed in 2+ cell types) included PLCG2, CLU and CTNNA2 (in oligodendrocytes and OPCs) and mitochondrial subunits, and were enriched for ER protein processing, electron transport and cadherin binding (Fig. 4d,e).”
§ Single-cell multiregion dissection of Alzheimer’s disease > Pathology-specific expression changes
plaincorrelational- Asserted: passes — The authors put it forward as true.
- Checkable: passes — It can be checked against evidence.
- Load-bearing: passes — The paper’s conclusions depend on it.
- Based: passes — The paper gives a reason why it holds.
It may state two separate claims as one.
A result the paper reports from its own data — it cites no other source for it, so there is none to check. The quote shows it is in the paper.
In the paper
“Notably, while the overall excitatory fraction was not associated with cognition, lower OPC fraction across regions and, in particular, in non-neocortex regions was significantly associated with impaired cognition”
§ Single-cell multiregion dissection of Alzheimer’s disease > Vulnerable neuronal subtypes in AD
plaincorrelational- Asserted: passes — The authors put it forward as true.
- Checkable: passes — It can be checked against evidence.
- Load-bearing: passes — The paper’s conclusions depend on it.
- Based: passes — The paper gives a reason why it holds.
It may state two separate claims as one.
A result the paper reports from its own data — it cites no other source for it, so there is none to check. The quote shows it is in the paper.
In the paper
“Excitatory DEGs were strongly enriched for electron-transport functional terms across regions and showed weak region-specific enrichments for protein-folding-, ubiquitination- and synapse-associated terms”
§ Single-cell multiregion dissection of Alzheimer’s disease > Regional expression differences in AD
boostedcorrelational- Asserted: passes — The authors put it forward as true.
- Checkable: passes — It can be checked against evidence.
- Load-bearing: unclear — It is unclear whether the paper’s conclusions depend on it.
- Based: passes — The paper gives a reason why it holds.
It may state two separate claims as one.
A result the paper reports from its own data — it cites no other source for it, so there is none to check. The quote shows it is in the paper.
In the paper
“Astrocytes and inhibitory and excitatory neurons showed the highest number of DEGs over all of the regions, with the largest number of changes in the EC”
§ Single-cell multiregion dissection of Alzheimer’s disease > Regional expression differences in AD
plaincorrelational- Asserted: passes — The authors put it forward as true.
- Checkable: passes — It can be checked against evidence.
- Load-bearing: passes — The paper’s conclusions depend on it.
- Based: passes — The paper gives a reason why it holds.
It may state two separate claims as one.
A result the paper reports from its own data — it cites no other source for it, so there is none to check. The quote shows it is in the paper.
In the paper
“These included Reelin signalling pathway genes RELN and DAB1; kinase-associated genes MAP2K5, PRKCA and SPHKAP; and multiple genes associated with heparan sulfate proteoglycan biosynthesis (including HS6ST3, XYLT1 and NDST3)”
§ Single-cell multiregion dissection of Alzheimer’s disease > Vulnerable neuronal subtypes in AD
plaincorrelational- Asserted: passes — The authors put it forward as true.
- Checkable: passes — It can be checked against evidence.
- Load-bearing: unclear — It is unclear whether the paper’s conclusions depend on it.
- Based: passes — The paper gives a reason why it holds.
It may state two separate claims as one.
A result the paper reports from its own data — it cites no other source for it, so there is none to check. The quote shows it is in the paper.
In the paper
“We found that vulnerable neuronal subtypes were co-depleted specifically in individuals with AD, with some of the strongest effects observed in established connections between the CA1, subiculum, EC–L3 and EC–L5”
§ Single-cell multiregion dissection of Alzheimer’s disease > Vulnerable neuronal subtypes in AD
plaincorrelational- Asserted: passes — The authors put it forward as true.
- Checkable: passes — It can be checked against evidence.
- Load-bearing: passes — The paper’s conclusions depend on it.
- Based: passes — The paper gives a reason why it holds.
It may state two separate claims as one.
- Rests on an assumption: Co-depletion of neuronal subtypes across connected regions reflects coordinated vulnerability rather than independent regional effects.
A result the paper reports from its own data — it cites no other source for it, so there is none to check. The quote shows it is in the paper.
In the paper
“The pathway peaked very early in the EC (ABC score of 1, low levels of AD pathology), later in the HC and midtemporal cortex (intermediate levels), and very late in the PFC (high levels) (Supplementary Fig. 42c), suggesting that the glial metabolic response to AD may not be coordinated globally.”
§ Single-cell multiregion dissection of Alzheimer’s disease > Pathology-specific expression changes
plaincorrelational- Asserted: passes — The authors put it forward as true.
- Checkable: passes — It can be checked against evidence.
- Load-bearing: passes — The paper’s conclusions depend on it.
- Based: passes — The paper gives a reason why it holds.
It may state two separate claims as one.
In the paper
“In regions with high diffuse plaque, astrocytes upregulated glycolysis enzymes converting glucose-6-phosphate to pyruvate, while downregulating MPC1, the mitochondrial pyruvate transporter60 (Fig. 4n).”
§ Single-cell multiregion dissection of Alzheimer’s disease > Pathology-specific expression changes
What the sources say
- Not checked — no full text of the sourcecites [60] Magistretti, P. J. & Allaman, I. A cellular perspective on brain energy metabolism and functional imaging. Neuron 86, 883–901 (2015). source
plaincorrelational- Asserted: passes — The authors put it forward as true.
- Checkable: passes — It can be checked against evidence.
- Load-bearing: unclear — It is unclear whether the paper’s conclusions depend on it.
- Based: passes — The paper gives a reason why it holds.
It may state two separate claims as one.
A result the paper reports from its own data — it cites no other source for it, so there is none to check. The quote shows it is in the paper.
In the paper
“While microglia DEGs were broadly enriched for clathrin-coated endocytosis (up) and viral response (down), they also had diverse region-specific enrichments, including upregulation of major histocompatibility complex type II (MHC-II) binding in the EC and HC, RNA processing in thalamus and glycolysis in the PFC and EC; and HC-driven downregulation of phagocytosis, phospholipase signalling and”
§ Single-cell multiregion dissection of Alzheimer’s disease > Regional expression differences in AD
plaincorrelational- Asserted: passes — The authors put it forward as true.
- Checkable: passes — It can be checked against evidence.
- Load-bearing: passes — The paper’s conclusions depend on it.
- Based: passes — The paper gives a reason why it holds.
It may state two separate claims as one.
A result the paper reports from its own data — it cites no other source for it, so there is none to check. The quote shows it is in the paper.
In the paper
“These included co-depletion for entorhinal L5 versus L5-projecting subiculum (Kendall’s τ = 0.37 (AD); −0.1 (non-AD)) or CA1 (τ = 0.42 (AD) and −0.16 (non-AD)); and for CA1 versus L2-lateral EC (LEC, τ = 0.26 (AD) and −0.07 (non-AD)) and L3 RELN+ (τ = 0.24 (AD) and −0.13 (non-AD)) EC neurons”
§ Single-cell multiregion dissection of Alzheimer’s disease > Vulnerable neuronal subtypes in AD
plaincorrelational- Asserted: passes — The authors put it forward as true.
- Checkable: passes — It can be checked against evidence.
- Load-bearing: passes — The paper’s conclusions depend on it.
- Based: passes — The paper gives a reason why it holds.
It may state two separate claims as one.
- Rests on an assumption: Co-depletion of neuronal subtypes across connected regions reflects coordinated vulnerability rather than independent regional effects.
A result the paper reports from its own data — it cites no other source for it, so there is none to check. The quote shows it is in the paper.
In the paper
“By contrast, microglia and OPC DEGs overlapped within the non-neocortex regions, and astrocyte and oligodendrocyte changes were more consistent across all regions”
§ Single-cell multiregion dissection of Alzheimer’s disease > Regional expression differences in AD
plaincorrelational- Asserted: passes — The authors put it forward as true.
- Checkable: passes — It can be checked against evidence.
- Load-bearing: passes — The paper’s conclusions depend on it.
- Based: passes — The paper gives a reason why it holds.
It may state two separate claims as one.
A result the paper reports from its own data — it cites no other source for it, so there is none to check. The quote shows it is in the paper.
In the paper
“We identified eight GWAS genes with region-specific expression in microglia, including PLCG2 (EC), APOE and SORL1 (thalamus), and MS4A4A (midtemporal cortex) (Extended Data Fig. 9c–f).”
§ Single-cell multiregion dissection of Alzheimer’s disease > Regional expression differences in AD
plaincorrelational- Asserted: passes — The authors put it forward as true.
- Checkable: passes — It can be checked against evidence.
- Load-bearing: passes — The paper’s conclusions depend on it.
- Based: passes — The paper gives a reason why it holds.
It may state two separate claims as one.
A result the paper reports from its own data — it cites no other source for it, so there is none to check. The quote shows it is in the paper.
In the paper
“Notably, while RELN expression, which is typically restricted to inhibitory neurons, was highly specific to two EC excitatory subtypes, its downstream partner DAB1 was present across subtypes”
§ Single-cell multiregion dissection of Alzheimer’s disease > Vulnerable neuronal subtypes in AD
plaincorrelational- Asserted: passes — The authors put it forward as true.
- Checkable: passes — It can be checked against evidence.
- Load-bearing: passes — The paper’s conclusions depend on it.
- Based: passes — The paper gives a reason why it holds.
It may state two separate claims as one.
A result the paper reports from its own data — it cites no other source for it, so there is none to check. The quote shows it is in the paper.
In the paper
“Agreement between NFT and plaque DEGs was highest in the EC and HC for all cell types (average adjusted R2 of 67% in both) and lowest in the PFC (43%) and AG (21%), consistent with late-AD NFT appearance in the neocortex (Fig. 4b).”
§ Single-cell multiregion dissection of Alzheimer’s disease > Pathology-specific expression changes
plaincorrelational- Asserted: passes — The authors put it forward as true.
- Checkable: passes — It can be checked against evidence.
- Load-bearing: passes — The paper’s conclusions depend on it.
- Based: passes — The paper gives a reason why it holds.
It may state two separate claims as one.
A result the paper reports from its own data — it cites no other source for it, so there is none to check. The quote shows it is in the paper.
In the paper
“We found a significant decrease in PNPLA6 and CHDH transcripts and a significant increase in GPCPD1 transcripts in cognitively resilient individuals, in agreement with the differential expression results (Fig. 5j–l).”
§ Single-cell multiregion dissection of Alzheimer’s disease > Astrocytes and cognitive resilience
plaincorrelational- Asserted: passes — The authors put it forward as true.
- Checkable: passes — It can be checked against evidence.
- Load-bearing: passes — The paper’s conclusions depend on it.
- Based: passes — The paper gives a reason why it holds.
It may state two separate claims as one.
- The authors state this as an assumption: The CR score, defined as the difference between observed cognition and cognition expected on the basis of pathology level, validly measures cognitive resilience.
- The authors state this as an assumption: Pathology measurements can be used to predict global cognitive function or rate of cognitive decline.
A result the paper reports from its own data — it cites no other source for it, so there is none to check. The quote shows it is in the paper.
In the paper
“Notably, vulnerable inhibitory neuron subtypes expressed significantly higher levels of the Reelin signalling pathway components RELN and DAB1, mirroring the observed higher expression of these two genes in vulnerable excitatory neuron subtypes”
§ Single-cell multiregion dissection of Alzheimer’s disease > Vulnerable neuronal subtypes in AD
plaincorrelational- Asserted: passes — The authors put it forward as true.
- Checkable: passes — It can be checked against evidence.
- Load-bearing: unclear — It is unclear whether the paper’s conclusions depend on it.
- Based: passes — The paper gives a reason why it holds.
It may state two separate claims as one.
A result the paper reports from its own data — it cites no other source for it, so there is none to check. The quote shows it is in the paper.
In the paper
“Broadly shared genes across cell types showed region-specific enrichment, including for DNA damage (EC), amyloid-β binding and iron transport (HC) and glycolysis (thalamus) in upregulated genes as well as for phospholipid biosynthesis and autophagy in downregulated genes (Extended Data Fig. 8e).”
§ Single-cell multiregion dissection of Alzheimer’s disease > Regional expression differences in AD
plaincorrelational- Asserted: passes — The authors put it forward as true.
- Checkable: passes — It can be checked against evidence.
- Load-bearing: passes — The paper’s conclusions depend on it.
- Based: passes — The paper gives a reason why it holds.
It may state two separate claims as one.
A result the paper reports from its own data — it cites no other source for it, so there is none to check. The quote shows it is in the paper.
In the paper
“Finally, astrocytes contained more plaque-associated DEGs compared with other cell types, and their pathology-associated DEGs were enriched in our expression modules, including in metallostasis (M28) for plaque-associated DEGs and oxidative phosphorylation (M27) and chaperones (M8) for NFT-associated DEGs (Fig. 4c,h–j).”
§ Single-cell multiregion dissection of Alzheimer’s disease > Pathology-specific expression changes
plaincorrelational- Asserted: passes — The authors put it forward as true.
- Checkable: passes — It can be checked against evidence.
- Load-bearing: passes — The paper’s conclusions depend on it.
- Based: passes — The paper gives a reason why it holds.
It may state two separate claims as one.
A result the paper reports from its own data — it cites no other source for it, so there is none to check. The quote shows it is in the paper.
In the paper
“Some DEGs associated with non-vulnerable subtypes had higher differential effect sizes in the vulnerable subtypes, and showed additional enrichment for aerobic glycolysis (including PGK1, LDHB and SLC2A3) and clathrin-mediated endocytosis (including AP2M1/AP2S1, OCRL and COPS8)”
§ Single-cell multiregion dissection of Alzheimer’s disease > Vulnerable neuronal subtypes in AD
plaincorrelational- Asserted: passes — The authors put it forward as true.
- Checkable: passes — It can be checked against evidence.
- Load-bearing: unclear — It is unclear whether the paper’s conclusions depend on it.
- Based: passes — The paper gives a reason why it holds.
It may state two separate claims as one.
A result the paper reports from its own data — it cites no other source for it, so there is none to check. The quote shows it is in the paper.
In the paper
“Modules including ECM, adhesion and neurogenesis-related genes were much lower in AD (M1 and M11), while the modules for specific astrocyte subtypes (M7, DCLK1+; and M24, DPP10+) were enriched for upregulated DEGs (Fig. 4k).”
§ Single-cell multiregion dissection of Alzheimer’s disease > Pathology-specific expression changes
plaincorrelational- Asserted: passes — The authors put it forward as true.
- Checkable: passes — It can be checked against evidence.
- Load-bearing: passes — The paper’s conclusions depend on it.
- Based: passes — The paper gives a reason why it holds.
It may state two separate claims as one.
A result the paper reports from its own data — it cites no other source for it, so there is none to check. The quote shows it is in the paper.
In the paper
“Interestingly, a reactive astrocyte module (M3) was enriched in upregulated genes for plaques but in downregulated genes for NFTs (Fig. 4j).”
§ Single-cell multiregion dissection of Alzheimer’s disease > Pathology-specific expression changes
plaincorrelational- Asserted: passes — The authors put it forward as true.
- Checkable: passes — It can be checked against evidence.
- Load-bearing: unclear — It is unclear whether the paper’s conclusions depend on it.
- Based: passes — The paper gives a reason why it holds.
It may state two separate claims as one.
A result the paper reports from its own data — it cites no other source for it, so there is none to check. The quote shows it is in the paper.
In the paper
“Among all of the cell types, astrocytes and microglia showed the largest differential changes for these genes in regions with high neuritic plaque density, for example, for APOE, HLA-DRA, PILRA and SORT1, and showed the most response to diffuse plaque.”
§ Single-cell multiregion dissection of Alzheimer’s disease > Regional expression differences in AD
plaincorrelational- Asserted: passes — The authors put it forward as true.
- Checkable: passes — It can be checked against evidence.
- Load-bearing: passes — The paper’s conclusions depend on it.
- Based: passes — The paper gives a reason why it holds.
It may state two separate claims as one.
A result the paper reports from its own data — it cites no other source for it, so there is none to check. The quote shows it is in the paper.
In the paper
“By annotating neuronal and glial subtypes by brain region, we found significant compositional differences between regions, including a subtype of thalamic GABAergic neurons (MEIS2+FOXP2+) that is molecularly distinct from the canonical subclasses of inhibitory neurons in the neocortex.”
§ Single-cell multiregion dissection of Alzheimer’s disease > Discussion
plaincorrelational- Asserted: passes — The authors put it forward as true.
- Checkable: passes — It can be checked against evidence.
- Load-bearing: passes — The paper’s conclusions depend on it.
- Based: passes — The paper gives a reason why it holds.
It may state two separate claims as one.
A result the paper reports from its own data — it cites no other source for it, so there is none to check. The quote shows it is in the paper.
In the paper
“Neocortical L2–3 neurons were also significantly less abundant in samples with high NFT levels and in individuals with neocortical NFT involvement”
§ Single-cell multiregion dissection of Alzheimer’s disease > Vulnerable neuronal subtypes in AD
plaincorrelational- Asserted: passes — The authors put it forward as true.
- Checkable: passes — It can be checked against evidence.
- Load-bearing: passes — The paper’s conclusions depend on it.
- Based: passes — The paper gives a reason why it holds.
It may state two separate claims as one.
A result the paper reports from its own data — it cites no other source for it, so there is none to check. The quote shows it is in the paper.
In the paper
“The majority of region-specific DEGs was either broadly shared (on average, 11% of genes were differentially expressed in 3+ cell types in a region) or were in cell-type-specific programs (40% of DEGs were in 3+ regions for a cell type) (Extended Data Fig. 8d,e).”
§ Single-cell multiregion dissection of Alzheimer’s disease > Regional expression differences in AD
plain- Asserted: passes — The authors put it forward as true.
- Checkable: passes — It can be checked against evidence.
- Load-bearing: passes — The paper’s conclusions depend on it.
- Based: passes — The paper gives a reason why it holds.
It may state two separate claims as one.
A result the paper reports from its own data — it cites no other source for it, so there is none to check. The quote shows it is in the paper.
In the paper
“We independently identified modules for heat-shock chaperones, glycolysis and oxidative phosphorylation in multiple cell types, which were correlated across cell types and were enriched for upregulated DEGs (Fig. 4k, Extended Data Figs. 6a,b and 11g and Supplementary Fig. 42a,b).”
§ Single-cell multiregion dissection of Alzheimer’s disease > Pathology-specific expression changes
plaincorrelational- Asserted: passes — The authors put it forward as true.
- Checkable: passes — It can be checked against evidence.
- Load-bearing: passes — The paper’s conclusions depend on it.
- Based: passes — The paper gives a reason why it holds.
It may state two separate claims as one.
A result the paper reports from its own data — it cites no other source for it, so there is none to check. The quote shows it is in the paper.
In the paper
“On the other hand, NFT-associated and downregulated DEGs were enriched for TCA cycle genes, whereas upregulated DEGs were enriched for unfolded protein response and lysosome-linked genes.”
§ Single-cell multiregion dissection of Alzheimer’s disease > Pathology-specific expression changes
plaincorrelational- Asserted: passes — The authors put it forward as true.
- Checkable: passes — It can be checked against evidence.
- Load-bearing: unclear — It is unclear whether the paper’s conclusions depend on it.
- Based: passes — The paper gives a reason why it holds.
It may state two separate claims as one.
A result the paper reports from its own data — it cites no other source for it, so there is none to check. The quote shows it is in the paper.
In the paper
“GWAS and familial AD genes were maximally expressed (75 genes) and differentially expressed (30 genes) in microglia, and 25 genes were differentially expressed in at least three cell types, including upregulated CLU, PLCG2 and SORT1, and downregulated DENND6A (Extended Data Fig. 10).”
§ Single-cell multiregion dissection of Alzheimer’s disease > Regional expression differences in AD
plaincorrelational- Asserted: passes — The authors put it forward as true.
- Checkable: passes — It can be checked against evidence.
- Load-bearing: passes — The paper’s conclusions depend on it.
- Based: passes — The paper gives a reason why it holds.
It may state two separate claims as one.
A result the paper reports from its own data — it cites no other source for it, so there is none to check. The quote shows it is in the paper.
In the paper
“Notably, vulnerable excitatory neurons shared expression of genes involved in Reelin signalling and heparan sulfate proteoglycan biosynthesis, both of which were also predictive of inhibitory neuron vulnerability to AD.”
§ Single-cell multiregion dissection of Alzheimer’s disease > Discussion
plaincorrelational- Asserted: passes — The authors put it forward as true.
- Checkable: passes — It can be checked against evidence.
- Load-bearing: passes — The paper’s conclusions depend on it.
- Based: passes — The paper gives a reason why it holds.
It may state two separate claims as one.
A result the paper reports from its own data — it cites no other source for it, so there is none to check. The quote shows it is in the paper.
In the paper
“Both approaches (DESeq2 and edgeR) provided similar results.”
§ Single-cell multiregion dissection of Alzheimer’s disease > Methods > Differential gene expression
plain- Asserted: passes — The authors put it forward as true.
- Checkable: passes — It can be checked against evidence.
- Load-bearing: fails — The paper’s conclusions may not depend on it.
- Based: passes — The paper gives a reason why it holds.
Probably not a substantial claim. The paper’s conclusions may not depend on it.
A conclusion the paper draws from its own results — it cites no other source for it, so there is none to check. The quote shows it is in the paper.
In the paper
“suggesting that variability in the major cell type composition between regions is a fundamental characteristic of the human brain and is not affected by AD pathology.”
§ Single-cell multiregion dissection of Alzheimer’s disease > A multiregion atlas of AD
hedged- Asserted: passes — The authors put it forward as true.
- Checkable: passes — It can be checked against evidence.
- Load-bearing: passes — The paper’s conclusions depend on it.
- Based: passes — The paper gives a reason why it holds.
It may state two separate claims as one.
The paper states this without a source or data behind it here, so there is nothing to check it against. The quote shows it is in the paper.
In the paper
“S-adenosylmethionine is involved in the biosynthesis of spermidine, linking choline metabolism and polyamine biosynthesis in astrocytes in CR to AD pathology (Fig. 5m).”
§ Single-cell multiregion dissection of Alzheimer’s disease > Astrocytes and cognitive resilience
plaindirect- Asserted: passes — The authors put it forward as true.
- Checkable: passes — It can be checked against evidence.
- Load-bearing: passes — The paper’s conclusions depend on it.
- Based: passes — The paper gives a reason why it holds.
Probably not a substantial claim.
What the paper did — it cites no source for this, so there is none to check. The quote shows it is in the paper.
In the paper
“we computed DEGs for each major cell type in every region alone and across regions using a negative binomial linear mixed model framework, adjusting for both known covariates and potential unknown batch effects (Methods)”
§ Single-cell multiregion dissection of Alzheimer’s disease > Regional expression differences in AD
plain- Asserted: passes — The authors put it forward as true.
- Checkable: passes — It can be checked against evidence.
- Load-bearing: passes — The paper’s conclusions depend on it.
- Based: passes — The paper gives a reason why it holds.
Probably not a substantial claim.
What the paper did — it cites no source for this, so there is none to check. The quote shows it is in the paper.
In the paper
“For all methods, we subset the tested genes to only genes present in over 20% of cells. For MAST and Nebula, we calculated and included in the regression the top 10 components of unwanted variation calculated using RUV on the pseudo-bulk-level data (individuals by regions). For these methods, we also included as covariates the individual’s sex, age of death and post-mortem interval, each cell’s”
§ Single-cell multiregion dissection of Alzheimer’s disease > Methods > Differential gene expression
plain- Asserted: passes — The authors put it forward as true.
- Checkable: passes — It can be checked against evidence.
- Load-bearing: passes — The paper’s conclusions depend on it.
- Based: passes — The paper gives a reason why it holds.
Probably not a substantial claim. It may state two separate claims as one.
What the paper did — it cites no source for this, so there is none to check. The quote shows it is in the paper.
In the paper
“P values were adjusted for multiple testing using the Benjamini–Hochberg method as implemented in the R function p.adjust.”
§ Single-cell multiregion dissection of Alzheimer’s disease > Methods > Differential gene expression
plain- Asserted: passes — The authors put it forward as true.
- Checkable: passes — It can be checked against evidence.
- Load-bearing: fails — The paper’s conclusions may not depend on it.
- Based: passes — The paper gives a reason why it holds.
Probably not a substantial claim. The paper’s conclusions may not depend on it.
What the paper did — it cites no source for this, so there is none to check. The quote shows it is in the paper.
In the paper
“Our study has several limitations: isotropic fractionation and read depth cut-offs may bias cell recovery based on their nuclear content; nuclear RNA may not fully capture microglial states82 or localized transcriptomic changes; and pathology burden is based on per-sample averages instead of on the spatial context of each cell.”
§ Single-cell multiregion dissection of Alzheimer’s disease > Discussion
hedgedconditional- Asserted: passes — The authors put it forward as true.
- Checkable: passes — It can be checked against evidence.
- Load-bearing: fails — The paper’s conclusions may not depend on it.
- Based: passes — The paper gives a reason why it holds.
Probably not a substantial claim. The paper’s conclusions may not depend on it.
What the paper did — it cites no source for this, so there is none to check. The quote shows it is in the paper.
In the paper
“P values were adjusted for multiple hypotheses testing using the Benjamini–Hochberg method as implemented in the R function p.adjust.”
§ Single-cell multiregion dissection of Alzheimer’s disease > Methods > Differential gene expression
plainn = 427- Asserted: passes — The authors put it forward as true.
- Checkable: passes — It can be checked against evidence.
- Load-bearing: fails — The paper’s conclusions may not depend on it.
- Based: passes — The paper gives a reason why it holds.
Probably not a substantial claim. The paper’s conclusions may not depend on it.
What the paper did — it cites no source for this, so there is none to check. The quote shows it is in the paper.
In the paper
“To control for inflated correlation estimates in highly sparse genes, we bin the estimated correlations (CZCA) for each pair of genes according to their sparsities (fraction of cells expressing the gene, binned on a log10 scale).”
§ Single-cell multiregion dissection of Alzheimer’s disease > Methods > Gene expression and regulon modules
plaindirect- Asserted: passes — The authors put it forward as true.
- Checkable: passes — It can be checked against evidence.
- Load-bearing: passes — The paper’s conclusions depend on it.
- Based: passes — The paper gives a reason why it holds.
Probably not a substantial claim. It may state two separate claims as one.
- Rests on an assumption: Correlation values will often be inflated for pairs of sparsely expressed genes.
What the paper did — it cites no source for this, so there is none to check. The quote shows it is in the paper.
In the paper
“The experiments were not randomized and the investigators were not blinded to allocation during experiments and outcome assessment.”
§ Single-cell multiregion dissection of Alzheimer’s disease > Methods > Data reporting
plain- Asserted: passes — The authors put it forward as true.
- Checkable: passes — It can be checked against evidence.
- Load-bearing: fails — The paper’s conclusions may not depend on it.
- Based: passes — The paper gives a reason why it holds.
Probably not a substantial claim. The paper’s conclusions may not depend on it. It may state two separate claims as one.
What the paper did — it cites no source for this, so there is none to check. The quote shows it is in the paper.
In the paper
“Subsequently, we randomly sampled the determined number of significant DEGs from each of the 10 subsets, ensuring that the expression level distribution of the DEGs was preserved in the random samples. This random sampling step was repeated for a total of 1,000 iterations.”
§ Single-cell multiregion dissection of Alzheimer’s disease > Methods > Differential gene expression
plain- Asserted: passes — The authors put it forward as true.
- Checkable: passes — It can be checked against evidence.
- Load-bearing: passes — The paper’s conclusions depend on it.
- Based: passes — The paper gives a reason why it holds.
Probably not a substantial claim.
What the paper did — it cites no source for this, so there is none to check. The quote shows it is in the paper.
In the paper
“We modelled the effects of fraction of cells on cognitive performance in multiple domains with gaussian linear regression of cognitive performance on last visit versus the log10-transformed fraction of cells in the subtype or major cell type jointly with covariates for age, sex, APOE-ε4 and post-mortem interval, with false-discovery rate P-value correction (p.adjust in R).”
§ Single-cell multiregion dissection of Alzheimer’s disease > Methods > Cell type composition
plaincorrelational- Asserted: passes — The authors put it forward as true.
- Checkable: passes — It can be checked against evidence.
- Load-bearing: passes — The paper’s conclusions depend on it.
- Based: passes — The paper gives a reason why it holds.
Probably not a substantial claim.
What the paper did — it cites no source for this, so there is none to check. The quote shows it is in the paper.
In the paper
“Individuals were balanced between sexes (male:female ratios 13:13 in AD, 11:11 in NoAD), matched for age (median, 86.6 years (AD) and 86.0 years (no AD)) and post-mortem interval (median, 5.9 h (AD) and 6.3 h (no AD)).”
§ Single-cell multiregion dissection of Alzheimer’s disease > Methods > snRNA-seq
plainn = 48- Asserted: passes — The authors put it forward as true.
- Checkable: passes — It can be checked against evidence.
- Load-bearing: passes — The paper’s conclusions depend on it.
- Based: passes — The paper gives a reason why it holds.
Probably not a substantial claim. It may state two separate claims as one.
What the paper did — it cites no source for this, so there is none to check. The quote shows it is in the paper.
In the paper
“For our final set of differential genes in each analysis, we took all genes that were significant (Padj > 0.05) and concordant in both the MAST and Nebula results.”
§ Single-cell multiregion dissection of Alzheimer’s disease > Methods > Differential gene expression
plain- Asserted: passes — The authors put it forward as true.
- Checkable: passes — It can be checked against evidence.
- Load-bearing: passes — The paper’s conclusions depend on it.
- Based: passes — The paper gives a reason why it holds.
Probably not a substantial claim.
What the paper did — it cites no source for this, so there is none to check. The quote shows it is in the paper.
In the paper
“Our study has several limitations: isotropic fractionation and read depth cut-offs may bias cell recovery based on their nuclear content; nuclear RNA may not fully capture microglial states82 or localized transcriptomic changes; and pathology burden is based on per-sample averages instead of on the spatial context of each cell.”
§ Single-cell multiregion dissection of Alzheimer’s disease > Discussion
plain- Asserted: passes — The authors put it forward as true.
- Checkable: passes — It can be checked against evidence.
- Load-bearing: fails — The paper’s conclusions may not depend on it.
- Based: passes — The paper gives a reason why it holds.
Probably not a substantial claim. The paper’s conclusions may not depend on it.
What the paper did — it cites no source for this, so there is none to check. The quote shows it is in the paper.
In the paper
“No statistical methods were used to predetermine sample size.”
§ Single-cell multiregion dissection of Alzheimer’s disease > Methods > Data reporting
plain- Asserted: passes — The authors put it forward as true.
- Checkable: passes — It can be checked against evidence.
- Load-bearing: fails — The paper’s conclusions may not depend on it.
- Based: passes — The paper gives a reason why it holds.
Probably not a substantial claim. The paper’s conclusions may not depend on it.
What the paper did — it cites no source for this, so there is none to check. The quote shows it is in the paper.
In the paper
“To robustly estimate modules for each set of cells in our analyses, we first performed a grid search for the optimal number of SVD components for cells of that type. We then computed the z-scored matrices for each of 10 bootstraps, selecting 90% of batches for each bootstrap and using only genes expressed in over 5% of cells in the full dataset for the cell type.”
§ Single-cell multiregion dissection of Alzheimer’s disease > Methods > Gene expression and regulon modules
plain- Asserted: passes — The authors put it forward as true.
- Checkable: passes — It can be checked against evidence.
- Load-bearing: passes — The paper’s conclusions depend on it.
- Based: passes — The paper gives a reason why it holds.
Probably not a substantial claim. It may state two separate claims as one.
What the paper did — it cites no source for this, so there is none to check. The quote shows it is in the paper.
In the paper
“Researchers were blinded to animal genotype.”
§ Single-cell multiregion dissection of Alzheimer’s disease > Methods > Immunohistochemistry
plain- Asserted: passes — The authors put it forward as true.
- Checkable: passes — It can be checked against evidence.
- Load-bearing: fails — The paper’s conclusions may not depend on it.
- Based: passes — The paper gives a reason why it holds.
Probably not a substantial claim. The paper’s conclusions may not depend on it.
What the paper did — it cites no source for this, so there is none to check. The quote shows it is in the paper.
In the paper
“Sample sizes were determined on the basis of previous work from our laboratory, without power analysis calculation or randomization.”
§ Single-cell multiregion dissection of Alzheimer’s disease > Methods > Immunohistochemistry
plain- Asserted: passes — The authors put it forward as true.
- Checkable: passes — It can be checked against evidence.
- Load-bearing: fails — The paper’s conclusions may not depend on it.
- Based: passes — The paper gives a reason why it holds.
Probably not a substantial claim. The paper’s conclusions may not depend on it.
What the paper did — it cites no source for this, so there is none to check. The quote shows it is in the paper.
In the paper
“The number of components (K) to use for cNMF was determined on the basis of a diagnostic plot showing the stability of the solution and the Frobenius reconstruction error as a function of K.”
§ Single-cell multiregion dissection of Alzheimer’s disease > Methods > Gene expression and regulon modules
plain- Asserted: passes — The authors put it forward as true.
- Checkable: passes — It can be checked against evidence.
- Load-bearing: fails — The paper’s conclusions may not depend on it.
- Based: passes — The paper gives a reason why it holds.
Probably not a substantial claim. The paper’s conclusions may not depend on it.
A conclusion the paper draws from its own results — it cites no other source for it, so there is none to check. The quote shows it is in the paper.
In the paper
“Instead, we can analytically approximate the covariance with the SVD of XT = UnSnVnT as Cn ≈ (UnSnVnT)T(UnSnVnT)/g = VnSn2VnT/g and therefore Cn−1/2 = g1/2VnSn−1VnT.”
§ Single-cell multiregion dissection of Alzheimer’s disease > Methods > Gene expression and regulon modules
plaindirect- Asserted: passes — The authors put it forward as true.
- Checkable: passes — It can be checked against evidence.
- Load-bearing: passes — The paper’s conclusions depend on it.
- Based: passes — The paper gives a reason why it holds.
It may state two separate claims as one.
- Rests on an assumption: Computing and storing the n by n sample-wise covariance is prohibitively expensive for modern datasets with n > 1 × 10^6.
What the paper did — it cites no source for this, so there is none to check. The quote shows it is in the paper.
In the paper
“We used the model-based analysis of single-cell transcriptomics (MAST) tool to investigate whether the CR genes identified in PFC astrocytes were also associated with CR in astrocytes from other regions of the human brain. To ensure robust analysis, we initially filtered the genes under investigation, selecting only those with more than one count in at least 10 cells. The analytical model”
§ Single-cell multiregion dissection of Alzheimer’s disease > Methods > Differential gene expression
plain- Asserted: passes — The authors put it forward as true.
- Checkable: passes — It can be checked against evidence.
- Load-bearing: passes — The paper’s conclusions depend on it.
- Based: passes — The paper gives a reason why it holds.
Probably not a substantial claim.
What the paper did — it cites no source for this, so there is none to check. The quote shows it is in the paper.
In the paper
“We calculated compositional differences in individuals with AD versus individuals without AD (or AD dementia versus no dementia) by modelling the number of cells of a certain cell type or subtype in a specific sample (individual by region) relative to the total number of cells using a quasi-binomial regression model. We modelled AD status by binary ascertainment variables (cogdx 4–5, NIA-Reagan”
§ Single-cell multiregion dissection of Alzheimer’s disease > Methods > Cell type composition
plaincorrelational- Asserted: passes — The authors put it forward as true.
- Checkable: passes — It can be checked against evidence.
- Load-bearing: passes — The paper’s conclusions depend on it.
- Based: passes — The paper gives a reason why it holds.
Probably not a substantial claim.
A conclusion the paper draws from its own results — it cites no other source for it, so there is none to check. The quote shows it is in the paper.
In the paper
“As this approximation commonly drops out the largest identity program in the data due to the decorrelation approach, we allow computing CZCA = g × VSpVT/n, for any p, to tune the relative involvement of the larger eigenvalue components of the SVD.”
§ Single-cell multiregion dissection of Alzheimer’s disease > Methods > Gene expression and regulon modules
plaindirect- Asserted: passes — The authors put it forward as true.
- Checkable: passes — It can be checked against evidence.
- Load-bearing: unclear — It is unclear whether the paper’s conclusions depend on it.
- Based: passes — The paper gives a reason why it holds.
It may state two separate claims as one.
What the paper did — it cites no source for this, so there is none to check. The quote shows it is in the paper.
In the paper
“For both chromogenic and fluorescence RNAscope experiments, puncta were manually counted by researchers blinded to the experimental group of each image.”
§ Single-cell multiregion dissection of Alzheimer’s disease > Methods > In situ hybridization (RNAscope)
plain- Asserted: passes — The authors put it forward as true.
- Checkable: passes — It can be checked against evidence.
- Load-bearing: fails — The paper’s conclusions may not depend on it.
- Based: passes — The paper gives a reason why it holds.
Probably not a substantial claim. The paper’s conclusions may not depend on it.
What the paper did — it cites no source for this, so there is none to check. The quote shows it is in the paper.
In the paper
“To identify vulnerable inhibitory neuron subtypes, we examined the association between the relative abundance of cell types and the measure of NFT density (variable tangles). We used a quasi-binomial regression model to model the number of cells belonging to a specific cell type in a given sample (individual study participant), relative to the total number of cells in that sample. We fitted the”
§ Single-cell multiregion dissection of Alzheimer’s disease > Methods > Differential gene expression
plaincorrelationaln = 427- Asserted: passes — The authors put it forward as true.
- Checkable: passes — It can be checked against evidence.
- Load-bearing: passes — The paper’s conclusions depend on it.
- Based: passes — The paper gives a reason why it holds.
Probably not a substantial claim.
In the paper
“To create the module–module network across microglial and immune modules, we calculated module–module score Pearson correlations using the logged module scores at the aggregated subtype by sample level, using a one-sided test with Padj < 0.01 as a cut-off105.”
§ Single-cell multiregion dissection of Alzheimer’s disease > Methods > Gene expression and regulon modules
What the sources say
- Not checked — no full text of the sourcecites [105] Student. Probable error of a correlation coefficient. Biometrika 6, 302–310 (1908). source
plaincorrelational- Asserted: passes — The authors put it forward as true.
- Checkable: passes — It can be checked against evidence.
- Load-bearing: fails — The paper’s conclusions may not depend on it.
- Based: passes — The paper gives a reason why it holds.
Probably not a substantial claim. The paper’s conclusions may not depend on it.
What the paper did — it cites no source for this, so there is none to check. The quote shows it is in the paper.
In the paper
“To account for multiple hypothesis testing, the obtained P values were further adjusted using the Bonferroni method.”
§ Single-cell multiregion dissection of Alzheimer’s disease > Methods > Cell–cell communication analysis
plain- Asserted: passes — The authors put it forward as true.
- Checkable: passes — It can be checked against evidence.
- Load-bearing: fails — The paper’s conclusions may not depend on it.
- Based: passes — The paper gives a reason why it holds.
Probably not a substantial claim. The paper’s conclusions may not depend on it.
What the paper did — it cites no source for this, so there is none to check. The quote shows it is in the paper.
In the paper
“To confirm the differential gene expression results based on the CR and CDR scores, we also evaluated the association between gene expression and global cognitive function or the rate of change of global cognitive function adjusting for AD pathology as a covariate. The AD pathology measures considered as a covariate were global AD pathology (gpath), neuritic plaque burden (plaq_n), NFT burden (nft”
§ Single-cell multiregion dissection of Alzheimer’s disease > Methods > Differential gene expression
plaincorrelational- Asserted: passes — The authors put it forward as true.
- Checkable: passes — It can be checked against evidence.
- Load-bearing: fails — The paper’s conclusions may not depend on it.
- Based: passes — The paper gives a reason why it holds.
Probably not a substantial claim. The paper’s conclusions may not depend on it. It may state two separate claims as one.
What the paper did — it cites no source for this, so there is none to check. The quote shows it is in the paper.
In the paper
“We compared the fractional abundances of pairs of neuronal subtypes between two regions using Kendall’s τ only in individuals with AD (NIA-Reagan score). Significance was assessed using beta regression (R library betareg) controlling for sex, APOE genotype, post-mortem interval and age of death, and we adjusted P values using p.adjust in R with the fdr method.”
§ Single-cell multiregion dissection of Alzheimer’s disease > Methods > Cell type composition
plaincorrelational- Asserted: passes — The authors put it forward as true.
- Checkable: passes — It can be checked against evidence.
- Load-bearing: fails — The paper’s conclusions may not depend on it.
- Based: passes — The paper gives a reason why it holds.
Probably not a substantial claim. The paper’s conclusions may not depend on it.
The paper relies on this without support.
Single-nucleus RNA-sequencing of post-mortem nuclei accurately reflects the cellular composition and transcriptomes of the human brain regions sampled.
“we performed single-nucleus RNA-sequencing (snRNA-seq) analysis of nuclei isolated from 283 post-mortem brain samples across six brain regions from 48 participants”
The paper relies on this without support.
The 48 individuals and 283 samples are representative of the broader aged human population with and without Alzheimer’s disease.
“We selected 48 participants on the basis of pathologic diagnosis of AD (stratified by NIA-Reagan score of 26 (with AD) and 22 (without AD; labelled non-AD)) and on the basis of clinical diagnosis of Alzheimer’s dementia (n = 16) versus non-dementia (n = 32)29,30”
The paper relies on this without support.
Cell type clusters annotated from transcriptomes correspond to bona fide biological cell types.
“We annotated 76 high-resolution cell types in 14 major cell type groups”
The paper relies on this without support.
Gene module expression scores reflect functional biological programs.
“We developed a method, single-cell decorrelated module networks (scdemon), to identify gene expression modules from highly correlated sets of genes in atlas-scale snRNA-seq datasets”
The paper relies on this without support.
Mouse models (App-KI and Tau(P301S)) recapitulate aspects of human Alzheimer’s disease relevant to Reelin neuron vulnerability.
“To determine whether this finding was conserved in animal models of AD, we used immunohistochemistry to assess the expression of Reelin in the EC of both 12-month-old App knock-in (KI) mice and 9-month-old Tau(P301S) transgenic mice.”
The paper relies on this without support.
Co-depletion of neuronal subtypes across connected regions reflects coordinated vulnerability rather than independent regional effects.
“We found that vulnerable neuronal subtypes were co-depleted specifically in individuals with AD”
The paper relies on this without support.
The association between the astrocyte program and cognitive resilience to Alzheimer’s disease pathology is biologically meaningful or causal.
“We identify an astrocyte program that is associated with cognitive resilience to Alzheimer’s disease pathology”
The authors state this as an assumption.
The CR score, defined as the difference between observed cognition and cognition expected on the basis of pathology level, validly measures cognitive resilience.
“we defined CR either categorically as the absence of cognitive impairment despite a pathologic diagnosis of AD (clinical diagnosis condition), or continuously, as the difference between observed cognition and the cognition expected on the basis of pathology level (Fig. 5a).”
The authors state this as an assumption.
Pathology measurements can be used to predict global cognitive function or rate of cognitive decline.
“Pathology measurements are used to predict global cognitive function, for CR scores, or rate of cognitive decline, for CDR scores.”
The paper relies on this without support.
The 48 selected individuals are representative of the aged human brain with and without AD.
“We selected 48 individuals from ROSMAP, both ongoing longitudinal clinical–pathological cohort studies of ageing and dementia, in which all of the participants are brain donors.”
The paper relies on this without support.
Single-cell data often contain an unbalanced composition of cell types, so modules computed using gene–gene correlations will be dominated by the most common cell type markers and pathways.
“However, in single-cell data, which often contain an unbalanced composition of cell types, modules computed using this approach will be dominated by the most common cell type markers and pathways.”
The paper relies on this without support.
Correlation values will often be inflated for pairs of sparsely expressed genes.
“Moreover, correlation values will often be inflated for pairs of sparsely expressed genes.”
The paper relies on this without support.
Computing and storing the n by n sample-wise covariance is prohibitively expensive for modern datasets with n > 1 × 10^6.
“Computing and storing the n by n sample-wise covariance Cn = XXT/g is prohibitively expensive for modern datasets (with n > 1 × 10⁶), even without centring X.”
Claims other papers make about this one
Each is checked against this paper’s own text: does it say what the citing paper says it does?
The check wasn’t confident either way, so it gives no verdict — never disputed.
In the citing paper
“For instance, findings from the Accelerating Medicines Partnership–Alzheimer's Disease (AMP-AD) consortium originally attributed to immune-metabolic hubs were later found to reflect cell composition shifts rather than genuine regulatory networks318,319.”
From Artificial intelligence-driven multi-omics approaches in Alzheimer's disease: Progress, challenges, and future directions (2025) · cites this paper as [318]
Experimental — accuracy not yet measured
Self-check
Percentages, sums and reported differences re-computed from the paper’s own numbers.
Each contradiction between two passages listed here was confirmed by an independent check.
Rated minor: it would not touch a result — a value no result rests on, a p-value that stays on the same side of the significance level, or a conflict that is clerical, resolved elsewhere in the paper, or outside its own findings.
In the paper
§ Single-cell multiregion dissection of Alzheimer’s disease > Pathology-specific expression changes
“≥3 DEGs for one of plaques or NFTs, and ≤2 for the other”
§ Single-cell multiregion dissection of Alzheimer’s disease > Methods > Differential gene expression
“Genes were retained if they were consistently up (or down) in 3+ regions for either NFT or plaque but in fewer than 2 regions for the other pathology measurement”
Rated minor: it would not touch a result — a value no result rests on, a p-value that stays on the same side of the significance level, or a conflict that is clerical, resolved elsewhere in the paper, or outside its own findings.
In the paper
§ Single-cell multiregion dissection of Alzheimer’s disease > Pathology-specific expression changes
“RNAscope validation of astrocyte energy metabolism DEGs in the AG of individuals with AD relative to control individuals without AD”
§ Single-cell multiregion dissection of Alzheimer’s disease > Pathology-specific expression changes
“The dots represent individual cells, pooled from eight samples (four individuals; each had one PFC and one thalamus sample).”
Rated minor: it would not touch a result — a value no result rests on, a p-value that stays on the same side of the significance level, or a conflict that is clerical, resolved elsewhere in the paper, or outside its own findings.
In the paper
§ Single-cell multiregion dissection of Alzheimer’s disease > Methods > Data reporting
“The experiments were not randomized and the investigators were not blinded to allocation during experiments and outcome assessment.”
§ Single-cell multiregion dissection of Alzheimer’s disease > Methods > In situ hybridization (RNAscope)
“For both chromogenic and fluorescence RNAscope experiments, puncta were manually counted by researchers blinded to the experimental group of each image.”
Rated minor: it would not touch a result — a value no result rests on, a p-value that stays on the same side of the significance level, or a conflict that is clerical, resolved elsewhere in the paper, or outside its own findings.
In the paper
§ Single-cell multiregion dissection of Alzheimer’s disease > Regional expression differences in AD
“we computed DEGs for each major cell type in every region alone and across regions using a negative binomial linear mixed model framework”
§ Single-cell multiregion dissection of Alzheimer’s disease > Methods > Differential gene expression
“For Nebula we used a Poisson mixed-model on the counts data with an offset of the log10-transformed total counts per cell.”
Rated minor: it would not touch a result — a value no result rests on, a p-value that stays on the same side of the significance level, or a conflict that is clerical, resolved elsewhere in the paper, or outside its own findings.
In the paper
§ Single-cell multiregion dissection of Alzheimer’s disease > Methods > Cell type composition
“We compared the fractional abundances of pairs of neuronal subtypes between two regions using Kendall’s τ only in individuals with AD (NIA-Reagan score).”
§ Single-cell multiregion dissection of Alzheimer’s disease > Vulnerable neuronal subtypes in AD
“These included co-depletion for entorhinal L5 versus L5-projecting subiculum (Kendall’s τ = 0.37 (AD); −0.1 (non-AD))”
Citations
Cites
Moderated estimation of fold change and dispersion for RNA-seq data with DESeq2
Love, M. I., Huber, W., & Anders, S. (2014) · Genome Biology · doi:10.1186/s13059-014-0550-8 · Cited by 95,106
Fitting Linear Mixed-Effects Models Using lme4
Bates, D., Mächler, M., Bolker, B., & Walker, S. (2015) · Journal of Statistical Software · doi:10.18637/jss.v067.i01 · Cited by 86,835
Robinson, M. D., McCarthy, D. J., & Smyth, G. K. (2010) · Bioinformatics · doi:10.1093/bioinformatics/btp616 · Cited by 41,364
lmerTest Package: Tests in Linear Mixed Effects Models
Kuznetsova, A., Brockhoff, P. B., & Christensen, R. H. B. (2017) · Journal of Statistical Software · doi:10.18637/jss.v082.i13 · Cited by 24,346
SCANPY: large-scale single-cell gene expression data analysis
Wolf, F. A., Angerer, P., & Theis, F. J. (2018) · Genome Biology · doi:10.1186/s13059-017-1382-0 · Cited by 8,881
Massively parallel digital transcriptional profiling of single cells
Zheng, G. X. Y., Terry, J. M., Belgrader, P., Ryvkin, P., Bent, Z. W., Wilson, R., Ziraldo, S. B., Wheeler, T. D., McDermott, G. P., Zhu, J., et al. (2017) · Nature Communications · doi:10.1038/ncomms14049 · Cited by 7,353
Scenic: single-cell regulatory network inference and clustering.
Aibar, S., González-Blas, C. B., Moerman, T., Huynh-Thu, V. A., Imrichova, H., Hulselmans, G., Rambow, F., Marine, J.-C., Geurts, P., Aerts, J., et al. (2017) · Nature Methods · doi:10.1038/nmeth.4463 · Cited by 6,520
From Louvain to Leiden: guaranteeing well-connected communities
Traag, V. A., Waltman, L., & van Eck, N. J. (2019) · Scientific Reports · doi:10.1038/s41598-019-41695-z · Cited by 5,635
Dissecting the multicellular ecosystem of metastatic melanoma by single-cell RNA-seq
Tirosh, I., Izar, B., Prakadan, S. M., Wadsworth, M. H., Treacy, D., Trombetta, J. J., Rotem, A., Rodman, C., Lian, C., Murphy, G., et al. (2016) · Science · doi:10.1126/science.aad0501 · Cited by 4,944
McGinnis, C. S., Murrow, L. M., & Gartner, Z. J. (2019) · Cell Systems · doi:10.1016/j.cels.2019.03.003 · Cited by 4,521
Research works printed but not linked: 3
- Franjic, D. et al. Transcriptomic taxonomy and neurogenic trajectories of adult human, macaque, and pig hippocampal and entorhinal cells. Neuron 110, 452–469.e14 (2022). · DOI · Paper page
- Hafemeister, C. & Satija, R. Analyzing scRNA-seq data with the sctransform and offset models. Preprint at https://satijalab.org/pdf/sctransform_offset.pdf (2020).
- Csardi, G. & Nepusz, T. The igraph software package for complex network research. InterJournal 1695, 1–9 (2006).
Cited by
Sorted by citations
Items 301–344 of 344
Effect of choline supplementation in presymptomatic APOE ε4 carriers: a pilot study
Ray, W. J., Lightfoot, Y. L., Trinh, R. T. P., Fawver-Kahle, J. N., Cooper, S., Tsai, L., Bortz, J., Trujillo‐Gonzalez, I., Zhang, T., Wu, H., et al. (2026) · Alzheimer s & Dementia Translational Research & Clinical Interventions · doi:10.1002/trc2.70323
Self-citationAtypical Alzheimer disease: a multi-axis framework toward defining heterogeneity
Grinberg, L. T., & Murray, M. E. (2026) · Nature Reviews Neurology · doi:10.1038/s41582-026-01267-y
BRIDGE-AD reveals Alzheimer’s disease effectors through interpretable large-scale omics integrationPreprint
Baltušytė, G., Cerneckis, J., Convey, H., Sun, G., Abela, Z. C. E., Ramirez, M., Wang, D., Sun, G., Zhou, T., Spring, D. R., et al. (2026) · bioRxiv (Cold Spring Harbor Laboratory) · doi:10.64898/2026.09.14.750802
Selective depletion of upper-layer somatostatin interneuron subtypes in schizophreniaPreprint
Endresz, N., Fafouti, M. E., Arbabi, K., Zhou, X., DeLong, T., González‐Burgos, G., Duncan, L. E., Sibille, E. L., & Tripathy, S. J. (2026) · bioRxiv (Cold Spring Harbor Laboratory) · doi:10.64898/2026.09.18.752621
Polyamines across neurodegenerative proteinopathies
Ranxhi, B., LeWitt, P. A., Tsou, W., & Todi, S. V. (2026) · Neurobiology of Disease · doi:10.1016/j.nbd.2026.107629
Advances in the treatment of Alzheimer's disease upon nanozymes
Yan, Y., Liu, Q., Huo, Y., Wang, H., Cheng, Y., Qiao, H., & Zhang, R. (2026) · Nano Today · doi:10.1016/j.nantod.2026.103197
Spatial cell-cell communication inference based on cell-spot-ligand-receptor heterogeneous graphs
Li, X., Wu, D., Zhang, Y., Chen, M., & Liu, C. (2026) · PLoS Computational Biology · doi:10.1371/journal.pcbi.1014835
Moreno, M. D. M. M., Celis, K., Rajabli, F., Whitehead, P. L., Hamilton‐Nelson, K. L., Dykxhoorn, D. M., Nuytemans, K., Mesulam, M. M., Bennett, D. A., Schuck, T., et al. (2026) · Frontiers in Aging Neuroscience · doi:10.3389/fnagi.2026.1888862
Self-citationWang, T., Wang, L., Cao, J., Zhao, Y., He, Z., & Lu, F. (2026) · Frontiers in Immunology · doi:10.3389/fimmu.2026.1956600
Park, S., Hwang, Y., Kwak, J., Lin, Y., Park, H., Nam, E., Han, J., Park, S. C., Kim, H., Kim, J., et al. (2026) · Advanced Science · doi:10.1002/advs.77886
From Amyloid Exposure to Genetic Causality: Converging hiPSC-Based Models of Alzheimer’s Disease
Colasuonno, F., Valenza, A., Rossin, F., & Moreno, S. (2026) · Cells · doi:10.3390/cells15191793
Cha, Y., & Kim, K. (2026) · Cell Reports Medicine · doi:10.1016/j.xcrm.2026.103104
Regional tau burden tracks with lower microglial HLA class II transcription in the human brain
Li, F., Jin, S., Wang, P., Yang, H., 庄向华, Feng, F., & Cheng, P. (2026) · Frontiers in Neuroscience · doi:10.3389/fnins.2026.1979981
Cell-Cell Communication Patterns in Alzheimer’s Disease Differ by Cortical LayerPreprint
Dai, Q., Murphy, M., Lyu, J., Tang, S., Hu, J., Tasaki, S., Wang, Y., Bennett, D. A., Menon, V., Jager, P. L. D., et al. (2026) · medRxiv · doi:10.64898/2026.10.05.26364776
Self-citationChen, Y., Li, F., Junlei, Z., 魏明清, 倪敬年, Li, T., Yao, L., Tian, J., & Shi, J. (2026) · Alzheimer s & Dementia · doi:10.1002/alz.71909
Yin, G., Tan, W., Wang, D., He, Z., 窦彩霞, Wang, H., Lu, Q., 钟根深, Du, F., & Yin, P. (2026) · Analytical Chemistry · doi:10.1021/acs.analchem.6c05055
Li, Y., Tang, Z.-L., Liu, F.-W., Chen, M., Chang, S.-Q., Feng-min, D., Bian, Q.-L., Pan, J.-P., Qiu, Z.-C., Kong, M., et al. (2026) · Journal of Ethnopharmacology · doi:10.1016/j.jep.2026.122475
Han, S., Wang, S., Liu, J., Liu, X., Wang, Q., & Meng, C. (2026) · Frontiers in Cell and Developmental Biology · doi:10.3389/fcell.2026.1929282
Dominicus, C. S., Peretti, D., Rodschinka, G., Ogden, S., Steer, J., Leija‐Salazar, M., Feriz, A. M., Feng, C., Kataria, S., Su, J., et al. (2026) · bioRxiv (Cold Spring Harbor Laboratory) · doi:10.64898/2026.10.13.758778
Suk, K. (2026) · Neuroscience & Biobehavioral Reviews · doi:10.1016/j.neubiorev.2026.107039
Emerging frontiers for AI in single-cell genomics
Mitra, S., Li, J., & Leslie, C. S. (2026) · Molecular Cell · doi:10.1016/j.molcel.2026.09.014
Moattar-Husseini, Z., Ahmadi, A., & Mohebi, N. (2026) · IBRO Neuroscience Reports · doi:10.1016/j.ibneur.2026.10.004
Zhao, X., Zeng, Y., Song, Z., He, J., He, Q., Lin, H., Liu, L., Yu, W., & Cheng, S. (2026) · International Journal of Molecular Sciences · doi:10.3390/ijms27209190
A cell-type-directed drug repurposing framework for Alzheimer's disease subtypes
Li, Y., Tang, X., Serras, C. P., Tang, A., Oskotsky, T., & Sirota, M. (2026) · Acta Pharmaceutica Sinica B · doi:10.1016/j.apsb.2026.10.019
Yang, W. S., Shin, M. S., Choe, M. S., Kiral, F. R., Kim, J., Park, H., Felix, M., Osmani, L., Park, I., & Kang, I. (2026) · Proceedings of the National Academy of Sciences · doi:10.1073/pnas.2605209123
Naffaa, M. M. (2026) · Exploratory Research and Hypothesis in Medicine · doi:10.14218/erhm.2026.00045
Progenitor transcriptional alterations link fetal and adult pathology in Huntington’s disease
Battistella, M., Damaggio, G., Conforti, P., Scolz, A., Maestri, S., Bocchi, V. D., Iafolla, D., Galimberti, M., Morrocchi, M., Cordiglieri, C., et al. (2026) · Brain · doi:10.1093/brain/awag364
Shi, C. H., Zhu, B., Pina-Crespo, J., Chen, W. N., Vo, G. V., Huang, H., Yip, K. Y., & Huang, T. Y. (2026) · bioRxiv (Cold Spring Harbor Laboratory) · doi:10.64898/2026.10.15.759523
You, L., Durbin, J. L., Meng, G., Stallaert, W., Li, G., Uttam, S., Feng, H., Glausier, J. R., & Wang, J. (2026) · bioRxiv (Cold Spring Harbor Laboratory) · doi:10.64898/2026.10.22.761199
Villegas-Salmerón, J., Egan, S., Sanfeliu, A., Higgins, J., Heiland, M., El‐Mansoury, B., Connolly, N. M. C., Henshall, D. C., & Mamad, O. (2026) · bioRxiv (Cold Spring Harbor Laboratory) · doi:10.64898/2026.10.22.760890
Gommerman, J. L., Akassoglou, K., Baranzini, S. E., Becher, B., Brilot, F., Castelo‐Branco, G., Dunn, S. E., Faiz, M., Flügel, A., Ghasemlou, N., et al. (2026) · Nature Reviews Neurology · doi:10.1038/s41582-026-01272-1
He, L., He, Z., Yu, Z., Bao, H., Zhang, Q., Duan, X., Wu, A., & Li, J. (2026) · ACS Nano · doi:10.1021/acsnano.6c08616
Pegoraro, G., Isgoren, M. E., Rizzo, L., Soto, L. M., Yeganeh, P. N., Sung, I., Gupta, S., Kim, D. Y., Tanzi, R. E., Lunnon, K., et al. (2026) · bioRxiv (Cold Spring Harbor Laboratory) · doi:10.64898/2026.10.26.761919
Self-citationTian, Y., Guo, J., Lin, X., Zhang, F., Xie, J., Hou, X., Deng, J., Hao, E., & Du, Z. (2026) · Journal of Ethnopharmacology · doi:10.1016/j.jep.2026.122574
Endocannabinoid regulation of microglia–astrocyte crosstalk in Alzheimer’s disease
Rao, J. S., Tangarife, M. A., Rodríguez‐Soacha, D. A., & Mukunda, R. (2026) · Academia Drug Development and Pharmacotherapy · doi:10.20935/acaddrug8564
Adult inactivation of the Reln gene leads to disruption of cortical lamination and rhythmic activity
Manso, Y., Masachs, N., Vílchez-Acosta, A., González, V., Contreras-Murillo, G., Sánchez‐Campusano, R., Hernaiz-Llorens, M., Elias-Tersa, A., Llanos, M. Á., Rovira-Escalé, G., et al. (2026) · PNAS Nexus · doi:10.1093/pnasnexus/pgag363
Feng, S., Zhang, L., Yang, S., Wang, X., Li, Y., Jing, B., Hu, X., Hu, B., Wan, X., & Zhang, F. (2026) · Nucleic Acids Research · doi:10.1093/nar/gkag1075
Boulger, S. L., Lambie, N., Wos, J., Papageorgopoulou, M., Pastor, S. M., Adair, E., Thomas, M., Caramello, A., Fancy, N. N., Jackson, J., et al. (2026) · bioRxiv (Cold Spring Harbor Laboratory) · doi:10.64898/2026.10.27.762234
Piavchenko, G. A. (2026) · Sechenov Medical Journal · doi:10.47093/2218-7332.2026.17.3.21-31
Hai, H., Luo, Y., Ren, J., Xue, W., 郭茂娟, & Yang, Z. (2026) · Research Square · doi:10.21203/rs.3.rs-11220228/v1
Aliyu, Y. M., Sagir, U., Sajjad, F., Khurshid, S., Tarique, F., & Sani, I. M. (2026) · bioRxiv (Cold Spring Harbor Laboratory) · doi:10.64898/2026.10.31.763276
Integration and annotation of spatial multi-omic data with DIRAC
Xu, C., Liu, S., Yang, H., Yang, C., Cao, Y., Gao, J., Wei, S., Jia, D., Liang, D., Ma, Y., et al. (2026) · Nature Methods · doi:10.1038/s41592-026-03282-9
Moonen, S., Ospitalieri, S., Vandenberghe, R. R., Thal, D. R., & Strooper, B. (2026) · Research Square · doi:10.21203/rs.3.rs-11446407/v1
Metadata
- Authors
- Mathys, H., Boix, C. A., Akay, L. A., Xia, Z., Davila-Velderrain, J., Ng, A. P., Jiang, X., Abdelhady, G., Galani, K., Mantero, J., Band, N., James, B. T., Babu, S., Galiana-Melendez, F., Louderback, K., Prokopenko, D., Tanzi, R. E., Bennett, D. A., Tsai, L.-H., & Kellis, M.
- Affiliations
- University of Pittsburgh (US)
- Broad Institute (US)
- Massachusetts Institute of Technology (US)
- Harvard University (US)
- Rush University Medical Center (US)
- Corresponding author
- Tsai, Li-Huei
- Kellis, Manolis
- ORCID
- Venue
- Nature
- Published
- 2024-07-24
- Volume
- 632
- Issue
- 8026
- Pages
- 858-868
- ISSN
- 0028-0836 (ISSN-L)
- 1476-4687
- PMC
- PMC11338834
- OpenAlex
- W4400948944
- Cited by
- 343
- References
- 121
- Citations by year
- 2026: 189 · 2025: 132 · 2024: 22
- FWCI
- 40.57
- Type
- journal article
- Language
- en
- Open access
- hybrid
- doi.org
- Locations
- Nature (publishedVersion, cc-by)
- PubMed Central (publishedVersion, cc-by)
- PubMed (publishedVersion)
- RePEc: Research Papers in Economics (submittedVersion)
- Funders
- Schweizerischer Nationalfonds zur Förderung der Wissenschaftlichen Forschung (151885)
- National Institute on Aging (R01AG017917, R01AG058002, R01AG062335, RF1AG054012, U01AG046152, R01AG015819, P30AG010161, RF1AG062377, RF1AG054321, U01AG061356, R01AG074003, P30AG072975)
- National Institute of Mental Health (U01MH119509)
- National Human Genome Research Institute (R01HG008155)
- National Institute of General Medical Sciences (T32GM087237)
- National Institute of Neurological Disorders and Stroke (U01NS110453, UH3NS115064, UG3NS115064, R01NS127187)
- Topics
- Life Sciences › Biochemistry, Genetics and Molecular Biology › Molecular Biology › Single-cell and spatial transcriptomics
- Life Sciences › Neuroscience › Cellular and Molecular Neuroscience › Alzheimer's disease research and treatments
- Life Sciences › Neuroscience › Neurology › Neuroinflammation and Neurodegeneration Mechanisms
- Keywords
- Alzheimer's disease, single-cell transcriptomics, astrocytes, excitatory neurons, inhibitory interneurons, thalamic interneurons, neuronal vulnerability, cognitive resilience, choline metabolism, polyamine biosynthesis, postmortem brain
- MeSH terms
- Reelin Protein, Aged, 80 and over, Aging, Alzheimer Disease, Animals, Astrocytes, Autopsy, Brain, Choline, Cognition, Female, Humans, Interneurons, Male, Nerve Tissue Proteins, Neural Inhibition, Neurons, Polyamines, Thalamus, Signal Transduction, Case-Control Studies, Gene Expression Profiling, Mice, Gene Regulatory Networks, Single-Cell Analysis, Transcriptome
About these checks
Registry, retraction, Cites and statistics results are computed, not judged, with one exception: a printed reference that no index lists is read once by a model before it counts as a citation error. Claims are extracted by a model and kept only when their quote appears verbatim in the text; each cited source is then checked, with a model’s help, for whether it says what the claim relies on. Those verdicts can be wrong — read the claim’s quote and the cited source before relying on one.
A language model drew the claims from the paper on 2026-11-06, under version 3 of the claim definition (model deepseek-v4.1-flash, prompt extract-v3).
A second model labelled each claim on 2026-11-06 (model jev-1.13-20260917, definition revision gold-guideline-v0.2).
Cited sources are checked with a language model’s help (gpt-6-sol).
Statistics and arithmetic are recomputed, not judged.
Confidence bands are shown only for fields calibrated on our annotated test set. None is calibrated yet, so no band is shown.
What counts as a claim ›How we measure confidence ›How we check this ›
Are you an author, or do you see a problem with this page? Request a review
