

The DOI matches its Crossref record; 142 of the 146 references it cites were found in a registry or an index; none of the 145 sources its claims cite is checked for support yet.
Climate-driven declines in arthropod abundance restructure a rainforest food web
Open accessAbstract
Significance: Arthropods, invertebrates including insects that have external skeletons, are declining at an alarming rate. While the tropics harbor the majority of arthropod species, little is known about trends in their abundance. We compared arthropod biomass in Puerto Rico’s Luquillo rainforest with data taken during the 1970s and found that biomass had fallen 10 to 60 times. Our analyses revealed synchronous declines in the lizards, frogs, and birds that eat arthropods. Over the past 30 years, forest temperatures have risen 2.0 °C, and our study indicates that climate warming is the driving force behind the collapse of the forest’s food web. If supported by further research, the impact of climate change on tropical ecosystems may be much greater than currently anticipated.
Overview
AI snapshot
Written from the paper’s full text.
TL;DR
Long-term data from Puerto Rico’s Luquillo rainforest show arthropod biomass fell sharply between the 1970s and 2010s, with synchronous declines in insectivorous lizards, frogs, and birds. The authors argue climate warming, especially rising maximum temperatures, is the likely driver of a bottom-up food-web collapse.
Key findings
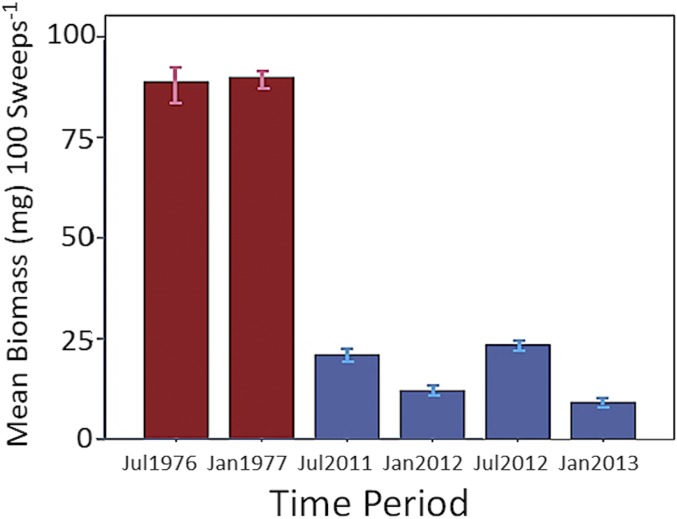
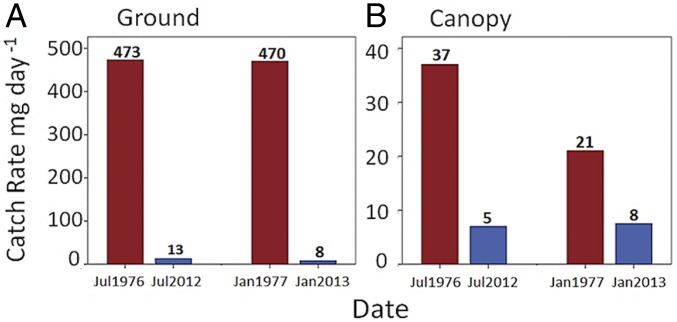
- Arthropod biomass declined across sampling methods: sweep-net biomass fell 4× in July and 8× in January; ground sticky-trap catch fell 36× from 473 to 13 mg per trap per day in July and about 60× from 470 to 8 mg per trap per day in January; canopy trap catch fell from 37 to 5 mg per trap per day in July.
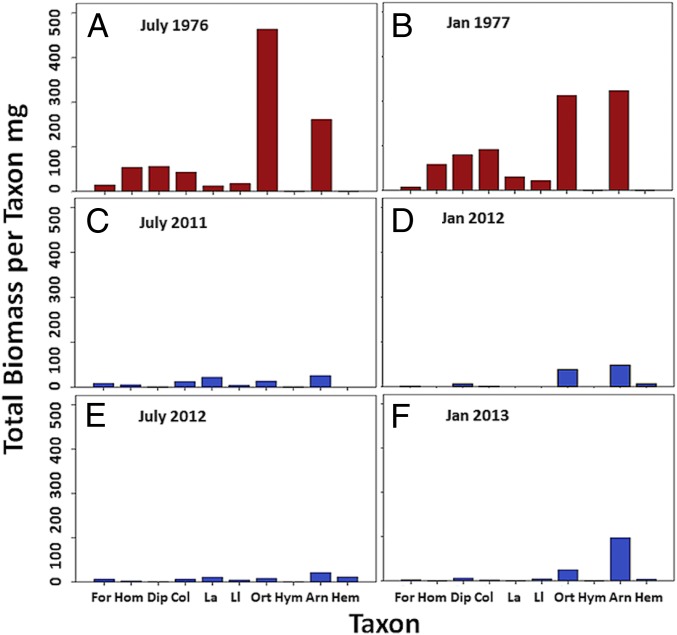
- All 10 major arthropod taxa in sweep samples declined proportionately (Kolmogorov–Smirnov z = 0.671, P = 0.759), and all 10 most-abundant canopy taxa showed negative trends from 1990–2010 (binomial probability = 0.00097).
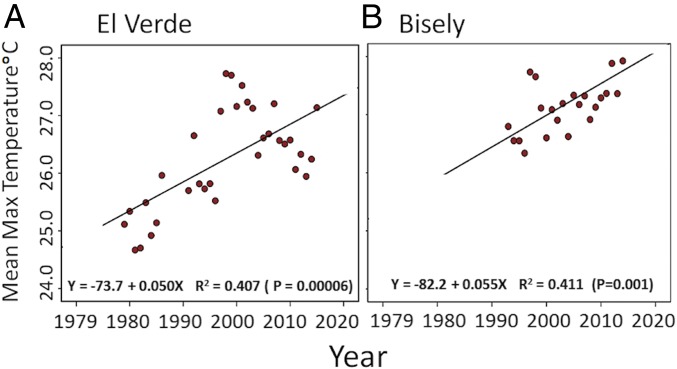
- Forest maximum temperature at El Verde rose 2.0 °C from 1978–2015 at 0.050 °C/y; at Bisley Tower the rate was 0.055 °C/y. At Bisley, the proportion of daily maximum temperatures ≥29.0 °C averaged 0.03 in 1993–1994 and 0.44 in 2014–2015, a 14-fold increase while average temperatures rose 8–10%.
- Insectivores declined: anole density fell about 2.2×, from 12,490 to 5,640 anoles per hectare, and anole biomass dropped 32%, from 401 g to 277 g; A. evermanni declined 10× and A. stratulus disappeared from sampled habitats. Insectivorous bird captures fell 53%, from 137 birds in 1990 to 64 in 2005, and the Puerto Rican tody declined 90%.
- In Mexico’s Chamela-Cuixmala dry forest, ground-trap arthropod biomass fell 8× in 2014 compared with July 1987–1988 averages.
Methods
- The study compared arthropod samples from the same Luquillo study area in July 1976 and January 1977 with samples from July 2011–2012 and January 2012–2013, using sticky traps and sweep nets; it also analyzed Luquillo LTER datasets on canopy arthropods, walking sticks, E. coqui, and birds.
- Climate data came from El Verde Field Station (1978–2015) and Bisley Tower (1993–2014), using daily maximum temperatures; analyses included quasi-Poisson regressions, hierarchical partitioning, cross-correlation with the Southern Oscillation Index, and Vinod causality.
- Additional comparisons used the same sticky-trap methods in Chamela-Cuixmala Biosphere Reserve, Mexico, in 2014 versus 1986–1987 samples.
Limitations
- Stated: no climate data were available at Bisley Tower until 1993, so E. coqui abundance could not be regressed against temperature there; the meteorological stations recorded only one maximum and minimum per 24 h, so the duration of temperatures above 29 °C could not be calculated; the extent to which altitudinal range shifts influenced the observed declines is unknown.
- Stated: the causal inference is observational, and the authors note that regression and correlation analyses leave causality open to question, using Vinod causality as a statistical aid rather than experimental proof.
- Evident: the study relies on historical datasets collected by different researchers over decades, and although methods were matched where possible, the design cannot fully exclude unmeasured factors such as hurricanes, droughts, ENSO variation, or other environmental changes.
Model-written summary. Check it against the paper before relying on it.
Integrity signals
Registry
Cites
Statistics
Figures
Verification
Claims the paper makes
95 Not checked yet · 47 Own result · 18 Own interpretation · 7 Own method · 3 No basis given
The paper states this without a source or data behind it here, so there is nothing to check it against. The quote shows it is in the paper.
In the paper
“Over the past 30 years, forest temperatures have risen 2.0 °C, and our study indicates that climate warming is the driving force behind the collapse of the forest’s food web.”
§ Climate-driven declines in arthropod abundance restructure a rainforest food web > Abstract
plain- Asserted: passes — The authors put it forward as true.
- Checkable: passes — It can be checked against evidence.
- Load-bearing: passes — The paper’s conclusions depend on it.
- Based: passes — The paper gives a reason why it holds.
- Rests on an assumption: The meteorological stations at El Verde and Bisley adequately represent the temperature exposure of the arthropod and insectivore populations studied.
A result the paper reports from its own data — it cites no other source for it, so there is none to check. The quote shows it is in the paper.
In the paper
“Our analyses revealed synchronous declines in the lizards, frogs, and birds that eat arthropods.”
§ Climate-driven declines in arthropod abundance restructure a rainforest food web > Abstract
plaincorrelational- Asserted: passes — The authors put it forward as true.
- Checkable: passes — It can be checked against evidence.
- Load-bearing: passes — The paper’s conclusions depend on it.
- Based: passes — The paper gives a reason why it holds.
- Rests on an assumption: The historical data from the 1970s and other earlier censuses are comparable to the authors’ later samples despite the time gap and any differences in observers or methods.
A result the paper reports from its own data — it cites no other source for it, so there is none to check. The quote shows it is in the paper.
In the paper
“We compared arthropod biomass in Puerto Rico’s Luquillo rainforest with data taken during the 1970s and found that biomass had fallen 10 to 60 times.”
- Also stated in: § Arthropods. · plain
“Compared with the earlier samples, arthropod biomass for July 2011–2012 and January 2012–2013 fell four and eight times, respectively.”
§ Climate-driven declines in arthropod abundance restructure a rainforest food web > Abstract
plain- Asserted: passes — The authors put it forward as true.
- Checkable: passes — It can be checked against evidence.
- Load-bearing: passes — The paper’s conclusions depend on it.
- Based: passes — The paper gives a reason why it holds.
- Rests on an assumption: The historical data from the 1970s and other earlier censuses are comparable to the authors’ later samples despite the time gap and any differences in observers or methods.
- Also stated in: § Arthropods. · plain
A result the paper reports from its own data — it cites no other source for it, so there is none to check. The quote shows it is in the paper.
In the paper
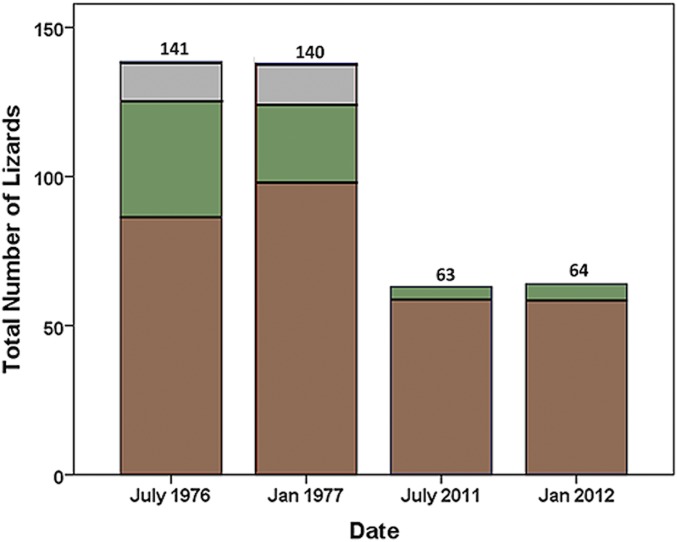
“Mean anole biomass within the study area dropped 32%, from 401 g to 277 g (Fig. 6 and SI Appendix, Table S1).”
§ Climate-driven declines in arthropod abundance restructure a rainforest food web > Results > Anoles.
plain- Asserted: passes — The authors put it forward as true.
- Checkable: passes — It can be checked against evidence.
- Load-bearing: passes — The paper’s conclusions depend on it.
- Based: passes — The paper gives a reason why it holds.
- Rests on an assumption: The historical data from the 1970s and other earlier censuses are comparable to the authors’ later samples despite the time gap and any differences in observers or methods.
A result the paper reports from its own data — it cites no other source for it, so there is none to check. The quote shows it is in the paper.
In the paper
“A. stratulus, with a density in the 1970s of 200 individuals per hectare, had disappeared from the interior forest, edge habitats, and other regularly visited habitats lying within 4 km to the east and west of the study area.”
§ Climate-driven declines in arthropod abundance restructure a rainforest food web > Results > Anoles.
plain- Asserted: passes — The authors put it forward as true.
- Checkable: passes — It can be checked against evidence.
- Load-bearing: passes — The paper’s conclusions depend on it.
- Based: passes — The paper gives a reason why it holds.
- Rests on an assumption: The historical data from the 1970s and other earlier censuses are comparable to the authors’ later samples despite the time gap and any differences in observers or methods.
A result the paper reports from its own data — it cites no other source for it, so there is none to check. The quote shows it is in the paper.
In the paper
“The binomial probability of this pattern occurring by chance alone is 0.00097.”
§ Climate-driven declines in arthropod abundance restructure a rainforest food web > Results > Arthropods.
plain- Asserted: passes — The authors put it forward as true.
- Checkable: passes — It can be checked against evidence.
- Load-bearing: passes — The paper’s conclusions depend on it.
- Based: passes — The paper gives a reason why it holds.
A result the paper reports from its own data — it cites no other source for it, so there is none to check. The quote shows it is in the paper.
In the paper
“Since 1981, the Chamela-Cuixmala Biosphere Reserve has experienced a 2.4 °C increase in average annual air temperature, from 24.5 °C in 1981 to 26.9 °C in 2014 (SI Appendix, Fig. S1).”
§ Climate-driven declines in arthropod abundance restructure a rainforest food web > Results > Arthropods.
plaindirect- Asserted: passes — The authors put it forward as true.
- Checkable: passes — It can be checked against evidence.
- Load-bearing: passes — The paper’s conclusions depend on it.
- Based: passes — The paper gives a reason why it holds.
- Rests on an assumption: The meteorological stations at El Verde and Bisley adequately represent the temperature exposure of the arthropod and insectivore populations studied.
A result the paper reports from its own data — it cites no other source for it, so there is none to check. The quote shows it is in the paper.
In the paper
“For the canopy invertebrates, there is a significant (P < 0.05) positive cross-correlation with the SOI at a time lag of 0.”
§ Climate-driven declines in arthropod abundance restructure a rainforest food web > Results > Hierarchical Partitioning, Multiple Regression, and Cross-Correlation Analyses.
plaincorrelational- Asserted: passes — The authors put it forward as true.
- Checkable: passes — It can be checked against evidence.
- Load-bearing: passes — The paper’s conclusions depend on it.
- Based: passes — The paper gives a reason why it holds.
A result the paper reports from its own data — it cites no other source for it, so there is none to check. The quote shows it is in the paper.
In the paper
“At El Verde the proportion of maximum daily temperatures equal to or exceeding 29.0 °C increased significantly between 1978 and 2015 (SI Appendix, Fig. S8E).”
§ Climate-driven declines in arthropod abundance restructure a rainforest food web > Results > Climate Trends in the Luquillo Forest.
plaindirect- Asserted: passes — The authors put it forward as true.
- Checkable: passes — It can be checked against evidence.
- Load-bearing: passes — The paper’s conclusions depend on it.
- Based: passes — The paper gives a reason why it holds.
- Rests on an assumption: The meteorological stations at El Verde and Bisley adequately represent the temperature exposure of the arthropod and insectivore populations studied.
A result the paper reports from its own data — it cites no other source for it, so there is none to check. The quote shows it is in the paper.
In the paper
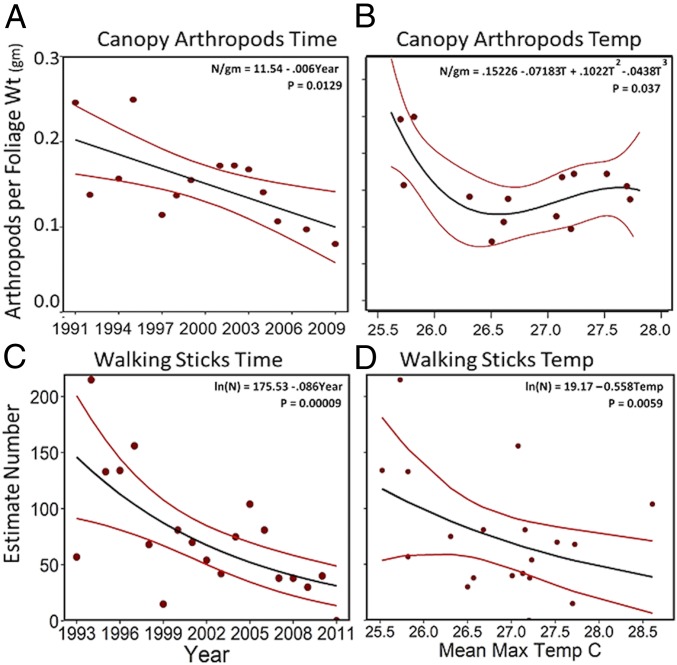
“Average ambient temperature is also a significant predictor of changes in the abundance of canopy invertebrates and walking sticks.”
§ Climate-driven declines in arthropod abundance restructure a rainforest food web > Discussion > Climate Change and Arthropods.
plaincorrelational- Asserted: passes — The authors put it forward as true.
- Checkable: passes — It can be checked against evidence.
- Load-bearing: passes — The paper’s conclusions depend on it.
- Based: passes — The paper gives a reason why it holds.
- It may state two separate claims as one. 57
- Probably not a substantial claim. 64
In the paper
“For example, the ruddy quail dove (Geotrygon montana), which eats grains and fruits almost exclusively, showed no decline in abundance between 1990 and 2015 at El Verde, while Todus mexicanus, the Puerto Rican tody, whose diet is composed entirely of insects (26), experienced a 90% reduction in catch rate.”
§ Climate-driven declines in arthropod abundance restructure a rainforest food web > Results > Birds.
What the sources say
- Not checked yetcites [26] Reagan D Waide R 1996 The Food Web of a Tropical Rain Forest Univ of Chicago Press Chicago
plain- Asserted: passes — The authors put it forward as true.
- Checkable: passes — It can be checked against evidence.
- Load-bearing: passes — The paper’s conclusions depend on it.
- Based: passes — The paper gives a reason why it holds.
It may state two separate claims as one.
- Rests on an assumption: The historical data from the 1970s and other earlier censuses are comparable to the authors’ later samples despite the time gap and any differences in observers or methods.
A result the paper reports from its own data — it cites no other source for it, so there is none to check. The quote shows it is in the paper.
In the paper
“First, from a single species of walking stick to a community of over 120 canopy taxa, long-term declines have occurred in parallel with rising temperatures.”
§ Climate-driven declines in arthropod abundance restructure a rainforest food web > Discussion > Climate Change and Arthropods.
plaincorrelational- Asserted: passes — The authors put it forward as true.
- Checkable: passes — It can be checked against evidence.
- Load-bearing: passes — The paper’s conclusions depend on it.
- Based: passes — The paper gives a reason why it holds.
It may state two separate claims as one.
- Rests on an assumption: The historical data from the 1970s and other earlier censuses are comparable to the authors’ later samples despite the time gap and any differences in observers or methods.
- Rests on an assumption: The meteorological stations at El Verde and Bisley adequately represent the temperature exposure of the arthropod and insectivore populations studied.
A result the paper reports from its own data — it cites no other source for it, so there is none to check. The quote shows it is in the paper.
In the paper
“While average temperatures increased 8–10% over the same period, the proportion of extreme temperatures increased 14 times.”
§ Climate-driven declines in arthropod abundance restructure a rainforest food web > Results > Climate Trends in the Luquillo Forest.
plain- Asserted: passes — The authors put it forward as true.
- Checkable: passes — It can be checked against evidence.
- Load-bearing: passes — The paper’s conclusions depend on it.
- Based: passes — The paper gives a reason why it holds.
It may state two separate claims as one.
- Rests on an assumption: The meteorological stations at El Verde and Bisley adequately represent the temperature exposure of the arthropod and insectivore populations studied.
A result the paper reports from its own data — it cites no other source for it, so there is none to check. The quote shows it is in the paper.
In the paper
“Inclusion of mean daily rainfall as a covariate improved the UI for all analyses except for walking sticks, which had a UI of 100 without the covariate, and for the E. coqui at the Sonadura Old study site, which retained a low UI and indeterminate causal path with and without the covariate.”
§ Climate-driven declines in arthropod abundance restructure a rainforest food web > Results > Vinod Causality.
plain- Asserted: passes — The authors put it forward as true.
- Checkable: passes — It can be checked against evidence.
- Load-bearing: unclear — It is unclear whether the paper’s conclusions depend on it.
- Based: passes — The paper gives a reason why it holds.
It may state two separate claims as one.
A result the paper reports from its own data — it cites no other source for it, so there is none to check. The quote shows it is in the paper.
In the paper
“Across all six populations, the average independent effect of MnMaxT on abundance was 25%, while the averages for four other temperature related variables ranged from 11.4 to 14.3%.”
§ Climate-driven declines in arthropod abundance restructure a rainforest food web > Results > Hierarchical Partitioning, Multiple Regression, and Cross-Correlation Analyses.
plaincorrelational- Asserted: passes — The authors put it forward as true.
- Checkable: passes — It can be checked against evidence.
- Load-bearing: passes — The paper’s conclusions depend on it.
- Based: passes — The paper gives a reason why it holds.
It may state two separate claims as one.
In the paper
“Employing Willig et al.’s (24) census data, we also conducted quasi-Poisson regressions of walking stick abundance against time and against MnMaxT during the census periods (Fig. 5 C and D). Both regressions were negative and significant.”
§ Climate-driven declines in arthropod abundance restructure a rainforest food web > Results > Arthropods.
What the sources say
- Not checked yetcites [24] Willig MR Presley SJ Bloch CP 2011 Long-term dynamics of tropical walking sticks in response to multiple large-scale and intense disturbances Oecologia 165 357 368 20677015 source
plaincorrelational- Asserted: passes — The authors put it forward as true.
- Checkable: passes — It can be checked against evidence.
- Load-bearing: passes — The paper’s conclusions depend on it.
- Based: passes — The paper gives a reason why it holds.
It may state two separate claims as one.
A result the paper reports from its own data — it cites no other source for it, so there is none to check. The quote shows it is in the paper.
In the paper
“In July 1976, the canopy trap catch rate was 37 mg per trap per day compared with 5 mg per trap per day in July 2012, and 21 mg per trap per day in January 1976 vs. 8 mg per trap per day in January 2013.”
§ Climate-driven declines in arthropod abundance restructure a rainforest food web > Results > Arthropods.
plain- Asserted: passes — The authors put it forward as true.
- Checkable: passes — It can be checked against evidence.
- Load-bearing: passes — The paper’s conclusions depend on it.
- Based: passes — The paper gives a reason why it holds.
It may state two separate claims as one.
- Rests on an assumption: The historical data from the 1970s and other earlier censuses are comparable to the authors’ later samples despite the time gap and any differences in observers or methods.
A result the paper reports from its own data — it cites no other source for it, so there is none to check. The quote shows it is in the paper.
In the paper
“In the first phase, E. coqui numbers had a significant negative trend followed by a rapid increase during phase 2 from 6 to 57 individuals between January and October 1990, most likely due to immigration from surrounding areas following Hurricane Hugo. In phase 3, the population resumed a steady decline at about the same rate as phase 1, until the census ended 6 y later.”
§ Climate-driven declines in arthropod abundance restructure a rainforest food web > Results > E. coqui.
hedgedSingle case- Asserted: passes — The authors put it forward as true.
- Checkable: passes — It can be checked against evidence.
- Load-bearing: unclear — It is unclear whether the paper’s conclusions depend on it.
- Based: passes — The paper gives a reason why it holds.
It may state two separate claims as one.
- Rests on an assumption: The historical data from the 1970s and other earlier censuses are comparable to the authors’ later samples despite the time gap and any differences in observers or methods.
A result the paper reports from its own data — it cites no other source for it, so there is none to check. The quote shows it is in the paper.
In the paper
“Between 1978 and 2015, MnMaxT at El Verde rose by 2.0 °C at an average rate of 0.050 °C per year.”
§ Climate-driven declines in arthropod abundance restructure a rainforest food web > Results > Climate Trends in the Luquillo Forest.
plaincorrelational- Asserted: passes — The authors put it forward as true.
- Checkable: passes — It can be checked against evidence.
- Load-bearing: passes — The paper’s conclusions depend on it.
- Based: passes — The paper gives a reason why it holds.
It may state two separate claims as one.
- Rests on an assumption: The meteorological stations at El Verde and Bisley adequately represent the temperature exposure of the arthropod and insectivore populations studied.
A result the paper reports from its own data — it cites no other source for it, so there is none to check. The quote shows it is in the paper.
In the paper
“However, the number of dry days (rainfall less than 1 mm) has been decreasing since 1975 (SI Appendix, Fig. S8G), while the variation in daily rainfall has been increasing (SI Appendix, Fig. S8H).”
§ Climate-driven declines in arthropod abundance restructure a rainforest food web > Results > Climate Trends in the Luquillo Forest.
plain- Asserted: passes — The authors put it forward as true.
- Checkable: passes — It can be checked against evidence.
- Load-bearing: unclear — It is unclear whether the paper’s conclusions depend on it.
- Based: passes — The paper gives a reason why it holds.
It may state two separate claims as one.
- Rests on an assumption: The meteorological stations at El Verde and Bisley adequately represent the temperature exposure of the arthropod and insectivore populations studied.
In the paper
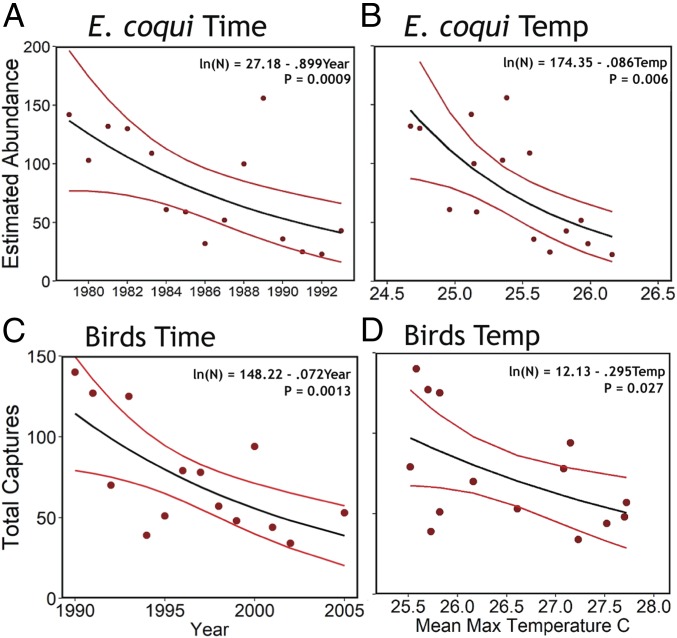
“The quasi-Poisson regressions of E. coqui numbers vs. time and MnMaxT for Stewart’s Activity Transect were both negative and significant (Fig. 7 A and B) (28).”
§ Climate-driven declines in arthropod abundance restructure a rainforest food web > Results > E. coqui.
What the sources say
- Not checked yetcites [28] Stewart MM 1995 Climate driven population fluctuations in rain forest frogs J Herpetol 29 437 446 source
plaincorrelational- Asserted: passes — The authors put it forward as true.
- Checkable: passes — It can be checked against evidence.
- Load-bearing: passes — The paper’s conclusions depend on it.
- Based: passes — The paper gives a reason why it holds.
It may state two separate claims as one.
- Rests on an assumption: The historical data from the 1970s and other earlier censuses are comparable to the authors’ later samples despite the time gap and any differences in observers or methods.
A result the paper reports from its own data — it cites no other source for it, so there is none to check. The quote shows it is in the paper.
In the paper
“For the Sonadura Old population, only the regression of numbers on time was significant (P = 0.013), while the regression of abundance on temperature was marginally insignificant (P = 0.067).”
§ Climate-driven declines in arthropod abundance restructure a rainforest food web > Results > E. coqui.
plain- Asserted: passes — The authors put it forward as true.
- Checkable: passes — It can be checked against evidence.
- Load-bearing: unclear — It is unclear whether the paper’s conclusions depend on it.
- Based: passes — The paper gives a reason why it holds.
It may state two separate claims as one.
- Rests on an assumption: The historical data from the 1970s and other earlier censuses are comparable to the authors’ later samples despite the time gap and any differences in observers or methods.
A result the paper reports from its own data — it cites no other source for it, so there is none to check. The quote shows it is in the paper.
In the paper
“Compared with the earlier samples, arthropod biomass for July 2011–2012 and January 2012–2013 fell four and eight times, respectively.”
§ Climate-driven declines in arthropod abundance restructure a rainforest food web > Results > Arthropods.
plain- Asserted: passes — The authors put it forward as true.
- Checkable: passes — It can be checked against evidence.
- Load-bearing: passes — The paper’s conclusions depend on it.
- Based: passes — The paper gives a reason why it holds.
It may state two separate claims as one.
- Rests on an assumption: The historical data from the 1970s and other earlier censuses are comparable to the authors’ later samples despite the time gap and any differences in observers or methods.
A result the paper reports from its own data — it cites no other source for it, so there is none to check. The quote shows it is in the paper.
In the paper
“The regressions of E. coqui numbers vs. time and temperature for the Sonadura West study area were also negative and significant (SI Appendix, Fig. S3A).”
§ Climate-driven declines in arthropod abundance restructure a rainforest food web > Results > E. coqui.
plaincorrelational- Asserted: passes — The authors put it forward as true.
- Checkable: passes — It can be checked against evidence.
- Load-bearing: passes — The paper’s conclusions depend on it.
- Based: passes — The paper gives a reason why it holds.
It may state two separate claims as one.
- Rests on an assumption: The historical data from the 1970s and other earlier censuses are comparable to the authors’ later samples despite the time gap and any differences in observers or methods.
A result the paper reports from its own data — it cites no other source for it, so there is none to check. The quote shows it is in the paper.
In the paper
“Between 1993 and 2015, the rate of temperature increase at Bisley Tower was 0.055 °C per year, not significantly different from the rate at El Verde.”
§ Climate-driven declines in arthropod abundance restructure a rainforest food web > Results > Climate Trends in the Luquillo Forest.
plain- Asserted: passes — The authors put it forward as true.
- Checkable: passes — It can be checked against evidence.
- Load-bearing: unclear — It is unclear whether the paper’s conclusions depend on it.
- Based: passes — The paper gives a reason why it holds.
It may state two separate claims as one.
- Rests on an assumption: The meteorological stations at El Verde and Bisley adequately represent the temperature exposure of the arthropod and insectivore populations studied.
A result the paper reports from its own data — it cites no other source for it, so there is none to check. The quote shows it is in the paper.
In the paper
“The density of A. gundlachi, the most common species, had dropped twice, and the density of A. evermanni declined 10 times.”
§ Climate-driven declines in arthropod abundance restructure a rainforest food web > Results > Anoles.
plain- Asserted: passes — The authors put it forward as true.
- Checkable: passes — It can be checked against evidence.
- Load-bearing: passes — The paper’s conclusions depend on it.
- Based: passes — The paper gives a reason why it holds.
It may state two separate claims as one.
- Rests on an assumption: The historical data from the 1970s and other earlier censuses are comparable to the authors’ later samples despite the time gap and any differences in observers or methods.
A result the paper reports from its own data — it cites no other source for it, so there is none to check. The quote shows it is in the paper.
In the paper
“From 1975 to 2015, rainfall at the El Verde station averaged 3,653 mm/y with no significant positive or negative trends.”
§ Climate-driven declines in arthropod abundance restructure a rainforest food web > Results > Climate Trends in the Luquillo Forest.
plain- Asserted: passes — The authors put it forward as true.
- Checkable: passes — It can be checked against evidence.
- Load-bearing: unclear — It is unclear whether the paper’s conclusions depend on it.
- Based: passes — The paper gives a reason why it holds.
It may state two separate claims as one.
- Rests on an assumption: The meteorological stations at El Verde and Bisley adequately represent the temperature exposure of the arthropod and insectivore populations studied.
A result the paper reports from its own data — it cites no other source for it, so there is none to check. The quote shows it is in the paper.
In the paper
“Regressions on time were both negative and significant (SI Appendix, Fig. S3 C and D).”
§ Climate-driven declines in arthropod abundance restructure a rainforest food web > Results > E. coqui.
plaincorrelational- Asserted: passes — The authors put it forward as true.
- Checkable: passes — It can be checked against evidence.
- Load-bearing: passes — The paper’s conclusions depend on it.
- Based: passes — The paper gives a reason why it holds.
It may state two separate claims as one.
- Rests on an assumption: The historical data from the 1970s and other earlier censuses are comparable to the authors’ later samples despite the time gap and any differences in observers or methods.
A result the paper reports from its own data — it cites no other source for it, so there is none to check. The quote shows it is in the paper.
In the paper
“The unanimity indices equaled 100 in five of the six groups, indicating that the causal path Temperature → Abundance is supported by all three of Vinod’s criteria for causality.”
§ Climate-driven declines in arthropod abundance restructure a rainforest food web > Results > Vinod Causality.
hedgeddirect- Asserted: passes — The authors put it forward as true.
- Checkable: passes — It can be checked against evidence.
- Load-bearing: passes — The paper’s conclusions depend on it.
- Based: passes — The paper gives a reason why it holds.
It may state two separate claims as one.
- Rests on an assumption: The statistical associations between temperature and abundance are not confounded by unmeasured variables that could produce the observed relationships.
In the paper
“the proportion of temperatures greater than 29 °C had both negative (El Verde E. coqui) and positive (walking sticks, E. coqui at Sonadura West and Sonadura Old) effects (SI Appendix, Table S5).”
§ Climate-driven declines in arthropod abundance restructure a rainforest food web > Discussion > Multiple Regression and Cross-Correlation.
What the sources say
- Not checked yetcites SI Appendix, Table S5
plaindirect- Asserted: passes — The authors put it forward as true.
- Checkable: passes — It can be checked against evidence.
- Load-bearing: unclear — It is unclear whether the paper’s conclusions depend on it.
- Based: passes — The paper gives a reason why it holds.
It may state two separate claims as one.
In the paper
“the canopy and walking stick censuses spanned three La Niña and three El Niño episodes.”
§ Climate-driven declines in arthropod abundance restructure a rainforest food web > Discussion > Multiple Regression and Cross-Correlation.
What the sources say
- Not checked yetcites SI Appendix, Fig. S9
plain- Asserted: passes — The authors put it forward as true.
- Checkable: passes — It can be checked against evidence.
- Load-bearing: fails — The paper’s conclusions may not depend on it.
- Based: passes — The paper gives a reason why it holds.
Probably not a substantial claim. The paper’s conclusions may not depend on it.
In the paper
“As Janzen (3) pointed out, tropical species that evolved in comparatively aseasonal environments should have narrower thermal niches, reduced acclimation to temperature fluctuations, and exist at or near their thermal optima.”
§ Climate-driven declines in arthropod abundance restructure a rainforest food web > Abstract
What the sources say
- Not checked yetcites [3] Janzen D 1967 Why mountain passes are higher in the tropics Am Nat 101 233 249 source
plaindirect- Asserted: passes — The authors put it forward as true.
- Checkable: passes — It can be checked against evidence.
- Load-bearing: passes — The paper’s conclusions depend on it.
- Based: passes — The paper gives a reason why it holds.
Probably not a substantial claim. It may state two separate claims as one.
In the paper
“Stewart and Woolbright (47), for example, estimated the E. coqui population alone harvested 114,000 prey items per hectare per night in the Luquillo forest, and Reagan and Waide (26) calculated that A. stratulus, A. gundlachi, and A. evermanni collectively consumed ∼443,300 invertebrates per hectare per day at El Verde.”
§ Climate-driven declines in arthropod abundance restructure a rainforest food web > Discussion > Climate Change and Arthropods.
What the sources say
- Not checked yetcites [47] Stewart M Woolbright L 1996 Amphibians The Food Web of a Tropical Rain Forest Reagan DP Waide RB Univ of Chicago Press Chicago 363 398
hedged- Asserted: passes — The authors put it forward as true.
- Checkable: passes — It can be checked against evidence.
- Load-bearing: fails — The paper’s conclusions may not depend on it.
- Based: passes — The paper gives a reason why it holds.
Probably not a substantial claim. The paper’s conclusions may not depend on it.
In the paper
“Deutsch et al. (5) predicted that, for insects living at mid-to-high latitudes, rates of increase should grow as climate warms, while in the tropics insects should decline by as much as 20%.”
§ Climate-driven declines in arthropod abundance restructure a rainforest food web > Abstract
What the sources say
- Not checked yetcites [5] Deutsch CA 2008 Impacts of climate warming on terrestrial ectotherms across latitude Proc Natl Acad Sci USA 105 6668 6672 18458348 PMC2373333 source
plaindirect- Asserted: passes — The authors put it forward as true.
- Checkable: passes — It can be checked against evidence.
- Load-bearing: passes — The paper’s conclusions depend on it.
- Based: passes — The paper gives a reason why it holds.
Probably not a substantial claim.
None of the sources cited for this claim have been checked yet.
In the paper
“This “counter cascade” conflicts with decades of research on trophic dynamics (44), as well as studies documenting the major impact of anoles, frogs, and birds on arthropod abundance (45, 46).”
§ Climate-driven declines in arthropod abundance restructure a rainforest food web > Discussion > Climate Change and Arthropods.
What the sources say
- Not checked yetcites [44] Terborgh J Estes J 2010 Trophic Cascades: Predators, Prey, and the Changing Dynamics of Nature Island Press Washington, DC 2nd Ed
- Not checked yetcites [45] Pacala S Roughgarden J 1984 Control of arthropod abundance by Anolis lizards on St. Eustatius (Neth. Antilles) Oecologia 64 160 162 28312332 source
- Not checked yetcites [46] Marquis R Whelan C 1994 Insectivorous birds increase growth of white oak through consumption of leaf-chewing insects Ecology 75 2007 2014 source
plain- Asserted: passes — The authors put it forward as true.
- Checkable: passes — It can be checked against evidence.
- Load-bearing: passes — The paper’s conclusions depend on it.
- Based: passes — The paper gives a reason why it holds.
It may state two separate claims as one.
A conclusion the paper draws from its own results — it cites no other source for it, so there is none to check. The quote shows it is in the paper.
In the paper
“This indicates that positive SOI values (La Niña episodes) have an immediate positive impact on the abundance of canopy invertebrates, and negative SOI values (El Niño episodes) have an immediate negative impact.”
§ Climate-driven declines in arthropod abundance restructure a rainforest food web > Results > Hierarchical Partitioning, Multiple Regression, and Cross-Correlation Analyses.
hedgeddirect- Asserted: passes — The authors put it forward as true.
- Checkable: passes — It can be checked against evidence.
- Load-bearing: passes — The paper’s conclusions depend on it.
- Based: passes — The paper gives a reason why it holds.
It may state two separate claims as one.
None of the sources cited for this claim have been checked yet.
In the paper
“These predictions have been verified in a variety of tropical reptiles, amphibians, and invertebrates (4–8).”
§ Climate-driven declines in arthropod abundance restructure a rainforest food web > Abstract
What the sources say
- Not checked yetcites [4] Whitfield SM 2007 Amphibian and reptile declines over 35 years at La Selva, Costa Rica Proc Natl Acad Sci USA 104 8352 8356 17449638 PMC1895953 source
- Not checked yetcites [5] Deutsch CA 2008 Impacts of climate warming on terrestrial ectotherms across latitude Proc Natl Acad Sci USA 105 6668 6672 18458348 PMC2373333 source
- Not checked yetcites [6] Huey RB 2009 Why tropical forest lizards are vulnerable to climate warming Proc Biol Sci 276 1939 1948 19324762 PMC2677251 source
- Not checked yetcites [7] Sinervo B 2010 Erosion of lizard diversity by climate change and altered thermal niches Science 328 894 899 20466932 source
- Not checked yetcites [8] Sunday J Bates A Dulvy N 2011 Global analysis of thermal tolerance and latitude in ectotherms Proc Biol Sci 278 1823 1830 21106582 PMC3097822 source
plaindirect- Asserted: passes — The authors put it forward as true.
- Checkable: passes — It can be checked against evidence.
- Load-bearing: fails — The paper’s conclusions may not depend on it.
- Based: passes — The paper gives a reason why it holds.
Probably not a substantial claim. The paper’s conclusions may not depend on it.
In the paper
“Second, the simultaneous declines of all 10 arthropod taxa in our sweep samples, the 10 most-abundant taxa in Schowalter’s (23) canopy samples, and arthropods occupying all strata of our forest study area, all point to an overriding environmental factor that has had ubiquitous, adverse effects on forest arthropods regardless of taxonomic affiliation, stratum occupied, or type of niche exploited.”
§ Climate-driven declines in arthropod abundance restructure a rainforest food web > Discussion > Climate Change and Arthropods.
What the sources say
- Not checked yetcites [23] Schowalter TD 1994 Invertebrate community structure and herbivory in a tropical rain forest canopy in Puerto Rico following Hurricane Hugo Biotropica 26 312 319 source
plaindirect- Asserted: passes — The authors put it forward as true.
- Checkable: passes — It can be checked against evidence.
- Load-bearing: passes — The paper’s conclusions depend on it.
- Based: passes — The paper gives a reason why it holds.
It may state two separate claims as one.
In the paper
“Stewart and Woolbright (47), for example, estimated the E. coqui population alone harvested 114,000 prey items per hectare per night in the Luquillo forest, and Reagan and Waide (26) calculated that A. stratulus, A. gundlachi, and A. evermanni collectively consumed ∼443,300 invertebrates per hectare per day at El Verde.”
§ Climate-driven declines in arthropod abundance restructure a rainforest food web > Discussion > Climate Change and Arthropods.
What the sources say
- Not checked yetcites [26] Reagan D Waide R 1996 The Food Web of a Tropical Rain Forest Univ of Chicago Press Chicago
hedged- Asserted: passes — The authors put it forward as true.
- Checkable: passes — It can be checked against evidence.
- Load-bearing: fails — The paper’s conclusions may not depend on it.
- Based: passes — The paper gives a reason why it holds.
Probably not a substantial claim. The paper’s conclusions may not depend on it.
A conclusion the paper draws from its own results — it cites no other source for it, so there is none to check. The quote shows it is in the paper.
In the paper
“We suggest that climate warming has emerged as such a dominant force affecting arthropod populations in the Luquillo forest and, most likely, in other tropical forests experiencing significant increases in ambient temperature.”
§ Climate-driven declines in arthropod abundance restructure a rainforest food web > Discussion > Climate Change and Arthropods.
hedgeddirect- Asserted: passes — The authors put it forward as true.
- Checkable: passes — It can be checked against evidence.
- Load-bearing: passes — The paper’s conclusions depend on it.
- Based: passes — The paper gives a reason why it holds.
It may state two separate claims as one.
- Rests on an assumption: The statistical associations between temperature and abundance are not confounded by unmeasured variables that could produce the observed relationships.
In the paper
“Their statistical models largely eliminated land-use change as an explanatory variable but did not thoroughly analyze a number of climate-change variables.”
§ Climate-driven declines in arthropod abundance restructure a rainforest food web > Discussion > Climate Change and Arthropods.
What the sources say
- Not checked yetcites [61] Hallmann CA 2017 More than 75 percent decline over 27 years in total flying insect biomass in protected areas PLoS One 12 e0185809 29045418 PMC5646769 source
plain- Asserted: passes — The authors put it forward as true.
- Checkable: passes — It can be checked against evidence.
- Load-bearing: unclear — It is unclear whether the paper’s conclusions depend on it.
- Based: passes — The paper gives a reason why it holds.
It may state two separate claims as one.
In the paper
“Decreases in Puerto Rico’s Eleutherodactylus populations began in the 1970s, with three species classified as threatened by 1985 (64).”
§ Climate-driven declines in arthropod abundance restructure a rainforest food web > Discussion > Eleutherodactylus Declines.
What the sources say
- Not checked yetcites [64] Joglar R Burrowes P 1996 Declining amphibian populations in Puerto Rico. Contributions to West Indian Herpetology: A Tribute to Albert Schwartz, Contributions to Herpetology, eds Powell R, Henderson RW (The Society for the Study of Amphibians and Reptiles, Ithaca, NY), Vol 12, pp 371–380
plain- Asserted: passes — The authors put it forward as true.
- Checkable: passes — It can be checked against evidence.
- Load-bearing: fails — The paper’s conclusions may not depend on it.
- Based: passes — The paper gives a reason why it holds.
Probably not a substantial claim. The paper’s conclusions may not depend on it. It may state two separate claims as one.
None of the sources cited for this claim have been checked yet.
In the paper
“Increases in average temperature had a positive influence on insect biomass, an effect predicted by Tewksbury et al. (62) for temperate insects.”
§ Climate-driven declines in arthropod abundance restructure a rainforest food web > Discussion > Climate Change and Arthropods.
What the sources say
- Not checked yetcites [61] Hallmann CA 2017 More than 75 percent decline over 27 years in total flying insect biomass in protected areas PLoS One 12 e0185809 29045418 PMC5646769 source
- Not checked yetcites [62] Tewksbury JJ Huey RB Deutsch CA 2008 Ecology. Putting the heat on tropical animals Science 320 1296 1297 18535231 source
plaindirect- Asserted: passes — The authors put it forward as true.
- Checkable: passes — It can be checked against evidence.
- Load-bearing: fails — The paper’s conclusions may not depend on it.
- Based: passes — The paper gives a reason why it holds.
Probably not a substantial claim. The paper’s conclusions may not depend on it.
In the paper
“Huey et al. (6) proposed that thermal-conforming lizards inhabiting shaded tropical forests should be especially vulnerable to climate warming.”
§ Climate-driven declines in arthropod abundance restructure a rainforest food web > Discussion > Anolis Population Declines.
What the sources say
- Not checked yetcites [6] Huey RB 2009 Why tropical forest lizards are vulnerable to climate warming Proc Biol Sci 276 1939 1948 19324762 PMC2677251 source
plainconditional- Asserted: passes — The authors put it forward as true.
- Checkable: passes — It can be checked against evidence.
- Load-bearing: passes — The paper’s conclusions depend on it.
- Based: passes — The paper gives a reason why it holds.
Probably not a substantial claim.
In the paper
“At Monteverde, Costa Rica, populations of Anolis tropidolepis and Anolis altae were diminishing by 4.4% and 3.1% per year, respectively, for 11 and 13 y before both species became locally extinct.”
§ Climate-driven declines in arthropod abundance restructure a rainforest food web > Discussion > Anolis Population Declines.
What the sources say
- Not checked yetcites [63] Pounds J Fogden M Campbell J 1999 Biological response to climate change on a tropical mountain Nature 398 611 615 source
plain- Asserted: passes — The authors put it forward as true.
- Checkable: passes — It can be checked against evidence.
- Load-bearing: unclear — It is unclear whether the paper’s conclusions depend on it.
- Based: passes — The paper gives a reason why it holds.
It may state two separate claims as one.
In the paper
“In an encompassing study spanning local extinctions of lizard populations on five continents, Sinervo et al. (7) reached broadly similar conclusions for baskers and thermal-conformers in temperate and tropical habitats.”
§ Climate-driven declines in arthropod abundance restructure a rainforest food web > Discussion > Anolis Population Declines.
What the sources say
- Not checked yetcites [7] Sinervo B 2010 Erosion of lizard diversity by climate change and altered thermal niches Science 328 894 899 20466932 source
plain- Asserted: passes — The authors put it forward as true.
- Checkable: passes — It can be checked against evidence.
- Load-bearing: fails — The paper’s conclusions may not depend on it.
- Based: passes — The paper gives a reason why it holds.
Probably not a substantial claim. The paper’s conclusions may not depend on it.
In the paper
“This vulnerability results from lower critical thermal maxima than basking species, limited acclimation via thermoregulation, and reduced thermal safety margins.”
§ Climate-driven declines in arthropod abundance restructure a rainforest food web > Discussion > Anolis Population Declines.
What the sources say
- Not checked yetcites [6] Huey RB 2009 Why tropical forest lizards are vulnerable to climate warming Proc Biol Sci 276 1939 1948 19324762 PMC2677251 source
plaindirect- Asserted: passes — The authors put it forward as true.
- Checkable: passes — It can be checked against evidence.
- Load-bearing: passes — The paper’s conclusions depend on it.
- Based: passes — The paper gives a reason why it holds.
It may state two separate claims as one.
None of the sources cited for this claim have been checked yet.
In the paper
“Other studies have also documented declines in arthropod abundance across a broad range of geography, habitats, and taxa (10–12, 54, 55, 56–58).”
§ Climate-driven declines in arthropod abundance restructure a rainforest food web > Discussion > Climate Change and Arthropods.
What the sources say
- Not checked yetcites [10] Conrad M Warren B Fox R Parsons M Woiwoda I 2006 Rapid declines of common, widespread British moths provide evidence of an insect biodiversity crisis Biol Conserv 132 279 291 source
- Not checked yetcites [11] Forister ML 2010 Compounded effects of climate change and habitat alteration shift patterns of butterfly diversity Proc Natl Acad Sci USA 107 2088 2092 20133854 PMC2836664 source
- Not checked yetcites [12] Brooks D 2012 Large carabid beetle declines in a United Kingdom monitoring network increases evidence for a widespread loss in insect biodiversity J Appl Ecol 49 1009 1019 source
- Not checked yetcites [54] Kotze DJ O’Hara RB 2003 Species decline—But why? Explanations of carabid beetle (Coleoptera, Carabidae) declines in Europe Oecologia 135 138 148 12647113 source
- Not checked yetcites [55] Thomas JA 2004 Comparative losses of British butterflies, birds, and plants and the global extinction crisis Science 303 1879 1881 15031508 source
plain- Asserted: passes — The authors put it forward as true.
- Checkable: passes — It can be checked against evidence.
- Load-bearing: fails — The paper’s conclusions may not depend on it.
- Based: passes — The paper gives a reason why it holds.
Probably not a substantial claim. The paper’s conclusions may not depend on it.
None of the sources cited for this claim have been checked yet.
In the paper
“The ongoing losses of anuran biodiversity on Puerto Rico and other West Indian islands (66, 67) are part of a global amphibian decline that has continued largely unabated since at least the 1970s (68–72).”
§ Climate-driven declines in arthropod abundance restructure a rainforest food web > Discussion > Eleutherodactylus Declines.
What the sources say
- Not checked yetcites [66] Burrowes P Joglar R Green D 2004 Potential causes for amphibian declines in Puerto Rico Herpetologica 60 141 154 source
- Not checked yetcites [67] Hedges S 1993 Global amphibian declines: A perspective from the Caribbean Biodivers Conserv 2 290 303 source
- Not checked yetcites [68] Pounds JA 1990 Disappearing gold BBC Wildlife 8 812 817
- Not checked yetcites [69] Pounds JA 1991 Amphibian watch: New clues in the case of the disappearing amphibians Wildlife Conservation 94 16 18
- Not checked yetcites [70] Barinaga M 1990 Where have all the froggies gone? Science 247 1033 1034 17800052 source
- Not checked yetcites [71] Crawford AJ Lips KR Bermingham E 2010 Epidemic disease decimates amphibian abundance, species diversity, and evolutionary history in the highlands of central Panama Proc Natl Acad Sci USA 107 13777 13782 20643927 PMC2922291 source
- Not checked yetcites [72] Pounds JA Fogden MPL Savage J Gorman G 1997 Tests of null models for amphibian declines on a tropical mountain Conserv Biol 11 1307 1322 source
plaincorrelational- Asserted: passes — The authors put it forward as true.
- Checkable: passes — It can be checked against evidence.
- Load-bearing: fails — The paper’s conclusions may not depend on it.
- Based: passes — The paper gives a reason why it holds.
Probably not a substantial claim. The paper’s conclusions may not depend on it.
A conclusion the paper draws from its own results — it cites no other source for it, so there is none to check. The quote shows it is in the paper.
In the paper
“while we propose that reduced consumption and declines in abundance result directly from climate-driven declines in food abundance.”
§ Climate-driven declines in arthropod abundance restructure a rainforest food web > Discussion > Anolis Population Declines.
plaindirect- Asserted: passes — The authors put it forward as true.
- Checkable: passes — It can be checked against evidence.
- Load-bearing: passes — The paper’s conclusions depend on it.
- Based: fails — The paper may give no reason why it holds.
Probably not a substantial claim. The paper may give no reason why it holds.
A conclusion the paper draws from its own results — it cites no other source for it, so there is none to check. The quote shows it is in the paper.
In the paper
“As climate warms, lizards should increasingly become nutritionally challenged, resulting in reduced body condition, growth rates, egg production, fat body mass, physical performance, and immune system response.”
§ Climate-driven declines in arthropod abundance restructure a rainforest food web > Discussion > Anolis Population Declines.
hedgeddirect- Asserted: passes — The authors put it forward as true.
- Checkable: passes — It can be checked against evidence.
- Load-bearing: passes — The paper’s conclusions depend on it.
- Based: unclear — It is unclear why the paper says it holds.
It may state two separate claims as one.
None of the sources cited for this claim have been checked yet.
In the paper
“Pounds and coworkers (63, 73, 77–79) have presented a wide-ranging body of evidence indicating that climate warming is a central factor promoting outbreaks of Batrachochytrium and the mass die-offs that follow.”
§ Climate-driven declines in arthropod abundance restructure a rainforest food web > Discussion > Eleutherodactylus Declines.
What the sources say
- Not checked yetcites [63] Pounds J Fogden M Campbell J 1999 Biological response to climate change on a tropical mountain Nature 398 611 615 source
- Not checked yetcites [73] Pounds JA 2006 Widespread amphibian extinctions from epidemic disease driven by global warming Nature 439 161 167 16407945 source
- Not checked yetcites [77] Pounds JA Crump ML 1994 Amphibian declines and climate disturbance: The case of the golden toad and the harlequin frog Conserv Biol 8 72 85 source
- Not checked yetcites [78] Pounds JA Carnaval AC Puschendorf R Haddad CFB Masters KL 2006 Responding to amphibian loss Science 314 1541 1542 17158306 source
- Not checked yetcites [79] Pounds JA 2001 Climate and amphibian declines Nature 410 639 640 11287931 source
hedgeddirect- Asserted: passes — The authors put it forward as true.
- Checkable: passes — It can be checked against evidence.
- Load-bearing: fails — The paper’s conclusions may not depend on it.
- Based: passes — The paper gives a reason why it holds.
Probably not a substantial claim. The paper’s conclusions may not depend on it.
None of the sources cited for this claim have been checked yet.
In the paper
“While B. dendrobatidis has been detected in E. coqui populations at higher elevations in Puerto Rico (66, 75), the fungus is restricted to areas above 600 m (76)”
§ Climate-driven declines in arthropod abundance restructure a rainforest food web > Discussion > Eleutherodactylus Declines.
What the sources say
- Not checked yetcites [66] Burrowes P Joglar R Green D 2004 Potential causes for amphibian declines in Puerto Rico Herpetologica 60 141 154 source
- Not checked yetcites [75] Burrowes P Longo A Joglar R 2008 Geographic distribution of Batrachochytrium dendrobatidis in Puerto Rico Herpetol Rev 39 321 324
- Not checked yetcites [76] Longo AV Burrowes PA Joglar RL 2010 Seasonality of Batrachochytrium dendrobatidis infection in direct-developing frogs suggests a mechanism for persistence Dis Aquat Organ 92 253 260 21268989 source
plain- Asserted: passes — The authors put it forward as true.
- Checkable: passes — It can be checked against evidence.
- Load-bearing: passes — The paper’s conclusions depend on it.
- Based: passes — The paper gives a reason why it holds.
It may state two separate claims as one.
A conclusion the paper draws from its own results — it cites no other source for it, so there is none to check. The quote shows it is in the paper.
In the paper
“Consequently, death rates from starvation, predation, and disease should increase along with concomitant decreases in reproduction.”
§ Climate-driven declines in arthropod abundance restructure a rainforest food web > Discussion > Anolis Population Declines.
hedgeddirect- Asserted: passes — The authors put it forward as true.
- Checkable: passes — It can be checked against evidence.
- Load-bearing: passes — The paper’s conclusions depend on it.
- Based: passes — The paper gives a reason why it holds.
It may state two separate claims as one.
None of the sources cited for this claim have been checked yet.
In the paper
“Most research has focused on the fungus Batrachochytrium dendrobatidis, which has precipitated mass-mortality events and catastrophic reductions in over 200 frog species world-wide (63, 73, 74).”
§ Climate-driven declines in arthropod abundance restructure a rainforest food web > Discussion > Eleutherodactylus Declines.
What the sources say
- Not checked yetcites [63] Pounds J Fogden M Campbell J 1999 Biological response to climate change on a tropical mountain Nature 398 611 615 source
- Not checked yetcites [73] Pounds JA 2006 Widespread amphibian extinctions from epidemic disease driven by global warming Nature 439 161 167 16407945 source
- Not checked yetcites [74] Catenazzi A 2015 State of the world’s amphibians Annu Rev Environ Resour 40 91 119 source
plaindirect- Asserted: passes — The authors put it forward as true.
- Checkable: passes — It can be checked against evidence.
- Load-bearing: fails — The paper’s conclusions may not depend on it.
- Based: passes — The paper gives a reason why it holds.
Probably not a substantial claim. The paper’s conclusions may not depend on it.
A conclusion the paper draws from its own results — it cites no other source for it, so there is none to check. The quote shows it is in the paper.
In the paper
“If climate warming is not driving arthropod declines, then whatever the factors may be, they must completely override the reduction in mortality from lowered predation levels.”
§ Climate-driven declines in arthropod abundance restructure a rainforest food web > Discussion > Climate Change and Arthropods.
plainconditional- Asserted: passes — The authors put it forward as true.
- Checkable: passes — It can be checked against evidence.
- Load-bearing: passes — The paper’s conclusions depend on it.
- Based: passes — The paper gives a reason why it holds.
It may state two separate claims as one.
In the paper
“Overall, they found a 75% decline in biomass between 1989 and 2016.”
§ Climate-driven declines in arthropod abundance restructure a rainforest food web > Discussion > Climate Change and Arthropods.
What the sources say
- Not checked yetcites [61] Hallmann CA 2017 More than 75 percent decline over 27 years in total flying insect biomass in protected areas PLoS One 12 e0185809 29045418 PMC5646769 source
plain- Asserted: passes — The authors put it forward as true.
- Checkable: passes — It can be checked against evidence.
- Load-bearing: fails — The paper’s conclusions may not depend on it.
- Based: passes — The paper gives a reason why it holds.
Probably not a substantial claim. The paper’s conclusions may not depend on it.
The paper states this without a source or data behind it here, so there is nothing to check it against. The quote shows it is in the paper.
In the paper
“To our knowledge, no studies have explored reductions in arthropod prey as a possible causal mechanism.”
§ Climate-driven declines in arthropod abundance restructure a rainforest food web > Discussion > Eleutherodactylus Declines.
hedged- Asserted: passes — The authors put it forward as true.
- Checkable: passes — It can be checked against evidence.
- Load-bearing: passes — The paper’s conclusions depend on it.
- Based: fails — The paper may give no reason why it holds.
Probably not a substantial claim. The paper may give no reason why it holds.
In the paper
“Currently, 3 of the original 16 species of Puerto Rican Eleutherodactylus are considered extinct, and 13 species are listed as critically endangered, endangered, vulnerable, or near threatened (65).”
§ Climate-driven declines in arthropod abundance restructure a rainforest food web > Discussion > Eleutherodactylus Declines.
What the sources say
- Not checked yetcites [65] IUCN 2017 IUCN Red List of Threatened Species. Available at www.iucnredlist.org. Accessed May 25, 2017
plain- Asserted: passes — The authors put it forward as true.
- Checkable: passes — It can be checked against evidence.
- Load-bearing: fails — The paper’s conclusions may not depend on it.
- Based: passes — The paper gives a reason why it holds.
Probably not a substantial claim. The paper’s conclusions may not depend on it. It may state two separate claims as one.
In the paper
“Between 1923 and 1998 in Singapore, insectivores experienced the highest level of extinctions of any foraging guild (101)”
§ Climate-driven declines in arthropod abundance restructure a rainforest food web > Discussion > Avian Declines.
What the sources say
- Not checked yetcites [101] Castelletta M Sodhi NS Subaraj R 2000 Heavy extinctions of forest avifauna in Singapore: Lessons for biodiversity conservation in Southeast Asia Conserv Biol 14 1870 1880 35701951 source
plainSingle case- Asserted: passes — The authors put it forward as true.
- Checkable: passes — It can be checked against evidence.
- Load-bearing: fails — The paper’s conclusions may not depend on it.
- Based: passes — The paper gives a reason why it holds.
Probably not a substantial claim. The paper’s conclusions may not depend on it.
In the paper
“Over a 20-y period, 54% of bird species native to Britain have also decreased (55).”
§ Climate-driven declines in arthropod abundance restructure a rainforest food web > Discussion > Avian Declines.
What the sources say
- Not checked yetcites [55] Thomas JA 2004 Comparative losses of British butterflies, birds, and plants and the global extinction crisis Science 303 1879 1881 15031508 source
plain- Asserted: passes — The authors put it forward as true.
- Checkable: passes — It can be checked against evidence.
- Load-bearing: fails — The paper’s conclusions may not depend on it.
- Based: passes — The paper gives a reason why it holds.
Probably not a substantial claim. The paper’s conclusions may not depend on it.
In the paper
“We also note that in many studies of passerine declines, such as Mac Nally et al. (98), insectivores are often the group exhibiting the largest decreases in abundance, as appears to be the case in the Luquillo forest.”
§ Climate-driven declines in arthropod abundance restructure a rainforest food web > Discussion > Avian Declines.
What the sources say
- Not checked yetcites [98] Mac Nally R 2009 Collapse of an avifauna: Climate change appears to exacerbate habitat loss and degradation Divers Distrib 15 720 730 source
hedgedcorrelational- Asserted: passes — The authors put it forward as true.
- Checkable: passes — It can be checked against evidence.
- Load-bearing: fails — The paper’s conclusions may not depend on it.
- Based: passes — The paper gives a reason why it holds.
Probably not a substantial claim. The paper’s conclusions may not depend on it. It may state two separate claims as one.
In the paper
“Galapagos finches provide a classic example of how climatic events associated with El Niño can lead to major fluctuations in food supplies, which in turn drive reductions in abundance of up to 40% per year in Geospiza populations (108).”
§ Climate-driven declines in arthropod abundance restructure a rainforest food web > Discussion > Avian Declines.
What the sources say
- Not checked yetcites [108] Grant B Grant P 1993 Evolution of Darwin’s finches caused by a rare climatic event Proc R Soc Lond 251 111 117 source
plaindirect- Asserted: passes — The authors put it forward as true.
- Checkable: passes — It can be checked against evidence.
- Load-bearing: fails — The paper’s conclusions may not depend on it.
- Based: passes — The paper gives a reason why it holds.
Probably not a substantial claim. The paper’s conclusions may not depend on it. It may state two separate claims as one.
None of the sources cited for this claim have been checked yet.
In the paper
“We found only two articles that ascribed the collapse of avian populations to the impact of climate warming on prey abundance.”
§ Climate-driven declines in arthropod abundance restructure a rainforest food web > Discussion > Avian Declines.
plain- Asserted: passes — The authors put it forward as true.
- Checkable: passes — It can be checked against evidence.
- Load-bearing: fails — The paper’s conclusions may not depend on it.
- Based: passes — The paper gives a reason why it holds.
Probably not a substantial claim. The paper’s conclusions may not depend on it.
In the paper
“in the Guanica dry forest in southwestern Puerto Rico mist-net data indicate that dry season bird populations dropped by two-thirds over two decades (86).”
§ Climate-driven declines in arthropod abundance restructure a rainforest food web > Discussion > Avian Declines.
What the sources say
- Not checked yetcites [86] Faaborg J 2013 Long-term decline of a winter-resident bird community in Puerto Rico Biodivers Conserv 22 63 75 source
hedged- Asserted: passes — The authors put it forward as true.
- Checkable: passes — It can be checked against evidence.
- Load-bearing: fails — The paper’s conclusions may not depend on it.
- Based: passes — The paper gives a reason why it holds.
Probably not a substantial claim. The paper’s conclusions may not depend on it.
In the paper
“From data gathered over 55 y and 16 locations in Puerto Rico, the National Weather Service found that temperatures during La Niña events averaged ∼2.0 °C lower during the dry season (December to August), and 1.5 °C lower during the wet season (May to November) compared with El Niño episodes.”
§ Climate-driven declines in arthropod abundance restructure a rainforest food web > Discussion > Multiple Regression and Cross-Correlation.
What the sources say
- Not checked yetcites National Weather Service
plaincorrelational- Asserted: passes — The authors put it forward as true.
- Checkable: passes — It can be checked against evidence.
- Load-bearing: passes — The paper’s conclusions depend on it.
- Based: passes — The paper gives a reason why it holds.
It may state two separate claims as one.
None of the sources cited for this claim have been checked yet.
In the paper
“The relationship between chytrid outbreaks and climate is complex, but in general epidemics are often associated with repeated warm years and drier weather.”
§ Climate-driven declines in arthropod abundance restructure a rainforest food web > Discussion > Eleutherodactylus Declines.
plaincorrelational- Asserted: passes — The authors put it forward as true.
- Checkable: passes — It can be checked against evidence.
- Load-bearing: fails — The paper’s conclusions may not depend on it.
- Based: passes — The paper gives a reason why it holds.
Probably not a substantial claim. The paper’s conclusions may not depend on it.
In the paper
“In montane habitats upward migrations into cooler refugia can spell the difference between survival and extinction as temperatures rise at lower elevations (119).”
§ Climate-driven declines in arthropod abundance restructure a rainforest food web > Discussion > Multiple Regression and Cross-Correlation.
What the sources say
- Not checked yetcites [119] Colwell RK Brehm G Cardelús CL Gilman AC Longino JT 2008 Global warming, elevational range shifts, and lowland biotic attrition in the wet tropics Science 322 258 261 18845754 source
plaindirect- Asserted: passes — The authors put it forward as true.
- Checkable: passes — It can be checked against evidence.
- Load-bearing: fails — The paper’s conclusions may not depend on it.
- Based: passes — The paper gives a reason why it holds.
Probably not a substantial claim. The paper’s conclusions may not depend on it.
In the paper
“Based on our literature searches, no studies have explored reductions in arthropod prey as a possible causal mechanism behind amphibian declines, nor the possibility that malnutrition could interact with rising temperature and drought, compounding the impacts of disease through depression of immunocompetence (83).”
§ Climate-driven declines in arthropod abundance restructure a rainforest food web > Discussion > Eleutherodactylus Declines.
What the sources say
- Not checked yetcites [83] Blaustein AR 2012 Ecophysiology meets conservation: Understanding the role of disease in amphibian population declines Philos Trans R Soc Lond B Biol Sci 367 1688 1707 22566676 PMC3350657 source
hedged- Asserted: passes — The authors put it forward as true.
- Checkable: passes — It can be checked against evidence.
- Load-bearing: passes — The paper’s conclusions depend on it.
- Based: passes — The paper gives a reason why it holds.
Probably not a substantial claim. It may state two separate claims as one.
None of the sources cited for this claim have been checked yet.
In the paper
“However, altitudinal shifts can also cause rapid changes in community structure, disrupting coevolved interactions, creating “no-analogue communities,” and contributing to community disassembly via accelerated extinctions (120, 121).”
§ Climate-driven declines in arthropod abundance restructure a rainforest food web > Discussion > Multiple Regression and Cross-Correlation.
What the sources say
- Not checked yetcites [120] Sheldon KS Yang S Tewksbury JJ 2011 Climate change and community disassembly: Impacts of warming on tropical and temperate montane community structure Ecol Lett 14 1191 1200 21978234 source
- Not checked yetcites [121] Urban MC Tewksbury JJ Sheldon KS 2012 On a collision course: Competition and dispersal differences create no-analogue communities and cause extinctions during climate change Proc Biol Sci 279 2072 2080 22217718 PMC3311897 source
plaindirect- Asserted: passes — The authors put it forward as true.
- Checkable: passes — It can be checked against evidence.
- Load-bearing: fails — The paper’s conclusions may not depend on it.
- Based: passes — The paper gives a reason why it holds.
Probably not a substantial claim. The paper’s conclusions may not depend on it. It may state two separate claims as one.
None of the sources cited for this claim have been checked yet.
In the paper
“In Canada and the northeastern United States, the total reduction in aerial insectivores between 1970 and 2010 was greater than 60%, the largest decline of all passerines analyzed (84, 99).”
§ Climate-driven declines in arthropod abundance restructure a rainforest food web > Discussion > Avian Declines.
What the sources say
- Not checked yetcites [84] Berlanga H 2010 Saving Our Shared Birds: Partners in Flight Tri-National Vision for Landbird Conservation Cornell Lab of Ornithology Ithaca, NY
- Not checked yetcites [99] North American Bird Conservation Initiative Canada 2012 The State of Canada’s Birds, 2012. Available at stateofcanadasbirds.org/. Accessed October 1, 2016
plain- Asserted: passes — The authors put it forward as true.
- Checkable: passes — It can be checked against evidence.
- Load-bearing: fails — The paper’s conclusions may not depend on it.
- Based: passes — The paper gives a reason why it holds.
Probably not a substantial claim. The paper’s conclusions may not depend on it. It may state two separate claims as one.
A conclusion the paper draws from its own results — it cites no other source for it, so there is none to check. The quote shows it is in the paper.
In the paper
“If these predictions are realized, the impact on food webs and ecosystems will be even more rapid than expected from the steady, linear increases in mean temperatures that are currently ravaging the natural world.”
§ Climate-driven declines in arthropod abundance restructure a rainforest food web > Discussion > Multiple Regression and Cross-Correlation.
hedgedconditional- Asserted: passes — The authors put it forward as true.
- Checkable: passes — It can be checked against evidence.
- Load-bearing: fails — The paper’s conclusions may not depend on it.
- Based: passes — The paper gives a reason why it holds.
Probably not a substantial claim. The paper’s conclusions may not depend on it.
None of the sources cited for this claim have been checked yet.
In the paper
“Bird populations in many tropical and temperate ecosystems have been declining in parallel with those in Puerto Rico.”
§ Climate-driven declines in arthropod abundance restructure a rainforest food web > Discussion > Avian Declines.
plaincorrelational- Asserted: passes — The authors put it forward as true.
- Checkable: passes — It can be checked against evidence.
- Load-bearing: fails — The paper’s conclusions may not depend on it.
- Based: passes — The paper gives a reason why it holds.
Probably not a substantial claim. The paper’s conclusions may not depend on it.
In the paper
“ENSO also impacts rainfall across Puerto Rico, increasing dry season precipitation by 13% during El Niño years and causing a 14% increase in wet season precipitation during La Niña years.”
§ Climate-driven declines in arthropod abundance restructure a rainforest food web > Discussion > Multiple Regression and Cross-Correlation.
What the sources say
- Not checked yetcites National Weather Service
plaindirect- Asserted: passes — The authors put it forward as true.
- Checkable: passes — It can be checked against evidence.
- Load-bearing: passes — The paper’s conclusions depend on it.
- Based: passes — The paper gives a reason why it holds.
It may state two separate claims as one.
A conclusion the paper draws from its own results — it cites no other source for it, so there is none to check. The quote shows it is in the paper.
In the paper
“While we have focused on population collapse driven by climate change, shifts in altitudinal distributions of arthropods, insectivores, producers, and top predators may also play an important role in the observed declines in abundance.”
§ Climate-driven declines in arthropod abundance restructure a rainforest food web > Discussion > Multiple Regression and Cross-Correlation.
hedgedconditional- Asserted: passes — The authors put it forward as true.
- Checkable: passes — It can be checked against evidence.
- Load-bearing: fails — The paper’s conclusions may not depend on it.
- Based: passes — The paper gives a reason why it holds.
Probably not a substantial claim. The paper’s conclusions may not depend on it.
In the paper
“Diffenbaugh et al. (115) predicted a two- to threefold increase in the probability of historically unprecedented maximum daily temperatures between 2018 and 2036, and a three- to fivefold increase between 2036 and 2055.”
§ Climate-driven declines in arthropod abundance restructure a rainforest food web > Discussion > Multiple Regression and Cross-Correlation.
What the sources say
- Not checked yetcites [115] Diffenbaugh NS Singh D Mankin JS 2018 Unprecedented climate events: Historical changes, aspirational targets, and national commitments Sci Adv 4 eaao3354 29457133 PMC5812734 source
plaindirect- Asserted: passes — The authors put it forward as true.
- Checkable: passes — It can be checked against evidence.
- Load-bearing: fails — The paper’s conclusions may not depend on it.
- Based: passes — The paper gives a reason why it holds.
Probably not a substantial claim. The paper’s conclusions may not depend on it. It may state two separate claims as one.
None of the sources cited for this claim have been checked yet.
In the paper
“Anomalous rises in seawater temperature associated with ENSO have also caused severe reductions in food supplies, leading to starvation and mass mortality of marine birds (109–111).”
§ Climate-driven declines in arthropod abundance restructure a rainforest food web > Discussion > Avian Declines.
What the sources say
- Not checked yetcites [109] Piatt J Van Pelt T 1997 Mass-mortality of Guillemots (Uria aalge) in the Gulf of Alaska in 1993 Mar Pollut Bull 34 656 662 source
- Not checked yetcites [110] Ayala L Paz-Soldan L Garate P 2013 A mass mortality event of sooty shearwaters (Puffinus griseus) on the central coast of Peru Notornis 60 258 261 source
- Not checked yetcites [111] Fuentes H Antonietti E 1989 Efectos del Fenómeno El Niño en las aves marinas del litoral peruano Boletín Estudio Regional del Fenómeno El Niño 29 19 26
plaindirect- Asserted: passes — The authors put it forward as true.
- Checkable: passes — It can be checked against evidence.
- Load-bearing: fails — The paper’s conclusions may not depend on it.
- Based: passes — The paper gives a reason why it holds.
Probably not a substantial claim. The paper’s conclusions may not depend on it. It may state two separate claims as one.
None of the sources cited for this claim have been checked yet.
In the paper
“More recently, ocean warming associated with climate change has precipitated bottom-up trophic cascades, analogous to those proposed here for terrestrial systems, which have restructured both benthic and pelagic food webs and driven declines in shearwaters and auklets (112–114).”
§ Climate-driven declines in arthropod abundance restructure a rainforest food web > Discussion > Avian Declines.
What the sources say
- Not checked yetcites [112] Veit R McGowan J Ainley D Wahland T Pyle P 1997 Apex marine predator declines ninety percent in association with changing oceanic climate Glob Change Biol 3 23 28 source
- Not checked yetcites [113] Baduini C 2001 Mass mortality of short-tailed shearwaters in the south-eastern Bering Sea during summer 1997 Fish Oceanogr 10 117 130 source
- Not checked yetcites [114] Springer A Byrd G Iverson S 2007 Hot oceanography: Planktivorous seabirds reveal ecosystem responses to warming of the Bering Sea Mar Ecol Prog Ser 352 289 297 source
plaindirect- Asserted: passes — The authors put it forward as true.
- Checkable: passes — It can be checked against evidence.
- Load-bearing: fails — The paper’s conclusions may not depend on it.
- Based: passes — The paper gives a reason why it holds.
Probably not a substantial claim. The paper’s conclusions may not depend on it. It may state two separate claims as one.
In the paper
“In Canada, 44% of 460 bird species have had negative trends since 1970, and 42 species common to the United States, Canada, and Mexico have lost 50% or more of their populations in 40 y (84).”
§ Climate-driven declines in arthropod abundance restructure a rainforest food web > Discussion > Avian Declines.
What the sources say
- Not checked yetcites [84] Berlanga H 2010 Saving Our Shared Birds: Partners in Flight Tri-National Vision for Landbird Conservation Cornell Lab of Ornithology Ithaca, NY
plain- Asserted: passes — The authors put it forward as true.
- Checkable: passes — It can be checked against evidence.
- Load-bearing: fails — The paper’s conclusions may not depend on it.
- Based: passes — The paper gives a reason why it holds.
Probably not a substantial claim. The paper’s conclusions may not depend on it. It may state two separate claims as one.
In the paper
“They attributed the ongoing declines to the impact of increasing temperatures and decreasing rainfall on arthropods and other food resources.”
§ Climate-driven declines in arthropod abundance restructure a rainforest food web > Discussion > Avian Declines.
What the sources say
- Not checked yetcites [98] Mac Nally R 2009 Collapse of an avifauna: Climate change appears to exacerbate habitat loss and degradation Divers Distrib 15 720 730 source
plaindirect- Asserted: passes — The authors put it forward as true.
- Checkable: passes — It can be checked against evidence.
- Load-bearing: passes — The paper’s conclusions depend on it.
- Based: passes — The paper gives a reason why it holds.
Probably not a substantial claim.
In the paper
“Pearce-Higgins et al. (97) also analyzed the diets of 17 upland, insectivorous bird species in the United Kingdom, calculated a climate-sensitivity index for their prey, and showed that the index was correlated with recent negative population trends.”
§ Climate-driven declines in arthropod abundance restructure a rainforest food web > Discussion > Avian Declines.
What the sources say
- Not checked yetcites [97] Pearce-Higgins J Dennis P Whittingham M Yalden D 2010 Impacts of climate on prey abundance account for fluctuations in a population of a northern wader at the southern edge of its range Glob Change Biol 16 12 23 source
plaincorrelational- Asserted: passes — The authors put it forward as true.
- Checkable: passes — It can be checked against evidence.
- Load-bearing: unclear — It is unclear whether the paper’s conclusions depend on it.
- Based: passes — The paper gives a reason why it holds.
It may state two separate claims as one.
In the paper
“In a lowland tropical rainforest at La Selva, Costa Rica, Sigel et al. (85) also found that at least 50% of declining bird species were insectivorous.”
§ Climate-driven declines in arthropod abundance restructure a rainforest food web > Discussion > Avian Declines.
What the sources say
- Not checked yetcites [85] Sigel BJ Sherry TW Young BE 2006 Avian community response to lowland tropical rainforest isolation: 40 years of change at La Selva Biological Station, Costa Rica Conserv Biol 20 111 121 16909664 source
plain- Asserted: passes — The authors put it forward as true.
- Checkable: passes — It can be checked against evidence.
- Load-bearing: fails — The paper’s conclusions may not depend on it.
- Based: passes — The paper gives a reason why it holds.
Probably not a substantial claim. The paper’s conclusions may not depend on it.
In the paper
“Stapley et al. (20) reached a similar conclusion concerning the effects of ENSO on Anolis populations in Panama.”
§ Climate-driven declines in arthropod abundance restructure a rainforest food web > Discussion > Multiple Regression and Cross-Correlation.
What the sources say
- Not checked yetcites [20] Stapley J Garcia M Andrews RM 2015 Long-term data reveal a population decline of the tropical lizard Anolis apletophallus, and a negative affect of El Niño years on population growth rate PLoS One 10 e0115450 25671423 PMC4325001 source
plaindirect- Asserted: passes — The authors put it forward as true.
- Checkable: passes — It can be checked against evidence.
- Load-bearing: fails — The paper’s conclusions may not depend on it.
- Based: passes — The paper gives a reason why it holds.
Probably not a substantial claim. The paper’s conclusions may not depend on it.
In the paper
“Given ongoing climate change, the elevational range of Batrachochytrium will almost certainly change, as well as its impact on Puerto Rican frogs, especially juveniles (80).”
§ Climate-driven declines in arthropod abundance restructure a rainforest food web > Discussion > Eleutherodactylus Declines.
What the sources say
- Not checked yetcites [80] Langhammer PF Burrowes PA Lips KR Bryant SB Collins JP 2014 Susceptibility to the amphibian chytrid fungus varies with ontogeny in the direct-developing frog Eleutherodactylus coqui J Wildl Dis 50 438 446 24807186 source
boostedconditional- Asserted: passes — The authors put it forward as true.
- Checkable: passes — It can be checked against evidence.
- Load-bearing: fails — The paper’s conclusions may not depend on it.
- Based: passes — The paper gives a reason why it holds.
Probably not a substantial claim. The paper’s conclusions may not depend on it. It may state two separate claims as one.
None of the sources cited for this claim have been checked yet.
In the paper
“The reductions in habitat area as species move up mountains also increase extinction rates (87), and can erode genetic diversity, further reducing fitness and response to ongoing changes in climate (122, 123).”
§ Climate-driven declines in arthropod abundance restructure a rainforest food web > Discussion > Multiple Regression and Cross-Correlation.
What the sources say
- Not checked yetcites [87] Sekercioglu C Primack R Wormworth J 2012 The effects of climate change on tropical birds Biol Conserv 148 1 18 source
- Not checked yetcites [122] Arenas M Ray N Currat M Excoffier L 2012 Consequences of range contractions and range shifts on molecular diversity Mol Biol Evol 29 207 218 21778191 source
- Not checked yetcites [123] Rubidge EM 2012 Climate-induced range contraction drives genetic erosion in an alpine mammal Nat Clim Chang 2 285 288 source
plaindirect- Asserted: passes — The authors put it forward as true.
- Checkable: passes — It can be checked against evidence.
- Load-bearing: fails — The paper’s conclusions may not depend on it.
- Based: passes — The paper gives a reason why it holds.
Probably not a substantial claim. The paper’s conclusions may not depend on it. It may state two separate claims as one.
In the paper
“Pearce-Higgins et al. (97) analyzed the demographics of the golden plover in Europe and showed that trends in population dynamics were closely associated with temperature-based reductions in prey abundance.”
§ Climate-driven declines in arthropod abundance restructure a rainforest food web > Discussion > Avian Declines.
What the sources say
- Not checked yetcites [97] Pearce-Higgins J Dennis P Whittingham M Yalden D 2010 Impacts of climate on prey abundance account for fluctuations in a population of a northern wader at the southern edge of its range Glob Change Biol 16 12 23 source
plaincorrelational- Asserted: passes — The authors put it forward as true.
- Checkable: passes — It can be checked against evidence.
- Load-bearing: fails — The paper’s conclusions may not depend on it.
- Based: passes — The paper gives a reason why it holds.
Probably not a substantial claim. The paper’s conclusions may not depend on it.
In the paper
“In the rainforest at La Selva, Costa Rica, 10–20% of resident birds declined between 1960 and 1999 (85)”
§ Climate-driven declines in arthropod abundance restructure a rainforest food web > Discussion > Avian Declines.
What the sources say
- Not checked yetcites [85] Sigel BJ Sherry TW Young BE 2006 Avian community response to lowland tropical rainforest isolation: 40 years of change at La Selva Biological Station, Costa Rica Conserv Biol 20 111 121 16909664 source
plain- Asserted: passes — The authors put it forward as true.
- Checkable: passes — It can be checked against evidence.
- Load-bearing: fails — The paper’s conclusions may not depend on it.
- Based: passes — The paper gives a reason why it holds.
Probably not a substantial claim. The paper’s conclusions may not depend on it.
None of the sources cited for this claim have been checked yet.
In the paper
“Numerous studies have documented the impact of the ENSO on all of the major taxa considered here, including invertebrates (116), frogs (63, 73, 77, 117), lizards (1, 5), and birds (118).”
§ Climate-driven declines in arthropod abundance restructure a rainforest food web > Discussion > Multiple Regression and Cross-Correlation.
What the sources say
- Not checked yetcites [116] Gutiérrez-Fonseca PE Ramírez A Pringle CM 2018 Large-scale climatic phenomena drive fluctuations in macroinvertebrate assemblages in lowland tropical streams, Costa Rica: The importance of ENSO events in determining long-term (15y) patterns PLoS One 13 e0191781 29420548 PMC5805265 source
- Not checked yetcites [63] Pounds J Fogden M Campbell J 1999 Biological response to climate change on a tropical mountain Nature 398 611 615 source
- Not checked yetcites [73] Pounds JA 2006 Widespread amphibian extinctions from epidemic disease driven by global warming Nature 439 161 167 16407945 source
boosteddirect- Asserted: passes — The authors put it forward as true.
- Checkable: passes — It can be checked against evidence.
- Load-bearing: fails — The paper’s conclusions may not depend on it.
- Based: passes — The paper gives a reason why it holds.
Probably not a substantial claim. The paper’s conclusions may not depend on it.
In the paper
“Nebel et al. (100) concluded that these declines resulted from impoverishment of flying insect populations, and suggested acid rain as a possible mechanism.”
§ Climate-driven declines in arthropod abundance restructure a rainforest food web > Discussion > Avian Declines.
What the sources say
- Not checked yetcites [100] Nebel S Mills A McCracken J Taylor P 2010 Declines of aerial insectivores in North America follow a geographic gradient Avian Conserv Ecol 5 1
hedgeddirect- Asserted: passes — The authors put it forward as true.
- Checkable: passes — It can be checked against evidence.
- Load-bearing: fails — The paper’s conclusions may not depend on it.
- Based: passes — The paper gives a reason why it holds.
Probably not a substantial claim. The paper’s conclusions may not depend on it. It may state two separate claims as one.
In the paper
“An alternative to the climate-warming hypothesis for population declines in Luquillo and other tropical montane habitats is a mechanism proposed by Lawton et al. (126).”
§ Climate-driven declines in arthropod abundance restructure a rainforest food web > Discussion > Multiple Regression and Cross-Correlation.
What the sources say
- Not checked yetcites [126] Lawton RO Nair US Pielke RA Sr Welch RM 2001 Climatic impact of tropical lowland deforestation on nearby montane cloud forests Science 294 584 587 11641496 source
plain- Asserted: passes — The authors put it forward as true.
- Checkable: passes — It can be checked against evidence.
- Load-bearing: fails — The paper’s conclusions may not depend on it.
- Based: passes — The paper gives a reason why it holds.
Probably not a substantial claim. The paper’s conclusions may not depend on it.
A conclusion the paper draws from its own results — it cites no other source for it, so there is none to check. The quote shows it is in the paper.
In the paper
“Our analyses provide strong support for the hypothesis that climate warming has been a major factor driving reductions in arthropod abundance, and that these declines have in turn precipitated decreases in forest insectivores in a classic bottom-up cascade.”
§ Climate-driven declines in arthropod abundance restructure a rainforest food web > Conclusion
boosteddirect- Asserted: passes — The authors put it forward as true.
- Checkable: passes — It can be checked against evidence.
- Load-bearing: passes — The paper’s conclusions depend on it.
- Based: passes — The paper gives a reason why it holds.
It may state two separate claims as one.
In the paper
“Because all dispersion tests rejected the null hypothesis, only quasi-Poisson regressions were used.”
§ Climate-driven declines in arthropod abundance restructure a rainforest food web > Materials and Methods > Statistical Analyses.
What the sources say
- Not checked yetcites [148] Kleiber C Zeileis A 2008 Applied Econometrics with R (Springer, New York), Available at https://cran.r-project.org/web/packages/AER/index.html. Accessed June 1, 2016 source
plaindirect- Asserted: passes — The authors put it forward as true.
- Checkable: passes — It can be checked against evidence.
- Load-bearing: fails — The paper’s conclusions may not depend on it.
- Based: passes — The paper gives a reason why it holds.
Probably not a substantial claim. The paper’s conclusions may not depend on it. It may state two separate claims as one.
None of the sources cited for this claim have been checked yet.
In the paper
“Climate variables are often highly correlated and can generate spurious results when used in regression (34, 134).”
§ Climate-driven declines in arthropod abundance restructure a rainforest food web > Materials and Methods > Statistical Analyses.
What the sources say
- Not checked yetcites [34] Mac Nally R 2002 Multiple regression and inference in ecology and conservation biology: Further comments on identifying important predictor variables Biodivers Conserv 11 1397 1401 source
- Not checked yetcites [134] Knape J de Valpine P 2011 Effects of weather and climate on the dynamics of animal population time series Proc Biol Sci 278 985 992 20880886 PMC3049023 source
plaincorrelational- Asserted: passes — The authors put it forward as true.
- Checkable: passes — It can be checked against evidence.
- Load-bearing: passes — The paper’s conclusions depend on it.
- Based: passes — The paper gives a reason why it holds.
Probably not a substantial claim.
What the paper did — it cites no source for this, so there is none to check. The quote shows it is in the paper.
In the paper
“We did not utilize automated regression techniques, such as stepwise selection and backward elimination, due to a variety of issues including erroneous type I error rates and inflated R2 measures (33).”
§ Climate-driven declines in arthropod abundance restructure a rainforest food web > Materials and Methods > Statistical Analyses.
plain- Asserted: passes — The authors put it forward as true.
- Checkable: passes — It can be checked against evidence.
- Load-bearing: fails — The paper’s conclusions may not depend on it.
- Based: passes — The paper gives a reason why it holds.
Probably not a substantial claim. The paper’s conclusions may not depend on it.
None of the sources cited for this claim have been checked yet.
In the paper
“This hypothesis also provides a parsimonious explanation for why similar cross-taxa, concordant decreases in reptiles, anurans, and birds have occurred in Costa Rican rainforests (3, 63), and are likely occurring across a broad range of tropical ecosystems.”
§ Climate-driven declines in arthropod abundance restructure a rainforest food web > Conclusion
What the sources say
hedgeddirect- Asserted: passes — The authors put it forward as true.
- Checkable: passes — It can be checked against evidence.
- Load-bearing: unclear — It is unclear whether the paper’s conclusions depend on it.
- Based: passes — The paper gives a reason why it holds.
It may state two separate claims as one.
What the paper did — it cites no source for this, so there is none to check. The quote shows it is in the paper.
In the paper
“All multivariate quasi-Poisson regressions were then checked for multicollinearity using the Variance Inflation Factor and Bartlett’s Test of Sphericity.”
§ Climate-driven declines in arthropod abundance restructure a rainforest food web > Materials and Methods > Statistical Analyses.
plain- Asserted: passes — The authors put it forward as true.
- Checkable: passes — It can be checked against evidence.
- Load-bearing: passes — The paper’s conclusions depend on it.
- Based: passes — The paper gives a reason why it holds.
Probably not a substantial claim.
In the paper
“Given that the ruddy quail dove (G. montana) is an exclusive granivore (SI Appendix, Fig. S4) and could confound patterns in insectivore abundance, we excluded this species from counts of captured birds.”
§ Climate-driven declines in arthropod abundance restructure a rainforest food web > Materials and Methods > Luquillo Long-Term Ecological Research Data.
What the sources say
- Not checked yetcites SI Appendix, Fig. S4
hedged- Asserted: passes — The authors put it forward as true.
- Checkable: passes — It can be checked against evidence.
- Load-bearing: passes — The paper’s conclusions depend on it.
- Based: passes — The paper gives a reason why it holds.
Probably not a substantial claim. It may state two separate claims as one.
What the paper did — it cites no source for this, so there is none to check. The quote shows it is in the paper.
In the paper
“Because Akaike’s Information Criterion cannot be calculated for quasi-Poisson models, we selected models having the smallest deviance residuals and the lowest χ2 test statistic P values.”
§ Climate-driven declines in arthropod abundance restructure a rainforest food web > Materials and Methods > Statistical Analyses.
plain- Asserted: passes — The authors put it forward as true.
- Checkable: passes — It can be checked against evidence.
- Load-bearing: fails — The paper’s conclusions may not depend on it.
- Based: passes — The paper gives a reason why it holds.
Probably not a substantial claim. The paper’s conclusions may not depend on it. It may state two separate claims as one.
In the paper
“Consequently, the degree of shade, cooling, and humidification of the habitats surrounding the Luquillo Mountains have all increased (128).”
§ Climate-driven declines in arthropod abundance restructure a rainforest food web > Discussion > Multiple Regression and Cross-Correlation.
What the sources say
- Not checked yetcites [128] Otero LM Huey RB Gorman GC 2015 A few meters matter: Local habitats drive reproductive cycles in a tropical lizard Am Nat 186 E72 E80 26655361 source
plaindirect- Asserted: passes — The authors put it forward as true.
- Checkable: passes — It can be checked against evidence.
- Load-bearing: unclear — It is unclear whether the paper’s conclusions depend on it.
- Based: passes — The paper gives a reason why it holds.
It may state two separate claims as one.
None of the sources cited for this claim have been checked yet.
In the paper
“Since 1998, 8 of 33 Luquillo forest bird species (124) and 10 of 12 resident frog species (125) have undergone elevational shifts.”
§ Climate-driven declines in arthropod abundance restructure a rainforest food web > Discussion > Multiple Regression and Cross-Correlation.
What the sources say
- Not checked yetcites [124] Campos-Cerqueira M Arendt WJ Wunderle JM Jr Aide TM 2017 Have bird distributions shifted along an elevational gradient on a tropical mountain? Ecol Evol 7 9914 9924 29238525 PMC5723601 source
- Not checked yetcites [125] Campos-Cerqueira M Aide TM 2017 Lowland extirpation of anuran populations on a tropical mountain PeerJ 5 e4059 29158987 PMC5694215 source
plain- Asserted: passes — The authors put it forward as true.
- Checkable: passes — It can be checked against evidence.
- Load-bearing: fails — The paper’s conclusions may not depend on it.
- Based: passes — The paper gives a reason why it holds.
Probably not a substantial claim. The paper’s conclusions may not depend on it. It may state two separate claims as one.
None of the sources cited for this claim have been checked yet.
In the paper
“For Woolbrights’s (29, 30) census data at the Sonadura Old study area, we removed one outlier for the 1995 census data when E. coqui numbers increased from 29 to 236 and returned to 45 individuals in the next census.”
§ Climate-driven declines in arthropod abundance restructure a rainforest food web > Materials and Methods > Luquillo Long-Term Ecological Research Data.
What the sources say
- Not checked yetcites [29] Woolbright L 1991 Impact of Hurricane Hugo on forest frogs in Puerto Rico Biotropica 23 462 467 source
- Not checked yetcites [30] Woolbright L 1996 Disturbance influences long-term population patterns in the Puerto Rican frog, Eleutherodactylus coqui (Anura: Leptodactylidae) Biotropica 28 493 501 source
plainSingle case- Asserted: passes — The authors put it forward as true.
- Checkable: passes — It can be checked against evidence.
- Load-bearing: fails — The paper’s conclusions may not depend on it.
- Based: passes — The paper gives a reason why it holds.
Probably not a substantial claim. The paper’s conclusions may not depend on it.
What the paper did — it cites no source for this, so there is none to check. The quote shows it is in the paper.
In the paper
“To guard against such effects of multicollinearity, we constructed correlation matrices of the HP predictors and eliminated variables having correlations of 0.7 or higher.”
§ Climate-driven declines in arthropod abundance restructure a rainforest food web > Materials and Methods > Statistical Analyses.
plain- Asserted: passes — The authors put it forward as true.
- Checkable: passes — It can be checked against evidence.
- Load-bearing: passes — The paper’s conclusions depend on it.
- Based: passes — The paper gives a reason why it holds.
Probably not a substantial claim.
In the paper
“Pounds et al. (63) have presented a detailed rebuttal of the Lawton scenario with respect to montane forests in Costa Rica.”
§ Climate-driven declines in arthropod abundance restructure a rainforest food web > Discussion > Multiple Regression and Cross-Correlation.
What the sources say
- Not checked yetcites [63] Pounds J Fogden M Campbell J 1999 Biological response to climate change on a tropical mountain Nature 398 611 615 source
plain- Asserted: passes — The authors put it forward as true.
- Checkable: passes — It can be checked against evidence.
- Load-bearing: fails — The paper’s conclusions may not depend on it.
- Based: passes — The paper gives a reason why it holds.
Probably not a substantial claim. The paper’s conclusions may not depend on it.
In the paper
“Following the same procedures and using the same study area, arthropod abundances were again estimated during July 2011 and January 2012 using both sticky-traps and sweep netting.”
§ Climate-driven declines in arthropod abundance restructure a rainforest food web > Materials and Methods > Arthropod Samples.
What the sources say
- Not checked yetcites [22] Lister BC 1981 Seasonal niche relationships of rainforest anoles Ecology 62 1548 1560 source
plain- Asserted: passes — The authors put it forward as true.
- Checkable: passes — It can be checked against evidence.
- Load-bearing: passes — The paper’s conclusions depend on it.
- Based: passes — The paper gives a reason why it holds.
Probably not a substantial claim.
In the paper
“We conducted our field work in the same study area utilized by Lister (22) in the 1970s.”
§ Climate-driven declines in arthropod abundance restructure a rainforest food web > Materials and Methods > Study Sites.
What the sources say
- Not checked yetcites [22] Lister BC 1981 Seasonal niche relationships of rainforest anoles Ecology 62 1548 1560 source
plain- Asserted: passes — The authors put it forward as true.
- Checkable: passes — It can be checked against evidence.
- Load-bearing: passes — The paper’s conclusions depend on it.
- Based: passes — The paper gives a reason why it holds.
Probably not a substantial claim.
None of the sources cited for this claim have been checked yet.
In the paper
“However, Luquillo forest birds and frogs are known to exhibit elevational range shifts similar to those encountered on other tropical mountains.”
§ Climate-driven declines in arthropod abundance restructure a rainforest food web > Discussion > Multiple Regression and Cross-Correlation.
What the sources say
- Not checked yetcites [124] Campos-Cerqueira M Arendt WJ Wunderle JM Jr Aide TM 2017 Have bird distributions shifted along an elevational gradient on a tropical mountain? Ecol Evol 7 9914 9924 29238525 PMC5723601 source
- Not checked yetcites [125] Campos-Cerqueira M Aide TM 2017 Lowland extirpation of anuran populations on a tropical mountain PeerJ 5 e4059 29158987 PMC5694215 source
boostedcorrelational- Asserted: passes — The authors put it forward as true.
- Checkable: passes — It can be checked against evidence.
- Load-bearing: fails — The paper’s conclusions may not depend on it.
- Based: passes — The paper gives a reason why it holds.
Probably not a substantial claim. The paper’s conclusions may not depend on it.
What the paper did — it cites no source for this, so there is none to check. The quote shows it is in the paper.
In the paper
“Hence, we eliminated 2 of the 11 climate variables that had the highest correlations with the other climate variables.”
§ Climate-driven declines in arthropod abundance restructure a rainforest food web > Materials and Methods > Statistical Analyses.
plaincorrelational- Asserted: passes — The authors put it forward as true.
- Checkable: passes — It can be checked against evidence.
- Load-bearing: passes — The paper’s conclusions depend on it.
- Based: passes — The paper gives a reason why it holds.
Probably not a substantial claim.
In the paper
“In theory, clear cutting of lowland forests raises surface temperature, which in turn increases conductive heat flux from exposed ground to the atmosphere. This reduces both evapotranspiration and evaporative cooling (126) and lowers humidity.”
§ Climate-driven declines in arthropod abundance restructure a rainforest food web > Discussion > Multiple Regression and Cross-Correlation.
What the sources say
- Not checked yetcites [126] Lawton RO Nair US Pielke RA Sr Welch RM 2001 Climatic impact of tropical lowland deforestation on nearby montane cloud forests Science 294 584 587 11641496 source
hedgeddirect- Asserted: passes — The authors put it forward as true.
- Checkable: passes — It can be checked against evidence.
- Load-bearing: fails — The paper’s conclusions may not depend on it.
- Based: passes — The paper gives a reason why it holds.
Probably not a substantial claim. The paper’s conclusions may not depend on it. It may state two separate claims as one.
What the paper did — it cites no source for this, so there is none to check. The quote shows it is in the paper.
In the paper
“If a given variable did not make at least a 5% independent contribution to the explanation of the deviance, it was not included in the regression analyses.”
§ Climate-driven declines in arthropod abundance restructure a rainforest food web > Materials and Methods > Statistical Analyses.
plain- Asserted: passes — The authors put it forward as true.
- Checkable: passes — It can be checked against evidence.
- Load-bearing: fails — The paper’s conclusions may not depend on it.
- Based: passes — The paper gives a reason why it holds.
Probably not a substantial claim. The paper’s conclusions may not depend on it.
In the paper
“To compare Anolis densities with Lister’s (22) estimates from July 1976 and January 1977, we sampled anoles within the same 15 × 15-m quadrat during July 2011 and January 2012.”
§ Climate-driven declines in arthropod abundance restructure a rainforest food web > Materials and Methods > Anolis Abundance.
What the sources say
- Not checked yetcites [22] Lister BC 1981 Seasonal niche relationships of rainforest anoles Ecology 62 1548 1560 source
plain- Asserted: passes — The authors put it forward as true.
- Checkable: passes — It can be checked against evidence.
- Load-bearing: passes — The paper’s conclusions depend on it.
- Based: passes — The paper gives a reason why it holds.
Probably not a substantial claim.
What the paper did — it cites no source for this, so there is none to check. The quote shows it is in the paper.
In the paper
“Recaptures of the same individuals within a given sampling period were also eliminated from the analysis.”
§ Climate-driven declines in arthropod abundance restructure a rainforest food web > Materials and Methods > Luquillo Long-Term Ecological Research Data.
plain- Asserted: passes — The authors put it forward as true.
- Checkable: passes — It can be checked against evidence.
- Load-bearing: fails — The paper’s conclusions may not depend on it.
- Based: passes — The paper gives a reason why it holds.
Probably not a substantial claim. The paper’s conclusions may not depend on it.
The paper relies on this without support.
The historical data from the 1970s and other earlier censuses are comparable to the authors’ later samples despite the time gap and any differences in observers or methods.
“We compared arthropod biomass in Puerto Rico’s Luquillo rainforest with data taken during the 1970s and found that biomass had fallen 10 to 60 times.”
“Data for 1976 and 1977 are from Lister (22).”
The paper relies on this without support.
The meteorological stations at El Verde and Bisley adequately represent the temperature exposure of the arthropod and insectivore populations studied.
“Fig. 1 compares trends in mean maximum yearly temperature (MnMaxT) for the El Verde Field Station and Bisley Tower meteorological stations, both located at an altitude of 350 m.”
“The stations are ∼8.2 km apart at elevations of 350 and 352 m, respectively.”
The paper relies on this without support.
The statistical associations between temperature and abundance are not confounded by unmeasured variables that could produce the observed relationships.
“Regression and correlation analyses inevitably leave the issue of causality open to question (33, 34). In lieu of intractable experiments spanning large spatial and temporal scales, Vinod causality offers a statistical method that can help identify causal variables and reveal the direction of causal paths (36).”
The paper relies on this without support.
The eruption of Mount Pinatubo lowered global temperature by as much as 0.6 °C over the next 2 y.
“the eruption of Mount Pinatubo, which lowered global temperature by as much as 0.6 °C over the next 2 y, occurred during the walking stick, Sonadura West, and Sonadura Old censuses.”
The paper relies on this without support.
The climate data from the El Verde and Bisley meteorological stations are representative of the study area's climate.
“The El Verde station lies 5 km southwest of our study area (18.3211° N, 65.8200° W), at an elevation of 350 m. The upper Bisley Tower is located 3.2 km southeast of our study area (18.3164 N, 65.7453 W) at 352 m in elevation.”
The paper relies on this without support.
The Luquillo LTER data sets used are accurate and comparable over time.
“Data sets from the Luquillo long-term ecological research (LTER) online Data Center were downloaded and analyzed for trends in population abundances over time.”
The paper relies on this without support.
The 11 climate-related indices constructed from LTER temperature and rainfall data capture the relevant climate variation for the taxa studied.
“we constructed 11 climate-related indices from the Luquillo LTER temperature and rainfall data for use in HP and regression analyses.”
The paper relies on this without support.
Changes in temperature often lag phase shifts in the SOI by up to 9 months.
“Changes in temperature often lag phase shifts in the SOI by up to 9 mo, and this effect may be partly responsible.”
Claims other papers make about this one
Each is checked against this paper’s own text: does it say what the citing paper says it does?
In the citing paper
“More recently, climate disruption is becoming a major cause of species endangerment (10, 11, 14–17).”
From Vertebrates on the brink as indicators of biological annihilation and the sixth mass extinction (2020) · cites this paper as [17]
Statistics recomputed
Every reported test result, recomputed from its test statistic and degrees of freedom. A result shows as not adding up only once an independent check has confirmed it.
- Not confirmedz = 0.671reported p = .759 · recomputed p = .502
“z = 0.671, p = .759”
Self-check
Percentages, sums and reported differences re-computed from the paper’s own numbers.
Each contradiction between two passages listed here was confirmed by an independent check.
Rated minor: it would not touch a result — a value no result rests on, a p-value that stays on the same side of the significance level, or a conflict that is clerical, resolved elsewhere in the paper, or outside its own findings.
In the paper
§ Climate-driven declines in arthropod abundance restructure a rainforest food web > Results > Climate Trends in the Luquillo Forest.
“Between 1993 and 2015, the rate of temperature increase at Bisley Tower was 0.055 °C per year, not significantly different from the rate at El Verde.”
§ Climate-driven declines in arthropod abundance restructure a rainforest food web > Materials and Methods > Climate Data.
“Temperature data for the El Verde station span 37 y, from 1978 to 2015 (Fig. 1A), and for the Bisley station 21 y from 1993 to 2014 (Fig. 1B).”
Rated minor: it would not touch a result — a value no result rests on, a p-value that stays on the same side of the significance level, or a conflict that is clerical, resolved elsewhere in the paper, or outside its own findings.
In the paper
§ Climate-driven declines in arthropod abundance restructure a rainforest food web > Results > Birds.
“To explore trends in avian abundance, we analyzed mist netting data taken near the El Verde Field Station by Waide (31) from 1990 to 2015, an analysis that had not been previously published.”
§ Climate-driven declines in arthropod abundance restructure a rainforest food web > Materials and Methods > Luquillo Long-Term Ecological Research Data.
“We analyze mist netting data taken by Waide (31) in the LFDP from June 1990 until May 2005.”
Rated minor: it would not touch a result — a value no result rests on, a p-value that stays on the same side of the significance level, or a conflict that is clerical, resolved elsewhere in the paper, or outside its own findings.
In the paper
§ Climate-driven declines in arthropod abundance restructure a rainforest food web > Results > Arthropods.
“Overall, we found an eightfold decrease in the dry-weight biomass of arthropods captured per day in ground traps in 2014 compared with the average for July 1987 and July 1988 (SI Appendix, Fig. S2).”
§ Climate-driven declines in arthropod abundance restructure a rainforest food web > Materials and Methods > Study Sites.
“to compare recent samples with those we obtained in the same study area in 1986 and 1987 (25).”
Rated minor: it would not touch a result — a value no result rests on, a p-value that stays on the same side of the significance level, or a conflict that is clerical, resolved elsewhere in the paper, or outside its own findings.
In the paper
§ Climate-driven declines in arthropod abundance restructure a rainforest food web > Results > Arthropods.
“and 21 mg per trap per day in January 1976 vs. 8 mg per trap per day in January 2013.”
§ Climate-driven declines in arthropod abundance restructure a rainforest food web > Materials and Methods > Arthropod Samples.
“Lister (22) sampled arthropods within the Luquillo forest during July 1976 and January 1977.”
Citations
Cites
Investigating causal relations by econometric models and cross-spectral methods
Granger, C. W. J. (1969) · Econometrica · doi:10.2307/1912791 · Cited by 22,989
Domain-Adversarial Training of Neural Networks
Ganin, Y., Ustinova, E., Ajakan, H., Germain, P., Larochelle, H., Laviolette, F., Marchand, M., & Lempitsky, V. (2017) · Advances in Computer Vision and Pattern Recognition · doi:10.1007/978-3-319-58347-1_10 · Cited by 8,318
Computation and interpretation of biological statistics of fish populations
Ricker, W. E. (1975) · Cited by 6,904
Global pollinator declines: trends, impacts and drivers
Potts, S. G., Biesmeijer, J. C., Kremen, C., Neumann, P., Schweiger, O., & Kunin, W. E. (2010) · Trends in Ecology & Evolution · doi:10.1016/j.tree.2010.01.007 · Cited by 6,458
Accelerated modern human–induced species losses: Entering the sixth mass extinction
Ceballos, G., Ehrlich, P. R., Barnosky, A. D., García, A., Pringle, R. M., & Palmer, T. M. (2015) · Science Advances · doi:10.1126/sciadv.1400253 · Cited by 4,220 · cited 1×
“As the sixth mass extinction continues to decimate the world’s biota (137, 138), these data will be crucial to understanding the impact of climate change on terrestrial food webs (139), ecosystem dynamics (140), and biodiversity (8), and to formulating conservation strategies aimed at mitigating the effects of future…”
BackgroundBee declines driven by combined stress from parasites, pesticides, and lack of flowers
Goulson, D., Nicholls, E., Botías, C., & Rotheray, E. L. (2015) · Science · doi:10.1126/science.1255957 · Cited by 4,074
Impacts of climate warming on terrestrial ectotherms across latitude
Deutsch, C. A., Tewksbury, J. J., Huey, R. B., Sheldon, K. S., Ghalambor, C. K., Haak, D. C., & Martin, P. R. (2008) · Proceedings of the National Academy of Sciences · doi:10.1073/pnas.0709472105 · Cited by 3,840
More than 75 percent decline over 27 years in total flying insect biomass in protected areas
Hallmann, C. A., Sorg, M., Jongejans, E., Siepel, H., Hofland, N., Schwan, H., Stenmans, W., Müller, A., Sumser, H., Hörren, T., et al. (2017) · PLOS ONE · doi:10.1371/journal.pone.0185809 · Cited by 3,499
Ceballos, G., Ehrlich, P. R., & Dirzo, R. (2017) · Proceedings of the National Academy of Sciences · doi:10.1073/pnas.1704949114 · Cited by 2,663 · cited 1×
“As the sixth mass extinction continues to decimate the world’s biota (137, 138), these data will be crucial to understanding the impact of climate change on terrestrial food webs (139), ecosystem dynamics (140), and biodiversity (8), and to formulating conservation strategies aimed at mitigating the effects of future…”
BackgroundWhy Mountain Passes are Higher in the Tropics
Janzen, D. H. (1967) · The American Naturalist · doi:10.1086/282487 · Cited by 2,056
Research works printed but not linked: 5
- , eds ML Parry, OF Canziani, JP Palutikof, PJ van der Linden, CE Hanson (Cambridge Univ Press, Cambridge, UK Contribution of Working Group II to the Fourth Assessment Report of the Intergovernmental Panel on Climate Change, 2007).
- R Joglar P Burrowes Declining amphibian populations in Puerto Rico. Contributions to West Indian Herpetology: A Tribute to Albert Schwartz Contributions to Herpetology eds Powell R Henderson RW (The Society for the Study of Amphibians and Reptiles Ithaca NY) Vol 12 pp 371–380. (1996).
- JA Pounds, Disappearing gold. BBC Wildlife 8, 812–817 (1990).
- JA Pounds, Amphibian watch: New clues in the case of the disappearing amphibians. Wildlife Conservation 94, 16–18 (1991).
- P Burrowes, A Longo, R Joglar, Geographic distribution of Batrachochytrium dendrobatidis in Puerto Rico. Herpetol Rev 39, 321–324 (2008).
Cited by
Sorted by citations
Items 601–700 of 721
The Agricultural Transition and How It Changed Our Species
Gowdy, J. M. (2021) · Cambridge University Press eBooks · doi:10.1017/9781108974264.006
The Modern State/Market Superorganism
Gowdy, J. M. (2021) · Cambridge University Press eBooks · doi:10.1017/9781108974264.009
The Rise and Consolidation of State/Market Societies
Gowdy, J. M. (2021) · Cambridge University Press eBooks · doi:10.1017/9781108974264.007
Gowdy, J. M. (2021) · Cambridge University Press eBooks · doi:10.1017/9781108974264.001
Gowdy, J. M. (2021) · Cambridge University Press eBooks · doi:10.1017/9781108974264.017
Gowdy, J. M. (2021) · Cambridge University Press eBooks · doi:10.1017/9781108974264.012
The Evolution of Ultrasociality in Humans and Social Insects
Gowdy, J. M. (2021) · Cambridge University Press eBooks · doi:10.1017/9781108974264.004
Gowdy, J. M. (2021) · Cambridge University Press eBooks · doi:10.1017/9781108974264.010
Evolving a Sustainable and Equitable Future
Gowdy, J. M. (2021) · Cambridge University Press eBooks · doi:10.1017/9781108974264.013
The Evolution of Human Ultrasociality
Gowdy, J. M. (2021) · Cambridge University Press eBooks · doi:10.1017/9781108974264.002
(2021) · Cambridge University Press eBooks · doi:10.1017/9781108974264.016
VISITANTES FLORAIS DE Mikania glomerata SPRENG. (ASTERACEAE) EM UM JARDIM URBANO
Perugini, L. G. D. S., Ribeiro, M. A. H., Ohta, N. D. S., & Milaneze-Gutierre, M. A. (2022) · Arquivos do Mudi · doi:10.4025/arqmudi.v26i1.62759
The ecology of plants: from seed to seed
Corlett, R. T. (2019) · Oxford University Press eBooks · doi:10.1093/oso/9780198817017.003.0004
Corlett, R. T. (2019) · Oxford University Press eBooks · doi:10.1093/oso/9780198817017.003.0005
Corlett, R. T. (2019) · Oxford University Press eBooks · doi:10.1093/oso/9780198817017.003.0003
Corlett, R. T. (2019) · Oxford University Press eBooks · doi:10.1093/oso/9780198817017.003.0002
Corlett, R. T. (2019) · Oxford University Press eBooks · doi:10.1093/oso/9780198817017.003.0006
(2019) · Nature Ecology & Evolution · doi:10.1038/s41559-019-1057-1
Rare and Charismatic Species of Insects in Khar Yamaat Nature Reserve, Mongolia
Jargalsaikhan, P., Enkhbayar, T., Altangerel, G., Aibek, U., Narangarvuu, D., Enkhchimeg, T., Dulguun, B., Zolbayar, O., Bujinlkham, A., & Bayartogtokh, B. (2022) · Mongolian Journal of Biological Sciences · doi:10.22353/mjbs.2021.19.04
Putra, I. L. I., & Budi, A. S. (2021) · Journal Of Natural Sciences And Mathematics Research · doi:10.21580/jnsmr.2021.7.1.11282
(2022) · Elsevier eBooks · doi:10.1016/b978-0-12-823814-1.09987-6
Population Dynamics of Arthropods in New Caledonian Citrus Orchards
Fage, E., Leroy, L., & Mille, C. G. (2022) · Journal of Agriculture and Ecology Research International · doi:10.9734/jaeri/2022/v23i6504
Hahn, I., Gonçalves, P. V. D. W., Brandmeier, M., Richaud, S., & Markl, G. (2023) · Research Square · doi:10.21203/rs.3.rs-2523671/v1
Bowles, P. (2023) · Cambridge University Press eBooks · doi:10.1017/9781108758826.008
What Does the Future Hold for Our Planet and its Wildlife?
Maclean, N. (2023) · Cambridge University Press eBooks · doi:10.1017/9781108758826.022
Factors influencing tropical lizard reproduction vary by microhabitat but not forest type
Swartwout, M. C., & Willson, J. D. (2023) · Journal of Tropical Ecology · doi:10.1017/s0266467423000135
(2019) · Oxford University Press eBooks · doi:10.1093/oso/9780198817017.002.0003
(2019) · Oxford University Press eBooks · doi:10.1093/oso/9780198817017.002.0004
Competition and the century-long decline of a once common lizard, Sceloporus consobrinusPreprint
Murray, A. H., Folfas, E., Page, M. A., Lange, Z. K., Mruzek, J. L., & Frishkoff, L. O. (2023) · bioRxiv (Cold Spring Harbor Laboratory) · doi:10.1101/2023.08.25.554877
Conserving monarch butterflies through habitat management and policy
Harris, K. M. (2023) · doi:10.32469/10355/97052
Causality Estimation in Panel DataPreprint
Vinod, H. D. (2023) · SSRN Electronic Journal · doi:10.2139/ssrn.4595044
Fauna of some families of Coleoptera (Insecta) in the Republic of Mordovia (Russia)
Валентинович, Е. Л., Ruchin, A. B., Alekseev, S. K., Artaev, O., Lobachev, E. A., Lukiyanov, S. V., & Semishin, G. B. (2024) · Biodiversity Data Journal · doi:10.3897/bdj.12.e117041
Social cues and habitat structure influence the behavior of a non-social insectPreprint
Marcantonio, M., Masier, S., Kourtidis, A., & Levier, M. L. (2024) · doi:10.32942/x2wc9w
Efecto de la contaminación atmosférica en los polinizadores del corredor industrial Guanajuato
Quintana-Rodríguez, E., Vallejo, A. R. R., Claudio, J. D. J. E., Cumplido, J. H., & Orona‐Tamayo, D. (2024) · Perspectivas de la Ciencia y la Tecnología · doi:10.61820/pct.v7i12.1136
Toft, S., & Gajdoš, P. (2024) · Journal of Insect Conservation · doi:10.1007/s10841-024-00567-2
Population fluctuations in Costa Rican golden silk orbweavers (Trichonephila clavipes)
Reder, E., Lesh, C., Ochoa, G., Wu, S., & Ferree, E. D. (2024) · Journal of Arachnology · doi:10.1636/joa-s-22-046
The Thermal Properties of Artificial Reptile Refugia.
Harris, S. (2019) · doi:10.46289/7h8u3f7w
New, T. R. (2024) · Springer eBooks · doi:10.1007/978-3-031-66631-5_2
Govindasamy, P., Keerthi, M. C., Sujayanand, G. K., Bhargavi, H. A., Mahesha, H. S., Sriniv, R., Choudhary, M., Chaudhary, M., Prasad, M., Kumar, S., et al. (2024) · Research Square · doi:10.21203/rs.3.rs-5365696/v1
Insectos, biodiversidad amenazada en un mundo cambiante
Galante, E. (2023) · Ecología política · doi:10.53368/ep66cepbep03
Evaluation of Citizen Science Project on Birdwatching in Germany: Advantages and Limits
Ehrmann, A., & Tillmanns, O. (2025) · Diversity · doi:10.3390/d17020078
Visual social cues and habitat structure influence the behaviour of a nonsocial insect
Marcantonio, M., Levier, M. L., Kourtidis, A., & Masier, S. (2024) · Biological Journal of the Linnean Society · doi:10.1093/biolinnean/blae120
Bodineau, T., de Villemereuil, P., Lemaire, B., Agostini, S., Decencière, B., Millet, M., Meylan, S., & Galliard, J. L. (2025) · Functional Ecology · doi:10.1111/1365-2435.70030
Latta, S. C., Scott, E. A., Astudillo, P. X., Graham, C. H., Nieto, A., & Tinoco, B. A. (2025) · The Auk · doi:10.1093/ornithology/ukaf030
Castilla, G. R., Bastías, C. C., Villar-Ruiz, Á., Salazar, P. C., Herraiz, A. D., Pérez‐Guerrero, S., Barrón, V., Quero, J. L., & Villar, R. (2025) · Ecosistemas · doi:10.7818/ecos.2827
Nadin‐Davis, S. A., & Marston, D. A. (2025) · Elsevier eBooks · doi:10.1016/b978-0-443-29979-7.00005-2
Are Findings of Key Insect Metrics Generalizable Across Different Taxa in Malaise Trap Samples?
Remmel, N., Enß, J., Haase, P., & Sinclair, J. S. (2025) · Ecology and Evolution · doi:10.1002/ece3.72006
ISYEB, M., Moulin, N., & Touroult, J. (2025) · Bulletin de la Société entomologique de France · doi:10.32475/bsef_2275
Sahu, L., & Singh, A. P. (2025) · National Academy Science Letters · doi:10.1007/s40009-025-01817-w
The status of protected butterfly species in Romania in the context of national and EU legislation
Vizauer, T.-C., Crişan, A., & Rákosy, L. (2025) · Entomologica Romanica · doi:10.24193/entomolrom.29.27
Calado, H. R., Soares, A. O., Heleno, R., & Borges, P. A. V. (2025) · Biodiversity Data Journal · doi:10.3897/bdj.13.e173529
Rukmana, R., Amrullah, S. H., & Rustam, A. (2025) · doi:10.5994/semnas.05.07.2025.53
Citizen science suggests decreased diversity of insects in Mexico, a megadiverse country
Soberón, J. M. (2025) · Revista Mexicana de Biodiversidad · doi:10.22201/ib.20078706e.2025.96.5720
Mbora, D. N. M. (2022) · Research Square · doi:10.21203/rs.3.rs-1422996/v1
Yeo, D., Srivathsan, A., Puniamoorthy, J., Foo, M., Grootaert, P., Chan, L., Guénard, B., Damken, C., Wahab, R. A., Yuchen, A., et al. (2021) · Figshare · doi:10.6084/m9.figshare.16620763
Yeo, D., Srivathsan, A., Puniamoorthy, J., Foo, M., Grootaert, P., Chan, L., Guénard, B., Damken, C., Wahab, R. A., Yuchen, A., et al. (2021) · Figshare · doi:10.6084/m9.figshare.16620766
García-Martínez, G., Hernández, C. T., Silveira, J., Iuit, J. O. V., & Carranza, D. A. (2024) · BIOCYT Biología Ciencia y Tecnología · doi:10.22201/fesi.20072082e.2024.17.87110
França, F., & Ferreira, J. (2020) · doi:10.64628/aai.whkk63qmu
Sampling Invertebrates and Small Vertebrates
Mühlenberg, M., & Waßmer, T. (2025) · Springer eBooks · doi:10.1007/978-3-031-87547-2_2
Changement climatique : les abeilles déboussolées par la nouvelle odeur des fleurs
Jaworski, C. C., Geslin, B., & Fernandez, C. (2019) · doi:10.64628/aak.9cp3gd799
Climate change: bees are disorientated by flowers’ changing scents
Jaworski, C. C., Geslin, B., & Fernandez, C. (2019) · doi:10.64628/aak.x6re5jaff
Soni, N., Kumari, I., Salaria, N., Kumar, R., & Duhan, S. S. (2025) · Springer eBooks · doi:10.1007/978-981-97-9859-9_44
Meneghetti, J., Barão, K. R., & Paladini, A. (2025) · Neotropical Entomology · doi:10.1007/s13744-025-01335-w
Invasive Lonicera maackii (Dipscales: Caprifoliaceae) supports a depauperate arthropod community
Zakroff, A. R. A., & Stireman, J. O. (2025) · Environmental Entomology · doi:10.1093/ee/nvaf130
van Starrenburg, C., Mancheño, A. G., van de Koppel, J., van der Wal, D., Slegt, M. H., Schrama, M. J. J., Berg, M. P., van Wesenbeeck, B. K., Kalloe, S. A., Hofland, B., et al. (2026) · Ecological Engineering · doi:10.1016/j.ecoleng.2025.107886
Resources Depletion, Ecosystem Destruction and Overpopulation
Liu, C., & Qinghua, L. (2026) · Journal of Sustainable Development · doi:10.5539/jsd.v19n1p119
The detection of butterflies with DNA metabarcoding in Malaise trap bulk samples
Hoffmann, L., Buchner, D., Uhler, J., Haase, P., Müller, J., & Stoll, S. (2026) · Journal of Insect Conservation · doi:10.1007/s10841-026-00764-1
The Future of Biodiversity in the Congo Basin
Abernethy, K. A., Abwe, E., Akomo-Okoue, E. F., Ondo, F. E., Makaga, L., & Iponga, D. M. (2026) · Springer eBooks · doi:10.1007/978-1-0716-5512-2_24
Metadata
- Authors
- Lister, B. C., & Garcia, A.
- Affiliations
- Rensselaer Polytechnic Institute (US)
- Estación de Biología Chamela, Instituto de Biología, Universidad Nacional Autónoma de México, 47152 Chamela, Jalisco, Mexico
- Corresponding author
- Lister, Bradford C.
- Venue
- Proceedings of the National Academy of Sciences
- Publisher
- National Academy of Sciences
- Published
- 2018-10-15
- Volume
- 115
- Issue
- 44
- Pages
- E10397-E10406
- ISSN
- 0027-8424 (ISSN-L)
- 1091-6490
- PMC
- PMC6217376
- OpenAlex
- W2896548525
- Semantic Scholar
- f29ff7e7a9333947b0aaf530f499f518c503d9e1
- Cited by
- 730
- References
- 146
- Citations by year
- 2026: 37 · 2025: 60 · 2024: 67 · 2023: 99 · 2022: 81 · 2021: 122 · 2020: 122 · 2019: 137 · 2018: 4
- FWCI
- 75.51
- Type
- journal article
- Language
- en
- Open access
- hybrid
- doi.org
- Licence
- Locations
- Proceedings of the National Academy of Sciences (publishedVersion, cc-by-nc-nd)
- Europe PMC (PubMed Central) (publishedVersion, cc-by-nc-nd)
- PubMed Central (publishedVersion, cc-by-nc-nd)
- PubMed (publishedVersion)
- Funders
- NSF (1038013)
- Topics
- Physical Sciences › Environmental Science › Nature and Landscape Conservation › Ecology and Vegetation Dynamics Studies
- Life Sciences › Agricultural and Biological Sciences › Insect Science › Insect and Arachnid Ecology and Behavior
- Life Sciences › Agricultural and Biological Sciences › Insect Science › Forest Ecology and Biodiversity Studies
- Keywords
- global warming, insectivores, ENSO, Luquillo Experimental Forest, long-term ecological monitoring, canopy arthropods, walking stick, lizards, frogs, birds, Puerto Rico
- MeSH terms
- Animals, Arthropods, Birds, Puerto Rico, Trees, Tropical Climate, Ecosystem, Biomass, Food Chain, Biodiversity, El Nino-Southern Oscillation, Forests, Rainforest
About these checks
Registry, retraction, Cites and statistics results are computed, not judged, with one exception: a printed reference that no index lists is read once by a model before it counts as a citation error. Claims are extracted by a model and kept only when their quote appears verbatim in the text; each cited source is then checked, with a model’s help, for whether it says what the claim relies on. Those verdicts can be wrong — read the claim’s quote and the cited source before relying on one.
A language model drew the claims from the paper on 2026-10-06, under version 3 of the claim definition (model deepseek-v4.1-flash, prompt extract-v3).
A second model labelled each claim on 2026-10-06 (model jev-1.13-20260917, definition revision gold-guideline-v0.2).
Statistics and arithmetic are recomputed, not judged.
Confidence bands are shown only for fields calibrated on our annotated test set. None is calibrated yet, so no band is shown.
What counts as a claim ›How we measure confidence ›How we check this ›
Are you an author, or do you see a problem with this page? Request a review
