

The DOI matches its Crossref record; 97 of the 97 references it cites were found in a registry or an index; 14 of the 59 sources its claims cite were checked for support.
Learning loss due to school closures during the COVID-19 pandemic
Open accessAbstract
Significance: School closures have been a common tool in the battle against COVID-19. Yet, their costs and benefits remain insufficiently known. We use a natural experiment that occurred as national examinations in The Netherlands took place before and after lockdown to evaluate the impact of school closures on students’ learning. The Netherlands is interesting as a “best-case” scenario, with a short lockdown, equitable school funding, and world-leading rates of broadband access. Despite favorable conditions, we find that students made little or no progress while learning from home. Learning loss was most pronounced among students from disadvantaged homes.
Overview
AI snapshot
Written from the paper’s full text.
TL;DR
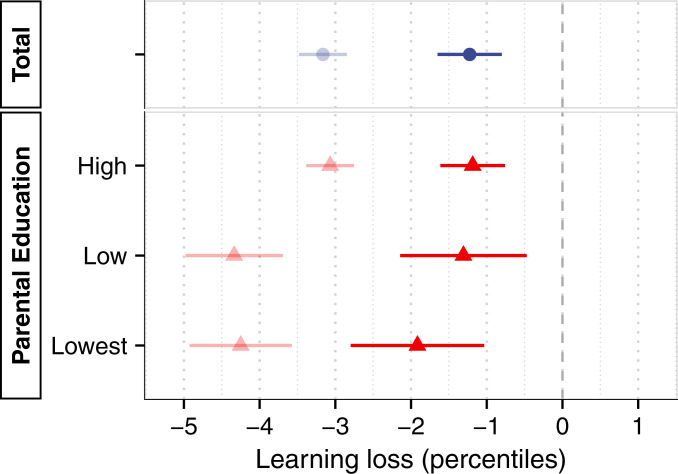
Using Dutch national assessments taken before and after an 8-week COVID-19 school closure, this study finds that primary students made little or no progress while learning from home. The Netherlands is a “best-case” setting, yet average learning loss was 3.16 percentile points (0.08 SD), with larger losses among students from disadvantaged homes.
Key findings
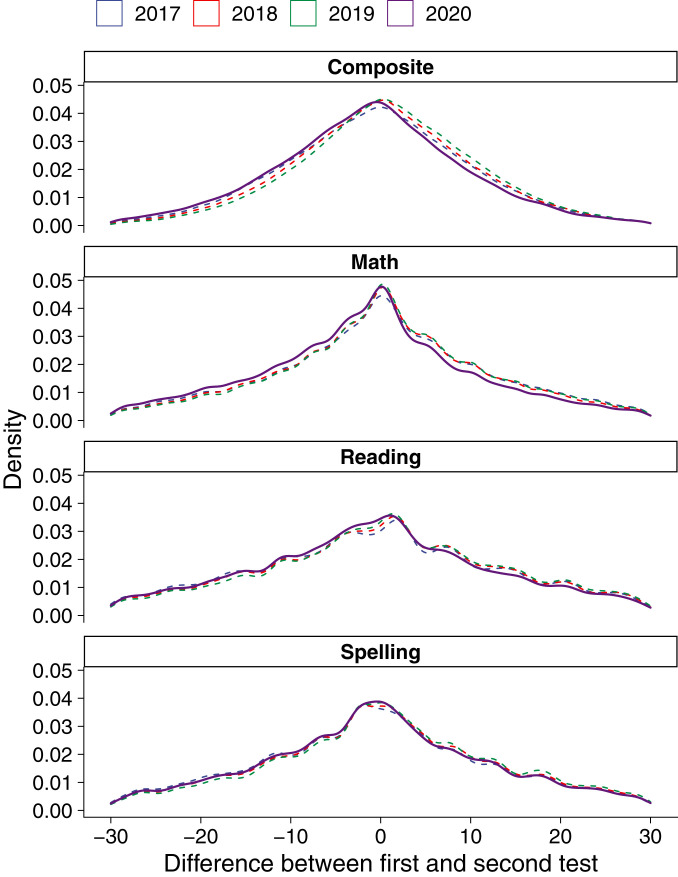
- In the baseline difference-in-differences estimate for a composite of math, spelling, and reading, students lost on average 3.16 percentile points, equivalent to 0.08 SD; raw differences ranged from −0.76 percentiles in spelling to −2.15 percentiles in math.
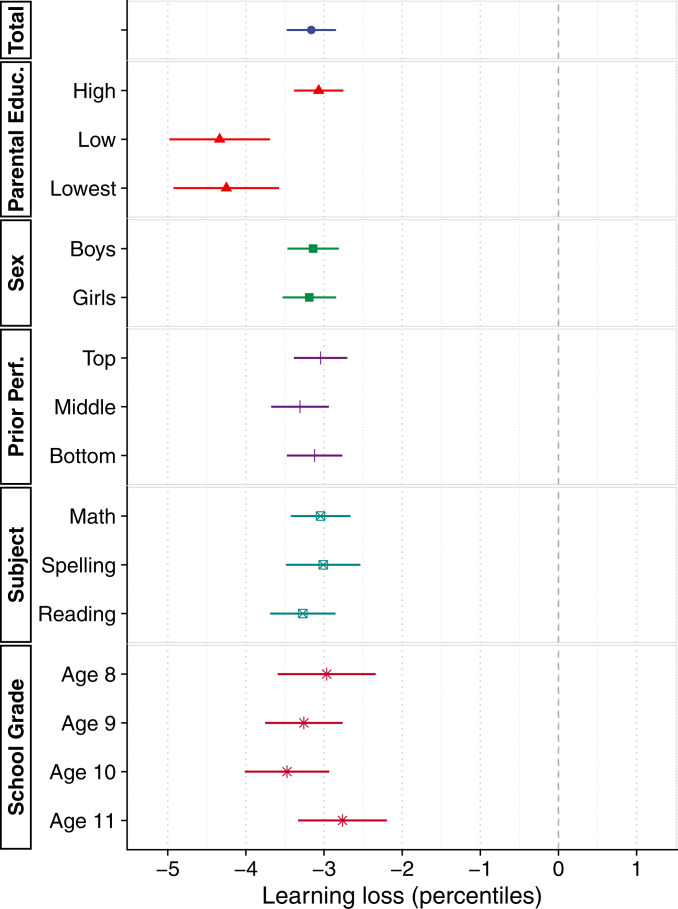
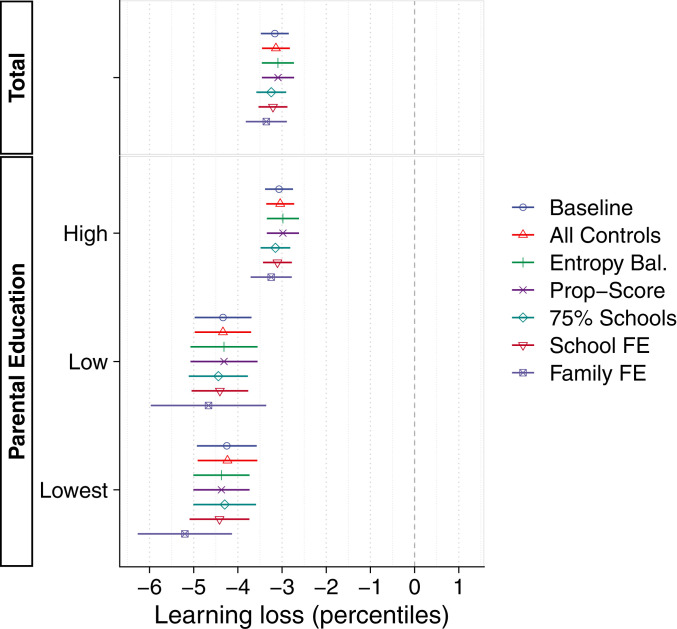
- Losses were concentrated among students from less-educated homes: the two lowest parental-education categories, together 8% of the population, suffered losses 40% larger than average (high, −3.07; low, −4.34; lowest, −4.25); within-family estimates showed a gap of 60% (high, −3.25; low, −4.67; lowest, −5.20).
- There was little evidence that effects differed by sex, school grade, subject, or prior performance, but school-level variation was considerable, with some schools seeing losses of 10 percentile points or more and others no losses or small gains.
- On a learning-readiness test not tied to curricular content, effects shrank by nearly two-thirds (main effect −1.19 vs. −3.16), suggesting most of the drop reflects knowledge learned; 3.16 percentiles translates to 7.9 to 10.5 weeks of lost learning depending on the benchmark.
Methods
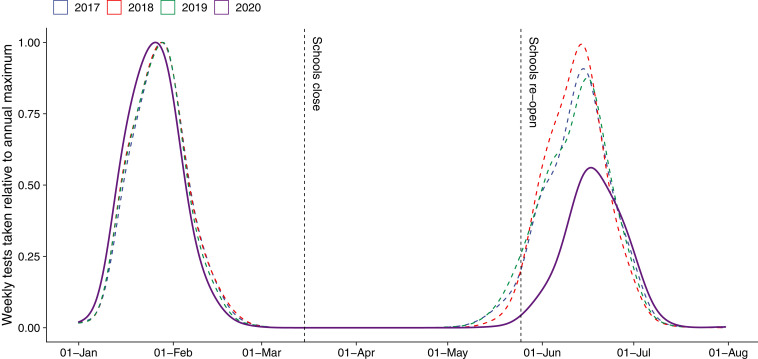
- Natural experiment/difference-in-differences design using biannual national standardized tests in The Netherlands from 2017 to 2020, covering 15% of Dutch primary schools (n ≈ 350,000) and students aged 8 to 11 years (grades 4 to 7); 2020 tests occurred just before and after 8 weeks of nationwide closures starting March 16.
- Main outcomes were math, spelling, reading, and a composite score, plus an oral reading fluency/learning-readiness test; scores were transformed to percentiles, with baseline models adjusting for a linear year trend and days between tests and clustering standard errors at the school level.
- Robustness included placebo analyses, year exclusions, loss-to-follow-up adjustments via regression, propensity-score and maximum-entropy weighting, school and family fixed effects, and a specification curve analysis of more than 2,000 alternative models.
Limitations
- The paper states that only time will tell whether students rebound, remain stable, or fall farther behind; test scores do not capture psychosocial development or societal and parental costs; and results may underestimate the full costs of school closures.
- The paper notes that The Netherlands is a best-case scenario due to short closures, high technological preparedness, and equitable school funding, making the estimates a likely lower bound; the short closure also gave little time to adapt, and remote learning might improve with time.
- The text makes evident that the sample covers 15% of primary schools, loss to follow-up is addressed but only a subset of students took tests after lockdown, and the within-family fixed-effects specification reduces the sample by approximately 60% and shifts it toward larger families.
Model-written summary. Check it against the paper before relying on it.
Integrity signals
Registry
Cites
Statistics
Figures
Verification
Claims the paper makes
23 Own result · 16 Own method · 12 Own interpretation · 10 No full text of the sources · 9 Sources not found · 4 Partly supported · 4 Not checked yet · 3 No basis given · 2 Supported so far · accuracy not yet measured
The cited sources support only part of this claim — read each source’s verdict below.
In the paper
“In their projections of learning loss due to the pandemic, the World Bank assumes a yearly progress of 0.40 SD (46).”
§ Learning loss due to school closures during the COVID-19 pandemic > Discussion
What the sources say
- Partly supportedcites [46] J. P. Azevedo, A. Hasan, D. Goldemberg, S. A. Iqbal, K. Geven (2020) Simulating the potential impacts of COVID-19 school closures on schooling and learning outcomes: A set of global estimates. World Bank Policy Research Working Paper (9284). https://openknowledge.worldbank.org/handle/10986/33945. Accessed 9 February 2021. sourceExperimental — accuracy not yet measured
The Empirical methodology (p. 15) says the projections assume learning gains of 0.2–0.5 SD from one grade to the next, depending on country income. Annex A.1 (p. 44) specifies 40 PISA points, equivalent to 0.40 SD, as the baseline for upper-middle-income countries—not as a universal yearly rate. (LLM, conf=0.90)
plain- Asserted: passes — The authors put it forward as true.
- Checkable: passes — It can be checked against evidence.
- Load-bearing: passes — The paper’s conclusions depend on it.
- Based: passes — The paper gives a reason why it holds.
- Partly supported
The cited sources support only part of this claim — read each source’s verdict below.
In the paper
“Our results show that learning loss was particularly pronounced for students from disadvantaged homes, confirming the fears held by many that school closures would cause socioeconomic gaps to widen (51 –55).”
§ Learning loss due to school closures during the COVID-19 pandemic > Discussion
What the sources say
- Supportedcites [51] E. A. Hanushek, L. Woessmann, The Economic Impacts of Learning Losses (Organisation for Economic Co-operation and Development OECD, 2020). source
The Summary of closure experiences says that school closures have widened gaps in skill development and warns that they may increase inequality. Section 4, “Distributional issues,” says the negative impact was greater for students from disadvantaged households. The citing authors’ claim about what their own results show is not attributed to this source. (LLM, conf=0.92)
- Supportedcites [52] F. Agostinelli, M. Doepke, G. Sorrenti, F. Zilibotti, When the Great Equalizer Shuts Down: Schools, Peers, and Parents in Pandemic Times (National Bureau of Economic Research, 2020). PMC8735857 35017763 source
The Conclusions state that the paper’s analysis finds higher educational inequality and that learning gaps grow during the pandemic. This supports the cited concern that school closures would widen socioeconomic gaps; the citing authors’ own learning-loss results are not attributed to this source. (LLM, conf=0.93)
- Partly supportedcites [53] A. Bacher-Hicks, J. Goodman, C. Mulhern, Inequality in household adaptation to schooling shocks: Covid-induced online learning engagement in real time. J. Publ. Econ. 193, 104345 (2020). PMC8486492 34629567 sourceExperimental — accuracy not yet measured
The Introduction reports that school closures widened socioeconomic gaps in searches for online learning resources. The Discussion says this pattern suggests academic gaps will be wider in future school years, but the paper does not establish that closures had already widened learning-loss gaps; its measured outcome is primarily search engagement. (LLM, conf=0.86)
- Supportedcites [54] Z. Parolin, E. K. Lee, Large socio-economic, geographic and demographic disparities exist in exposure to school closures. Nat. Hum. Beh., 10.1038/s41562-021-01087-8. (2021). PMC8060162 33737734 source
The Discussion says that disadvantaged students’ greater exposure to school closures and distance learning may exacerbate socio-economic gaps in learning outcomes. This supports the cited concern that closures could widen those gaps; the citing authors attribute the observed learning loss to their own results, not to this source. (LLM, conf=0.90)
- Supportedcites [55] D. H. Bailey, G. J. Duncan, R. J. Murnane, N. A. Yeung (2021) Achievement gaps in the wake of COVID-19 (EdWorkingPaper No. 21-346, Annenberg Institute at Brown University). https://www.edworkingpapers.com/ai21-346. Accessed 9 February 2021. source
The Discussion reports researchers’ prediction that COVID-19 would markedly increase achievement gaps between children from low- and higher-income families. The Abstract identifies these as forecasts, supporting the cited ‘fears’; the claim that results confirm them refers to the citing authors’ own results, not to this source. (LLM, conf=0.90)
boosteddirect- Asserted: passes — The authors put it forward as true.
- Checkable: passes — It can be checked against evidence.
- Load-bearing: passes — The paper’s conclusions depend on it.
- Based: passes — The paper gives a reason why it holds.
- Supported
The cited sources support only part of this claim — read each source’s verdict below.
In the paper
“Nevertheless, the magnitude of our findings appears to validate scenarios projected by bodies such as the European Commission (34) and the World Bank (46).”
§ Learning loss due to school closures during the COVID-19 pandemic > Discussion
What the sources say
- Not matchedcites [34] G. Di Pietro, F. Biagi, P. Costa, Z. Karpinski, J. Mazza, The Likely Impact of COVID-19 on Education: Reflections Based on the Existing Literature and Recent International Datasets (Publications Office of the European Union, 2020).
Couldn’t be matched to a paper in Crossref, so it can’t be checked.
- Supportedcites [46] J. P. Azevedo, A. Hasan, D. Goldemberg, S. A. Iqbal, K. Geven (2020) Simulating the potential impacts of COVID-19 school closures on schooling and learning outcomes: A set of global estimates. World Bank Policy Research Working Paper (9284). https://openknowledge.worldbank.org/handle/10986/33945. Accessed 9 February 2021. source
The citation to this paper is attached to the World Bank scenarios, not to the European Commission or the citing authors’ judgment that their findings validate them. The Conclusion (p. 35) presents optimistic, intermediate, and pessimistic global scenarios for the effects of COVID-19 school closures on schooling and learning. (LLM, conf=0.91)
hedgedcorrelational- Asserted: passes — The authors put it forward as true.
- Checkable: passes — It can be checked against evidence.
- Load-bearing: unclear — It is unclear whether the paper’s conclusions depend on it.
- Based: passes — The paper gives a reason why it holds.
- Not matched
The sources with a verdict support this claim; the rest weren’t checked yet, have no full text we could read, or their verdicts aren’t rated yet.
In the paper
“Moreover, we match treatment and control groups on a wider range of individual- and school-level characteristics using reweighting on the propensity of treatment (68) and maximum-entropy balancing (69).”
§ Learning loss due to school closures during the COVID-19 pandemic > Materials and Methods > Propensity Score and Entropy Weighting.
What the sources say
- Supportedcites [68] G. W. Imbens, J. M. Wooldridge, Recent developments in the econometrics of program evaluation. J. Econ. Lit. 47, 5– 86 (2009). source
Section 5.4 explains that adjusting for the propensity score accounts for differences in covariates between treated and control units. Section 5.6 describes weighting observations by their propensity of treatment or non-treatment. Citation (68) supports the propensity-reweighting method; the sentence cites a different source for maximum-entropy balancing. (LLM, conf=0.88)
- Not checked — no full text of the sourcecites [69] J. Hainmueller, Entropy balancing for causal effects: A multivariate reweighting method to produce balanced samples in observational studies. Polit. Anal., 20, 25– 46 (2012). source
plaincorrelational- Asserted: passes — The authors put it forward as true.
- Checkable: passes — It can be checked against evidence.
- Load-bearing: passes — The paper’s conclusions depend on it.
- Based: passes — The paper gives a reason why it holds.
- Supported
A result the paper reports from its own data — it cites no other source for it, so there is none to check. The quote shows it is in the paper.
In the paper
“The largest gap in effect sizes between educational backgrounds is found in our within-family analysis, estimated at 60% (parental education: high, −3.25; low, −4.67; lowest, −5.20).”
§ Learning loss due to school closures during the COVID-19 pandemic > Results > Adjusting for Loss to Follow-up.
hedgedcorrelational- Asserted: passes — The authors put it forward as true.
- Checkable: passes — It can be checked against evidence.
- Load-bearing: unclear — It is unclear whether the paper’s conclusions depend on it.
- Based: passes — The paper gives a reason why it holds.
A result the paper reports from its own data — it cites no other source for it, so there is none to check. The quote shows it is in the paper.
In the paper
“Those in the two lowest categories of parental education—together accounting for 8% of the population ( SI Appendix, section 5.1)—suffered losses 40% larger than the average student (estimates by parental education: high, −3.07; low, −4.34; lowest, −4.25).”
§ Learning loss due to school closures during the COVID-19 pandemic > Results > Baseline Specification.
plaincorrelational- Asserted: passes — The authors put it forward as true.
- Checkable: passes — It can be checked against evidence.
- Load-bearing: passes — The paper’s conclusions depend on it.
- Based: passes — The paper gives a reason why it holds.
A result the paper reports from its own data — it cites no other source for it, so there is none to check. The quote shows it is in the paper.
In the paper
“Disregarding the trend and instead assuming a counterfactual where achievement had stayed flat between 2019 and 2020, the estimated treatment effect shrinks by 21% to −2.51 percentiles ( SI Appendix, section 7.11).”
§ Learning loss due to school closures during the COVID-19 pandemic > Results > Specification Curve Analysis.
hedgeddirect- Asserted: passes — The authors put it forward as true.
- Checkable: passes — It can be checked against evidence.
- Load-bearing: passes — The paper’s conclusions depend on it.
- Based: passes — The paper gives a reason why it holds.
A result the paper reports from its own data — it cites no other source for it, so there is none to check. The quote shows it is in the paper.
In the paper
“In contrast, we find little evidence that the effect differs by sex, school grade, subject, or prior performance.”
§ Learning loss due to school closures during the COVID-19 pandemic > Results > Baseline Specification.
hedged- Asserted: passes — The authors put it forward as true.
- Checkable: passes — It can be checked against evidence.
- Load-bearing: unclear — It is unclear whether the paper’s conclusions depend on it.
- Based: passes — The paper gives a reason why it holds.
A result the paper reports from its own data — it cites no other source for it, so there is none to check. The quote shows it is in the paper.
In the paper
“The placebo estimate closest to zero is found in the version of our preferred specification that includes family fixed effects.”
§ Learning loss due to school closures during the COVID-19 pandemic > Results > Specification Curve Analysis.
plain- Asserted: passes — The authors put it forward as true.
- Checkable: passes — It can be checked against evidence.
- Load-bearing: unclear — It is unclear whether the paper’s conclusions depend on it.
- Based: passes — The paper gives a reason why it holds.
A result the paper reports from its own data — it cites no other source for it, so there is none to check. The quote shows it is in the paper.
In the paper
“Therefore, adjusting for these covariates makes little difference to our results ( SI Appendix, section 7.1).”
§ Learning loss due to school closures during the COVID-19 pandemic > Results > Adjusting for Loss to Follow-up.
plain- Asserted: passes — The authors put it forward as true.
- Checkable: passes — It can be checked against evidence.
- Load-bearing: unclear — It is unclear whether the paper’s conclusions depend on it.
- Based: passes — The paper gives a reason why it holds.
- Probably not a substantial claim. 19
- It may state two separate claims as one. 30
- The quote only partly states this claim. 1
The sources with a verdict support this claim; the rest weren’t checked yet, have no full text we could read, or their verdicts aren’t rated yet.
In the paper
“Dynamic models of learning stress how small losses can accumulate into large disadvantages with time (56 –58).”
§ Learning loss due to school closures during the COVID-19 pandemic > Discussion
What the sources say
- Not checked — no full text of the sourcecites [56] T. A. DiPrete, G. M. Eirich, Cumulative advantage as a mechanism for inequality: A review of theoretical and empirical developments. Annu. Rev. Sociol. 32, 271– 297 (2006). source
- Supportedcites [57] M. Kaffenberger, Modelling the long-run learning impact of the Covid-19 learning shock: Actions to (more than) mitigate loss. Int. J. Educ. Dev. 81, 102326 (2021). 33716394 PMC7923185 source
The Introduction reports that the model projects a one-third reduction in grade 3 learning to become a full-year deficit by grade 10, and a one-half reduction to become a 1.5-year deficit. These projections support the claim that an initial learning loss can lead to a larger disadvantage over time. (LLM, conf=0.92)
- Supportedcites [58] N. Fuchs-Schündeln, D. Krueger, A. Ludwig, I. Popova, The Long-Term Distributional and Welfare Effects of COVID-19 School Closures (National Bureau of Economic Research, 2020). source
The Introduction (page unavailable) explains that an initial shortfall in children’s human capital reduces the productivity of later investments, leading to less investment and worse educational and earnings outcomes. Section 4.1.1 (page unavailable) likewise says that reduced accumulation at younger ages translates into lower human capital and investment in the future. (LLM, conf=0.90)
plaindirect- Asserted: passes — The authors put it forward as true.
- Checkable: passes — It can be checked against evidence.
- Load-bearing: fails — The paper’s conclusions may not depend on it.
- Based: passes — The paper gives a reason why it holds.
Probably not a substantial claim. The paper’s conclusions may not depend on it.
The cited sources support only part of this claim — read each source’s verdict below.
In the paper
“Test scores do not consider children’s psychosocial development (63, 64), either societal costs due to productivity decline or heightened pressure among parents (65, 66).”
§ Learning loss due to school closures during the COVID-19 pandemic > Discussion
What the sources say
- Partly supportedcites [63] A. Gassman-Pines, C. M. Gibson-Davis, E. O. Ananat, How economic downturns affect children’s development: An interdisciplinary perspective on pathways of influence. Child Dev. Perspect. 9, 233– 238 (2015). 31327980 PMC6641565 sourceExperimental — accuracy not yet measured
The section on economic and psychological effects on continuously employed individuals reports increased financial and psychological stress within families and greater parental distress during downturns, supporting the point about pressure on parents. The paper also discusses children’s emotional well-being separately from test scores, but it does not say that test scores omit societal costs from declining productivity or explicitly assess what test scores capture. No page number was available in our copy. (LLM, conf=0.82)
- Could not verifycites [64] L. Shanahan, Emotional distress in young adults during the COVID-19 pandemic: Evidence of risk and resilience from a longitudinal cohort study. Psychol. Med., 10.1017/S003329172000241X (2020). PMC7338432 32571438 sourceExperimental — accuracy not yet measured
The Methods (Measures; page unavailable) assess economic and lifestyle disruptions among young adults, and the Discussion (page unavailable) links those disruptions to emotional distress. Neither passage addresses what test scores omit, societal costs from declining productivity, or heightened pressure on parents. Searches for those specific points found no supporting passage in our copy. (LLM, conf=0.73)
- Partly supportedcites [65] C. Collins, L. C. Landivar, L. Ruppanner, W. J. Scarborough, COVID-19 and the gender gap in work hours. Gender Work. Organ. 28, 101– 12. (2020). PMC7361447 32837019 sourceExperimental — accuracy not yet measured
The Introduction describes acute time and financial pressures on working parents, and the Results (section 4.1; page unavailable) report that mothers reduced paid work hours amid childcare and homeschooling demands. These passages support heightened parental pressure and reduced work time, but the paper does not assess test scores or establish societal costs from a decline in productivity. (LLM, conf=0.84)
- Partly supportedcites [66] P. Biroli (2020) “ Family life in lockdown” (IZA Discussion Paper 13398, Institute of Labor Economics, Bonn, Germany). sourceExperimental — accuracy not yet measured
The Results section (Family Cooperation and Tensions; page unavailable) reports increased household tension associated with changes in childcare and other household tasks during lockdown, supporting the point about pressure on parents. The paper does not establish societal costs from declining productivity or state that test scores omit these effects. (LLM, conf=0.82)
plain- Asserted: passes — The authors put it forward as true.
- Checkable: passes — It can be checked against evidence.
- Load-bearing: unclear — It is unclear whether the paper’s conclusions depend on it.
- Based: passes — The paper gives a reason why it holds.
It may state two separate claims as one.
- Partly supported
A result the paper reports from its own data — it cites no other source for it, so there is none to check. The quote shows it is in the paper.
In the paper
“Doing so identifies the control for pretreatment trends as the most influential, followed by the control for test timing and the inclusion of school and family fixed effects.”
§ Learning loss due to school closures during the COVID-19 pandemic > Results > Specification Curve Analysis.
plaindirect- Asserted: passes — The authors put it forward as true.
- Checkable: passes — It can be checked against evidence.
- Load-bearing: passes — The paper’s conclusions depend on it.
- Based: passes — The paper gives a reason why it holds.
It may state two separate claims as one.
A result the paper reports from its own data — it cites no other source for it, so there is none to check. The quote shows it is in the paper.
In the paper
“However, the fixed-effects specification shifts the sample toward larger families, and effects in this subsample are similar using our baseline specification ( SI Appendix, section 7.7).”
§ Learning loss due to school closures during the COVID-19 pandemic > Results > Adjusting for Loss to Follow-up.
plaincorrelational- Asserted: passes — The authors put it forward as true.
- Checkable: passes — It can be checked against evidence.
- Load-bearing: unclear — It is unclear whether the paper’s conclusions depend on it.
- Based: passes — The paper gives a reason why it holds.
It may state two separate claims as one.
A result the paper reports from its own data — it cites no other source for it, so there is none to check. The quote shows it is in the paper.
In the paper
“Excluding adjustment for testing date decreases the effect size by 12%, while including fixed effects increases it by 1.6% (school level) or 6.3% (family level).”
§ Learning loss due to school closures during the COVID-19 pandemic > Results > Specification Curve Analysis.
plaindirect- Asserted: passes — The authors put it forward as true.
- Checkable: passes — It can be checked against evidence.
- Load-bearing: unclear — It is unclear whether the paper’s conclusions depend on it.
- Based: passes — The paper gives a reason why it holds.
It may state two separate claims as one.
A result the paper reports from its own data — it cites no other source for it, so there is none to check. The quote shows it is in the paper.
In the paper
“We validate these benchmarks in our data by exploiting variation in testing dates during comparison years and show that test scores improve by 0.30 to 0.40 percentiles per week, equivalent to 0.31 to 0.41 SD annually ( SI Appendix, section 4.3).”
§ Learning loss due to school closures during the COVID-19 pandemic > Discussion
plaincorrelational- Asserted: passes — The authors put it forward as true.
- Checkable: passes — It can be checked against evidence.
- Load-bearing: passes — The paper’s conclusions depend on it.
- Based: passes — The paper gives a reason why it holds.
It may state two separate claims as one.
A result the paper reports from its own data — it cites no other source for it, so there is none to check. The quote shows it is in the paper.
In the paper
“Students lost on average 3.16 percentile points in the national distribution, equivalent to 0.08 standard deviations (SD) ( SI Appendix, section 4.3).”
§ Learning loss due to school closures during the COVID-19 pandemic > Results > Baseline Specification.
plaindirect- Asserted: passes — The authors put it forward as true.
- Checkable: passes — It can be checked against evidence.
- Load-bearing: passes — The paper’s conclusions depend on it.
- Based: passes — The paper gives a reason why it holds.
It may state two separate claims as one.
A result the paper reports from its own data — it cites no other source for it, so there is none to check. The quote shows it is in the paper.
In the paper
“In SI Appendix, Table S3, we show that the treatment sample is not skewed on sex, parental education, or prior performance.”
§ Learning loss due to school closures during the COVID-19 pandemic > Results > Adjusting for Loss to Follow-up.
plain- Asserted: passes — The authors put it forward as true.
- Checkable: passes — It can be checked against evidence.
- Load-bearing: passes — The paper’s conclusions depend on it.
- Based: passes — The paper gives a reason why it holds.
It may state two separate claims as one.
A result the paper reports from its own data — it cites no other source for it, so there is none to check. The quote shows it is in the paper.
In the paper
“This graph reveals a raw difference ranging from −0.76 percentiles in spelling to −2.15 percentiles in math.”
§ Learning loss due to school closures during the COVID-19 pandemic > Results
plain- Asserted: passes — The authors put it forward as true.
- Checkable: passes — It can be checked against evidence.
- Load-bearing: unclear — It is unclear whether the paper’s conclusions depend on it.
- Based: passes — The paper gives a reason why it holds.
The quote only partly states this claim.
A result the paper reports from its own data — it cites no other source for it, so there is none to check. The quote shows it is in the paper.
In the paper
“These losses are evident throughout the age range we study and across all of the three subject areas: math, spelling, and reading.”
§ Learning loss due to school closures during the COVID-19 pandemic > Discussion
plaincorrelational- Asserted: passes — The authors put it forward as true.
- Checkable: passes — It can be checked against evidence.
- Load-bearing: passes — The paper’s conclusions depend on it.
- Based: passes — The paper gives a reason why it holds.
It may state two separate claims as one.
A result the paper reports from its own data — it cites no other source for it, so there is none to check. The quote shows it is in the paper.
In the paper
“We also reestimate our main specification dropping comparison years one at a time ( SI Appendix, section 7.3). These results are estimated with less precision but otherwise in line with those of our main analysis.”
§ Learning loss due to school closures during the COVID-19 pandemic > Results > Placebo Analysis and Year Exclusions.
plain- Asserted: passes — The authors put it forward as true.
- Checkable: passes — It can be checked against evidence.
- Load-bearing: unclear — It is unclear whether the paper’s conclusions depend on it.
- Based: passes — The paper gives a reason why it holds.
It may state two separate claims as one.
The paper states this without a source or data behind it here, so there is nothing to check it against. The quote shows it is in the paper.
In the paper
“Our estimated treatment effect translates into 3.16/35 = 0.09 percentiles or 0.002 SD per school day and is thus on the lower end of that range.*”
§ Learning loss due to school closures during the COVID-19 pandemic > Discussion
plaindirect- Asserted: passes — The authors put it forward as true.
- Checkable: passes — It can be checked against evidence.
- Load-bearing: unclear — It is unclear whether the paper’s conclusions depend on it.
- Based: passes — The paper gives a reason why it holds.
It may state two separate claims as one.
In the paper
“These groups make up, respectively, 92, 4, and 4% of the student body and our sample ( SI Appendix, section 5.1).”
§ Learning loss due to school closures during the COVID-19 pandemic > Materials and Methods > Parental Education.
What the sources say
- Not matchedcites SI Appendix, section 5.1
Couldn’t be matched to a paper in Crossref, so it can’t be checked.
plain- Asserted: passes — The authors put it forward as true.
- Checkable: passes — It can be checked against evidence.
- Load-bearing: fails — The paper’s conclusions may not depend on it.
- Based: passes — The paper gives a reason why it holds.
Probably not a substantial claim. The paper’s conclusions may not depend on it. It may state two separate claims as one.
- Not matched
In the paper
“This literature reports reductions in achievement ranging from 0.001 to 0.010 SD per school day lost (10).”
§ Learning loss due to school closures during the COVID-19 pandemic > Discussion
What the sources say
- Not checked — no full text of the sourcecites [10] M. Kuhfeld, Projecting the potential impacts of COVID-19 school closures on academic achievement. Educ. Res. 49, 549– 565 (2020). source
plaindirect- Asserted: passes — The authors put it forward as true.
- Checkable: passes — It can be checked against evidence.
- Load-bearing: passes — The paper’s conclusions depend on it.
- Based: passes — The paper gives a reason why it holds.
Probably not a substantial claim.
A conclusion the paper draws from its own results — it cites no other source for it, so there is none to check. The quote shows it is in the paper.
In the paper
“Using the smaller benchmark, learning loss exceeds the period of school closures (3.16/0.30 = 10.5 wk), implying that students regressed during this time.”
§ Learning loss due to school closures during the COVID-19 pandemic > Discussion
plaindirect- Asserted: passes — The authors put it forward as true.
- Checkable: passes — It can be checked against evidence.
- Load-bearing: unclear — It is unclear whether the paper’s conclusions depend on it.
- Based: passes — The paper gives a reason why it holds.
It may state two separate claims as one.
A conclusion the paper draws from its own results — it cites no other source for it, so there is none to check. The quote shows it is in the paper.
In the paper
“Using the larger benchmark, a treatment effect of 3.16 percentiles would translate into 3.16/0.40 = 7.9 wk of lost learning—nearly exactly the same period that schools in The Netherlands remained closed.”
§ Learning loss due to school closures during the COVID-19 pandemic > Discussion
hedgeddirect- Asserted: passes — The authors put it forward as true.
- Checkable: passes — It can be checked against evidence.
- Load-bearing: unclear — It is unclear whether the paper’s conclusions depend on it.
- Based: passes — The paper gives a reason why it holds.
It may state two separate claims as one.
A conclusion the paper draws from its own results — it cites no other source for it, so there is none to check. The quote shows it is in the paper.
In the paper
“However, failure to adjust for pretreatment trends generates placebo estimates that are biased in a positive direction and is thus likely to underestimate treatment effects.”
§ Learning loss due to school closures during the COVID-19 pandemic > Results > Specification Curve Analysis.
hedgeddirect- Asserted: passes — The authors put it forward as true.
- Checkable: passes — It can be checked against evidence.
- Load-bearing: passes — The paper’s conclusions depend on it.
- Based: passes — The paper gives a reason why it holds.
It may state two separate claims as one.
What the paper did — it cites no source for this, so there is none to check. The quote shows it is in the paper.
In the paper
“Hypotheses and analysis protocols for this study were preregistered ( SI Appendix, section 4.1).”
§ Learning loss due to school closures during the COVID-19 pandemic > Study Setting
plain- Asserted: passes — The authors put it forward as true.
- Checkable: passes — It can be checked against evidence.
- Load-bearing: fails — The paper’s conclusions may not depend on it.
- Based: passes — The paper gives a reason why it holds.
Probably not a substantial claim. The paper’s conclusions may not depend on it.
None of the sources cited for this claim have been checked yet.
In the paper
“The Netherlands is interesting as a “best-case” scenario, with a short lockdown, equitable school funding, and world-leading rates of broadband access.”
- Also stated in: § Study Setting · hedged
“For these reasons, The Netherlands presents a “best-case” scenario, providing a likely lower bound on learning loss elsewhere in Europe and the world.”
§ Learning loss due to school closures during the COVID-19 pandemic > Abstract
What the sources say
- Not matchedcites [30] H. A. Patrinos, “ School choice in the Netherlands” (CESifo DICE Report 2/2011, ifo Institute for Economic Research, Munich, Germany, 2011).
Couldn’t be matched to a paper in Crossref, so it can’t be checked.
- Not checked — no full text of the sourcecites [31] H. F. Ladd, E. B. Fiske, Weighted student funding in The Netherlands: A model for the US? J. Pol. Anal. Manag. 30, 470– 498 (2011). source
- Not matchedcites [33] Statistics Netherlands (CBS), The Netherlands leads Europe in internet access. https://www.cbs.nl/en-gb/news/2018/05/the-Netherlands-leads-europe-in-internet-access. Accessed 9 February 2021.
Couldn’t be matched to a paper in Crossref, so it can’t be checked.
- Not matchedcites [34] G. Di Pietro, F. Biagi, P. Costa, Z. Karpinski, J. Mazza, The Likely Impact of COVID-19 on Education: Reflections Based on the Existing Literature and Recent International Datasets (Publications Office of the European Union, 2020).
Couldn’t be matched to a paper in Crossref, so it can’t be checked.
- Not matchedcites [36] Johns Hopkins Coronavirus Resource Center, COVID-19 case tracker. https://coronavirus.jhu.edu/data. Accessed 9 February 2021.
Couldn’t be matched to a paper in Crossref, so it can’t be checked.
- Not matchedcites [37] P. Tullis, Dutch cooperation made an ‘intelligent lockdown’ a success. Bloomberg Businessweek (4 June 2020).
Couldn’t be matched to a paper in Crossref, so it can’t be checked.
plaincorrelational- Asserted: passes — The authors put it forward as true.
- Checkable: passes — It can be checked against evidence.
- Load-bearing: passes — The paper’s conclusions depend on it.
- Based: passes — The paper gives a reason why it holds.
It may state two separate claims as one.
- Also stated in: § Study Setting · hedged
A conclusion the paper draws from its own results — it cites no other source for it, so there is none to check. The quote shows it is in the paper.
In the paper
“which would indicate that remote learning operated at 50% efficiency.”
§ Learning loss due to school closures during the COVID-19 pandemic > Discussion
hedgeddirect- Asserted: passes — The authors put it forward as true.
- Checkable: passes — It can be checked against evidence.
- Load-bearing: fails — The paper’s conclusions may not depend on it.
- Based: passes — The paper gives a reason why it holds.
Probably not a substantial claim. The paper’s conclusions may not depend on it.
What the paper did — it cites no source for this, so there is none to check. The quote shows it is in the paper.
In the paper
“In our baseline specification, we adjust for a linear trend in year and the time elapsed between testing dates and cluster standard errors at the school level.”
§ Learning loss due to school closures during the COVID-19 pandemic > Results
plain- Asserted: passes — The authors put it forward as true.
- Checkable: passes — It can be checked against evidence.
- Load-bearing: passes — The paper’s conclusions depend on it.
- Based: passes — The paper gives a reason why it holds.
Probably not a substantial claim. It may state two separate claims as one.
What the paper did — it cites no source for this, so there is none to check. The quote shows it is in the paper.
In the paper
“Moreover, we restrict analysis to schools where at least 75% of students took their tests after lockdown ( SI Appendix, section 7.5).”
§ Learning loss due to school closures during the COVID-19 pandemic > Results > Adjusting for Loss to Follow-up.
plain- Asserted: passes — The authors put it forward as true.
- Checkable: passes — It can be checked against evidence.
- Load-bearing: fails — The paper’s conclusions may not depend on it.
- Based: passes — The paper gives a reason why it holds.
Probably not a substantial claim. The paper’s conclusions may not depend on it.
A claim is checked only against the cited paper’s full text, never its abstract, and none is available for its sources.
In the paper
“Although early influential studies also found that summer is a time when socioeconomic learning gaps widen, this finding has failed to replicate in more recent studies (8, 9) or in European samples (48, 49).”
§ Learning loss due to school closures during the COVID-19 pandemic > Discussion
What the sources say
- Not checked — no full text of the sourcecites [8] P. T. von Hippel, C. Hamrock, Do test score gaps grow before, during, or between the school years?: Measurement artifacts and what we can know in spite of them. Soc. Sci. 6, 43 (2019). source
- Not checked — no full text of the sourcecites [9] M. Kuhfeld, Surprising new evidence on summer learning loss. Phi Delta Kappan 101, 25– 29 (2019). source
- Not checked — no full text of the sourcecites [48] P. Verachtert, J. Van Damme, P. Onghena, P. Ghesquière, A seasonal perspective on school effectiveness: Evidence from a Flemish longitudinal study in kindergarten and first grade. Sch. Effect. Sch. Improv. 20, 215– 233 (2009). source
- Not checked — no full text of the sourcecites [49] F. Meyer, K. Meissel, S. McNaughton, Patterns of literacy learning in German primary schools over the summer and the influence of home literacy practices. J. Res. Read. 40, 233– 253 (2017). source
plain- Asserted: passes — The authors put it forward as true.
- Checkable: passes — It can be checked against evidence.
- Load-bearing: unclear — It is unclear whether the paper’s conclusions depend on it.
- Based: passes — The paper gives a reason why it holds.
It may state two separate claims as one.
What the paper did — it cites no source for this, so there is none to check. The quote shows it is in the paper.
In the paper
“Our study represents one of the first attempts to quantify learning loss from COVID-19 using externally validated tests, a representative sample, and techniques that allow for causal inference.”
§ Learning loss due to school closures during the COVID-19 pandemic > Abstract
plain- Asserted: passes — The authors put it forward as true.
- Checkable: passes — It can be checked against evidence.
- Load-bearing: passes — The paper’s conclusions depend on it.
- Based: passes — The paper gives a reason why it holds.
It may state two separate claims as one.
In the paper
“The country is close to the Organization for Economic Cooperation and Development (OECD) average in school spending and reading performance, but among its top performers in math (32).”
§ Learning loss due to school closures during the COVID-19 pandemic > Study Setting
What the sources say
- Not matchedcites [32] A. Schleicher, PISA 2018: Insights and Interpretations (OECD Publishing, 2018).
Couldn’t be matched to a paper in Crossref, so it can’t be checked.
plain- Asserted: passes — The authors put it forward as true.
- Checkable: passes — It can be checked against evidence.
- Load-bearing: passes — The paper’s conclusions depend on it.
- Based: passes — The paper gives a reason why it holds.
It may state two separate claims as one.
- Not matched
A conclusion the paper draws from its own results — it cites no other source for it, so there is none to check. The quote shows it is in the paper.
In the paper
“The short duration of school closures gave students, educators, and parents little time to adapt.”
§ Learning loss due to school closures during the COVID-19 pandemic > Discussion
plaindirect- Asserted: passes — The authors put it forward as true.
- Checkable: passes — It can be checked against evidence.
- Load-bearing: fails — The paper’s conclusions may not depend on it.
- Based: passes — The paper gives a reason why it holds.
Probably not a substantial claim. The paper’s conclusions may not depend on it.
In the paper
“To identify the model components that exert the most influence on the magnitude of estimates we assessed more than 2,000 alternative models in a specification curve analysis (44) ( SI Appendix, section 7.13).”
§ Learning loss due to school closures during the COVID-19 pandemic > Results > Specification Curve Analysis.
What the sources say
- Not checked — no full text of the sourcecites [44] U. Simonsohn, J. P. Simmons, L. D. Nelson, Specification curve analysis. Nat. Hum. Behav. 4, 1208– 1214 (2020). 32719546 source
plain- Asserted: passes — The authors put it forward as true.
- Checkable: passes — It can be checked against evidence.
- Load-bearing: passes — The paper’s conclusions depend on it.
- Based: passes — The paper gives a reason why it holds.
Probably not a substantial claim.
A claim is checked only against the cited paper’s full text, never its abstract, and none is available for its sources.
In the paper
“Despite favorable conditions, survey evidence from lockdown indicates high levels of dissatisfaction with remote learning (38) and considerable disparities in help with schoolwork and learning resources (39).”
§ Learning loss due to school closures during the COVID-19 pandemic > Study Setting
What the sources say
- Not checked — no full text of the sourcecites [38] M. de Haas, R. Faber, M. Hamersma, How COVID-19 and the Dutch ‘intelligent lockdown’ changed activities, work and travel behaviour: Evidence from longitudinal data in the Netherlands. Transport. Res. Interdisciplinary Perspect. 6. 100150 (2020). PMC7284275 34171019 source
- Not checked — no full text of the sourcecites [39] T Bol, Inequality in homeschooling during the corona crisis in the Netherlands. First results from the LISS Panel. SocArXiv [Preprint] (2020). 10.31235/osf.io/hf32q (Accessed 9 February 2021). source
hedged- Asserted: passes — The authors put it forward as true.
- Checkable: passes — It can be checked against evidence.
- Load-bearing: passes — The paper’s conclusions depend on it.
- Based: passes — The paper gives a reason why it holds.
It may state two separate claims as one.
A conclusion the paper draws from its own results — it cites no other source for it, so there is none to check. The quote shows it is in the paper.
In the paper
“The high degree of school autonomy in The Netherlands is also likely to have created considerable variation in the pandemic response, possibly explaining the wide school-level variation in estimated learning loss ( SI Appendix, section 7.9).”
§ Learning loss due to school closures during the COVID-19 pandemic > Discussion
hedgedconditional- Asserted: passes — The authors put it forward as true.
- Checkable: passes — It can be checked against evidence.
- Load-bearing: unclear — It is unclear whether the paper’s conclusions depend on it.
- Based: passes — The paper gives a reason why it holds.
It may state two separate claims as one.
What the paper did — it cites no source for this, so there is none to check. The quote shows it is in the paper.
In the paper
“Our difference-in-differences design discards those students who did not take the tests, which might lead to bias if their performance trajectories differ from those we observe.”
§ Learning loss due to school closures during the COVID-19 pandemic > Results > Adjusting for Loss to Follow-up.
hedgedconditional- Asserted: passes — The authors put it forward as true.
- Checkable: passes — It can be checked against evidence.
- Load-bearing: passes — The paper’s conclusions depend on it.
- Based: passes — The paper gives a reason why it holds.
Probably not a substantial claim. It may state two separate claims as one.
In the paper
“Early estimates suggest that grades 3 to 8 students more than 6 mo into the pandemic underperformed by 7.5 percentile points in math but saw no loss in reading achievement (28).”
§ Learning loss due to school closures during the COVID-19 pandemic > Discussion
What the sources say
- Not matchedcites [28] M. Kuhfeld, B. Tarasawa, A. Johnson, E. Ruzek, K. Lewis, “ Learning during COVID-19: Initial findings on students’ reading and math achievement and growth” (NWEA Brief, Portland, OR, 2020).
Couldn’t be matched to a paper in Crossref, so it can’t be checked.
hedged- Asserted: passes — The authors put it forward as true.
- Checkable: passes — It can be checked against evidence.
- Load-bearing: unclear — It is unclear whether the paper’s conclusions depend on it.
- Based: passes — The paper gives a reason why it holds.
It may state two separate claims as one.
- Not matched
What the paper did — it cites no source for this, so there is none to check. The quote shows it is in the paper.
In the paper
“We do so using a difference-in-differences design ( SI Appendix, section 4.2) and address loss to follow-up using various techniques: regression adjustment, rebalancing on propensity scores and maximum-entropy weights, and fixed-effects designs that compare students within the same schools and families.”
§ Learning loss due to school closures during the COVID-19 pandemic > Study Setting
plain- Asserted: passes — The authors put it forward as true.
- Checkable: passes — It can be checked against evidence.
- Load-bearing: passes — The paper’s conclusions depend on it.
- Based: passes — The paper gives a reason why it holds.
Probably not a substantial claim. It may state two separate claims as one.
The paper states this without a source or data behind it here, so there is nothing to check it against. The quote shows it is in the paper.
In the paper
“Following school reopenings, tests were taken in person under normal conditions and with minimal social distancing.”
§ Learning loss due to school closures during the COVID-19 pandemic > Results > Knowledge Learned vs. Transitory Influences.
plain- Asserted: passes — The authors put it forward as true.
- Checkable: passes — It can be checked against evidence.
- Load-bearing: passes — The paper’s conclusions depend on it.
- Based: passes — The paper gives a reason why it holds.
Probably not a substantial claim.
A claim is checked only against the cited paper’s full text, never its abstract, and none is available for its sources.
In the paper
“Studies of school days lost due to other causes are mixed—some find durable effects and spillovers to adult earnings (59, 60), while others report a fadeout of effects over time (61, 62).”
§ Learning loss due to school closures during the COVID-19 pandemic > Discussion
What the sources say
- Not checked — no full text of the sourcecites [59] A. Ichino, R. Winter-Ebmer, The long-run educational cost of World War II. J. Labor Econ. 22, 57– 87 (2004). source
- Not checked — no full text of the sourcecites [60] D. Jaume, A. Willén, The long-run effects of teacher strikes: Evidence from Argentina. J. Labor Econ. 37, 1097– 1139 (2019). source
- Not checked — no full text of the sourcecites [61] S. Cattan, D. Kamhöfer, M. Karlsson, T. Nilsson “ The short- and long-term effects of student absence: Evidence from Sweden” (IZA Discussion Paper 10995, Institute of Labor Economics, Bonn, Germany, 2017). source
- Not checked — no full text of the sourcecites [62] B. Sacerdote, When the saints go marching out: Long-term outcomes for student evacuees from hurricanes Katrina and Rita. Am. Econ. J. Appl. Econ. 4, 109– 135 (2012). source
plaincorrelational- Asserted: passes — The authors put it forward as true.
- Checkable: passes — It can be checked against evidence.
- Load-bearing: unclear — It is unclear whether the paper’s conclusions depend on it.
- Based: passes — The paper gives a reason why it holds.
It may state two separate claims as one.
None of the sources cited for this claim could be matched to a paper in Crossref, so there is nothing to check it against.
In the paper
“School closures were short in comparative perspective ( SI Appendix, section 1), and the first wave of the pandemic had less of an impact than in other European countries (36, 37).”
§ Learning loss due to school closures during the COVID-19 pandemic > Study Setting
What the sources say
- Not matchedcites [36] Johns Hopkins Coronavirus Resource Center, COVID-19 case tracker. https://coronavirus.jhu.edu/data. Accessed 9 February 2021.
Couldn’t be matched to a paper in Crossref, so it can’t be checked.
- Not matchedcites [37] P. Tullis, Dutch cooperation made an ‘intelligent lockdown’ a success. Bloomberg Businessweek (4 June 2020).
Couldn’t be matched to a paper in Crossref, so it can’t be checked.
plain- Asserted: passes — The authors put it forward as true.
- Checkable: passes — It can be checked against evidence.
- Load-bearing: passes — The paper’s conclusions depend on it.
- Based: passes — The paper gives a reason why it holds.
It may state two separate claims as one.
- Not matched
A claim is checked only against the cited paper’s full text, never its abstract, and none is available for its sources.
In the paper
“Social distancing measures may have altered factors such as seating arrangements or indoor climate that in turn can influence student performance (41 –43).”
§ Learning loss due to school closures during the COVID-19 pandemic > Results > Knowledge Learned vs. Transitory Influences.
What the sources say
- Not checked — no full text of the sourcecites [41] M. J. Mendell, G. A. Heath, Do indoor pollutants and thermal conditions in schools influence student performance?: A critical review of the literature. Indoor Air 15, 27– 52 (2005). 15660567 source
- Not checked — no full text of the sourcecites [42] P. D. Marshall, M. Losonczy-Marshall, Classroom ecology: Relations between seating location, performance, and attendance. Psychol. Rep. 107, 567– 577 (2010). 21117484 source
- Not checked — no full text of the sourcecites [43] R. J. Park, J. Goodman, A. P. Behrer, Learning is inhibited by heat exposure, both internationally and within the United States. Nat. Hum. Behav. 5, 19– 27 (2020). 33020588 source
hedgedconditional- Asserted: passes — The authors put it forward as true.
- Checkable: passes — It can be checked against evidence.
- Load-bearing: fails — The paper’s conclusions may not depend on it.
- Based: passes — The paper gives a reason why it holds.
Probably not a substantial claim. The paper’s conclusions may not depend on it.
None of the sources cited for this claim could be matched to a paper in Crossref, so there is nothing to check it against.
In the paper
“No other country has higher rates of broadband penetration (33, 34), and efforts were made early in the pandemic to ensure access to home learning devices (35).”
§ Learning loss due to school closures during the COVID-19 pandemic > Study Setting
What the sources say
- Not matchedcites [33] Statistics Netherlands (CBS), The Netherlands leads Europe in internet access. https://www.cbs.nl/en-gb/news/2018/05/the-Netherlands-leads-europe-in-internet-access. Accessed 9 February 2021.
Couldn’t be matched to a paper in Crossref, so it can’t be checked.
- Not matchedcites [34] G. Di Pietro, F. Biagi, P. Costa, Z. Karpinski, J. Mazza, The Likely Impact of COVID-19 on Education: Reflections Based on the Existing Literature and Recent International Datasets (Publications Office of the European Union, 2020).
Couldn’t be matched to a paper in Crossref, so it can’t be checked.
- Not matchedcites [35] F. M. Reimers, A. Schleicher, A Framework to Guide an Education Response to the COVID-19 Pandemic of 2020 (OECD Publishing, 2020).
Couldn’t be matched to a paper in Crossref, so it can’t be checked.
plain- Asserted: passes — The authors put it forward as true.
- Checkable: passes — It can be checked against evidence.
- Load-bearing: passes — The paper’s conclusions depend on it.
- Based: passes — The paper gives a reason why it holds.
It may state two separate claims as one.
- Not matched
None of the sources cited for this claim have been checked yet.
In the paper
“The Dutch school system combines centralized and equitable school funding with a high degree of autonomy in school management (30, 31).”
§ Learning loss due to school closures during the COVID-19 pandemic > Study Setting
What the sources say
- Not matchedcites [30] H. A. Patrinos, “ School choice in the Netherlands” (CESifo DICE Report 2/2011, ifo Institute for Economic Research, Munich, Germany, 2011).
Couldn’t be matched to a paper in Crossref, so it can’t be checked.
- Not checked — no full text of the sourcecites [31] H. F. Ladd, E. B. Fiske, Weighted student funding in The Netherlands: A model for the US? J. Pol. Anal. Manag. 30, 470– 498 (2011). source
plain- Asserted: passes — The authors put it forward as true.
- Checkable: passes — It can be checked against evidence.
- Load-bearing: passes — The paper’s conclusions depend on it.
- Based: passes — The paper gives a reason why it holds.
It may state two separate claims as one.
- Not matched
What the paper did — it cites no source for this, so there is none to check. The quote shows it is in the paper.
In the paper
“Next, we balance treatment and control groups on a wider set of covariates, including at the school level, using maximum-entropy weights and the estimated propensity of treatment ( SI Appendix, section 7.4).”
§ Learning loss due to school closures during the COVID-19 pandemic > Results > Adjusting for Loss to Follow-up.
plain- Asserted: passes — The authors put it forward as true.
- Checkable: passes — It can be checked against evidence.
- Load-bearing: fails — The paper’s conclusions may not depend on it.
- Based: passes — The paper gives a reason why it holds.
Probably not a substantial claim. The paper’s conclusions may not depend on it.
What the paper did — it cites no source for this, so there is none to check. The quote shows it is in the paper.
In the paper
“This step reduces the size of our sample by approximately 60%, as not every student has a sibling attending a sampled school within the years that we are able to observe.”
§ Learning loss due to school closures during the COVID-19 pandemic > Materials and Methods > School and Family Fixed Effects.
plaindirect- Asserted: passes — The authors put it forward as true.
- Checkable: passes — It can be checked against evidence.
- Load-bearing: fails — The paper’s conclusions may not depend on it.
- Based: passes — The paper gives a reason why it holds.
Probably not a substantial claim. The paper’s conclusions may not depend on it.
A conclusion the paper draws from its own results — it cites no other source for it, so there is none to check. The quote shows it is in the paper.
In the paper
“We interpret it as a test of learning readiness.”
§ Learning loss due to school closures during the COVID-19 pandemic > Materials and Methods > Test Scores.
plain- Asserted: passes — The authors put it forward as true.
- Checkable: passes — It can be checked against evidence.
- Load-bearing: passes — The paper’s conclusions depend on it.
- Based: passes — The paper gives a reason why it holds.
Probably not a substantial claim.
In the paper
“The first one is the student monitoring system, which provides our test score data (40). This system comprises a series of mandatory tests that are taken twice a year throughout a child’s primary school education (ages 6 to 12 y).”
§ Learning loss due to school closures during the COVID-19 pandemic > Materials and Methods
What the sources say
- Not checked — no full text of the sourcecites [40] K. F. Vlug, Because every pupil counts: The success of the pupil monitoring system in The Netherlands. Educ. Inf. Technol. 2, 287– 306 (1997). source
plain- Asserted: passes — The authors put it forward as true.
- Checkable: passes — It can be checked against evidence.
- Load-bearing: passes — The paper’s conclusions depend on it.
- Based: passes — The paper gives a reason why it holds.
It may state two separate claims as one.
What the paper did — it cites no source for this, so there is none to check. The quote shows it is in the paper.
In the paper
“Throughout our analyses, we adjust confidence intervals for clustering on schools using robust standard errors.”
§ Learning loss due to school closures during the COVID-19 pandemic > Materials and Methods > Difference-in-Differences Analysis.
plain- Asserted: passes — The authors put it forward as true.
- Checkable: passes — It can be checked against evidence.
- Load-bearing: fails — The paper’s conclusions may not depend on it.
- Based: passes — The paper gives a reason why it holds.
Probably not a substantial claim. The paper’s conclusions may not depend on it.
In the paper
“Nationally standardized tests are taken across three main subjects: math, spelling, and reading ( SI Appendix, section 3.1).”
§ Learning loss due to school closures during the COVID-19 pandemic > Materials and Methods > Test Scores.
What the sources say
- Not matchedcites SI Appendix, section 3.1
Couldn’t be matched to a paper in Crossref, so it can’t be checked.
plainn = 3- Asserted: passes — The authors put it forward as true.
- Checkable: passes — It can be checked against evidence.
- Load-bearing: fails — The paper’s conclusions may not depend on it.
- Based: passes — The paper gives a reason why it holds.
Probably not a substantial claim. The paper’s conclusions may not depend on it.
- Not matched
In the paper
“The sample covers 15% of all primary schools and is broadly representative of the national student body ( SI Appendix, section 5.1).”
§ Learning loss due to school closures during the COVID-19 pandemic > Materials and Methods
What the sources say
- Not matchedcites SI Appendix, section 5.1
Couldn’t be matched to a paper in Crossref, so it can’t be checked.
plain- Asserted: passes — The authors put it forward as true.
- Checkable: passes — It can be checked against evidence.
- Load-bearing: passes — The paper’s conclusions depend on it.
- Based: passes — The paper gives a reason why it holds.
It may state two separate claims as one.
- Not matched
A conclusion the paper draws from its own results — it cites no other source for it, so there is none to check. The quote shows it is in the paper.
In the paper
“In the terminology of the test producer, its goal is to assess “technical reading ability”—likely a mix of reading ability, cognitive processing, and verbal fluency.”
§ Learning loss due to school closures during the COVID-19 pandemic > Materials and Methods > Test Scores.
hedged- Asserted: passes — The authors put it forward as true.
- Checkable: passes — It can be checked against evidence.
- Load-bearing: passes — The paper’s conclusions depend on it.
- Based: passes — The paper gives a reason why it holds.
Probably not a substantial claim.
The paper relies on this without support.
Students across The Netherlands take the same examination within a given year.
“Students across The Netherlands take the same examination within a given year.”
The paper relies on this without support.
The norm for transforming test results to percentile scores is the same across years, so absolute changes in performance over time are preserved.
“Test results are transformed to percentile scores, but the norm for transformation is the same across years so absolute changes in performance over time are preserved.”
The paper relies on this without support.
The oral reading fluency assessment does not test for the retention of curricular content.
“As this part of the assessment does not test for the retention of curricular content, we would expect it to be less affected by school closures, which is indeed what we find.”
The authors state this as an assumption.
Percentiles were drawn from an underlying normal distribution.
“Assuming that percentiles were drawn from an underlying normal distribution, we use the following formula to convert between one and the other: d=Φ−10.50+δ100, [3] where δ is the treatment effect on the percentile scale, and Φ−1 is the inverse cumulative standard normal distribution.”
The paper relies on this without support.
In the absence of the pandemic, the rate of progress in 2020 would have followed the same trend as in prior years.
“We analyze the rate of progress in 2020 to that in previous years using a difference-in-differences design.”
The paper relies on this without support.
Comprehension of the words is not needed and students and parents are discouraged to prepare for the oral reading fluency test.
“Crucially, comprehension of the words is not needed and students and parents are discouraged to prepare for it.”
The paper relies on this without support.
The test producer's translation keys are based on smaller samples than the study's sample.
“However, as these keys are actually based on smaller samples than that at our disposal, we further impose a uniform distribution in our sample within cells defined by subject, grade, and testing occasion: midyear vs. end of year.”
Claims other papers make about this one
Each is checked against this paper’s own text: does it say what the citing paper says it does?
The source backs part of the claim, not all of it — or backs it for a different population, condition or comparison.
In the citing paper
“School attendance is foundational to young people’s educational attainment, social development, and future life opportunities (Engzell et al., 2021; McDonald et al., 2022).”
From Beyond the Classroom: Strengthening Pupil Engagement, Attendance and Belonging through Alternative Education and Community Partnerships (2025) · cites this paper as Engzell et al., 2021
Experimental — accuracy not yet measuredThe source backs part of the claim, not all of it — or backs it for a different population, condition or comparison.
In the citing paper
“The impact is 40 percent larger among those in the least educated homes, suggesting that the pandemic not only increased educational inequality, but that disadvantaged children's skills actually deteriorated.”
From Educational Inequality* (2022) · cites this paper as Engzell, Frey, and Verhagen (2021)
Experimental — accuracy not yet measuredThe source backs part of the claim, not all of it — or backs it for a different population, condition or comparison.
In the citing paper
“Results from Engzell, Frey, and Verhagen (2021) for an eight-week school closure imply that this gap would further increase by around 0.05 of a standard deviation.”
From Educational Inequality* (2022) · cites this paper as Engzell, Frey, and Verhagen (2021)
Experimental — accuracy not yet measuredThe cited source says what the claim attributes to it.
In the citing paper
“Engzell, Frey, and Verhagen (2021) find that in the Netherlands, eight weeks of online rather than in-person learning led to 0.08 of a standard deviation lower test scores for students aged eight to eleven.”
From Educational Inequality* (2022) · cites this paper as Engzell, Frey, and Verhagen (2021)
The cited source says what the claim attributes to it.
In the citing paper
“However, the learning loss was up to 60% greater among students from disadvantaged backgrounds (i.e., students from less-educated households), indicating the disproportionate impact of the pandemic on student learning.”
From Impacts of the COVID-19 Pandemic on Student Learning and Opportunity Gaps Across the 2020–2021 School Year: A National Survey of Teachers (2022) · cites this paper as Engzell et al. (2021)
The cited source says what the claim attributes to it.
In the citing paper
“Several studies have demonstrated that student achievement has been lower during the pandemic compared to prior to the pandemic, with estimates ranging from three percentile points in the Netherlands (Engzell et al., 2021) to more than half of a school year in the U.S. state of Illinois (Streich et al., 2021).”
From Impacts of the COVID-19 Pandemic on Student Learning and Opportunity Gaps Across the 2020–2021 School Year: A National Survey of Teachers (2022) · cites this paper as Engzell et al., 2021
The cited source says what the claim attributes to it.
In the citing paper
“Results indicated a learning loss equivalent to 3 percentile points despite the relatively short lockdown.”
From Impacts of the COVID-19 Pandemic on Student Learning and Opportunity Gaps Across the 2020–2021 School Year: A National Survey of Teachers (2022) · cites this paper as Engzell et al. (2021)
In the citing paper
“The authors also noted that access to technology alone is not enough to guarantee quality distance learning [6] (p. 11).”
From Effects of Pandemic-Related School Closures on Pupils’ Performance and Learning in Selected Countries: A Rapid Review (2021) · cites this paper as [6]
In the citing paper
“Overall, a learning loss of 3 percentile points or 0.08 standard deviations was determined, whereby the losses in the case of pupils from less educated parents turned out to be 60% greater [6] (p. 1).”
From Effects of Pandemic-Related School Closures on Pupils’ Performance and Learning in Selected Countries: A Rapid Review (2021) · cites this paper as [6]
In the citing paper
“Engzell et al. [6] found that the time-measured learning loss in relation to the progress that would be achieved in a normal school year corresponds to a period of 7.9 to 10.5 weeks of non-learning [6] (p. 10).”
From Effects of Pandemic-Related School Closures on Pupils’ Performance and Learning in Selected Countries: A Rapid Review (2021) · cites this paper as [6]
In the citing paper
“With a sample size of n = 286,515, a significant difference in mean values was found when comparing the control group and the test group.The group of pupils that was tested after the school closures showed significantly worse test values than a comparison group that did not experience any school closures [6] (p. 85).”
From Effects of Pandemic-Related School Closures on Pupils’ Performance and Learning in Selected Countries: A Rapid Review (2021) · cites this paper as [6]
In the citing paper
“Engzell and colleagues quantified the learning loss, taking into account all the differences measured by them, with an overall negative effect of -0.08 standard deviations [6] (p. 1).”
From Effects of Pandemic-Related School Closures on Pupils’ Performance and Learning in Selected Countries: A Rapid Review (2021) · cites this paper as [6]
In the citing paper
“The test values of the group of pupils that were tested after the school closures (test group, M = -1.28,SD = 11.83), were on average significantly lower than those of the comparison group (control group, M = 0.28, SD = 10.99) that had not experienced any school closures [6] (p. 85).”
From Effects of Pandemic-Related School Closures on Pupils’ Performance and Learning in Selected Countries: A Rapid Review (2021) · cites this paper as [6]
In the citing paper
“Also, with regard to the area of spelling, a significantly lower test mean value was reported for the test group (M = 0.71, SD = 17.07, n = 58,627) compared to the control group (M = 0.05, SD = 17.27, n = 284,499) (p.85).”
From Effects of Pandemic-Related School Closures on Pupils’ Performance and Learning in Selected Countries: A Rapid Review (2021) · cites this paper as [6]
In the citing paper
“As pointed out by Engzell et al. (2021), non-causal methods fail to account for trends in student progress prior to the outbreak of Covid-19 and, hence, by assuming a counterfactual where achievement has stayed flat, they generate estimates of learning deficits that are biased downwards.”
From The impact of Covid-19 on student achievement: Evidence from a recent meta-analysis (2023) · cites this paper as Engzell et al. (2021)
In the citing paper
“there is a large consensus that it did not affect students equally.”
From The impact of Covid-19 on student achievement: Evidence from a recent meta-analysis (2023) · cites this paper as Engzell et al., 2021
In the citing paper
“several studies (see, for example, Engzell et al., 2021; Hevia et al., 2022) showed that Covid-19 had a detrimental effect especially on the achievement of students from less advantaged backgrounds.”
From The impact of Covid-19 on student achievement: Evidence from a recent meta-analysis (2023) · cites this paper as Engzell et al., 2021
In the citing paper
“The pandemic has also interrupted education and has adversely affected children’s social and emotional development and mental health.16-19”
From Evaluation of the BNT162b2 Covid-19 Vaccine in Children 5 to 11 Years of Age (2022) · cites this paper as [17]
In the citing paper
“Covid-19–associated school closures and quarantines also have social and economic costs for families and caregivers.16-19”
From Evaluation of the BNT162b2 Covid-19 Vaccine in Children 5 to 11 Years of Age (2022) · cites this paper as [17]
Citations
Cites
Statistical power analysis for the behavioral sciences
Cohen, J. (1990) · Computers Environment and Urban Systems · doi:10.1016/0198-9715(90)90050-4 · Cited by 65,417
The central role of the propensity score in observational studies for causal effects
ROSENBAUM, P. R., & RUBIN, D. B. (1983) · Biometrika · doi:10.1093/biomet/70.1.41 · Cited by 31,241
(2001) · RePEc: Research Papers in Economics · Cited by 27,577
Statistical Power Analysis for the Behavioral Sciences
Cohen, J. (2013) · doi:10.4324/9780203771587 · Cited by 25,373
The Psychological Impact of Quarantine and How to Reduce It: Rapid Review of the Evidence
Brooks, S. K., Webster, R. K., Smith, L. E., Woodland, L., Wessely, S., Greenberg, N., & Rubin, G. J. (2020) · doi:10.2139/ssrn.3532534 · Cited by 16,394
The psychological impact of quarantine and how to reduce it: Rapid review of the evidence
Brooks, S. K., Webster, R. K., Smith, L. E., Woodland, L., Wessely, S., Greenberg, N., & Rubin, G. J. (2020) · The Lancet · doi:10.1016/s0140-6736(20)30460-8 · Cited by 16,378
Multilevel analysis : an introduction to basic and advanced multilevel modeling
Snijders, T. A. B., & Bosker, R. (1999) · Cited by 6,830
Hainmueller, J. (2012) · Political Analysis · doi:10.1093/pan/mpr025 · Cited by 6,026
Recent Developments in the Econometrics of Program Evaluation
Imbens, G. W., & Wooldridge, J. M. (2009) · Journal of Economic Literature · doi:10.1257/jel.47.1.5 · Cited by 4,926
Viner, R. M., Russell, S. J., Croker, H., Packer, J., Ward, J., Stansfield, C., Mytton, O., Bonell, C., & Booy, R. (2020) · The Lancet Child & Adolescent Health · doi:10.1016/s2352-4642(20)30095-x · Cited by 2,213
Cited by
Sorted by citations
Items 501–600 of 1,570
The impact of personality type on online learning performance among high school students
Wang, Y., Yu, R., Wu, X., Chen, Z., & Huang, Y. (2024) · Education and Information Technologies · doi:10.1007/s10639-024-13161-5 · Cited by 6
“Engzell et al. (2021) evaluated the impact of school closures on primary school students in the Netherlands using a substantial data-set ( N ≈ 350,000) and found that the academic loss was approximately 3% points, equivalent to one-fifth of a school year (i.e., 8 weeks) of learning.”
Implications of COVID-19 Mitigation Policies for National Well-Being: A Systems Perspective
Strelkovskii, N. V., Rovenskaya, E., Ilmola‐Sheppard, L., Bartmann, R., Rein‐Sapir, Y., & Feitelson, E. I. (2021) · Sustainability · doi:10.3390/su14010433 · Cited by 6
Prior home learning environment is associated with adaptation to homeschooling during COVID lockdown
Girard, C., & Prado, J. (2022) · Heliyon · doi:10.1016/j.heliyon.2022.e09294 · Cited by 6
“In a large-scale study of Dutch school children, Engzell et al. (2021) found lockdown-related learning losses that were larger in children whose parents were less educated.”
Nurrachmawati, A., Permana, L., & Agustini, R. T. (2021) · JATI EMAS (Jurnal Aplikasi Teknik dan Pengabdian Masyarakat) · doi:10.36339/je.v5i3.486 · Cited by 6
Schreiner, C., Kraler, C., Berger, F., Hagleitner, W., Jesacher-Rößler, L., & Roßnagl, S. (2022) · Zeitschrift für Bildungsforschung · doi:10.1007/s35834-022-00352-8 · Cited by 6
“…anderen Ländern Lernverluste durch die Schulschließungen, die insbesondere für benachteiligte bzw. leistungsschwache Schüler*innen umfangreich ausfielen (Blainey et al. 2020 für England; Engzell et al. 2021 für die Niederlande; Maldonado und De Witte 2021 für Belgien; jeweils für die Primarstufe).”
BackgroundDeho, O. B., Liu, L., Joksimovíc, S., Li, J., Zhan, C., & Liu, J. (2022) · International Conference on Information Technology for Social Good (GoodIT) · doi:10.1145/3524458.3547232 · Cited by 5
“Furthermore, similar to [6, 7], our study is based on causal inference.”
BackgroundMethodResultInfluentialRollett, W., Leitgeb, T., & Scharenberg, K. (2022) · Zeitschrift für Bildungsforschung · doi:10.1007/s35834-022-00358-2 · Cited by 7
“…die für die Entwicklung von Schulleistungen bekannten herkunftsbedingten Schereneffekte während der Corona-Pandemie ausgeweitet haben (Blainey und Hannay 2020; Engzell et al. 2021; Juniper Education 2021; Kogan und Lavertu 2021; Kuhfeld et al. 2020; Maldonado und de Witte 2020; Pier et al. 2021).”
BackgroundRamadhan, M. A., & Daryati, D. (2022) · AIP conference proceedings · doi:10.1063/5.0094284 · Cited by 6
Examining the Learning Losses of Students in the Covid-19 Process According to Teachers’ Opinions
Demir, F., Özdaş, F., & ÇAKMAK, M. (2022) · International Journal of Psychology and Educational Studies · doi:10.52380/ijpes.2022.9.4.978 · Cited by 8
“In their study Engzell, Frey, and Verhagen (2021) stated that students who learn at home make little progress and that long school closures in countries with weaker infrastructure lead to greater learning losses.”
BackgroundHaris, A., Sentaya, I. M., & Sulindra, I. G. M. (2022) · Jurnal Ilmiah Mandala Education · doi:10.58258/jime.v8i1.2756 · Cited by 6
Panel data evidence on the effects of the COVID-19 pandemic on livelihoods in urban Côte d’Ivoire
Pascaline Dupas, Y., Marcel Fafchamps, A., & Lestant, E. (2023) · PLoS ONE · doi:10.1371/journal.pone.0277559 · Cited by 6
“Shutting down schools were anticipated to lead to school drop-outs and a serious loss of learning among schoolchildren [11], even in well-resourced environments [12].”
BackgroundGans, N. E., Zohery, V., Jaffe, J. B., Ahmed, A., Kim, L., & Lombardi, D. (2023) · Journal of Science Education and Technology · doi:10.1007/s10956-023-10046-z · Cited by 8
“However, what is novel about the present study is the context of the COVID-19 pandemic, which greatly impacted students’ formal learning settings because of social isolation, including distancing and quarantining (Engzell et al., 2021).”
Reduced in-person learning in COVID-19 widens student achievement gaps in schools
Shin, C., An, Y., & Oh, S.-Y. (2023) · Asia Pacific Education Review · doi:10.1007/s12564-023-09862-0 · Cited by 10
“The majority of empirical research has found that COVID-19 school closures increased achievement gaps, in particular between underprivileged students and their more privileged classmates in terms of socioeconomic status, race and ethnicity, and region (e.g., Cai et al., 2020; Davis et al., 2020; Engzell et al., 2021;…”
Real time monitoring of COVID-19 intervention effectiveness through contact tracing data
Gibson, G., Woody, S., James, E. R., Weldon, M., Fox, S. J., Ancel, L. W., & Bhavnani, D. (2023) · Scientific Reports · doi:10.1038/s41598-023-35892-0 · Cited by 5
In-Person Instruction and Educational Outcomes of K–8 Students During the COVID-19 Pandemic
Uthappa, D. M., Pak, J., McGann, K. A., Brookhart, M. A., McKinzie, K., Abdelbarr, M., Cockrell, J., Hickerson, J., Armstrong, S., D’Agostino, E. M., et al. (2023) · Pediatrics · doi:10.1542/peds.2022-060352l · Cited by 6
Learning Loss and Recovery from the COVID-19 Pandemic: A Systematic Review of Evidence
Cruz, N. A. D., Adona, A. J., Molato-Gayares, R., & Park, A. F. (2024) · doi:10.22617/wps240093-2 · Cited by 7
Making space for play in the global post-COVID landscape
Alwani, S. E., Day, N., & Kulkarni, K. (2024) · International Journal of Play · doi:10.1080/21594937.2024.2323411 · Cited by 7
“Resulting use of the term has primarily emphasised academic achievement (see coverage by Ardington et al., 2021; Kaffenberger, 2021; Singh et al., 2022), setting the expectation that children need to ‘catch up’ on schoolwork, leaving less room for play (Engzell et al., 2021).”
BackgroundAsakawa, S., Ohtake, F., & Sano, S. (2024) · Review of Economics of the Household · doi:10.1007/s11150-024-09715-8 · Cited by 10
“However, in New South Wales (Australia), the test was administered for the fi rst time 6 – 8 months after school closures (Asakawa & Ohtake, 2022; Engzell et al., 2021; Gambi & De Witte, 2021; Gore et al., 2021; Haelermans et al., 2022; Maldonado and De Witte, 2022).”
Developmental Losses in Young Children from Preprimary Program Closures during the COVID-19 Pandemic
Abufhele, A., Bravo, D., Bóo, F. L., & Soto‐Ramírez, P. (2024) · Comparative Education Review · doi:10.1086/731588 · Cited by 22
Hubungan antara Learning Loss dan Motivasi Belajar Mahasiswa pada Proses Pembelajaran Jarak Jauh
Wicaksono, K. P. (2022) · Bioma Jurnal Biologi dan Pembelajaran Biologi · doi:10.32528/bioma.v7i1.7405 · Cited by 6
Oducado, R. M., Cleofas, J. V., & Soriano, G. P. (2022) · Nursing Forum · doi:10.1111/nuf.12732 · Cited by 6
Swindell, A., & Wright, J. (2022) · Globalisation, comparative education and policy research · doi:10.1007/978-3-030-90590-3_3 · Cited by 6
A breach in the social contract: Limited participation and limited evidence in COVID‐19 responses
Rangel, J. C., Crath, R., & Renade, S. (2022) · Journal of Evaluation in Clinical Practice · doi:10.1111/jep.13775 · Cited by 5
Zheng, C., Yu, Y., Lu, J., Hou, Y., & Li, K. (2022) · Early Education and Development · doi:10.1080/10409289.2022.2146386 · Cited by 6
“In addition, because of lacking self-control and a healthy learning environment, many students were faced with unclear learning goals, low resilience, diminished involvement, and inattentiveness (Engzell et al., 2021; Montoya & Gustafsson, 2021).”
BackgroundResultInsights from a Catholic school’s transition to distance learning during Covid-19
Wright, S., Park, Y. S., & Saadé, A. (2022) · Open Learning The Journal of Open Distance and e-Learning · doi:10.1080/02680513.2022.2152667 · Cited by 11
“Learning losses due to school closures are up to 60% higher for students with less-educated parents (Engzell et al., 2021).”
BackgroundLee, H., & Han, B. (2021) · medRxiv · doi:10.1101/2021.08.12.21261943 · Cited by 6
“This suggest that when targeting side effects of school closure, other outcomes such as academic achievement and learning are likely to have higher priority than health-related outcomes as suggested by a previous study(23).”
ResultGrit and Academic Resilience During the Covid-19 PandemicPreprint
Chen, D., Ertaç, S., Evgeniou, T., et al. (2023) · Research Square · doi:10.21203/rs.3.rs-2872593/v1 · Cited by 6
Ngo, G. R., Engay, D., Gaw, J. L., Kho, G. M. D., Lagamon, L., Sonaco, K. R., Salamante, L. M., & Trinidad, J. E. (2023) · SocArXiv (OSF Preprints) · doi:10.31235/osf.io/mbgsy · Cited by 6
Preparing teachers to deliver hybrid education: a framework for Latin America and the Caribbean
Villegas-Reimers, E., Pogré, P., Freire, S. M., & Näslund-Hadley, E. I. (2023) · doi:10.18235/0005008 · Cited by 11
COVID-19 Crisis, Economic Hardships, and Schooling Outcomes
Gehrke, E., Lenel, F., & Schupp, C. (2022) · Education Finance and Policy · doi:10.1162/edfp_a_00378 · Cited by 8
“Engzell et al. (2021) estimate substantial learning losses among primary school children after a short school closure (eight weeks) in the Netherlands, with students from low-income backgrounds and with lower initial performance having experienced the largest learning losses.”
BackgroundSaliva-STAT: Sample-to-answer saliva test for COVID-19
Boegner, D. J., Rzasa, J. R., Benke, E. H., & White, I. M. (2024) · Sensors and Actuators B Chemical · doi:10.1016/j.snb.2024.136510 · Cited by 5
The importance of schools in driving children’s applications for disability benefits
Levere, M., Hemmeter, J., & Wittenburg, D. (2024) · Journal of Public Economics · doi:10.1016/j.jpubeco.2024.105239 · Cited by 5
van de Werfhorst, H. G., Zwier, D., Geven, S., Bol, T., & Haelermans, C. (2024) · npj Science of Learning · doi:10.1038/s41539-024-00283-1 · Cited by 5
Online assessment in young children: Challenges and considerations
McBride, C. A., Ho, J. C., McQuade, M., Ngan, V. S. H., Ng, M. C. Y., Cheah, Z. R. E., & Maurer, U. (2024) · PsyCh Journal · doi:10.1002/pchj.805 · Cited by 5
“There are numerous reports on the fallout from students transitioning to online schooling (Bennett, 2023; Dorn et al., 2021; Engzell et al., 2021), with most arguing that face-to-face schooling is much better than online schooling, at least for young children (Chen et al., 2021; Dong et al., 2020).”
Intelligent Tutoring Systems Need Teachers
Bardach, L., Moeller, K., Ruiz-García, M., Strittmatter, Y., Meyer, J., Musslick, S., & Spitzer, M. (2025) · Journal of Computer Assisted Learning · doi:10.1002/jcal.70159 · Cited by 15
Orbach, L., Fritz, A., Haase, V. G., Dowker, A., & Räsänen, P. (2023) · Frontiers in Education · doi:10.3389/feduc.2023.1083074 · Cited by 15
“Although it is still unclear how the suspension of face-to-face teaching in schools impacted children’s academic skills and achievement in detail, research raises serious concerns about its social, economic, and public health consequences for society (Kuhfeld et al., 2020; Lee, 2020; Engzell et al., 2021; Psacharopoul…”
BackgroundLearning During Stressful Situations: Optimizing Evidence-based Learning Strategies
de la Pena, I. C., & Pan, M. C. (2021) · The Journal of Adventist Education · doi:10.55668/fate6233 · Cited by 4
Voltmer, K., Hondrich, F., & von Salisch, M. (2023) · Scientific Reports · doi:10.1038/s41598-023-49354-0 · Cited by 7
“…highest educational attainment which was assessed on a scale of 1–7 (no degree [1], secondary school degree (lower track) [2], secondary school degree (middle track) [3], high school diploma [4], apprenticeship [5], technical college [6], university degree [7]) which they had self-reported.”
BackgroundCOVID-19 learning loss and recovery in Brazil: Assessing gaps across social groups
Miranda, E. D. M., & Baum, D. R. (2024) · Education Policy Analysis Archives · doi:10.14507/epaa.32.8082 · Cited by 10
Baty, J. J., & Bruns, H. A. (2024) · ImmunoHorizons · doi:10.4049/immunohorizons.2300073 · Cited by 5
Prihartono, I., Guo, X., Tariq, A., & Collins, M. E. (2024) · Social Sciences & Humanities Open · doi:10.1016/j.ssaho.2024.100871 · Cited by 5
The impact of COVID-19 school disruptions on children’s learning
Blackwell, C. K., Mansolf, M. A., Deoni, S., Ganiban, J. M., Leve, L. D., Margolis, A. E., McGrath, M., Nozadi, S. S., O’Shea, T. M., Sherlock, P., et al. (2024) · Frontiers in Education · doi:10.3389/feduc.2024.1295910 · Cited by 7
“…higher proportions of low-SES students experienced little or no academic progress during pandemic-related school disruptions, replicating work by Engzell et al. (2021) who showed Dutch students, particularly those from lower SES households, made no gains on standard exams following COVID-19…”
BackgroundA perspective overview of the influence of the COVID-19 pandemic on the educational sector
Ukhurebor, K. E., Edetalehn, O. I., Wada, Z. B., Jokthan, G. E., Inegbedion, J. O., Ofulue, C., Efanodor-Obeten, H. O., Otsupius, A. I., Tanglang, N., Mai-inji, A. Y., et al. (2024) · Journal of Infrastructure Policy and Development · doi:10.24294/jipd.v8i5.2955 · Cited by 5
“The closing of education centres in over 186 nations has an impact on 98.50% of the world’s students, according to UNICEF as adapted from Engzell et al. (2021).”
BackgroundInfluentialNiki, M. (2024) · Japan and the World Economy · doi:10.1016/j.japwor.2024.101254 · Cited by 5
The lasting impacts of remote learning in the absence of remedial policies: Evidence from Brazil
Lichand, G., & Dória, C. A. (2024) · Proceedings of the National Academy of Sciences · doi:10.1073/pnas.2316300121 · Cited by 15
Ronconi, A., Altoè, G., & Masón, L. (2024) · Learning and Individual Differences · doi:10.1016/j.lindif.2024.102604 · Cited by 17
Ragonnet, R. R., Hughes, A. E., Shipman, D. S., Meehan, M. T., Henderson, A. S., Briffoteaux, G., Melab, N., Tuyttens, D., McBryde, E. S., & Trauer, J. M. (2025) · PLoS Medicine · doi:10.1371/journal.pmed.1004512 · Cited by 7
A Precision Agriculture Technology Course for Regions with Lower Technology Adoption Levels
Mathanker, S. K. (2021) · Applied Engineering in Agriculture · doi:10.13031/aea.14669 · Cited by 5
The Government Support in Distance Education: Case of Bahrain
Alhalwachi, L., Karam, A., & Hamdan, A. (2022) · Studies in computational intelligence · doi:10.1007/978-3-030-93921-2_32 · Cited by 5
Haris, A., Sentaya, I. M., & Sulindra, I. G. M. (2022) · Jurnal Ilmiah Mandala Education · doi:10.36312/jime.v8i1.2756 · Cited by 5
“, (2021) menyatakan bahwa peserta didik mengalami sedikit bahkan tidak ada kemajuan saat blajar di rumah dan menunjukkan kerugian yang lebih besar di negara dengan infrastruktur yang lebih lemah atas penutupan sekolah yang lebih lama[18].”
BackgroundPandemi dönemi acil uzaktan eğitim uygulamalarında K12 düzeyinde öğrenme kayıplarının incelenmesi
ÖZGÜRDEN, S., & Okur, M. R. (2022) · Açıköğretim Uygulamaları ve Araştırmaları Dergisi · doi:10.51948/auad.1092674 · Cited by 5
Klerk, E. D. D., Palmer, J. M., & Modise, M. A. (2022) · International Journal of Learning Teaching and Educational Research · doi:10.26803/ijlter.21.7.1 · Cited by 4
Investigation of Reading Skill Development of Primary School Students in the Covid 19 Process
BAŞ, Ö., Sirem, Ö., Akyol, H., & Gök, B. (2022) · Reading & Writing Quarterly · doi:10.1080/10573569.2022.2103055 · Cited by 7
“(2) Children living in disadvantaged homes are more adversely affected (Engzell et al., 2021).”
BackgroundFactors Affecting the Student Performance during the COVID-19 Pandemic
Li, L. (2022) · Open Journal of Social Sciences · doi:10.4236/jss.2022.107032 · Cited by 6
Espejo‐Siles, R., Zych, I., & Llorent, V. J. (2022) · Psychology Society & Education · doi:10.21071/psye.v14i2.14574 · Cited by 5
“Academic performance in students is affected by inequalities in educational requirements (Ogbu & Simons, 1998), and online education during the pandemic could increase this gap (Engzell et al., 2021).”
BackgroundKhalil, I. (2022) · Education 3-13 · doi:10.1080/03004279.2022.2108873 · Cited by 5
“…di ff erence of losses among students, including the educational level of the family, the student ’ s age and grade level, student interaction, the di ffi culty of teaching some lessons remotely, and teaching time (Engzell, Frey, and Verhagen 2021; Fuchs-Schündeln et al. 2020; Yohannes et al. 2021).”
BackgroundSusanto, S. (2022) · Script Journal Journal of Linguistic and English Teaching · doi:10.24903/sj.v7i01.1076 · Cited by 8
Ma, G., Zhang, J., & Liu, H. (2022) · Youth & Society · doi:10.1177/0044118x221138607 · Cited by 8
“Engzell et al. (2021), using about 350,000 samples in Netherland, found that students made little, or no progress when they learned from home.”
BackgroundPersistence of Lockdown Consequences on Children: A Cross-sectional Comparative Study
Picca, M., Manzoni, P., Corsello, A., Ferri, P. M., Bove, C. M., Braga, P., Mariani, D., Marinello, R., Mezzopane, A., Senaldi, S., et al. (2022) · Children · doi:10.3390/children9121927 · Cited by 5
Writing about the significance of historical agents: the effects of reading and writing instruction
van Driel, J., van Driel, J., & van Boxtel, C. (2022) · Reading and Writing · doi:10.1007/s11145-022-10404-0 · Cited by 10
“It is reasonable to believe that the lockdown may have had a negative impact on the learning outcomes (Engzell et al., 2021).”
Schweiger, G. (2023) · Studies in Philosophy and Education · doi:10.1007/s11217-022-09860-6 · Cited by 6
“For policymakers, two issues were at the forefront: first, the fear that educational loss would occur, which it did (Engzell et al. 2021).”
BackgroundCOVID‐19 and Long‐Term Economic Growth
Hao, J., Gregg, H., & Yao, Y. (2023) · Australian Economic Review · doi:10.1111/1467-8462.12500 · Cited by 7
The role of social institutions in community resilience following extreme natural hazard events
Hassan, E. M., Mahmoud, H. N., & Ellingwood, B. R. (2023) · Disaster Prevention and Resilience · doi:10.20517/dpr.2023.01 · Cited by 6
Children’s centres, parenting, and education in a post-pandemic world
Baker, W., & Bakopoulou, I. (2023) · Education 3-13 · doi:10.1080/03004279.2023.2186967 · Cited by 5
“Secondly, disruption to early years education may threaten children ’ s prospects for social mobility and further entrench educational inequalities (Engzell, Frey, and Verhagen 2021).”
BackgroundLéger‐Goodes, T., Malboeuf‐Hurtubise, C., Herba, C. M., Taylor, G., Mageau, G. A., Chadi, N., & Lefrançois, D. (2023) · Mental Health Science · doi:10.1002/mhs2.17 · Cited by 6
Learning Losses and Dropouts: The Heavy Cost COVID-19 Imposed on School-Age Children
Sabarwal, S., Chang, A. Y., Angrist, N., & D’Souza, R. (2023) · World Bank, Washington, DC eBooks · doi:10.1596/978-1-4648-1901-8_ch3 · Cited by 5
Hairol, M. I., Ahmad, M., Zihni, M. A. M., Saidon, N. F. S., Nordin, N., & Kadar, M. (2023) · Children · doi:10.3390/children10060930 · Cited by 6
“Online and home-schooling implemented during the COVID-19 pandemic became more difficult and less attainable, particularly for those who were vulnerable, such as children of undocumented migrants [62], younger children [66], and those with low socioeconomic backgrounds [15,67].”
BackgroundBamboo Woven Websites for Elementary School Students through Social Collaborative Learning Approach
Purbasari, I. (2023) · Journal of Advanced Research in Applied Sciences and Engineering Technology · doi:10.37934/araset.31.1.315325 · Cited by 5
“Learning during the pandemic resulted in the decline in 60% of the children's knowledge [8].”
BackgroundINVESTIGATING THE IMPLEMENTATION OF GAMIFICATION APPROACH TO ENHANCE STUDENTS LEARNING ENGAGEMENT
Kang, S. P., & Recard, M. (2023) · Journey Journal of English Language and Pedagogy · doi:10.33503/journey.v6i2.2846 · Cited by 6
Children’s rights and their evidence as a force for inclusion in uncertain times
Bourke, R. (2023) · Frontiers in Education · doi:10.3389/feduc.2023.1027493 · Cited by 5
Immediate and long-term impact of the COVID-19 pandemic on South African higher education
Oyerinde, O. O., & Dienga, A. M. (2023) · Tuning Journal for Higher Education · doi:10.18543/tjhe.2277 · Cited by 5
Wang, L. C., Vlassopoulos, M., Islam, A., & Hassan, H. (2024) · Journal of Political Economy Microeconomics · doi:10.1086/730456 · Cited by 15
Childcare Responsibilities and Parental Labor Market Outcomes During the COVID-19 Pandemic
Garcia, K. S. D., & Cowan, B. (2024) · Journal of Labor Research · doi:10.1007/s12122-024-09355-y · Cited by 5
“…papers suggest that the health and human capital of children are harmed by the closures and that these effects are largest for disadvantaged kids (e.g., Kuhfeld et al. 2020; Engzell et al. 2021; Larsen et al. 2022; Halloran et al. 2021; Fuchs-Schündeln et al. 2021; Fuchs-Schündeln et al. 2022).”
Women in political power and school closure during COVID times
Danzer, N., Garcia-Torres, S., Steinhardt, M. F., & Stella, L. (2024) · Economic Policy · doi:10.1093/epolic/eiae033 · Cited by 6
Takaku, R., Shobako, N., & Nakata, T. (2024) · Scientific Reports · doi:10.1038/s41598-024-67138-y · Cited by 7
“Since previous studies generally focused on the effects of school closures 3,5,19–22 rather than the potential negative effects associated with long-lasting restrictions at re-opened schools, the current study fills an important gap in the literature.”
ResultBinelli, C., Comi, S., Meschi, E., & Pagani, L. (2024) · Journal of Economic Behavior & Organization · doi:10.1016/j.jebo.2024.07.012 · Cited by 5
Gao, X., Ye, F. T.-F., Lee, K. L., Bautista, A., Sin, K. F., & Yang, L. (2024) · Journal of Environmental Psychology · doi:10.1016/j.jenvp.2024.102474 · Cited by 5
Kim, E. J., & Kim, M. J. (2024) · SAGE Open · doi:10.1177/21582440241305325 · Cited by 5
“While previous research (Butnaru et al., 2021; Engzell et al., 2021; Le, 2022; Romanov & Nevgi, 2007) has primarily focused on demographic variables such as gender, major, and years of schooling, this study also examines students’ studying behaviors.”
Bormann, I. (2021) · Cogent Education · doi:10.1080/2331186x.2021.1985687 · Cited by 5
“…not only an accelerated shift to digitalization (Cone et al., 2021; Taglietti et al., 2021), but also actual social inequality in coping with distance education (Dimopoulos et al., 2021), learning gaps (Bonal & González, 2020), and learning losses (Engzell et al., 2021; Tomasik et al., 2021).”
BackgroundThe Opinions of Classroom Teachers on Mathematics Learning Losses During the Pandemic Period
Özcan, A. F., & Saydam, E. N. (2022) · Journal of Qualitative Research in Education · doi:10.14689/enad.30.8 · Cited by 5
Issues and solutions on inventive problems-solving skills (IPSS) in invention course
Kiong, T. T., Nasir, N. A., Azid, N., Mohamad, M. M., Chang, W. M., & Singh, C. K. S. (2022) · Jurnal Cakrawala Pendidikan · doi:10.21831/cp.v41i2.43499 · Cited by 5
Vietnam’s Success in COVID-19 Pandemic: What Are Consequences to Its Higher Education?
Tran, B. T. N., & Jordan, L. S. (2022) · Journal of Comparative & International Higher Education · doi:10.32674/jcihe.v14i3b.4759 · Cited by 5
Projections of adult skills and the effect of COVID-19
Özdemir, C., Reiter, C., Yıldız, D., & Goujon, A. (2022) · PLoS ONE · doi:10.1371/journal.pone.0277113 · Cited by 5
“For example, Engzell and others [25] used a national exam data in the Netherlands, which was conducted just before and after an eight-week-school lockdown.”
MethodGalasso, I., & Watts, G. (2022) · Public Health Ethics · doi:10.1093/phe/phac030 · Cited by 5
“…closure causes detrimental and unequal educational and well-being disruption) is quite uncontroversial (Marmot et al., 2020; United Nations, 2020; Engzell et al., 2021); the other side (that schools cause significant harm to the health of the population) is actually the object of major debates,…”
BackgroundAn Assessment of the Impact of Distance Learning on Pupils’ Performance
Gaidelys, V., Čiūtienė, R., & Cibulskas, G. (2022) · Education Sciences · doi:10.3390/educsci13010003 · Cited by 5
Cubilla-Bonnetier, D., Grajales-Barrios, M., Ortega-Espinosa, A., Puertas, L., & León, N. D. (2023) · Frontiers in Education · doi:10.3389/feduc.2023.989872 · Cited by 5
“This result confirms the impact of the pandemic on the learning of reading that has been documented in other contexts (Engzell et al., 2021; Tomasik et al., 2021; Maldonado and De Witte, 2022).”
ResultWittrin, R. T., Platte, B., Roschke, C., Ritter, M., Eibl, M., Steiner, C. I., & Tolkmitt, V. (2023) · IEEE Transactions on Learning Technologies · doi:10.1109/tlt.2023.3274747 · Cited by 7
“Compared to previously implemented analog face-to-face settings, learning success deteriorated [1].”
ResultImplementasi Pembelajaran Sejarah Berdasarkan Kurikulum Merdeka di SMAN 2 Padang
Sofia, S. A., & Basri, W. (2023) · Widya Winayata Jurnal Pendidikan Sejarah · doi:10.23887/jjps.v11i1.59513 · Cited by 5
Miles, K. P., & Fletcher, A. (2023) · Journal of Research in Childhood Education · doi:10.1080/02568543.2023.2211645 · Cited by 5
“A study of students in the Netherlands, a country with “best-case” educational conditions and a relatively brief lockdown, found that pandemic-related learning loss was 60% greater for children in homes with lower levels of education (Engzell et al., 2021).”
BackgroundThe long-term impact of higher education: Evidence from the Gaokao reinstatement in China
Zhang, K. (2023) · Economics of Education Review · doi:10.1016/j.econedurev.2023.102488 · Cited by 5
Estrategias de enseñanza efectivas para los tiempos de y pospandemia
Jimmy Zambrano, R., & Yaguarema, M. (2021) · Yachana Revista Científica · doi:10.62325/10.62325/yachana.v10.n2.2021.674 · Cited by 5
Experiences and Impacts of the COVID-19 Pandemic: A Thematic Analysis
Lowe, C. T., Trask, C. M., Rafiq, M., MacKay, L. J., Letourneau, N. L., Ng, C. F., Keown-Gerrard, J., Gilbert, T. H., & Ross, K. M. (2024) · COVID · doi:10.3390/covid4040028 · Cited by 5
Angelina, A., Bistari, B., & Halidjah, S. (2024) · Jurnal Paedagogy · doi:10.33394/jp.v11i3.11815 · Cited by 5
“Mathematics involves solving everyday problems and using imagination, instinct, and reasoning to derive new concepts and solve complex problems (Engzell et al., 2021).”
BackgroundGonzález, F., Pinzón-Segura, M. C., Restrepo, B. L. P., Calle-Dávila, M. D. C., Valenzuela, E. S., Herrera-Olano, N., & Rubio, M. L. M. (2021) · Revista Panamericana de Salud Pública · doi:10.26633/rpsp.2021.151 · Cited by 5
“…intenta-ron ser restituidos por vías alternativas con resultados parciales como el aumento de las brechas de trayectorias educativas por nivel socioeconómico (20), género (21) y la conectividad (22), como consecuencia de la impartición de educación virtual en diversos países de la región (23).”
BackgroundEarly childhood care and education access in South Africa during COVID-19: Evidence from NIDS-CRAM
Wills, G., & Kika, J. C. (2022) · Development Southern Africa · doi:10.1080/0376835x.2022.2028607 · Cited by 5
“Globally, studies have been tracking COVID-19 related school closures and their impacts on children’s cognitive and non-cognitive outcomes in developed and to a lesser extent, developing countries (Kuhfeld et al., 2020; Ardington et al., 2021; Engzell et al., 2021; The World Bank et al., 2021).”
BackgroundDistorted Human Decision-Making as a Critical Aspect of Pandemic Planning and Preparedness.
Poland, C. M., Ratishvili, T., & Poland, G. A. (2022) · PubMed Central · Cited by 5
Assessing Inequality in the School Closure Response to COVID-19Preprint
Cai, X., Fu, J., Lu, Y., Tang, X., & Zhong, S. (2020) · SSRN Electronic Journal · doi:10.2139/ssrn.3632103 · Cited by 6
Meta-research on COVID-19: An overview of the early trendsPreprint
Colavizza, G. (2021) · arXiv (Cornell University) · doi:10.48550/arxiv.2106.02961 · Cited by 8
“This finds echo in primary and secondary schools as well [46].”
Blanchard, A. C., Desforges, M., Labbé, A., Nguyen, C. T., Petit, Y., Besner, D., Zinszer, K., Séguin, O., Laghdir, Z., Adams, K., et al. (2021) · medRxiv · doi:10.1101/2021.10.13.21264960 · Cited by 5
School Closures and Effective In-Person Learning during COVID-19Preprint
Kurmann, A., & Lalé, É. (2021) · SSRN Electronic Journal · doi:10.2139/ssrn.3963981 · Cited by 5
Metadata
- Authors
- Engzell, P., Frey, A., & Verhagen, M. D.
- Affiliations
- Stockholm University (SE)
- University of Oxford (GB)
- Corresponding author
- Engzell, Per
- Frey, Arun
- Verhagen, Mark D.
- Venue
- Proceedings of the National Academy of Sciences
- Publisher
- National Academy of Sciences
- Published
- 2021-04-07
- Volume
- 118
- Issue
- 17
- ISSN
- 0027-8424 (ISSN-L)
- 1091-6490
- PMC
- PMC8092566
- OpenAlex
- W3143968054
- Cited by
- 1,848
- References
- 75
- Citations by year
- 2026: 154 · 2025: 211 · 2024: 312 · 2023: 476 · 2022: 456 · 2021: 231
- FWCI
- 562.67
- Type
- journal article
- Language
- en
- Open access
- hybrid
- doi.org
- Licence
- Locations
- Proceedings of the National Academy of Sciences (publishedVersion, cc-by)
- PubMed Central (publishedVersion, cc-by)
- PubMed (publishedVersion)
- UCL Discovery (University College London) (submittedVersion, cc-by)
- RePEc: Research Papers in Economics (submittedVersion)
- SocArXiv (OSF Preprints) (submittedVersion, cc-by-nc-nd)
- SocArXiv (OSF Preprints) (submittedVersion)
- Zenodo (CERN European Organization for Nuclear Research) (submittedVersion, cc-by)
- Funders
- Leverhulme Trust
- University of Oxford
- Vetenskapsrådet (2016-07099)
- Forskningsrådet om Hälsa, Arbetsliv och Välfärd (2016-07099)
- Organisation de Coopération et de Développement Économiques
- Economic and Social Research Council
- Topics
- Social Sciences › Education › Education during COVID-19 pandemic
- Social Sciences › Education › School Choice and Performance
- Social Sciences › Economics, Econometrics and Finance › Economics and Econometrics › COVID-19 Pandemic Impacts
- Keywords
- learning loss, school closures, COVID-19 pandemic, lockdown, national examinations, academic performance, home background, parental education, home-based learning, educational inequality
- MeSH terms
- COVID-19, SARS-CoV-2, Child, Female, Humans, Learning, Male, Netherlands, Quarantine, Schools, Pandemics
About these checks
Registry, retraction, Cites and statistics results are computed, not judged, with one exception: a printed reference that no index lists is read once by a model before it counts as a citation error. Claims are extracted by a model and kept only when their quote appears verbatim in the text; each cited source is then checked, with a model’s help, for whether it says what the claim relies on. Those verdicts can be wrong — read the claim’s quote and the cited source before relying on one.
A language model drew the claims from the paper on 2026-10-07, under version 3 of the claim definition (model deepseek-v4.1-flash, prompt extract-v3).
A second model labelled each claim on 2026-10-07 (model jev-1.13-20260917, definition revision gold-guideline-v0.2).
Cited sources are checked with a language model’s help (gpt-6-sol).
Statistics and arithmetic are recomputed, not judged.
Confidence bands are shown only for fields calibrated on our annotated test set. None is calibrated yet, so no band is shown.
What counts as a claim ›How we measure confidence ›How we check this ›
Are you an author, or do you see a problem with this page? Request a review
