

The DOI matches its Crossref record; 47 of the 47 references it cites were found in a registry or an index.
CheckM: assessing the quality of microbial genomes recovered from isolates, single cells, and metagenomes
Open accessAbstract
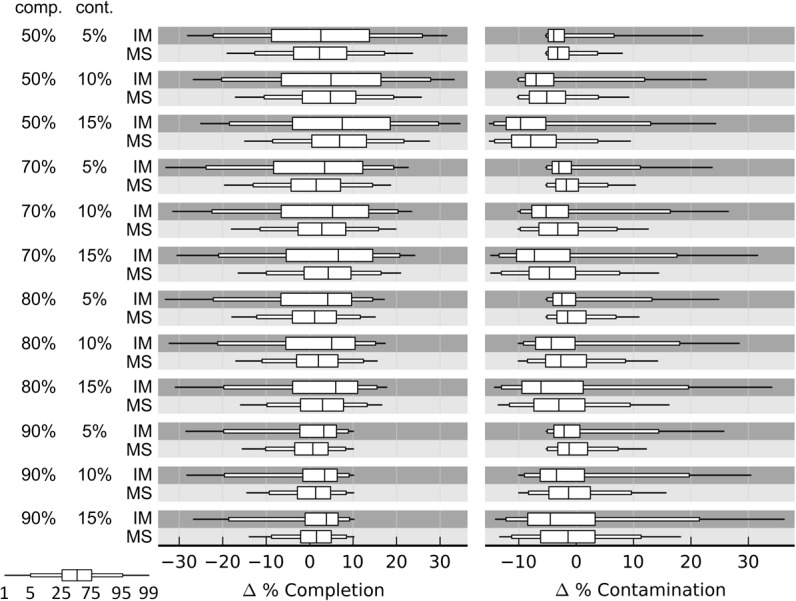
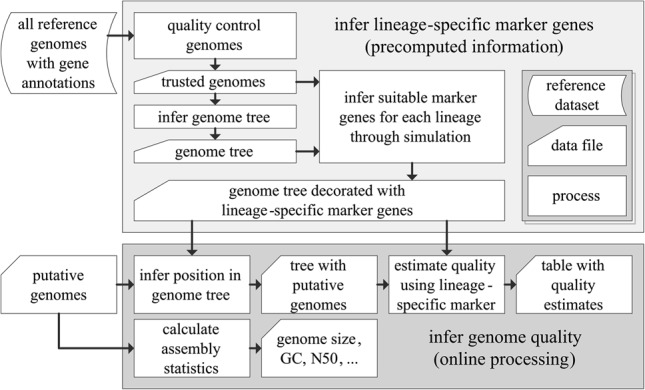
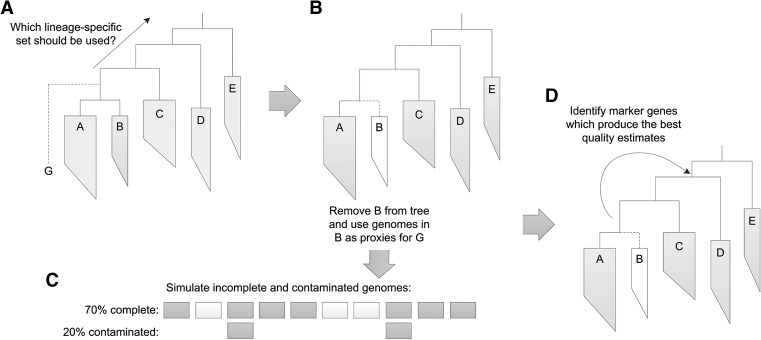
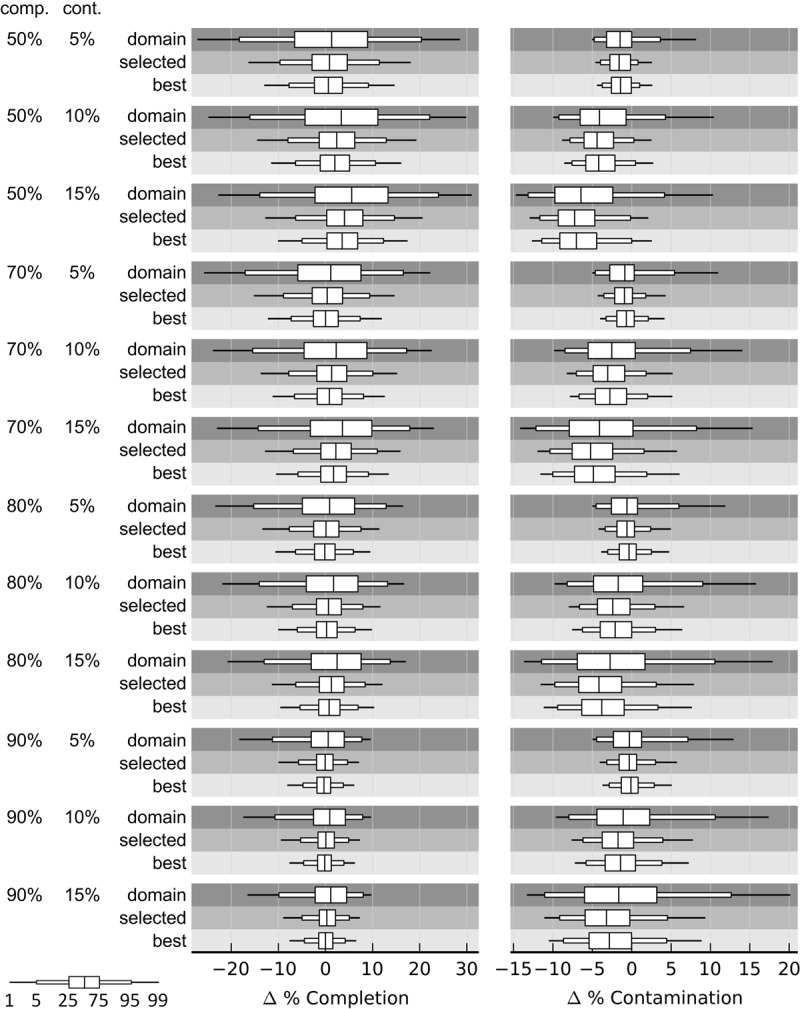
Large-scale recovery of genomes from isolates, single cells, and metagenomic data has been made possible by advances in computational methods and substantial reductions in sequencing costs. Although this increasing breadth of draft genomes is providing key information regarding the evolutionary and functional diversity of microbial life, it has become impractical to finish all available reference genomes. Making robust biological inferences from draft genomes requires accurate estimates of their completeness and contamination. Current methods for assessing genome quality are ad hoc and generally make use of a limited number of "marker" genes conserved across all bacterial or archaeal genomes. Here we introduce CheckM, an automated method for assessing the quality of a genome using a broader set of marker genes specific to the position of a genome within a reference genome tree and information about the collocation of these genes. We demonstrate the effectiveness of CheckM using synthetic data and a wide range of isolate-, single-cell-, and metagenome-derived genomes. CheckM is shown to provide accurate estimates of genome completeness and contamination and to outperform existing approaches. Using CheckM, we identify a diverse range of errors currently impacting publicly available isolate genomes and demonstrate that genomes obtained from single cells and metagenomic data vary substantially in quality. In order to facilitate the use of draft genomes, we propose an objective measure of genome quality that can be used to select genomes suitable for specific gene- and genome-centric analyses of microbial communities.
Overview
The claims and statistics of this paper haven’t been checked yet.
Run the check — free, no account needed. It reads the open-access text and checks the sources it cites.
Integrity signals
Registry
Cites
Statistics
Figures
Verification
Claims the paper makes
The claims and statistics of this paper haven’t been checked yet.
Run the check — free, no account needed. It reads the open-access text and checks the sources it cites.
Claims other papers make about this one
Each is checked against this paper’s own text: does it say what the citing paper says it does?
The cited source says what the claim attributes to it.
In the citing paper
“Quality and completeness were assessed using CheckM (completeness > 94% required) [24].”
From Genomic Characterization of Lactiplantibacillus plantarum Strains: Potential Probiotics from Ethiopian Traditional Fermented Cottage Cheese (2024) · cites this paper as [24]
The cited source says what the claim attributes to it.
In the citing paper
“The genome completeness is 100% based on a comparison with cyanobacterial marker genes using checkM analysis 19.”
From The Draft Genome of a Hydrogen-producing Cyanobacterium, Arthrospira platensis NIES-46 (2019) · cites this paper as [19]
In the citing paper
“The success of such binning procedures is validated by investigating the number of single-copy core-genome genes within each bin, as implemented by software such as CheckM (Parks et al., 2015).”
From Addressing global ruminant agricultural challenges through understanding the rumen microbiome: past, present, and future (2018) · cites this paper as Parks et al., 2015
Self-check
Percentages, sums and reported differences re-computed from the paper’s own numbers.
The self-check needs the paper’s full text.
Citations
Cites
QUAST: quality assessment tool for genome assemblies
Gurevich, A., Saveliev, V., Vyahhi, N., & Tesler, G. (2013) · Bioinformatics · doi:10.1093/bioinformatics/btt086 · Cited by 11,172
Pfam: the protein families database
Finn, R. D., Bateman, A., Clements, J., Coggill, P., Eberhardt, R. Y., Eddy, S. R., Heger, A., Hetherington, K., Holm, L., Mistry, J., et al. (2014) · Nucleic Acids Research · doi:10.1093/nar/gkt1223 · Cited by 6,148
Turnbaugh, P. J., Ley, R. E., Hamady, M., Fraser-Liggett, C. M., Knight, R., & Gordon, J. I. (2007) · Nature · doi:10.1038/nature06244 · Cited by 6,091
FastTree: Computing Large Minimum Evolution Trees with Profiles instead of a Distance Matrix
Price, M. N., Dehal, P. S., & Arkin, A. P. (2009) · Molecular Biology and Evolution · doi:10.1093/molbev/msp077 · Cited by 5,602
McDonald, D. T., Price, M. N., Goodrich, J. K., Nawrocki, E. P., DeSantis, T. Z., Probst, A. J., Andersen, G. L., Knight, R. D., & Hugenholtz, P. (2011) · The ISME Journal · doi:10.1038/ismej.2011.139 · Cited by 5,144
Self-citationYang, Z. (1994) · Journal of Molecular Evolution · doi:10.1007/bf00160154 · Cited by 2,960
Whelan, S., & Goldman, N. (2001) · Molecular Biology and Evolution · doi:10.1093/oxfordjournals.molbev.a003851 · Cited by 2,849
Community structure and metabolism through reconstruction of microbial genomes from the environment
Tyson, G. W., Chapman, J., Hugenholtz, P., Allen, E. E., Ram, R. J., Richardson, P. M., Solovyev, V. V., Rubin, E. M., Rokhsar, D. S., & Banfield, J. F. (2004) · Nature · doi:10.1038/nature02340 · Cited by 2,417
Self-citationInsights into the phylogeny and coding potential of microbial dark matter
Rinke, C., Schwientek, P., Sczyrba, A., Ivanova, N. N., Anderson, I. J., Cheng, J.-F., Darling, A., Malfatti, S., Swan, B. K., Gies, E. A., et al. (2013) · Nature · doi:10.1038/nature12352 · Cited by 2,394
Self-citationDendroPy: a Python library for phylogenetic computing
Sukumaran, J., & Holder, M. T. (2010) · Bioinformatics · doi:10.1093/bioinformatics/btq228 · Cited by 1,616
Cited by
Sorted by citations
Manni, M., Berkeley, M. R., Seppey, M., Simão, F. A., & Zdobnov, E. M. (2021) · Molecular Biology and Evolution · doi:10.1093/molbev/msab199 · Cited by 6,187
Olm, M. R., Brown, C. T., Brooks, B., & Banfield, J. F. (2017) · The ISME Journal · doi:10.1038/ismej.2017.126 · Cited by 3,031
Parks, D. H., Chuvochina, M., Rinke, C., Mussig, A. J., Chaumeil, P.-A., & Hugenholtz, P. (2022) · Nucleic Acids Research · doi:10.1093/nar/gkab776 · Cited by 2,402
Self-citationMetaWRAP—a flexible pipeline for genome-resolved metagenomic data analysis
Uritskiy, G. V., DiRuggiero, J., & Taylor, J. (2018) · Microbiome · doi:10.1186/s40168-018-0541-1 · Cited by 2,642
Gut bacteria selectively promoted by dietary fibers alleviate type 2 diabetes
Zhao, L., Zhang, F., Ding, X., Wu, G., Lam, Y. Y., Wang, X., Fu, H., Xue, X., Lu, C., Ma, J., et al. (2018) · Science · doi:10.1126/science.aao5774 · Cited by 2,304
Best practices for analysing microbiomes
Knight, R., Vrbanac, A., Taylor, B. C., Aksenov, A., Callewaert, C., Debelius, J., Gonzalez, A., Kosciolek, T., McCall, L.-I., McDonald, D., et al. (2018) · Nature Reviews Microbiology · doi:10.1038/s41579-018-0029-9 · Cited by 2,030
Recovery of nearly 8,000 metagenome-assembled genomes substantially expands the tree of life
Parks, D. H., Rinke, C., Chuvochina, M., Chaumeil, P.-A., Woodcroft, B. J., Evans, P. N., Hugenholtz, P., & Tyson, G. W. (2017) · Nature Microbiology · doi:10.1038/s41564-017-0012-7 · Cited by 1,882
Self-citationPasolli, E., Asnicar, F., Manara, S., Zolfo, M., Karcher, N., Armanini, F., Beghini, F., Manghi, P., Tett, A., Ghensi, P., et al. (2019) · Cell · doi:10.1016/j.cell.2019.01.001 · Cited by 1,591
Chklovski, A., Parks, D. H., Woodcroft, B. J., & Tyson, G. W. (2023) · Nature Methods · doi:10.1038/s41592-023-01940-w · Cited by 1,705
Self-citationSingle-cell genome sequencing: current state of the science
Gawad, C., Koh, W., & Quake, S. R. (2016) · Nature Reviews Genetics · doi:10.1038/nrg.2015.16 · Cited by 1,334
Blanco-Míguez, A., Beghini, F., Cumbo, F., McIver, L. J., Thompson, K. N., Zolfo, M., Manghi, P., Dubois, L., Huang, K. D., Thomas, A. M., et al. (2023) · Nature Biotechnology · doi:10.1038/s41587-023-01688-w · Cited by 1,442
A unified catalog of 204,938 reference genomes from the human gut microbiome
Almeida, A., Nayfach, S., Boland, M., Strozzi, F., Beracochea, M., Shi, Z. J., Pollard, K. S., Sakharova, E., Parks, D. H., Hugenholtz, P., et al. (2021) · Nature Biotechnology · doi:10.1038/s41587-020-0603-3 · Cited by 1,367
Self-citationFerretti, P., Pasolli, E., Tett, A., Asnicar, F., Gorfer, V., Fedi, S., Armanini, F., Truong, D. T., Manara, S., Zolfo, M., et al. (2018) · Cell Host & Microbe · doi:10.1016/j.chom.2018.06.005 · Cited by 1,292
A new genomic blueprint of the human gut microbiota
Almeida, A., Mitchell, A. L., Boland, M., Forster, S. C., Gloor, G. B., Tarkowska, A., Lawley, T. D., & Finn, R. D. (2019) · Nature · doi:10.1038/s41586-019-0965-1 · Cited by 1,314
Asgard archaea illuminate the origin of eukaryotic cellular complexity
Zaremba-Niedzwiedzka, K., Caceres, E. F., Saw, J. H., Bäckström, D., Juzokaite, L., Vancaester, E., Seitz, K. W., Anantharaman, K., Starnawski, P., Kjeldsen, K. U., et al. (2017) · Nature · doi:10.1038/nature21031 · Cited by 1,226
Stunted microbiota and opportunistic pathogen colonization in caesarean-section birth
Shao, Y., Forster, S. C., Tsaliki, E., Vervier, K., Strang, A., Simpson, N., Kumar, N., Stares, M. D., Rodger, A., Brocklehurst, P., et al. (2019) · Nature · doi:10.1038/s41586-019-1560-1 · Cited by 1,088
Asnicar, F., Berry, S. E., Valdes, A. M., Nguyen, L. H., Piccinno, G., Drew, D. A., Leeming, E., Gibson, R., Le Roy, C., Khatib, H. A., et al. (2021) · Nature Medicine · doi:10.1038/s41591-020-01183-8 · Cited by 995
New insights from uncultivated genomes of the global human gut microbiome
Nayfach, S., Shi, Z. J., Seshadri, R., Pollard, K. S., & Kyrpides, N. C. (2019) · Nature · doi:10.1038/s41586-019-1058-x · Cited by 737
Prevotella Diversity, Niches and Interactions with the Human Host
Tett, A., Pasolli, E., Masetti, G., Ercolini, D., & Segata, N. (2021) · Nature Reviews Microbiology · doi:10.1038/s41579-021-00559-y · Cited by 748
MetaQUAST: evaluation of metagenome assemblies
Mikheenko, A., Saveliev, V., & Gurevich, A. (2016) · Bioinformatics · doi:10.1093/bioinformatics/btv697 · Cited by 711
Cultivation and sequencing of rumen microbiome members from the Hungate1000 Collection
Hungate1000 project collaborators, Seshadri, R., Leahy, S. C., Attwood, G. T., Teh, K. H., Lambie, S. C., Cookson, A. L., Eloe-Fadrosh, E. A., Pavlopoulos, G. A., Hadjithomas, M., et al. (2018) · Nature Biotechnology · doi:10.1038/nbt.4110 · Cited by 624
Current challenges and best-practice protocols for microbiome analysis
Bharti, R., & Grimm, D. G. (2021) · Briefings in Bioinformatics · doi:10.1093/bib/bbz155 · Cited by 592
Sequence modeling and design from molecular to genome scale with Evo
Nguyen, E., Poli, M., Durrant, M. G., Kang, B., Katrekar, D., Li, D. B., Bartie, L. J., Thomas, A. W., King, S. H., Brixi, G., et al. (2024) · Science · doi:10.1126/science.ado9336 · Cited by 580
Pan-cancer analyses reveal cancer-type-specific fungal ecologies and bacteriome interactions
Narunsky-Haziza, L., Sepich-Poore, G. D., Livyatan, I., Asraf, O., Martino, C., Nejman, D., Gavert, N., Stajich, J. E., Amit, G., González, A., et al. (2022) · Cell · doi:10.1016/j.cell.2022.09.005 · Cited by 538
Tett, A., Huang, K. D., Asnicar, F., Fehlner-Peach, H., Pasolli, E., Karcher, N., Armanini, F., Manghi, P., Bonham, K., Zolfo, M., et al. (2019) · Cell Host & Microbe · doi:10.1016/j.chom.2019.08.018 · Cited by 476
Huws, S. A., Creevey, C. J., Oyama, L. B., Mizrahi, I., Denman, S. E., Popova, M., Muñoz-Tamayo, R., Forano, E., Waters, S. M., Hess, M., et al. (2018) · Frontiers in Microbiology · doi:10.3389/fmicb.2018.02161 · Cited by 487
Profiling the human intestinal environment under physiological conditions
Shalon, D., Culver, R. N., Grembi, J. A., Folz, J., Treit, P. V., Shi, H., Rosenberger, F. A., Dethlefsen, L., Meng, X., Yaffe, E., et al. (2023) · Nature · doi:10.1038/s41586-023-05989-7 · Cited by 484
The person-to-person transmission landscape of the gut and oral microbiomes
Valles-Colomer, M., Blanco-Míguez, A., Manghi, P., Asnicar, F., Dubois, L., Golzato, D., Armanini, F., Cumbo, F., Huang, K. D., Manara, S., et al. (2023) · Nature · doi:10.1038/s41586-022-05620-1 · Cited by 449
Microbial abundance, activity and population genomic profiling with mOTUs2
Milanese, A., Mende, D. R., Paoli, L., Salazar, G., Ruscheweyh, H.-J., Cuenca, M., Hingamp, P., Alves, R., Costea, P. I., Coelho, L. P., et al. (2019) · Nature Communications · doi:10.1038/s41467-019-08844-4 · Cited by 446
Accurate and complete genomes from metagenomes
Chen, L.-X., Anantharaman, K., Shaiber, A., Eren, A. M., & Banfield, J. F. (2020) · Genome Research · doi:10.1101/gr.258640.119 · Cited by 401
The widespread IS200/IS605 transposon family encodes diverse programmable RNA-guided endonucleases
Altae-Tran, H., Kannan, S., Demircioglu, F. E., Oshiro, R., Nety, S. P., McKay, L. J., Dlakić, M., Inskeep, W. P., Makarova, K. S., Macrae, R. K., et al. (2021) · Science · doi:10.1126/science.abj6856 · Cited by 407
Ianiro, G., Punčochář, M., Karcher, N., Porcari, S., Armanini, F., Asnicar, F., Beghini, F., Blanco-Míguez, A., Cumbo, F., Manghi, P., et al. (2022) · Nature Medicine · doi:10.1038/s41591-022-01964-3 · Cited by 366
Large-scale genome-wide analysis links lactic acid bacteria from food with the gut microbiome
Pasolli, E., De Filippis, F., Mauriello, I. E., Cumbo, F., Walsh, A. M., Leech, J., Cotter, P. D., Segata, N., & Ercolini, D. (2020) · Nature Communications · doi:10.1038/s41467-020-16438-8 · Cited by 367
Pérez-Cobas, A. E., Gomez-Valero, L., & Buchrieser, C. (2020) · Microbial Genomics · doi:10.1099/mgen.0.000409 · Cited by 314
The reductive glycine pathway allows autotrophic growth of Desulfovibrio desulfuricans
Sánchez-Andrea, I., Guedes, I. A., Hornung, B., Boeren, S., Lawson, C. E., Sousa, D. Z., Bar-Even, A., Claassens, N. J., & Stams, A. J. M. (2020) · Nature Communications · doi:10.1038/s41467-020-18906-7 · Cited by 306
High-throughput, single-microbe genomics with strain resolution, applied to a human gut microbiome
Zheng, W., Zhao, S., Yin, Y., Zhang, H., Needham, D. M., Evans, E. D., Dai, C. L., Lu, P. J., Alm, E. J., & Weitz, D. A. (2022) · Science · doi:10.1126/science.abm1483 · Cited by 283
The food-gut axis: lactic acid bacteria and their link to food, the gut microbiome and human health
De Filippis, F., Pasolli, E., & Ercolini, D. (2020) · FEMS Microbiology Reviews · doi:10.1093/femsre/fuaa015 · Cited by 303
Mobile genes in the human microbiome are structured from global to individual scales
Brito, I. L., Yilmaz, S., Huang, K., Xu, L., Jupiter, S. D., Jenkins, A. P., Naisilisili, W., Tamminen, M., Smillie, C. S., Wortman, J. R., et al. (2016) · Nature · doi:10.1038/nature18927 · Cited by 288
A rooted phylogeny resolves early bacterial evolution
Coleman, G. A., Davín, A. A., Mahendrarajah, T. A., Szánthó, L. L., Spang, A., Hugenholtz, P., Szöllősi, G. J., & Williams, T. A. (2021) · Science · doi:10.1126/science.abe0511 · Cited by 285
Self-citationHigh-throughput microbial culturomics using automation and machine learning
Huang, Y., Sheth, R. U., Zhao, S., Cohen, L. A., Dabaghi, K., Moody, T., Sun, Y., Ricaurte, D., Richardson, M., Velez-Cortes, F., et al. (2023) · Nature Biotechnology · doi:10.1038/s41587-023-01674-2 · Cited by 283
A core microbiome signature as an indicator of health
Wu, G., Xu, T., Zhao, N., Lam, Y. Y., Ding, X., Wei, D., Fan, J., Shi, Y., Li, X., Li, M., et al. (2024) · Cell · doi:10.1016/j.cell.2024.09.019 · Cited by 250
Drivers and determinants of strain dynamics following fecal microbiota transplantation
Schmidt, T. S. B., Li, S. S., Maistrenko, O. M., Akanni, W., Coelho, L. P., Dolai, S., Fullam, A., Glazek, A. M., Hercog, R., Herrema, H., et al. (2022) · Nature Medicine · doi:10.1038/s41591-022-01913-0 · Cited by 233
Codiversification of gut microbiota with humans
Suzuki, T. A., Fitzstevens, J. L., Schmidt, V. T., Enav, H., Huus, K. E., Mbong Ngwese, M., Grießhammer, A., Pfleiderer, A., Adegbite, B. R., Zinsou, J. F., et al. (2022) · Science · doi:10.1126/science.abm7759 · Cited by 210
Leech, J., Cabrera-Rubio, R., Walsh, A. M., Macori, G., Walsh, C. J., Barton, W., Finnegan, L., Crispie, F., O’Sullivan, O., Claesson, M. J., et al. (2020) · mSystems · doi:10.1128/msystems.00522-20 · Cited by 200
Metabolome-microbiome signatures in the fermented beverage, Kombucha
Villarreal-Soto, S. A., Bouajila, J., Pace, M., Leech, J., Cotter, P. D., Souchard, J.-P., Taillandier, P., & Beaufort, S. (2020) · International Journal of Food Microbiology · doi:10.1016/j.ijfoodmicro.2020.108778 · Cited by 196
Beresford-Jones, B. S., Forster, S. C., Stares, M. D., Notley, G., Viciani, E., Browne, H. P., Boehmler, D. J., Soderholm, A. T., Kumar, N., Vervier, K., et al. (2022) · Cell Host & Microbe · doi:10.1016/j.chom.2021.12.003 · Cited by 194
Quality assessment of gene repertoire annotations with OMArk
Nevers, Y., Warwick Vesztrocy, A., Rossier, V., Train, C.-M., Altenhoff, A., Dessimoz, C., & Glover, N. M. (2025) · Nature Biotechnology · doi:10.1038/s41587-024-02147-w · Cited by 186
Niche partitioning of diverse sulfur-oxidizing bacteria at hydrothermal vents.
Meier, D. V., Pjevac, P., Bach, W., Hourdez, S., Girguis, P. R., Vidoudez, C., Amann, R., & Meyerdierks, A. (2017) · The ISME Journal · doi:10.1038/ismej.2017.37 · Cited by 177
Karcher, N., Nigro, E., Punčochář, M., Blanco-Míguez, A., Ciciani, M., Manghi, P., Zolfo, M., Cumbo, F., Manara, S., Golzato, D., et al. (2021) · Genome Biology · doi:10.1186/s13059-021-02427-7 · Cited by 159
Svartström, O., Alneberg, J., Terrapon, N., Lombard, V., de Bruijn, I., Malmsten, J., Dalin, A.-M., EL Muller, E., Shah, P., Wilmes, P., et al. (2017) · The ISME Journal · doi:10.1038/ismej.2017.108 · Cited by 161
A gut microbial signature for combination immune checkpoint blockade across cancer types
Gunjur, A., Shao, Y., Rozday, T., Klein, O., Mu, A., Haak, B. W., Markman, B., Kee, D., Carlino, M. S., Underhill, C., et al. (2024) · Nature Medicine · doi:10.1038/s41591-024-02823-z · Cited by 165
Ueda, A., Shinkai, S., Shiroma, H., Taniguchi, Y., Tsuchida, S., Kariya, T., Kawahara, T., Kobayashi, Y., Kohda, N., Ushida, K., et al. (2021) · Cell Reports Medicine · doi:10.1016/j.xcrm.2021.100398 · Cited by 155
Light-driven anaerobic microbial oxidation of manganese
Daye, M., Klepac-Ceraj, V., Pajusalu, M., Rowland, S., Farrell-Sherman, A., Beukes, N., Tamura, N., Fournier, G., & Bosak, T. (2019) · Nature · doi:10.1038/s41586-019-1804-0 · Cited by 145
Unexplored microbial diversity from 2,500 food metagenomes and links with the human microbiome.
Carlino, N., Blanco-Míguez, A., Punčochář, M., Mengoni, C., Pinto, F., Tatti, A., Manghi, P., Armanini, F., Avagliano, M., Barcenilla, C., et al. (2024) · Cell · doi:10.1016/j.cell.2024.07.039 · Cited by 146
“We generated 27,123 MAGs that, after quality filtering, resulted in 4,976 high-quality (HQ) and 5,136 medium-quality (MQ) prokaryotic MAGs 83 (Table S2).”
Probiotics synergized with conventional regimen in managing Parkinson’s disease
Sun, H., Zhao, F., Liu, Y., Ma, T., Jin, H., Quan, K., Leng, B., Zhao, J., Yuan, X., Li, Z., et al. (2022) · npj Parkinson's Disease · doi:10.1038/s41531-022-00327-6 · Cited by 136
Meta-analysis of cheese microbiomes highlights contributions to multiple aspects of quality
Walsh, A. M., Macori, G., Kilcawley, K. N., & Cotter, P. D. (2020) · Nature Food · doi:10.1038/s43016-020-0129-3 · Cited by 133
Muñoz-Gómez, S. A., Susko, E., Williamson, K., Eme, L., Slamovits, C. H., Moreira, D., López-García, P., & Roger, A. J. (2022) · Nature Ecology & Evolution · doi:10.1038/s41559-021-01638-2 · Cited by 111
van de Wouw, M., Walsh, A. M., Crispie, F., van Leuven, L., Lyte, J. M., Boehme, M., Clarke, G., Dinan, T. G., Cotter, P. D., & Cryan, J. F. (2020) · Microbiome · doi:10.1186/s40168-020-00846-5 · Cited by 123
Microbial composition of Kombucha determined using amplicon sequencing and shotgun metagenomics
Arıkan, M., Mitchell, A. L., Finn, R. D., & Gürel, F. (2020) · Journal of Food Science · doi:10.1111/1750-3841.14992 · Cited by 123
Shotgun Metagenomics of a Water Kefir Fermentation Ecosystem Reveals a Novel Oenococcus Species
Verce, M., De Vuyst, L., & Weckx, S. (2019) · Frontiers in Microbiology · doi:10.3389/fmicb.2019.00479 · Cited by 121
Karcher, N., Pasolli, E., Asnicar, F., Huang, K. D., Tett, A., Manara, S., Armanini, F., Bain, D., Duncan, S. H., Louis, P., et al. (2020) · Genome Biology · doi:10.1186/s13059-020-02042-y · Cited by 116
Press, M. O., Wiser, A. H., Kronenberg, Z. N., Langford, K. W., Shakya, M., Lo, C.-C., Mueller, K. A., Sullivan, S. T., Chain, P. S. G., & Liachko, I. (2017) · bioRxiv (Cold Spring Harbor Laboratory) · doi:10.1101/198713 · Cited by 103
Diet leaves a genetic signature in a keystone member of the gut microbiota
Dapa, T., Ramiro, R. S., Pedro, M. F., Gordo, I., & Xavier, K. B. (2022) · Cell Host & Microbe · doi:10.1016/j.chom.2022.01.002 · Cited by 91
Tamburini, F. B., Maghini, D., Oduaran, O. H., Brewster, R., Hulley, M. R., Sahibdeen, V., Norris, S. A., Tollman, S., Kahn, K., Wagner, R. G., et al. (2022) · Nature Communications · doi:10.1038/s41467-021-27917-x · Cited by 88
Microbial hitchhikers harbouring antimicrobial-resistance genes in the riverine plastisphere
Zadjelovic, V., Wright, R. J., Borsetto, C., Quartey, J., Cairns, T. N., Langille, M. G. I., Wellington, E. M. H., & Christie-Oleza, J. A. (2023) · Microbiome · doi:10.1186/s40168-023-01662-3 · Cited by 87
Calabrese, F. M., Ameur, H., Nikoloudaki, O., Celano, G., Vacca, M., Junior, W. J., Manzari, C., Vertè, F., Di Cagno, R., Pesole, G., et al. (2022) · Microbiome · doi:10.1186/s40168-022-01301-3 · Cited by 85
Andreu-Sánchez, S., Blanco-Míguez, A., Wang, D., Golzato, D., Manghi, P., Heidrich, V., Fackelmann, G., Zhernakova, D. V., Kurilshikov, A., Valles-Colomer, M., et al. (2025) · Cell · doi:10.1016/j.cell.2025.04.014 · Cited by 81
An archaeal origin of the Wood–Ljungdahl H4MPT branch and the emergence of bacterial methylotrophy
Adam, P. S., Borrel, G., & Gribaldo, S. (2019) · Nature Microbiology · doi:10.1038/s41564-019-0534-2 · Cited by 76
Revealing the microbial heritage of traditional Brazilian cheeses through metagenomics
Kothe, C. I., Mohellibi, N., & Renault, P. (2022) · Food Research International · doi:10.1016/j.foodres.2022.111265 · Cited by 51
The diversity and evolution of microbial dissimilatory phosphite oxidation
Ewens, S. D., Gomberg, A. F. S., Barnum, T. P., Borton, M. A., Carlson, H. K., Wrighton, K. C., & Coates, J. D. (2021) · Proceedings of the National Academy of Sciences · doi:10.1073/pnas.2020024118 · Cited by 48
Fast and accurate metagenotyping of the human gut microbiome with GT-Pro
Shi, Z. J., Dimitrov, B., Zhao, C., Nayfach, S., & Pollard, K. S. (2022) · Nature Biotechnology · doi:10.1038/s41587-021-01102-3 · Cited by 42
Zhang, Q., Linke, V., Overmyer, K. A., Traeger, L. L., Kasahara, K., Miller, I. J., Manson, D. E., Polaske, T. J., Kerby, R. L., Kemis, J. H., et al. (2023) · Nature Microbiology · doi:10.1038/s41564-023-01326-w · Cited by 43
Alexander, H., Hu, S. K., Krinos, A. I., Pachiadaki, M., Tully, B. J., Neely, C. J., & Reiter, T. (2021) · doi:10.1101/2021.07.25.453713 · Cited by 67
Jeraldo, P., Hernandez, A., Nielsen, H. B., Chen, X., White, B. A., Goldenfeld, N., Nelson, H., Alhquist, D., Boardman, L., & Chia, N. (2016) · Frontiers in Microbiology · doi:10.3389/fmicb.2016.00783 · Cited by 38
Roussel, T., Halary, S., Duval, C., Piquet, B., Cadoret, J.-P., Vernès, L., Bernard, C., & Marie, B. (2023) · Journal of Applied Microbiology · doi:10.1093/jambio/lxad159 · Cited by 39
The origin and evolution of methanogenesis and Archaea are intertwined
Mei, R., Kaneko, M., Imachi, H., & Nobu, M. K. (2023) · PNAS Nexus · doi:10.1093/pnasnexus/pgad023 · Cited by 37
Clonal Candida auris and ESKAPE pathogens on the skin of residents of nursing homes
Proctor, D. M., Sansom, S. E., Deming, C., Conlan, S., Blaustein, R. A., Atkins, T. K., Program, N. C. S., Mullikin, J., Thomas, J., Young, A., et al. (2025) · Nature · doi:10.1038/s41586-025-08608-9 · Cited by 37
Kiu, R., Darby, E. M., Alcon-Giner, C., Acuna-Gonzalez, A., Camargo, A., Lamberte, L. E., Phillips, S., Sim, K., Shaw, A. G., Clarke, P., et al. (2025) · Nature communications · doi:10.1038/s41467-025-62584-2 · Cited by 36
Richardson, L. J., Rawlings, N. D., Salazar, G. A., Almeida, A., Haft, D. R., Ducq, G., Sutton, G. G., & Finn, R. D. (2019) · Nucleic Acids Research · doi:10.1093/nar/gky1013 · Cited by 36
Suzuki, S., Nealson, K. H., & Ishii, S. (2018) · Frontiers in Microbiology · doi:10.3389/fmicb.2018.03141 · Cited by 36
Shen, Y.-C., Lee, P.-C., Kuo, Y.-L., Wu, W.-K., Chen, C.-C., Lei, C.-H., Yeh, C.-P., Hsu, C., Hsu, C.-H., Lin, Z.-Z., et al. (2021) · Journal of Hepatocellular Carcinoma · doi:10.2147/jhc.s315696 · Cited by 36
“11.(44) The obtained unigenes were used to blast the sequences for the bacterial, fungi, archaea, and viruses, which were extracted from the NCBI Refseq(45) using the software program DIAMOND v.”
MethodOxygen metabolism in descendants of the archaeal-eukaryotic ancestor
Appler, K. E., Lingford, J. P., Gong, X., Panagiotou, K., Leão, P., Langwig, M. V., Greening, C., Ettema, T. J. G., De Anda, V., & Baker, B. J. (2026) · Nature · doi:10.1038/s41586-026-10128-z · Cited by 36
Oxygen metabolism in descendants of the archaeal-eukaryotic ancestor
Appler, K. E., Lingford, J. P., Gong, X., Panagiotou, K., Leão, P., Langwig, M., Greening, C., Ettema, T. J. G., De Anda, V., & Baker, B. J. (2024) · doi:10.1101/2024.07.04.601786 · Cited by 36
Tomofuji, Y., Kishikawa, T., Maeda, Y., Ogawa, K., Otake-Kasamoto, Y., Kawabata, S., Nii, T., Okuno, T., Oguro-Igashira, E., Kinoshita, M., et al. (2022) · Cell Genomics · doi:10.1016/j.xgen.2022.100219 · Cited by 35
Pietrzak, B., Tomela, K., Olejnik-Schmidt, A., Galus, Ł., Mackiewicz, J., Kaczmarek, M., Mackiewicz, A., & Schmidt, M. (2022) · Cancers · doi:10.3390/cancers14215369 · Cited by 36
“18 [31] and were filtered for >90% completeness and <5% contamination.”
BackgroundMaternal and food microbial sources shape the infant microbiome of a rural Ethiopian population
Manara, S., Selma-Royo, M., Huang, K. D., Asnicar, F., Armanini, F., Blanco-Miguez, A., Cumbo, F., Golzato, D., Manghi, P., Pinto, F., et al. (2023) · Current Biology · doi:10.1016/j.cub.2023.04.011 · Cited by 30
Alexa, E. A., Cobo-Díaz, J. F., Renes, E., O´Callaghan, T. F., Kilcawley, K., Mannion, D., Skibinska, I., Ruiz, L., Margolles, A., Fernández-Gómez, P., et al. (2024) · Microbiome · doi:10.1186/s40168-024-01790-4 · Cited by 28
Nori, S. R. C., Walsh, C. J., McAuliffe, F. M., Moore, R. L., Van Sinderen, D., Feehily, C., & Cotter, P. D. (2025) · npj Biofilms and Microbiomes · doi:10.1038/s41522-025-00682-1 · Cited by 29
Shotgun metagenomic analysis reveals new insights into bacterial community profiles in tempeh
Yulandi, A., Suwanto, A., Waturangi, D. E., & Wahyudi, A. T. (2020) · BMC Research Notes · doi:10.1186/s13104-020-05406-6 · Cited by 27
Bifidobacteriaceae diversity in the human microbiome from a large-scale genome-wide analysis
Pasolli, E., Mauriello, I. E., Avagliano, M., Cavaliere, S., De Filippis, F., & Ercolini, D. (2024) · Cell Reports · doi:10.1016/j.celrep.2024.115027 · Cited by 22
Guild-Level Microbiome Signature Associated with COVID-19 Severity and Prognosis
Guo, M., Wu, G., Tan, Y., Li, Y., Jin, X., Qi, W., Guo, X., Zhang, C., Zhu, Z., & Zhao, L. (2023) · mBio · doi:10.1128/mbio.03519-22 · Cited by 19
Pangenomes of human gut microbiota uncover links between genetic diversity and stress response
Shoer, S., Reicher, L., Zhao, C., Pollard, K. S., Pilpel, Y., & Segal, E. (2024) · Cell Host & Microbe · doi:10.1016/j.chom.2024.08.017 · Cited by 23
Genomic atlas of Bifidobacterium infantis and B. longum informs infant probiotic design
Shao, Y., Wang, S., Gichuki, B. M., Stares, M. D., Rozday, T. J., Kumar, N., Browne, H. P., Dawson, N. J. R., Njunge, J. M., Tigoi, C., et al. (2026) · Cell · doi:10.1016/j.cell.2026.01.007 · Cited by 17
Comparative Genomic Analysis of Bifidobacterium bifidum Strains Isolated from Different Niches
Lu, W., Pei, Z., Zang, M., Lee, Y.-K., Zhao, J., Chen, W., Wang, H., & Zhang, H. (2021) · Genes · doi:10.3390/genes12101504 · Cited by 17
Genomic and functional diversity of the human-derived isolates of Faecalibacterium
Li, W., Lin, X., Liang, H., Wu, Z., Wang, M., Sun, J., Li, X., He, W., Gao, X., Hu, T., et al. (2024) · Frontiers in Microbiology · doi:10.3389/fmicb.2024.1379500 · Cited by 17
Gizachew, S., & Engidawork, E. (2024) · Genes · doi:10.3390/genes15111389 · Cited by 15
“Quality and completeness were assessed using CheckM (completeness > 94% required) [24].”
Viruses of sulfur oxidizing phototrophs encode genes for pigment, carbon, and sulfur metabolisms
Hesketh-Best, P. J., Bosco-Santos, A., Garcia, S. L., O’Beirne, M. D., Werne, J. P., Gilhooly, W. P., & Silveira, C. B. (2023) · Communications Earth & Environment · doi:10.1038/s43247-023-00796-4 · Cited by 16
Parker, C. W., Senko, J. M., Auler, A. S., Sasowsky, I. D., Schulz, F., Woyke, T., & Barton, H. A. (2022) · Scientific Reports · doi:10.1038/s41598-022-21365-3 · Cited by 12
The Draft Genome of a Hydrogen-producing Cyanobacterium, Arthrospira platensis NIES-46
Suzuki, S., Yamaguchi, H., & Kawachi, M. (2019) · Journal of Genomics · doi:10.7150/jgen.38149 · Cited by 12
“The genome completeness is 100% based on a comparison with cyanobacterial marker genes using checkM analysis [19].”
MethodPseudofructophilic Leuconostoc citreum Strain F192-5, Isolated from Satsuma Mandarin Peel
Maeno, S., Tanizawa, Y., Kajikawa, A., Kanesaki, Y., Kubota, E., Arita, M., Dicks, L., & Endo, A. (2019) · Applied and Environmental Microbiology · doi:10.1128/aem.01077-19 · Cited by 11
Metadata
- Authors
- Parks, D. H., Imelfort, M., Skennerton, C. T., Hugenholtz, P., & Tyson, G. W.
- Affiliations
- The University of Queensland (AU)
- Venue
- Genome Research
- Publisher
- Cold Spring Harbor Laboratory
- Published
- 2015-05-14
- Volume
- 25
- Issue
- 7
- Pages
- 1043-1055
- ISSN
- 1088-9051 (ISSN-L)
- 1549-5469
- PMC
- PMC4484387
- OpenAlex
- W2112364185
- Cited by
- 12,496
- References
- 47
- Citations by year
- 2026: 1931 · 2025: 2112 · 2024: 1929 · 2023: 1587 · 2022: 1403 · 2021: 1204 · 2020: 928 · 2019: 582 · 2018: 381 · 2017: 261 · 2016: 117 · 2015: 47
- Type
- posted content
- Language
- en
- Open access
- bronze
- doi.org
- Locations
- Genome Research (publishedVersion)
- Europe PMC (PubMed Central) (publishedVersion, cc-by-nc)
- PubMed Central (publishedVersion, cc-by-nc)
- PubMed (publishedVersion)
- eScholarship (California Digital Library) (submittedVersion, cc-by)
- Funders
- Natural Sciences and Engineering Research Council of Canada
- Great Barrier Reef Foundation
- Australian Research Council (DP120103498, DP1093175)
- Discovery Outstanding Researcher Award
- Topics
- Life Sciences › Biochemistry, Genetics and Molecular Biology › Molecular Biology › Genomics and Phylogenetic Studies
- Physical Sciences › Environmental Science › Ecology › Microbial Community Ecology and Physiology
- Health Sciences › Medicine › Microbiology (medical) › Bacterial Identification and Susceptibility Testing
- Keywords
- CheckM, genome completeness, genome contamination, draft genome sequence, microbial genomes, marker genes, single-cell genomics, metagenome, genome quality assessment, bacterial and archaeal genomes
- MeSH terms
- Metagenome, Metagenomics, Genome, Microbial
About these checks
Registry, retraction, Cites and statistics results are computed, not judged, with one exception: a printed reference that no index lists is read once by a model before it counts as a citation error. Claims are extracted by a model and kept only when their quote appears verbatim in the text; each cited source is then checked, with a model’s help, for whether it says what the claim relies on. Those verdicts can be wrong — read the claim’s quote and the cited source before relying on one.
Statistics and arithmetic are recomputed, not judged.
Confidence bands are shown only for fields calibrated on our annotated test set. None is calibrated yet, so no band is shown.
What counts as a claim ›How we measure confidence ›How we check this ›
Are you an author, or do you see a problem with this page? Request a review
