

The DOI matches its Crossref record; 149 of the 149 references it cites were found in a registry or an index; none of the 88 sources its claims cite is checked for support yet.
Diet, exercise or diet with exercise: comparing the effectiveness of treatment options for weight-loss and changes in fitness for adults (18–65 years old) who are overfat, or obese; systematic review and meta-analysis
Open accessAbstract
There are number of means of methods to alter body composition, and metabolic issues, available for the adult who is overfat. The following is a systematic review and meta-analysis focused on comparing changes from treatment program for adults who are overfat based on analysis of aggregated effect size (ES) of inducing changes. So as to determine the relative effectiveness of such protocols and intervention plans of choice. This tiered meta-analysis of 66-population based studies, and 162-studywise groups, a clear pattern of ES being established across and within treatments. First, hypocaloric balance is necessary for changing body composition, but the effectiveness for establishing imbalance does not equate with the effectiveness for body compositional changes, or any biomarkers associated with metabolic issues. With analysis showing that there is a necessity to include exercise in combination with diet effectively elicit changes in body composition and biomarkers of metabolic issues. More importantly, the combination, resistance training (RT) was more effective than endurance training (ET) or combination of RT and ET, particularly when progressive training volume of 2-to-3 sets for 6-to-10 reps at an intensity of ≥75% 1RM, utilizing whole body and free-weight exercises, at altering body compositional measures (ES of 0.47, 0.30, and 0.40 for loss of BM, FM, and retention of FFM respectively) and reducing total cholesterol (ES = 0.85), triglycerides (ES = 0.86) and low-density lipoproteins (ES = 0.60). Additionally RT was more effective at reducing fasting insulin levels (ES = 3.5) than ET or ET and RT. Even though generally lower ES than RT, the inclusion of ET was more effective when performed at high intensity (e.g. ≥70% VO 2max or HR max for 30-minutes 3-4x’s/wk), or in an interval training style than when utilizing the relatively common prescribed method of low-to-moderate (e.g., 50-70% VO 2max or HR max for at least equal time) steady state method, ES of 0.35, 0.39, and 0.13 for BM, FM, and FFM respectively. Thus indicating that focus of treatment should be on producing a large metabolic stress (as induced by RT or high levels of ET) rather than an energetic imbalance for adults who are overfat.
Overview
AI snapshot
Written from the paper’s full text.
TL;DR
This systematic review and meta-analysis of 66 population-based studies and 162 study groups found that exercise-containing treatments, especially resistance training combined with diet, generally produced larger effect sizes for body composition and some metabolic markers than diet alone. The paper argues treatment focus should be on producing metabolic stress rather than assumed acute energetic imbalance.
Key findings
- Resistance training (RT) was more effective than endurance training (ET) or combined RT+ET for altering body composition, particularly with progressive training of 2–3 sets for 6–10 reps at ≥75% 1RM using whole-body and free-weight exercises: ES 0.47 for body mass loss, 0.30 for fat mass loss, and 0.40 for fat-free mass retention.
- RT was also more effective for reducing total cholesterol (ES = 0.85), triglycerides (ES = 0.86), low-density lipoproteins (ES = 0.60), and fasting insulin (ES = 3.5) than ET or ET+RT.
- High-intensity or interval ET was more effective than low-to-moderate steady-state ET, with ES of 0.35 for body mass, 0.39 for fat mass, and 0.13 for fat-free mass.
- Hypocaloric balance was necessary for changing body composition, but the effectiveness for establishing energetic imbalance did not equate with effectiveness for body compositional changes or associated biomarkers.
Methods
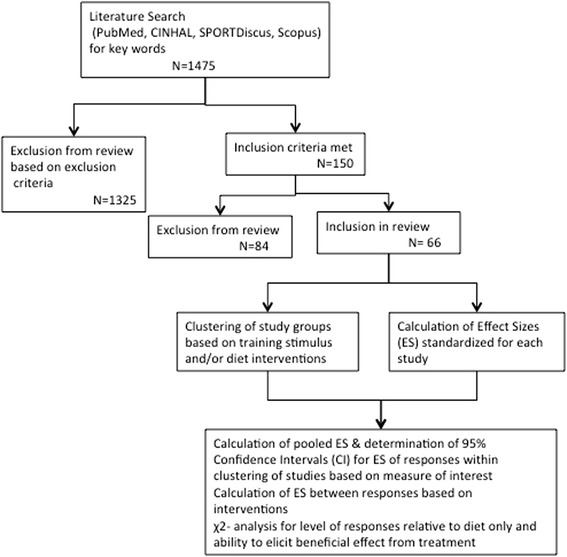
- Systematic review and meta-analysis of human population-based studies retrieved from PubMed, EBSCO Host (CINAHL, SPORTDiscus), and Scopus, with inclusion criteria requiring adults aged 18–65 years classified as overweight or obese, chronic interventions of at least 4 weeks, and randomized assignment to training/control or intervention order.
- A total of 66 studies and 162 study groups were included; 32 studies indicated a control group for pooled therapeutic effect size analysis.
- Standardized effect sizes and 95% confidence intervals were calculated and pooled across treatment categories (diet only, diet+ET, diet+RT, diet+ET+RT, ET only, RT only), with 2×2 χ² analyses used to compare response levels by treatment, exercise subtype, diet type, and intervention length.
Limitations
- Stated: too few studies examined anabolic hormones such as testosterone and growth hormone without pharmaceutical intervention, limiting speculation about the extent or timeframe of hormonal changes.
- Stated: energetic imbalance was generally assumed rather than directly measured; very few protocols directly measured the energetic shift from exercise sessions or recovery, and no reviewed study directly measured it.
- Evident from the text: studies were pooled regardless of intervention duration or unique characteristics, many cells had insufficient responses for pooled ES or CI, and several comparisons relied on trends or borderline significance (e.g., p = 0.055, p = 0.06–0.12).
Model-written summary. Check it against the paper before relying on it.
Integrity signals
Registry
Cites
Statistics
Figures
Verification
Claims the paper makes
97 Own result · 25 No basis given · 20 Own method · 16 Not checked yet · 15 Own interpretation
The paper states this without a source or data behind it here, so there is nothing to check it against. The quote shows it is in the paper.
In the paper
“First, hypocaloric balance is necessary for changing body composition, but the effectiveness for establishing imbalance does not equate with the effectiveness for body compositional changes, or any biomarkers associated with metabolic issues.”
§ Diet, exercise or diet with exercise: comparing the effectiveness of treatment options for weight-loss and changes in fitness for adults (18–65 years old) who are overfat, or obese; systematic review and meta-analysis > Abstract
plain- Asserted: passes — The authors put it forward as true.
- Checkable: passes — It can be checked against evidence.
- Load-bearing: passes — The paper’s conclusions depend on it.
- Based: passes — The paper gives a reason why it holds.
A result the paper reports from its own data — it cites no other source for it, so there is none to check. The quote shows it is in the paper.
In the paper
“Even though generally lower ES than RT, the inclusion of ET was more effective when performed at high intensity (e.g. ≥70% VO2max or HRmax for 30-minutes 3-4x’s/wk), or in an interval training style than when utilizing the relatively common prescribed method of low-to-moderate (e.g., 50-70% VO2max or HRmax for at least equal time) steady state method, ES of 0.35, 0.39, and 0.13 for BM, FM, and FFM”
§ Diet, exercise or diet with exercise: comparing the effectiveness of treatment options for weight-loss and changes in fitness for adults (18–65 years old) who are overfat, or obese; systematic review and meta-analysis > Abstract
plaindirect- Asserted: passes — The authors put it forward as true.
- Checkable: passes — It can be checked against evidence.
- Load-bearing: passes — The paper’s conclusions depend on it.
- Based: passes — The paper gives a reason why it holds.
The paper states this without a source or data behind it here, so there is nothing to check it against. The quote shows it is in the paper.
In the paper
“Additionally RT was more effective at reducing fasting insulin levels (ES = 3.5) than ET or ET and RT.”
§ Diet, exercise or diet with exercise: comparing the effectiveness of treatment options for weight-loss and changes in fitness for adults (18–65 years old) who are overfat, or obese; systematic review and meta-analysis > Abstract
plaindirect- Asserted: passes — The authors put it forward as true.
- Checkable: passes — It can be checked against evidence.
- Load-bearing: passes — The paper’s conclusions depend on it.
- Based: passes — The paper gives a reason why it holds.
A result the paper reports from its own data — it cites no other source for it, so there is none to check. The quote shows it is in the paper.
In the paper
“Interestingly, there were differences noted between effects favoring the combination of diet with ET versus diet alone for alterations in body mass (χ2 = 3.09, p = 0.055).”
§ Diet, exercise or diet with exercise: comparing the effectiveness of treatment options for weight-loss and changes in fitness for adults (18–65 years old) who are overfat, or obese; systematic review and meta-analysis > Results > Pooled effects
plaindirect- Asserted: passes — The authors put it forward as true.
- Checkable: passes — It can be checked against evidence.
- Load-bearing: unclear — It is unclear whether the paper’s conclusions depend on it.
- Based: passes — The paper gives a reason why it holds.
A result the paper reports from its own data — it cites no other source for it, so there is none to check. The quote shows it is in the paper.
In the paper
“When examining the effect of ET, when separated from the aspect of additional diet intervention, ET alone appears to less effective to allow for the retention of FFM than dieting alone, or in a combination with use of diet (χ2 = 7.458, p < 0.01).”
§ Diet, exercise or diet with exercise: comparing the effectiveness of treatment options for weight-loss and changes in fitness for adults (18–65 years old) who are overfat, or obese; systematic review and meta-analysis > Results > Pooled effects
hedgeddirect- Asserted: passes — The authors put it forward as true.
- Checkable: passes — It can be checked against evidence.
- Load-bearing: passes — The paper’s conclusions depend on it.
- Based: passes — The paper gives a reason why it holds.
A result the paper reports from its own data — it cites no other source for it, so there is none to check. The quote shows it is in the paper.
In the paper
“Furthermore, there were very few differences in the pooled effect size versus the diet only intervention, with difference in ES for changes of adiponectin and leptin being elicited by the use of RT, either with or without diet, trending toward significant difference, χ2 = 3.085 (p = 0.07) and χ2 = 3.45 (p = 0.06), respectively.”
§ Diet, exercise or diet with exercise: comparing the effectiveness of treatment options for weight-loss and changes in fitness for adults (18–65 years old) who are overfat, or obese; systematic review and meta-analysis > Results > Pooled effects
plain- Asserted: passes — The authors put it forward as true.
- Checkable: passes — It can be checked against evidence.
- Load-bearing: unclear — It is unclear whether the paper’s conclusions depend on it.
- Based: passes — The paper gives a reason why it holds.
A result the paper reports from its own data — it cites no other source for it, so there is none to check. The quote shows it is in the paper.
In the paper
“Along with males indicated has having a greater level of effectiveness relative to females for loss of FM and retention of FFM following an intervention of diet with combination of both ET and RT (χ2 = 3.64, p < 0.05).”
§ Diet, exercise or diet with exercise: comparing the effectiveness of treatment options for weight-loss and changes in fitness for adults (18–65 years old) who are overfat, or obese; systematic review and meta-analysis > Results > Pooled effects
hedgeddirect- Asserted: passes — The authors put it forward as true.
- Checkable: passes — It can be checked against evidence.
- Load-bearing: passes — The paper’s conclusions depend on it.
- Based: passes — The paper gives a reason why it holds.
A result the paper reports from its own data — it cites no other source for it, so there is none to check. The quote shows it is in the paper.
In the paper
“And differences indicate an effectiveness favoring for the combination of diet with RT versus diet along for reduction in FM (χ2 = 3.8, p < 0.05) and retention of FFM (χ2 = 6.7, p < 0.0001).”
§ Diet, exercise or diet with exercise: comparing the effectiveness of treatment options for weight-loss and changes in fitness for adults (18–65 years old) who are overfat, or obese; systematic review and meta-analysis > Results > Pooled effects
hedgeddirect- Asserted: passes — The authors put it forward as true.
- Checkable: passes — It can be checked against evidence.
- Load-bearing: passes — The paper’s conclusions depend on it.
- Based: passes — The paper gives a reason why it holds.
A result the paper reports from its own data — it cites no other source for it, so there is none to check. The quote shows it is in the paper.
In the paper
“Lastly, as related to changes in caloric (energetic) balance there were no differences noted between any of the pooled ES for the assumed differences in energetic balance across the various treatment interventions.”
§ Diet, exercise or diet with exercise: comparing the effectiveness of treatment options for weight-loss and changes in fitness for adults (18–65 years old) who are overfat, or obese; systematic review and meta-analysis > Results > Pooled effects
plain- Asserted: passes — The authors put it forward as true.
- Checkable: passes — It can be checked against evidence.
- Load-bearing: unclear — It is unclear whether the paper’s conclusions depend on it.
- Based: passes — The paper gives a reason why it holds.
- The authors state this as an assumption: There are differences in energetic balance across the various treatment interventions.
A result the paper reports from its own data — it cites no other source for it, so there is none to check. The quote shows it is in the paper.
In the paper
“Along with males indicated has having a greater level of effectiveness relative to females for loss of FM and retention of FFM following an intervention of diet with combination of both ET and RT (χ2 = 3.64, p < 0.05).”
§ Diet, exercise or diet with exercise: comparing the effectiveness of treatment options for weight-loss and changes in fitness for adults (18–65 years old) who are overfat, or obese; systematic review and meta-analysis > Results > Pooled effects
hedgeddirect- Asserted: passes — The authors put it forward as true.
- Checkable: passes — It can be checked against evidence.
- Load-bearing: passes — The paper’s conclusions depend on it.
- Based: passes — The paper gives a reason why it holds.
A result the paper reports from its own data — it cites no other source for it, so there is none to check. The quote shows it is in the paper.
In the paper
“Where males tend to have a larger pooled ES for responses to diet with RT retention of FFM and reduction in FM relative to female groups (χ2 = 3.94, and 3.64, p < 0.05, respectively).”
§ Diet, exercise or diet with exercise: comparing the effectiveness of treatment options for weight-loss and changes in fitness for adults (18–65 years old) who are overfat, or obese; systematic review and meta-analysis > Results > Pooled effects
hedgedcorrelational- Asserted: passes — The authors put it forward as true.
- Checkable: passes — It can be checked against evidence.
- Load-bearing: unclear — It is unclear whether the paper’s conclusions depend on it.
- Based: passes — The paper gives a reason why it holds.
A result the paper reports from its own data — it cites no other source for it, so there is none to check. The quote shows it is in the paper.
In the paper
“Yet trended toward favoring ET for effectiveness in changes seen in HDL (χ2 = 2.842, p = 0.089).”
§ Diet, exercise or diet with exercise: comparing the effectiveness of treatment options for weight-loss and changes in fitness for adults (18–65 years old) who are overfat, or obese; systematic review and meta-analysis > Results > Pooled effects
hedgedconditional- Asserted: passes — The authors put it forward as true.
- Checkable: passes — It can be checked against evidence.
- Load-bearing: unclear — It is unclear whether the paper’s conclusions depend on it.
- Based: passes — The paper gives a reason why it holds.
A result the paper reports from its own data — it cites no other source for it, so there is none to check. The quote shows it is in the paper.
In the paper
“Furthermore, there were very few differences in the pooled effect size versus the diet only intervention, with difference in ES for changes of adiponectin and leptin being elicited by the use of RT, either with or without diet, trending toward significant difference, χ2 = 3.085 (p = 0.07) and χ2 = 3.45 (p = 0.06), respectively.”
§ Diet, exercise or diet with exercise: comparing the effectiveness of treatment options for weight-loss and changes in fitness for adults (18–65 years old) who are overfat, or obese; systematic review and meta-analysis > Results > Pooled effects
hedgedcorrelational- Asserted: passes — The authors put it forward as true.
- Checkable: passes — It can be checked against evidence.
- Load-bearing: unclear — It is unclear whether the paper’s conclusions depend on it.
- Based: passes — The paper gives a reason why it holds.
A result the paper reports from its own data — it cites no other source for it, so there is none to check. The quote shows it is in the paper.
In the paper
“With no significant difference noted between the effectiveness for diet with ET or diet with RT for alterations to BM, but a difference for effectiveness that favors RT over ET for FFM retention (χ2 = 10.15, p < 0.01).”
§ Diet, exercise or diet with exercise: comparing the effectiveness of treatment options for weight-loss and changes in fitness for adults (18–65 years old) who are overfat, or obese; systematic review and meta-analysis > Results > Pooled effects
plaindirect- Asserted: passes — The authors put it forward as true.
- Checkable: passes — It can be checked against evidence.
- Load-bearing: passes — The paper’s conclusions depend on it.
- Based: passes — The paper gives a reason why it holds.
A result the paper reports from its own data — it cites no other source for it, so there is none to check. The quote shows it is in the paper.
In the paper
“While females trended toward having a larger pooled ES for responses to diet alone, χ2 = 2.09 (p = 0.11), and in combination to ET for reduction in total body mass, χ2 = 1.94 (p = 0.12), and FM, χ2 = 3.1 (p = 0.09), but not FFM.”
§ Diet, exercise or diet with exercise: comparing the effectiveness of treatment options for weight-loss and changes in fitness for adults (18–65 years old) who are overfat, or obese; systematic review and meta-analysis > Results > Pooled effects
plain- Asserted: passes — The authors put it forward as true.
- Checkable: passes — It can be checked against evidence.
- Load-bearing: unclear — It is unclear whether the paper’s conclusions depend on it.
- Based: passes — The paper gives a reason why it holds.
A result the paper reports from its own data — it cites no other source for it, so there is none to check. The quote shows it is in the paper.
In the paper
“While females trended toward having a larger pooled ES for responses to diet alone, χ2 = 2.09 (p = 0.11), and in combination to ET for reduction in total body mass, χ2 = 1.94 (p = 0.12), and FM, χ2 = 3.1 (p = 0.09), but not FFM.”
§ Diet, exercise or diet with exercise: comparing the effectiveness of treatment options for weight-loss and changes in fitness for adults (18–65 years old) who are overfat, or obese; systematic review and meta-analysis > Results > Pooled effects
hedgedcorrelational- Asserted: passes — The authors put it forward as true.
- Checkable: passes — It can be checked against evidence.
- Load-bearing: unclear — It is unclear whether the paper’s conclusions depend on it.
- Based: passes — The paper gives a reason why it holds.
A result the paper reports from its own data — it cites no other source for it, so there is none to check. The quote shows it is in the paper.
In the paper
“Additionally, there were no differences noted on the pooled effect for treatment based on the gender of the participant groups for any of the treatment intervention options.”
§ Diet, exercise or diet with exercise: comparing the effectiveness of treatment options for weight-loss and changes in fitness for adults (18–65 years old) who are overfat, or obese; systematic review and meta-analysis > Results > Pooled effects
plain- Asserted: passes — The authors put it forward as true.
- Checkable: passes — It can be checked against evidence.
- Load-bearing: unclear — It is unclear whether the paper’s conclusions depend on it.
- Based: passes — The paper gives a reason why it holds.
A result the paper reports from its own data — it cites no other source for it, so there is none to check. The quote shows it is in the paper.
In the paper
“While the use of RT, both alone as well as in combination with diet provides greater stimulus for retention of FFM (χ2 = 3.5, p < 0.05).”
§ Diet, exercise or diet with exercise: comparing the effectiveness of treatment options for weight-loss and changes in fitness for adults (18–65 years old) who are overfat, or obese; systematic review and meta-analysis > Results > Pooled effects
plaindirect- Asserted: passes — The authors put it forward as true.
- Checkable: passes — It can be checked against evidence.
- Load-bearing: passes — The paper’s conclusions depend on it.
- Based: passes — The paper gives a reason why it holds.
A result the paper reports from its own data — it cites no other source for it, so there is none to check. The quote shows it is in the paper.
In the paper
“While there were no differences noted between the therapeutic effectiveness for treatment in the responses to either CRP or TNF-α between any of the combinations for interventions.”
§ Diet, exercise or diet with exercise: comparing the effectiveness of treatment options for weight-loss and changes in fitness for adults (18–65 years old) who are overfat, or obese; systematic review and meta-analysis > Results > Pooled effects
plain- Asserted: passes — The authors put it forward as true.
- Checkable: passes — It can be checked against evidence.
- Load-bearing: unclear — It is unclear whether the paper’s conclusions depend on it.
- Based: passes — The paper gives a reason why it holds.
A result the paper reports from its own data — it cites no other source for it, so there is none to check. The quote shows it is in the paper.
In the paper
“With no significant difference noted between the effectiveness for diet with ET or diet with RT for alterations to BM, but a difference for effectiveness that favors RT over ET for FFM retention (χ2 = 10.15, p < 0.01).”
§ Diet, exercise or diet with exercise: comparing the effectiveness of treatment options for weight-loss and changes in fitness for adults (18–65 years old) who are overfat, or obese; systematic review and meta-analysis > Results > Pooled effects
plain- Asserted: passes — The authors put it forward as true.
- Checkable: passes — It can be checked against evidence.
- Load-bearing: passes — The paper’s conclusions depend on it.
- Based: passes — The paper gives a reason why it holds.
A result the paper reports from its own data — it cites no other source for it, so there is none to check. The quote shows it is in the paper.
In the paper
“Where males tend to have a larger pooled ES for responses to diet with RT retention of FFM and reduction in FM relative to female groups (χ2 = 3.94, and 3.64, p < 0.05, respectively).”
§ Diet, exercise or diet with exercise: comparing the effectiveness of treatment options for weight-loss and changes in fitness for adults (18–65 years old) who are overfat, or obese; systematic review and meta-analysis > Results > Pooled effects
hedgedcorrelational- Asserted: passes — The authors put it forward as true.
- Checkable: passes — It can be checked against evidence.
- Load-bearing: unclear — It is unclear whether the paper’s conclusions depend on it.
- Based: passes — The paper gives a reason why it holds.
A result the paper reports from its own data — it cites no other source for it, so there is none to check. The quote shows it is in the paper.
In the paper
“The responses invoked by RT, whether alone or in combination with diet, showed a greater effectiveness for eliciting changes in TC and LDL relative to the diet only options (χ2 = 7.18, 4.95, respectively) and trends toward significance for HDL (χ2 = 3.38, p = 0.068).”
§ Diet, exercise or diet with exercise: comparing the effectiveness of treatment options for weight-loss and changes in fitness for adults (18–65 years old) who are overfat, or obese; systematic review and meta-analysis > Results > Pooled effects
plaindirect- Asserted: passes — The authors put it forward as true.
- Checkable: passes — It can be checked against evidence.
- Load-bearing: passes — The paper’s conclusions depend on it.
- Based: passes — The paper gives a reason why it holds.
A result the paper reports from its own data — it cites no other source for it, so there is none to check. The quote shows it is in the paper.
In the paper
“Furthermore, there were very few differences in the pooled effect size versus the diet only intervention, with difference in ES for changes of adiponectin and leptin being elicited by the use of RT, either with or without diet, trending toward significant difference, χ2 = 3.085 (p = 0.07) and χ2 = 3.45 (p = 0.06), respectively.”
§ Diet, exercise or diet with exercise: comparing the effectiveness of treatment options for weight-loss and changes in fitness for adults (18–65 years old) who are overfat, or obese; systematic review and meta-analysis > Results > Pooled effects
hedgedcorrelational- Asserted: passes — The authors put it forward as true.
- Checkable: passes — It can be checked against evidence.
- Load-bearing: unclear — It is unclear whether the paper’s conclusions depend on it.
- Based: passes — The paper gives a reason why it holds.
A result the paper reports from its own data — it cites no other source for it, so there is none to check. The quote shows it is in the paper.
In the paper
“However there was a trend for women utilizing ET in combination with diet for having a great effect in the changes in HDL levels versus those seen in men (χ2 = 2.0, p = 0.12).”
§ Diet, exercise or diet with exercise: comparing the effectiveness of treatment options for weight-loss and changes in fitness for adults (18–65 years old) who are overfat, or obese; systematic review and meta-analysis > Results > Pooled effects
hedgedcorrelational- Asserted: passes — The authors put it forward as true.
- Checkable: passes — It can be checked against evidence.
- Load-bearing: unclear — It is unclear whether the paper’s conclusions depend on it.
- Based: passes — The paper gives a reason why it holds.
A result the paper reports from its own data — it cites no other source for it, so there is none to check. The quote shows it is in the paper.
In the paper
“And differences indicate an effectiveness favoring for the combination of diet with RT versus diet along for reduction in FM (χ2 = 3.8, p < 0.05) and retention of FFM (χ2 = 6.7, p < 0.0001).”
§ Diet, exercise or diet with exercise: comparing the effectiveness of treatment options for weight-loss and changes in fitness for adults (18–65 years old) who are overfat, or obese; systematic review and meta-analysis > Results > Pooled effects
hedgeddirect- Asserted: passes — The authors put it forward as true.
- Checkable: passes — It can be checked against evidence.
- Load-bearing: passes — The paper’s conclusions depend on it.
- Based: passes — The paper gives a reason why it holds.
A result the paper reports from its own data — it cites no other source for it, so there is none to check. The quote shows it is in the paper.
In the paper
“But showed no difference to the responses invoked by ET, either with or without the combination of diet.”
§ Diet, exercise or diet with exercise: comparing the effectiveness of treatment options for weight-loss and changes in fitness for adults (18–65 years old) who are overfat, or obese; systematic review and meta-analysis > Results > Pooled effects
plain- Asserted: passes — The authors put it forward as true.
- Checkable: passes — It can be checked against evidence.
- Load-bearing: passes — The paper’s conclusions depend on it.
- Based: passes — The paper gives a reason why it holds.
A result the paper reports from its own data — it cites no other source for it, so there is none to check. The quote shows it is in the paper.
In the paper
“Similar to the changes seen with blood lipids, effectiveness for eliciting positive changes to adipokines (adiponectin and leptin) or cytokines (c-reactive protein (CRP), TNF-α) of interest were noted occurring from all treatment interventions.”
§ Diet, exercise or diet with exercise: comparing the effectiveness of treatment options for weight-loss and changes in fitness for adults (18–65 years old) who are overfat, or obese; systematic review and meta-analysis > Results > Pooled effects
plaindirect- Asserted: passes — The authors put it forward as true.
- Checkable: passes — It can be checked against evidence.
- Load-bearing: unclear — It is unclear whether the paper’s conclusions depend on it.
- Based: passes — The paper gives a reason why it holds.
A result the paper reports from its own data — it cites no other source for it, so there is none to check. The quote shows it is in the paper.
In the paper
“While females trended toward having a larger pooled ES for responses to diet alone, χ2 = 2.09 (p = 0.11), and in combination to ET for reduction in total body mass, χ2 = 1.94 (p = 0.12), and FM, χ2 = 3.1 (p = 0.09), but not FFM.”
§ Diet, exercise or diet with exercise: comparing the effectiveness of treatment options for weight-loss and changes in fitness for adults (18–65 years old) who are overfat, or obese; systematic review and meta-analysis > Results > Pooled effects
hedgedcorrelational- Asserted: passes — The authors put it forward as true.
- Checkable: passes — It can be checked against evidence.
- Load-bearing: unclear — It is unclear whether the paper’s conclusions depend on it.
- Based: passes — The paper gives a reason why it holds.
A result the paper reports from its own data — it cites no other source for it, so there is none to check. The quote shows it is in the paper.
In the paper
“While females trended toward having a larger pooled ES for responses to diet alone, χ2 = 2.09 (p = 0.11), and in combination to ET for reduction in total body mass, χ2 = 1.94 (p = 0.12), and FM, χ2 = 3.1 (p = 0.09), but not FFM.”
§ Diet, exercise or diet with exercise: comparing the effectiveness of treatment options for weight-loss and changes in fitness for adults (18–65 years old) who are overfat, or obese; systematic review and meta-analysis > Results > Pooled effects
hedgedcorrelational- Asserted: passes — The authors put it forward as true.
- Checkable: passes — It can be checked against evidence.
- Load-bearing: unclear — It is unclear whether the paper’s conclusions depend on it.
- Based: passes — The paper gives a reason why it holds.
A result the paper reports from its own data — it cites no other source for it, so there is none to check. The quote shows it is in the paper.
In the paper
“The responses invoked by RT, whether alone or in combination with diet, showed a greater effectiveness for eliciting changes in TC and LDL relative to the diet only options (χ2 = 7.18, 4.95, respectively) and trends toward significance for HDL (χ2 = 3.38, p = 0.068).”
§ Diet, exercise or diet with exercise: comparing the effectiveness of treatment options for weight-loss and changes in fitness for adults (18–65 years old) who are overfat, or obese; systematic review and meta-analysis > Results > Pooled effects
hedgedconditional- Asserted: passes — The authors put it forward as true.
- Checkable: passes — It can be checked against evidence.
- Load-bearing: unclear — It is unclear whether the paper’s conclusions depend on it.
- Based: passes — The paper gives a reason why it holds.
A result the paper reports from its own data — it cites no other source for it, so there is none to check. The quote shows it is in the paper.
In the paper
“The responses invoked by RT, whether alone or in combination with diet, showed a greater effectiveness for eliciting changes in TC and LDL relative to the diet only options (χ2 = 7.18, 4.95, respectively) and trends toward significance for HDL (χ2 = 3.38, p = 0.068).”
§ Diet, exercise or diet with exercise: comparing the effectiveness of treatment options for weight-loss and changes in fitness for adults (18–65 years old) who are overfat, or obese; systematic review and meta-analysis > Results > Pooled effects
plaindirect- Asserted: passes — The authors put it forward as true.
- Checkable: passes — It can be checked against evidence.
- Load-bearing: passes — The paper’s conclusions depend on it.
- Based: passes — The paper gives a reason why it holds.
A result the paper reports from its own data — it cites no other source for it, so there is none to check. The quote shows it is in the paper.
In the paper
“While the use of ET either alone, or in combination with diet, show no difference for effectiveness at eliciting changes blood lipids (TC, LDL and TG) versus the changes elicited by a diet only intervention.”
§ Diet, exercise or diet with exercise: comparing the effectiveness of treatment options for weight-loss and changes in fitness for adults (18–65 years old) who are overfat, or obese; systematic review and meta-analysis > Results > Pooled effects
plain- Asserted: passes — The authors put it forward as true.
- Checkable: passes — It can be checked against evidence.
- Load-bearing: passes — The paper’s conclusions depend on it.
- Based: passes — The paper gives a reason why it holds.
A result the paper reports from its own data — it cites no other source for it, so there is none to check. The quote shows it is in the paper.
In the paper
“While the diet only intervention did have a positive impact on TC and HDL levels”
§ Diet, exercise or diet with exercise: comparing the effectiveness of treatment options for weight-loss and changes in fitness for adults (18–65 years old) who are overfat, or obese; systematic review and meta-analysis > Results > Comparison between treatment effects
plaindirect- Asserted: passes — The authors put it forward as true.
- Checkable: passes — It can be checked against evidence.
- Load-bearing: passes — The paper’s conclusions depend on it.
- Based: passes — The paper gives a reason why it holds.
A result the paper reports from its own data — it cites no other source for it, so there is none to check. The quote shows it is in the paper.
In the paper
“there appears to be a pattern where the induction for changes in lipid profiles cannot be established through the use of ET only for all measures.”
§ Diet, exercise or diet with exercise: comparing the effectiveness of treatment options for weight-loss and changes in fitness for adults (18–65 years old) who are overfat, or obese; systematic review and meta-analysis > Results > Comparison between treatment effects
hedged- Asserted: passes — The authors put it forward as true.
- Checkable: passes — It can be checked against evidence.
- Load-bearing: passes — The paper’s conclusions depend on it.
- Based: passes — The paper gives a reason why it holds.
The paper states this without a source or data behind it here, so there is nothing to check it against. The quote shows it is in the paper.
In the paper
“there is also a very interesting finding that therapeutic interventions may actually induce elevations in certain lipids.”
§ Diet, exercise or diet with exercise: comparing the effectiveness of treatment options for weight-loss and changes in fitness for adults (18–65 years old) who are overfat, or obese; systematic review and meta-analysis > Results > Comparison between treatment effects
hedgedconditional- Asserted: passes — The authors put it forward as true.
- Checkable: passes — It can be checked against evidence.
- Load-bearing: unclear — It is unclear whether the paper’s conclusions depend on it.
- Based: passes — The paper gives a reason why it holds.
A result the paper reports from its own data — it cites no other source for it, so there is none to check. The quote shows it is in the paper.
In the paper
“As far as changes in TG, diet with combination of RT appears be the least effective for inducing changes relative to either the diet only or the diet with combination of ET”
§ Diet, exercise or diet with exercise: comparing the effectiveness of treatment options for weight-loss and changes in fitness for adults (18–65 years old) who are overfat, or obese; systematic review and meta-analysis > Results > Comparison between treatment effects
hedgeddirect- Asserted: passes — The authors put it forward as true.
- Checkable: passes — It can be checked against evidence.
- Load-bearing: passes — The paper’s conclusions depend on it.
- Based: passes — The paper gives a reason why it holds.
A result the paper reports from its own data — it cites no other source for it, so there is none to check. The quote shows it is in the paper.
In the paper
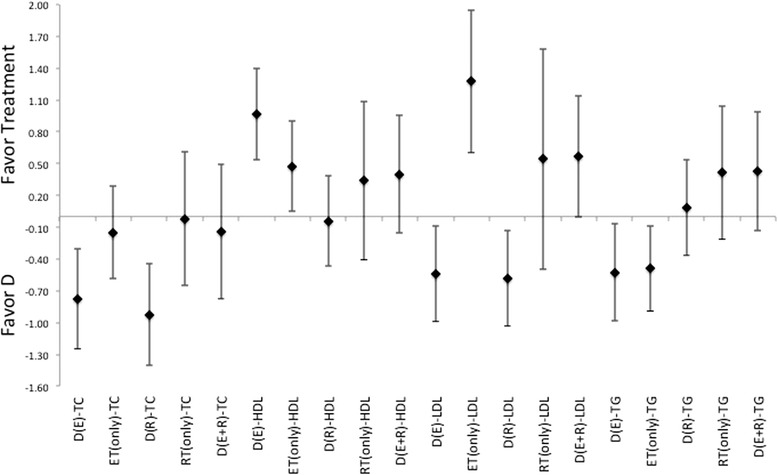
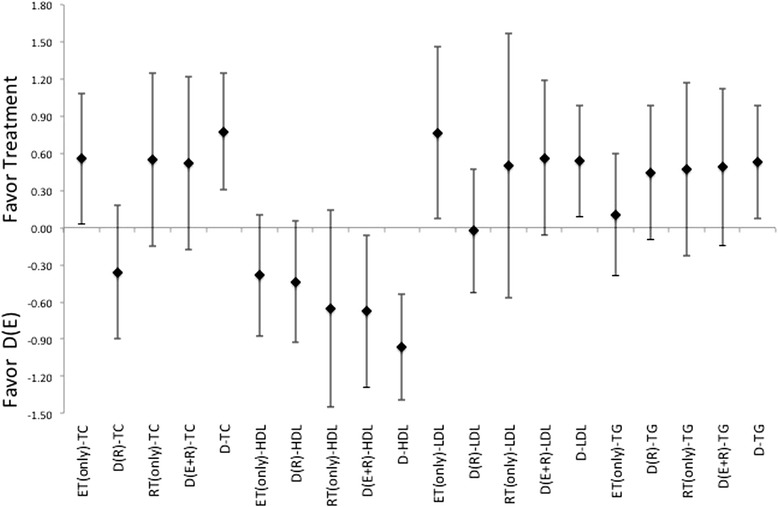
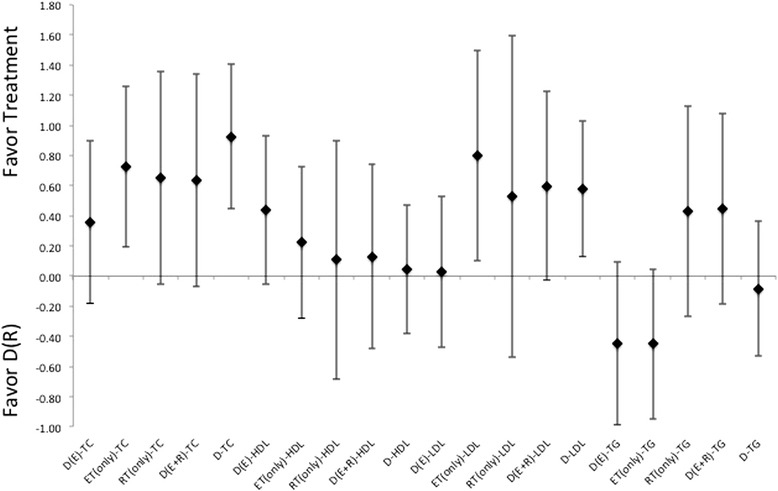
“the treatment interventions that combined diet with ET induced a much larger ES, Figure 4, for measures TC and LDL.”
§ Diet, exercise or diet with exercise: comparing the effectiveness of treatment options for weight-loss and changes in fitness for adults (18–65 years old) who are overfat, or obese; systematic review and meta-analysis > Results > Comparison between treatment effects
plaindirect- Asserted: passes — The authors put it forward as true.
- Checkable: passes — It can be checked against evidence.
- Load-bearing: passes — The paper’s conclusions depend on it.
- Based: passes — The paper gives a reason why it holds.
A result the paper reports from its own data — it cites no other source for it, so there is none to check. The quote shows it is in the paper.
In the paper
“With respect to the combination of diet and RT, this intervention appears to be able to induce favorable adaptions in, measurements of both FM and FFM (χ2 = 9.24 and χ2 = 8.02, p < 0.01, respectively).”
§ Diet, exercise or diet with exercise: comparing the effectiveness of treatment options for weight-loss and changes in fitness for adults (18–65 years old) who are overfat, or obese; systematic review and meta-analysis > Results > Comparison between treatment effects
hedgedconditional- Asserted: passes — The authors put it forward as true.
- Checkable: passes — It can be checked against evidence.
- Load-bearing: passes — The paper’s conclusions depend on it.
- Based: passes — The paper gives a reason why it holds.
A result the paper reports from its own data — it cites no other source for it, so there is none to check. The quote shows it is in the paper.
In the paper
“In continuation with what was noted in the pooled therapeutic effect size, a trend toward gender difference for effectiveness of treatment was noted in the change in FFM for the utilization of diet with RT only in male groups versus female counterparts (χ2 = 3.3, p = 0.06).”
§ Diet, exercise or diet with exercise: comparing the effectiveness of treatment options for weight-loss and changes in fitness for adults (18–65 years old) who are overfat, or obese; systematic review and meta-analysis > Results > Comparison between treatment effects
hedgedcorrelational- Asserted: passes — The authors put it forward as true.
- Checkable: passes — It can be checked against evidence.
- Load-bearing: unclear — It is unclear whether the paper’s conclusions depend on it.
- Based: passes — The paper gives a reason why it holds.
A result the paper reports from its own data — it cites no other source for it, so there is none to check. The quote shows it is in the paper.
In the paper
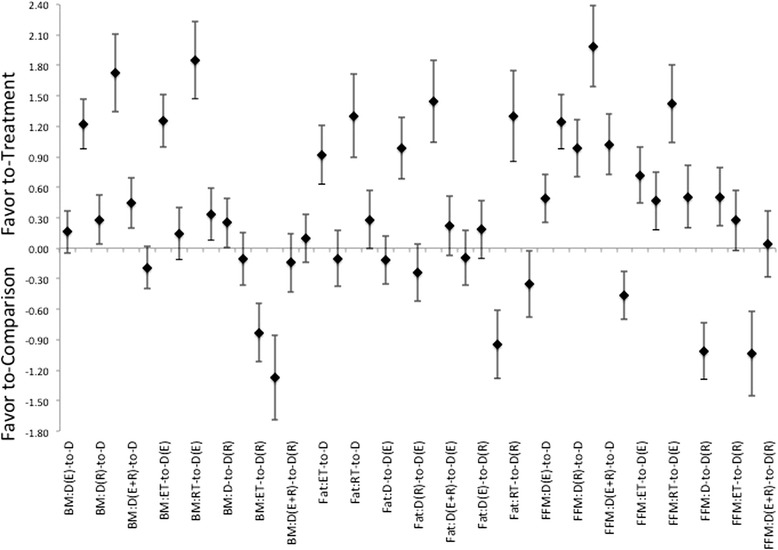
“While a diet alone treatment did induce a beneficial treatment effect following intervention. It was not more effective than other treatments at inducing changes in FM, see Figure 2.”
§ Diet, exercise or diet with exercise: comparing the effectiveness of treatment options for weight-loss and changes in fitness for adults (18–65 years old) who are overfat, or obese; systematic review and meta-analysis > Results > Comparison between treatment effects
plain- Asserted: passes — The authors put it forward as true.
- Checkable: passes — It can be checked against evidence.
- Load-bearing: passes — The paper’s conclusions depend on it.
- Based: passes — The paper gives a reason why it holds.
A result the paper reports from its own data — it cites no other source for it, so there is none to check. The quote shows it is in the paper.
In the paper
“it has only minimal impact on either LDL or TG levels”
§ Diet, exercise or diet with exercise: comparing the effectiveness of treatment options for weight-loss and changes in fitness for adults (18–65 years old) who are overfat, or obese; systematic review and meta-analysis > Results > Comparison between treatment effects
plain- Asserted: passes — The authors put it forward as true.
- Checkable: passes — It can be checked against evidence.
- Load-bearing: passes — The paper’s conclusions depend on it.
- Based: passes — The paper gives a reason why it holds.
A result the paper reports from its own data — it cites no other source for it, so there is none to check. The quote shows it is in the paper.
In the paper
“diet with combination of RT was able to produce a much lager ES for these measures in comparison to those induced by diet with combination of ET, for each of these measures”
§ Diet, exercise or diet with exercise: comparing the effectiveness of treatment options for weight-loss and changes in fitness for adults (18–65 years old) who are overfat, or obese; systematic review and meta-analysis > Results > Comparison between treatment effects
plaindirect- Asserted: passes — The authors put it forward as true.
- Checkable: passes — It can be checked against evidence.
- Load-bearing: passes — The paper’s conclusions depend on it.
- Based: passes — The paper gives a reason why it holds.
A result the paper reports from its own data — it cites no other source for it, so there is none to check. The quote shows it is in the paper.
In the paper
“While producing equivalent ES for body mass changes as either diet alone, or diet in combination with ET, see Figure 2.”
§ Diet, exercise or diet with exercise: comparing the effectiveness of treatment options for weight-loss and changes in fitness for adults (18–65 years old) who are overfat, or obese; systematic review and meta-analysis > Results > Comparison between treatment effects
plain- Asserted: passes — The authors put it forward as true.
- Checkable: passes — It can be checked against evidence.
- Load-bearing: passes — The paper’s conclusions depend on it.
- Based: passes — The paper gives a reason why it holds.
A result the paper reports from its own data — it cites no other source for it, so there is none to check. The quote shows it is in the paper.
In the paper
“With respect to the combination of diet and RT, this intervention appears to be able to induce favorable adaptions in, measurements of both FM and FFM (χ2 = 9.24 and χ2 = 8.02, p < 0.01, respectively).”
§ Diet, exercise or diet with exercise: comparing the effectiveness of treatment options for weight-loss and changes in fitness for adults (18–65 years old) who are overfat, or obese; systematic review and meta-analysis > Results > Comparison between treatment effects
hedgedconditional- Asserted: passes — The authors put it forward as true.
- Checkable: passes — It can be checked against evidence.
- Load-bearing: passes — The paper’s conclusions depend on it.
- Based: passes — The paper gives a reason why it holds.
A result the paper reports from its own data — it cites no other source for it, so there is none to check. The quote shows it is in the paper.
In the paper
“Interestingly, there were no differences noted showing a favor toward the combination of diet with both ET and RT versus the other intervention methods.”
§ Diet, exercise or diet with exercise: comparing the effectiveness of treatment options for weight-loss and changes in fitness for adults (18–65 years old) who are overfat, or obese; systematic review and meta-analysis > Results > Comparison between treatment effects
plain- Asserted: passes — The authors put it forward as true.
- Checkable: passes — It can be checked against evidence.
- Load-bearing: passes — The paper’s conclusions depend on it.
- Based: passes — The paper gives a reason why it holds.
A result the paper reports from its own data — it cites no other source for it, so there is none to check. The quote shows it is in the paper.
In the paper
“RT is the only intervention that appears to be slightly more effective than diet alone or diet in combination of ET for changes in HDL and TG”
§ Diet, exercise or diet with exercise: comparing the effectiveness of treatment options for weight-loss and changes in fitness for adults (18–65 years old) who are overfat, or obese; systematic review and meta-analysis > Results > Comparison between treatment effects
hedgeddirect- Asserted: passes — The authors put it forward as true.
- Checkable: passes — It can be checked against evidence.
- Load-bearing: passes — The paper’s conclusions depend on it.
- Based: passes — The paper gives a reason why it holds.
A result the paper reports from its own data — it cites no other source for it, so there is none to check. The quote shows it is in the paper.
In the paper
“In comparison of body compositional changes based on the method of intervention, as would be expected, there are effect size differences in treatment responses that favor the combination of intervention methods.”
§ Diet, exercise or diet with exercise: comparing the effectiveness of treatment options for weight-loss and changes in fitness for adults (18–65 years old) who are overfat, or obese; systematic review and meta-analysis > Results > Comparison between treatment effects
plaindirect- Asserted: passes — The authors put it forward as true.
- Checkable: passes — It can be checked against evidence.
- Load-bearing: passes — The paper’s conclusions depend on it.
- Based: passes — The paper gives a reason why it holds.
A result the paper reports from its own data — it cites no other source for it, so there is none to check. The quote shows it is in the paper.
In the paper
“Additionally, there were no differences between gender groups that would indicate a greater effectiveness of a treatment methodology for a specific gender grouping.”
§ Diet, exercise or diet with exercise: comparing the effectiveness of treatment options for weight-loss and changes in fitness for adults (18–65 years old) who are overfat, or obese; systematic review and meta-analysis > Results > Comparison between treatment effects
hedged- Asserted: passes — The authors put it forward as true.
- Checkable: passes — It can be checked against evidence.
- Load-bearing: unclear — It is unclear whether the paper’s conclusions depend on it.
- Based: passes — The paper gives a reason why it holds.
A result the paper reports from its own data — it cites no other source for it, so there is none to check. The quote shows it is in the paper.
In the paper
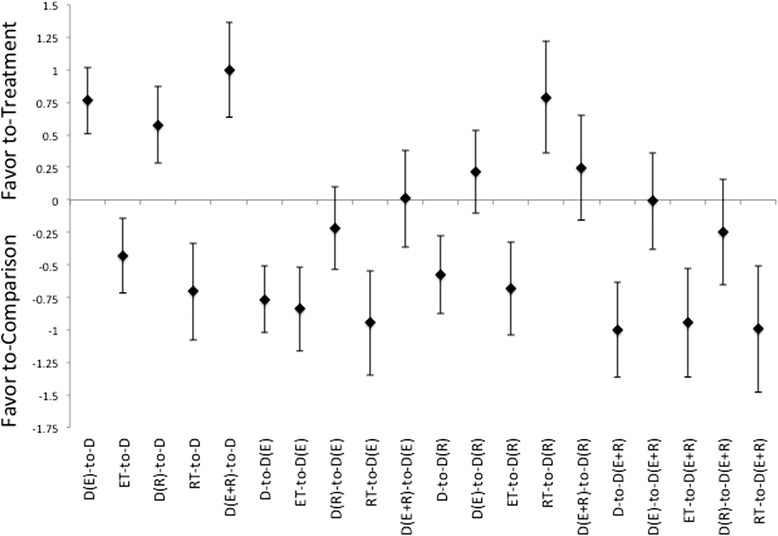
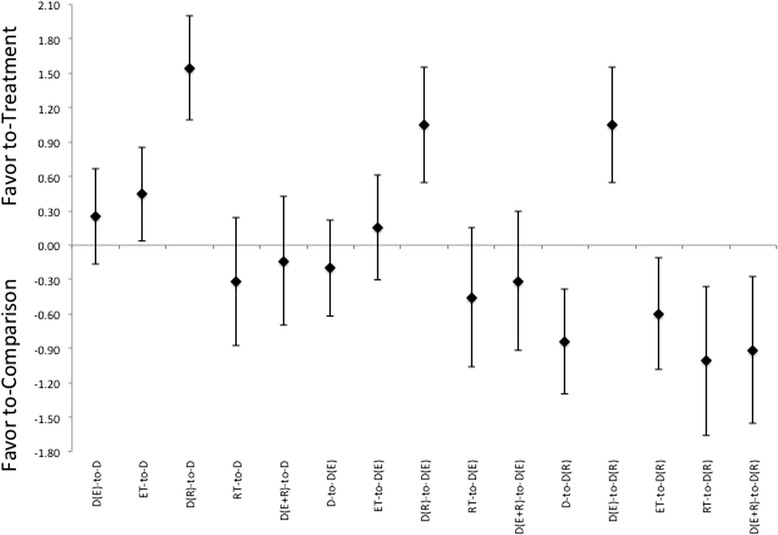
“Eliciting energetic imbalance indicates a pattern that favors an intervention that is a combination of diet with any type of exercise versus that of either diet, or exercise, alone, Figure 3.”
§ Diet, exercise or diet with exercise: comparing the effectiveness of treatment options for weight-loss and changes in fitness for adults (18–65 years old) who are overfat, or obese; systematic review and meta-analysis > Results > Comparison between treatment effects
hedgeddirect- Asserted: passes — The authors put it forward as true.
- Checkable: passes — It can be checked against evidence.
- Load-bearing: passes — The paper’s conclusions depend on it.
- Based: passes — The paper gives a reason why it holds.
A result the paper reports from its own data — it cites no other source for it, so there is none to check. The quote shows it is in the paper.
In the paper
“ET appears to be effective at inducing a larger loss of FFM relative to diet with combination of RT (χ2 = 6.531, p = 0.01).”
§ Diet, exercise or diet with exercise: comparing the effectiveness of treatment options for weight-loss and changes in fitness for adults (18–65 years old) who are overfat, or obese; systematic review and meta-analysis > Results > Comparison between treatment effects
hedgedconditional- Asserted: passes — The authors put it forward as true.
- Checkable: passes — It can be checked against evidence.
- Load-bearing: passes — The paper’s conclusions depend on it.
- Based: passes — The paper gives a reason why it holds.
A result the paper reports from its own data — it cites no other source for it, so there is none to check. The quote shows it is in the paper.
In the paper
“While the combination of diet and ET was not as effective as any of the other treatments with respect to changing of body composition.”
§ Diet, exercise or diet with exercise: comparing the effectiveness of treatment options for weight-loss and changes in fitness for adults (18–65 years old) who are overfat, or obese; systematic review and meta-analysis > Results > Comparison between treatment effects
plaindirect- Asserted: passes — The authors put it forward as true.
- Checkable: passes — It can be checked against evidence.
- Load-bearing: passes — The paper’s conclusions depend on it.
- Based: passes — The paper gives a reason why it holds.
A result the paper reports from its own data — it cites no other source for it, so there is none to check. The quote shows it is in the paper.
In the paper
“diet in combination with RT induces a larger ES in TC, HDL, LDL and TG changes relative to those changes seen in diet only treatments”
§ Diet, exercise or diet with exercise: comparing the effectiveness of treatment options for weight-loss and changes in fitness for adults (18–65 years old) who are overfat, or obese; systematic review and meta-analysis > Results > Comparison between treatment effects
plaindirect- Asserted: passes — The authors put it forward as true.
- Checkable: passes — It can be checked against evidence.
- Load-bearing: passes — The paper’s conclusions depend on it.
- Based: passes — The paper gives a reason why it holds.
A result the paper reports from its own data — it cites no other source for it, so there is none to check. The quote shows it is in the paper.
In the paper
“Furthermore, the treatment ES for energetic imbalance for the combination of diet and ET were more favorable than any other treatment intervention combinations.”
§ Diet, exercise or diet with exercise: comparing the effectiveness of treatment options for weight-loss and changes in fitness for adults (18–65 years old) who are overfat, or obese; systematic review and meta-analysis > Results > Comparison between treatment effects
plaindirect- Asserted: passes — The authors put it forward as true.
- Checkable: passes — It can be checked against evidence.
- Load-bearing: passes — The paper’s conclusions depend on it.
- Based: passes — The paper gives a reason why it holds.
A result the paper reports from its own data — it cites no other source for it, so there is none to check. The quote shows it is in the paper.
In the paper
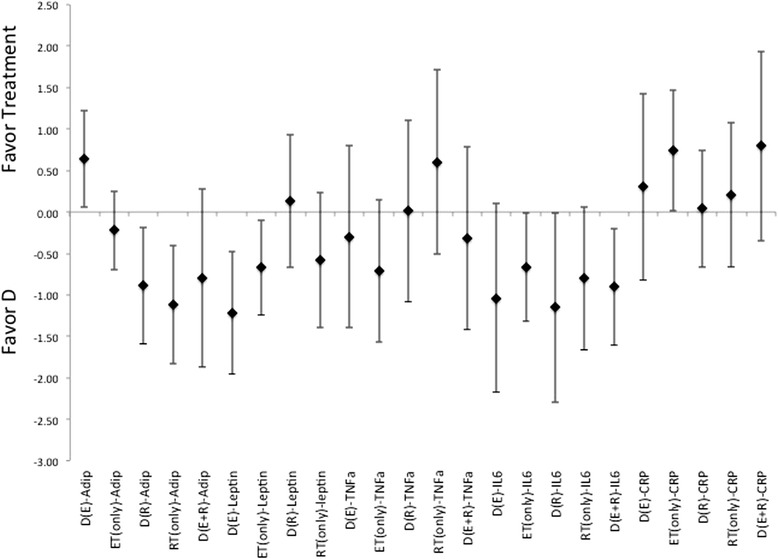
“There were highly variable responses for effectiveness for each treatment method to induce changes to circulating levels of adiponectin, leptin, TNF-α, or CRP”
§ Diet, exercise or diet with exercise: comparing the effectiveness of treatment options for weight-loss and changes in fitness for adults (18–65 years old) who are overfat, or obese; systematic review and meta-analysis > Results > Comparison between treatment effects
plain- Asserted: passes — The authors put it forward as true.
- Checkable: passes — It can be checked against evidence.
- Load-bearing: unclear — It is unclear whether the paper’s conclusions depend on it.
- Based: passes — The paper gives a reason why it holds.
A result the paper reports from its own data — it cites no other source for it, so there is none to check. The quote shows it is in the paper.
In the paper
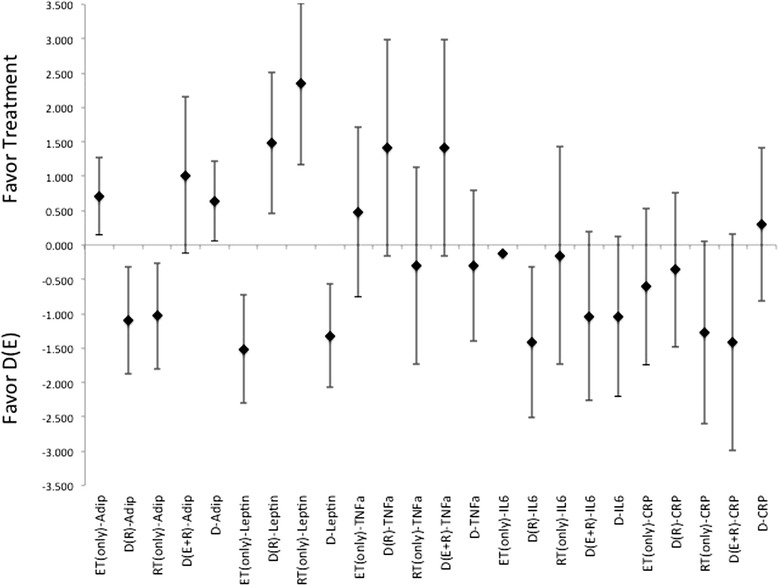
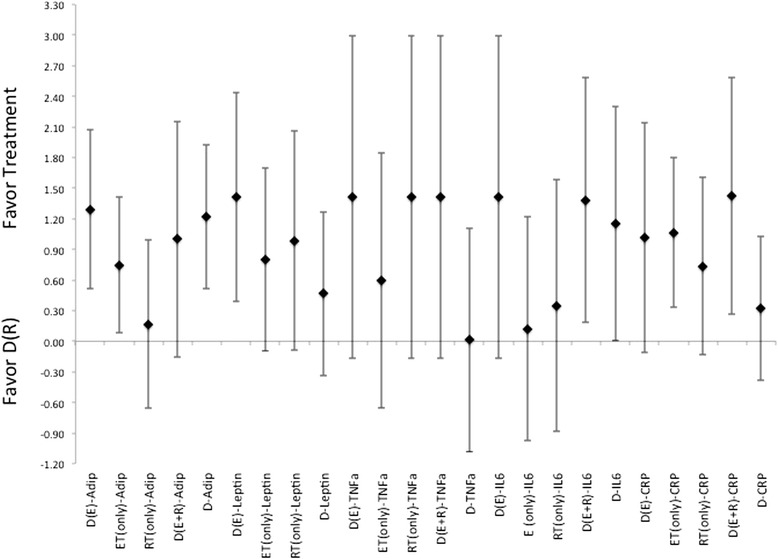
“And is better than the diet only option for treatment (ES of 0.26, 0.59, 0.29, 0.86, 0.33 for adiponectin, leptin, TNF-α, CRP and IL-6 respectively).”
§ Diet, exercise or diet with exercise: comparing the effectiveness of treatment options for weight-loss and changes in fitness for adults (18–65 years old) who are overfat, or obese; systematic review and meta-analysis > Results > Comparison within treatment methods
plaindirect- Asserted: passes — The authors put it forward as true.
- Checkable: passes — It can be checked against evidence.
- Load-bearing: passes — The paper’s conclusions depend on it.
- Based: passes — The paper gives a reason why it holds.
A result the paper reports from its own data — it cites no other source for it, so there is none to check. The quote shows it is in the paper.
In the paper
“there were no indication for a more effective means to change cytokine or adipokine levels with the utilization of diet in combination with both ET and RT.”
§ Diet, exercise or diet with exercise: comparing the effectiveness of treatment options for weight-loss and changes in fitness for adults (18–65 years old) who are overfat, or obese; systematic review and meta-analysis > Results > Comparison between treatment effects
plain- Asserted: passes — The authors put it forward as true.
- Checkable: passes — It can be checked against evidence.
- Load-bearing: passes — The paper’s conclusions depend on it.
- Based: passes — The paper gives a reason why it holds.
A result the paper reports from its own data — it cites no other source for it, so there is none to check. The quote shows it is in the paper.
In the paper
“When combined with diet, exercise interventions were more effective at inducing responses in body compositional changes than either an exercise, or diet, alone option for intervention.”
§ Diet, exercise or diet with exercise: comparing the effectiveness of treatment options for weight-loss and changes in fitness for adults (18–65 years old) who are overfat, or obese; systematic review and meta-analysis > Discussion
plaindirect- Asserted: passes — The authors put it forward as true.
- Checkable: passes — It can be checked against evidence.
- Load-bearing: passes — The paper’s conclusions depend on it.
- Based: passes — The paper gives a reason why it holds.
A result the paper reports from its own data — it cites no other source for it, so there is none to check. The quote shows it is in the paper.
In the paper
“With the use of a high protein diet, indicated here as a diet with >1.5 g protein*kg−1body mass (>25% of total kcal/d), in a hypocaloric model inducing a larger effect for body compositional changes relative to any of the other diet methods, ES of 0.60, 0.54, 0.38 for loss of body mass, FM and retention of FFM respectively.”
§ Diet, exercise or diet with exercise: comparing the effectiveness of treatment options for weight-loss and changes in fitness for adults (18–65 years old) who are overfat, or obese; systematic review and meta-analysis > Results > Comparison within treatment methods
hedgeddirect- Asserted: passes — The authors put it forward as true.
- Checkable: passes — It can be checked against evidence.
- Load-bearing: passes — The paper’s conclusions depend on it.
- Based: passes — The paper gives a reason why it holds.
A result the paper reports from its own data — it cites no other source for it, so there is none to check. The quote shows it is in the paper.
In the paper
“there is an indication for favoring higher intensity RT at an ES of 0.47 for BM, of 0.30 for FM and 0.40 for FFM, respectively to any of the ET protocols, ET and RT combination or lower intensity RT.”
§ Diet, exercise or diet with exercise: comparing the effectiveness of treatment options for weight-loss and changes in fitness for adults (18–65 years old) who are overfat, or obese; systematic review and meta-analysis > Results > Comparison within treatment methods
hedgeddirect- Asserted: passes — The authors put it forward as true.
- Checkable: passes — It can be checked against evidence.
- Load-bearing: passes — The paper’s conclusions depend on it.
- Based: passes — The paper gives a reason why it holds.
A result the paper reports from its own data — it cites no other source for it, so there is none to check. The quote shows it is in the paper.
In the paper
“analysis of effectiveness showed preference of favor toward RT rather than the classically recommended ET at being more effective to elicit beneficial changes.”
§ Diet, exercise or diet with exercise: comparing the effectiveness of treatment options for weight-loss and changes in fitness for adults (18–65 years old) who are overfat, or obese; systematic review and meta-analysis > Discussion
hedgeddirect- Asserted: passes — The authors put it forward as true.
- Checkable: passes — It can be checked against evidence.
- Load-bearing: passes — The paper’s conclusions depend on it.
- Based: passes — The paper gives a reason why it holds.
A result the paper reports from its own data — it cites no other source for it, so there is none to check. The quote shows it is in the paper.
In the paper
“the changes induced in CRP and TNF-α, Figures 8, 9 and 10, were nearly identical, i.e. ES that crosses 0, for differences in effectiveness for changes between diet alone, or diet in combination with exercise”
§ Diet, exercise or diet with exercise: comparing the effectiveness of treatment options for weight-loss and changes in fitness for adults (18–65 years old) who are overfat, or obese; systematic review and meta-analysis > Results > Comparison between treatment effects
plain- Asserted: passes — The authors put it forward as true.
- Checkable: passes — It can be checked against evidence.
- Load-bearing: passes — The paper’s conclusions depend on it.
- Based: passes — The paper gives a reason why it holds.
The paper states this without a source or data behind it here, so there is nothing to check it against. The quote shows it is in the paper.
In the paper
“The effectiveness for exercise becomes more pronounced with higher levels of intensity of exercise regardless of the methodology employed”
§ Diet, exercise or diet with exercise: comparing the effectiveness of treatment options for weight-loss and changes in fitness for adults (18–65 years old) who are overfat, or obese; systematic review and meta-analysis > Discussion
plaindirect- Asserted: passes — The authors put it forward as true.
- Checkable: passes — It can be checked against evidence.
- Load-bearing: passes — The paper’s conclusions depend on it.
- Based: passes — The paper gives a reason why it holds.
A result the paper reports from its own data — it cites no other source for it, so there is none to check. The quote shows it is in the paper.
In the paper
“The most prominently reported hormones and cytokine signal throughout the studies was insulin, followed by adiponectin, leptin, IL-6, CRP, and TNF-α.”
§ Diet, exercise or diet with exercise: comparing the effectiveness of treatment options for weight-loss and changes in fitness for adults (18–65 years old) who are overfat, or obese; systematic review and meta-analysis > Results > Comparison between treatment effects
plain- Asserted: passes — The authors put it forward as true.
- Checkable: passes — It can be checked against evidence.
- Load-bearing: unclear — It is unclear whether the paper’s conclusions depend on it.
- Based: passes — The paper gives a reason why it holds.
A result the paper reports from its own data — it cites no other source for it, so there is none to check. The quote shows it is in the paper.
In the paper
“ES for eliciting changes in insulin, Figure 7, indicates that ET in combination with diet (or as a stand-alone intervention) induces a lower effect than diet alone.”
§ Diet, exercise or diet with exercise: comparing the effectiveness of treatment options for weight-loss and changes in fitness for adults (18–65 years old) who are overfat, or obese; systematic review and meta-analysis > Results > Comparison between treatment effects
hedgeddirect- Asserted: passes — The authors put it forward as true.
- Checkable: passes — It can be checked against evidence.
- Load-bearing: passes — The paper’s conclusions depend on it.
- Based: passes — The paper gives a reason why it holds.
A result the paper reports from its own data — it cites no other source for it, so there is none to check. The quote shows it is in the paper.
In the paper
“the lower carbohydrate and higher protein model lead to a greater effect in changes to blood lipids and cytokines (adiponectin and leptin) with an ES of 0.60, 2.14, 0.59, and 0.77, for TC, HDL, adiponectin and leptin respectively.”
§ Diet, exercise or diet with exercise: comparing the effectiveness of treatment options for weight-loss and changes in fitness for adults (18–65 years old) who are overfat, or obese; systematic review and meta-analysis > Results > Comparison within treatment methods
plaindirect- Asserted: passes — The authors put it forward as true.
- Checkable: passes — It can be checked against evidence.
- Load-bearing: passes — The paper’s conclusions depend on it.
- Based: passes — The paper gives a reason why it holds.
A result the paper reports from its own data — it cites no other source for it, so there is none to check. The quote shows it is in the paper.
In the paper
“higher intensity training once again elicited a greater effect in the responses than lower intensities (ES of 0.66, 0.3, 0.42, 1.15, 0.92 for adiponectin, leptin, TNF-α, CRP and IL-6 respectively).”
§ Diet, exercise or diet with exercise: comparing the effectiveness of treatment options for weight-loss and changes in fitness for adults (18–65 years old) who are overfat, or obese; systematic review and meta-analysis > Results > Comparison within treatment methods
plaindirect- Asserted: passes — The authors put it forward as true.
- Checkable: passes — It can be checked against evidence.
- Load-bearing: passes — The paper’s conclusions depend on it.
- Based: passes — The paper gives a reason why it holds.
A result the paper reports from its own data — it cites no other source for it, so there is none to check. The quote shows it is in the paper.
In the paper
“the addition of exercise provided stimulus for responses that are at least as effective as any diet-only method for altering body composition”
§ Diet, exercise or diet with exercise: comparing the effectiveness of treatment options for weight-loss and changes in fitness for adults (18–65 years old) who are overfat, or obese; systematic review and meta-analysis > Discussion
plaindirect- Asserted: passes — The authors put it forward as true.
- Checkable: passes — It can be checked against evidence.
- Load-bearing: passes — The paper’s conclusions depend on it.
- Based: passes — The paper gives a reason why it holds.
A result the paper reports from its own data — it cites no other source for it, so there is none to check. The quote shows it is in the paper.
In the paper
“And all were more effective than the exercise alone treatments.”
§ Diet, exercise or diet with exercise: comparing the effectiveness of treatment options for weight-loss and changes in fitness for adults (18–65 years old) who are overfat, or obese; systematic review and meta-analysis > Results > Comparison between treatment effects
plaindirect- Asserted: passes — The authors put it forward as true.
- Checkable: passes — It can be checked against evidence.
- Load-bearing: unclear — It is unclear whether the paper’s conclusions depend on it.
- Based: passes — The paper gives a reason why it holds.
A result the paper reports from its own data — it cites no other source for it, so there is none to check. The quote shows it is in the paper.
In the paper
“There was a gender difference to response and effectiveness indicated within the analysis for insulin changes, with treatments appearing to be more effective in male groupings than in female groups.”
§ Diet, exercise or diet with exercise: comparing the effectiveness of treatment options for weight-loss and changes in fitness for adults (18–65 years old) who are overfat, or obese; systematic review and meta-analysis > Results > Comparison between treatment effects
hedgedcorrelational- Asserted: passes — The authors put it forward as true.
- Checkable: passes — It can be checked against evidence.
- Load-bearing: unclear — It is unclear whether the paper’s conclusions depend on it.
- Based: passes — The paper gives a reason why it holds.
A result the paper reports from its own data — it cites no other source for it, so there is none to check. The quote shows it is in the paper.
In the paper
“RT induced a greater ES for changes in IL-6 and CRP relative to ET, at higher (ES of 0.27 and 1.34, respectively) and lower intensities (ES of 0.36 and 0.76, respectively).”
§ Diet, exercise or diet with exercise: comparing the effectiveness of treatment options for weight-loss and changes in fitness for adults (18–65 years old) who are overfat, or obese; systematic review and meta-analysis > Results > Comparison within treatment methods
plaindirect- Asserted: passes — The authors put it forward as true.
- Checkable: passes — It can be checked against evidence.
- Load-bearing: unclear — It is unclear whether the paper’s conclusions depend on it.
- Based: passes — The paper gives a reason why it holds.
A result the paper reports from its own data — it cites no other source for it, so there is none to check. The quote shows it is in the paper.
In the paper
“the combination of a high level of training intensity (regardless of method of exercise, ET or RT or ET and RT, or in combination with diet or not) induced a greater effect on the level of energetic imbalance than a lower level of training intensity.”
§ Diet, exercise or diet with exercise: comparing the effectiveness of treatment options for weight-loss and changes in fitness for adults (18–65 years old) who are overfat, or obese; systematic review and meta-analysis > Results > Comparison within treatment methods
plaindirect- Asserted: passes — The authors put it forward as true.
- Checkable: passes — It can be checked against evidence.
- Load-bearing: passes — The paper’s conclusions depend on it.
- Based: passes — The paper gives a reason why it holds.
A result the paper reports from its own data — it cites no other source for it, so there is none to check. The quote shows it is in the paper.
In the paper
“diet alone and in combination with ET, were more effective than what was seen with changes induced by the incorporation of RT for changes to adiponectin and leptin”
§ Diet, exercise or diet with exercise: comparing the effectiveness of treatment options for weight-loss and changes in fitness for adults (18–65 years old) who are overfat, or obese; systematic review and meta-analysis > Results > Comparison between treatment effects
plaindirect- Asserted: passes — The authors put it forward as true.
- Checkable: passes — It can be checked against evidence.
- Load-bearing: passes — The paper’s conclusions depend on it.
- Based: passes — The paper gives a reason why it holds.
A result the paper reports from its own data — it cites no other source for it, so there is none to check. The quote shows it is in the paper.
In the paper
“there were no gender differences indicated throughout the analysis of ES for any of the changes to the level of cytokines or adipokines following treatments, regardless of the methodology employed.”
§ Diet, exercise or diet with exercise: comparing the effectiveness of treatment options for weight-loss and changes in fitness for adults (18–65 years old) who are overfat, or obese; systematic review and meta-analysis > Results > Comparison between treatment effects
hedged- Asserted: passes — The authors put it forward as true.
- Checkable: passes — It can be checked against evidence.
- Load-bearing: unclear — It is unclear whether the paper’s conclusions depend on it.
- Based: passes — The paper gives a reason why it holds.
A result the paper reports from its own data — it cites no other source for it, so there is none to check. The quote shows it is in the paper.
In the paper
“elicited greater effectiveness at inducing changes to body composition, insulin levels, blood lipids, and cytokines (adiponectin, CRP, IL-6), with an ES of 0.49, 0.66, 0.37, 0.50, 0.75, 0.78, 0.75, 0.66, 1.15, and 0.92 for BM, FM, FFM, Insulin, TC, LDL, TG, adiponectin, CRP, and IL-6 respectively.”
§ Diet, exercise or diet with exercise: comparing the effectiveness of treatment options for weight-loss and changes in fitness for adults (18–65 years old) who are overfat, or obese; systematic review and meta-analysis > Results > Comparison within treatment methods
plaindirect- Asserted: passes — The authors put it forward as true.
- Checkable: passes — It can be checked against evidence.
- Load-bearing: passes — The paper’s conclusions depend on it.
- Based: passes — The paper gives a reason why it holds.
A result the paper reports from its own data — it cites no other source for it, so there is none to check. The quote shows it is in the paper.
In the paper
“the high-protein (regardless of carbohydrate modification) diet was more effective than the simply having a hypocaloric, or the traditional low fat, diet within the spectrum of diet options examined, ES of 0.49.”
§ Diet, exercise or diet with exercise: comparing the effectiveness of treatment options for weight-loss and changes in fitness for adults (18–65 years old) who are overfat, or obese; systematic review and meta-analysis > Discussion
plaindirect- Asserted: passes — The authors put it forward as true.
- Checkable: passes — It can be checked against evidence.
- Load-bearing: passes — The paper’s conclusions depend on it.
- Based: passes — The paper gives a reason why it holds.
The paper states this without a source or data behind it here, so there is nothing to check it against. The quote shows it is in the paper.
In the paper
“diet with RT was not only more effective at altering BM in the most beneficial pattern (i.e. reduction of FM with retention of FFM), without regard to level of training, versus any of the other categorization of the methods for exercise.”
§ Diet, exercise or diet with exercise: comparing the effectiveness of treatment options for weight-loss and changes in fitness for adults (18–65 years old) who are overfat, or obese; systematic review and meta-analysis > Discussion
plaindirect- Asserted: passes — The authors put it forward as true.
- Checkable: passes — It can be checked against evidence.
- Load-bearing: passes — The paper’s conclusions depend on it.
- Based: passes — The paper gives a reason why it holds.
A result the paper reports from its own data — it cites no other source for it, so there is none to check. The quote shows it is in the paper.
In the paper
“the effectiveness for inducing changes in caloric imbalance does not match the effectiveness to induce body compositional changes for the adult that is overfat.”
§ Diet, exercise or diet with exercise: comparing the effectiveness of treatment options for weight-loss and changes in fitness for adults (18–65 years old) who are overfat, or obese; systematic review and meta-analysis > Discussion
plain- Asserted: passes — The authors put it forward as true.
- Checkable: passes — It can be checked against evidence.
- Load-bearing: passes — The paper’s conclusions depend on it.
- Based: passes — The paper gives a reason why it holds.
The paper states this without a source or data behind it here, so there is nothing to check it against. The quote shows it is in the paper.
In the paper
“With only a few indicated changes in resting metabolic rate related to either the hypocaloric diet or exercise or combination therein.”
§ Diet, exercise or diet with exercise: comparing the effectiveness of treatment options for weight-loss and changes in fitness for adults (18–65 years old) who are overfat, or obese; systematic review and meta-analysis > Discussion
plain- Asserted: passes — The authors put it forward as true.
- Checkable: passes — It can be checked against evidence.
- Load-bearing: passes — The paper’s conclusions depend on it.
- Based: passes — The paper gives a reason why it holds.
The paper states this without a source or data behind it here, so there is nothing to check it against. The quote shows it is in the paper.
In the paper
“there are patterns of responses indicating a spectrum of effectiveness, within and across the various methods of diet, exercise or combination of diet with exercise.”
§ Diet, exercise or diet with exercise: comparing the effectiveness of treatment options for weight-loss and changes in fitness for adults (18–65 years old) who are overfat, or obese; systematic review and meta-analysis > Discussion
hedgedcorrelational- Asserted: passes — The authors put it forward as true.
- Checkable: passes — It can be checked against evidence.
- Load-bearing: passes — The paper’s conclusions depend on it.
- Based: passes — The paper gives a reason why it holds.
The paper states this without a source or data behind it here, so there is nothing to check it against. The quote shows it is in the paper.
In the paper
“And is seen even more so when combined with an exercise programs, ES of 0.77.”
§ Diet, exercise or diet with exercise: comparing the effectiveness of treatment options for weight-loss and changes in fitness for adults (18–65 years old) who are overfat, or obese; systematic review and meta-analysis > Discussion
plaindirect- Asserted: passes — The authors put it forward as true.
- Checkable: passes — It can be checked against evidence.
- Load-bearing: passes — The paper’s conclusions depend on it.
- Based: passes — The paper gives a reason why it holds.
The paper states this without a source or data behind it here, so there is nothing to check it against. The quote shows it is in the paper.
In the paper
“becomes more effective at higher levels of stimulation RT (e.g., >75-80% 1RM for at least 3 sets with repetition ranges of 5-to-10 with 60-to-90 second rest intervals) at inducing changes in body composition that leads to the reduction of BM and FM, while retaining (and in some cases increases of) FFM for the individual who is overfat.”
§ Diet, exercise or diet with exercise: comparing the effectiveness of treatment options for weight-loss and changes in fitness for adults (18–65 years old) who are overfat, or obese; systematic review and meta-analysis > Discussion
plaindirect- Asserted: passes — The authors put it forward as true.
- Checkable: passes — It can be checked against evidence.
- Load-bearing: passes — The paper’s conclusions depend on it.
- Based: passes — The paper gives a reason why it holds.
A result the paper reports from its own data — it cites no other source for it, so there is none to check. The quote shows it is in the paper.
In the paper
“dieting alone is shown to be overall less effective than any of the exercise or diet in combination with exercise modalities.”
§ Diet, exercise or diet with exercise: comparing the effectiveness of treatment options for weight-loss and changes in fitness for adults (18–65 years old) who are overfat, or obese; systematic review and meta-analysis > Discussion
plaindirect- Asserted: passes — The authors put it forward as true.
- Checkable: passes — It can be checked against evidence.
- Load-bearing: passes — The paper’s conclusions depend on it.
- Based: passes — The paper gives a reason why it holds.
The paper states this without a source or data behind it here, so there is nothing to check it against. The quote shows it is in the paper.
In the paper
“And when employed at even lower levels of stimulation (e.g., <70% 1RM, single set for at least 12 repetitions, use of pneumatic or selectorized machines, and performance of circuit resistance training) RT provides responses that mimic the ES from ET, or the combination to ET and RT.”
§ Diet, exercise or diet with exercise: comparing the effectiveness of treatment options for weight-loss and changes in fitness for adults (18–65 years old) who are overfat, or obese; systematic review and meta-analysis > Discussion
plaindirect- Asserted: passes — The authors put it forward as true.
- Checkable: passes — It can be checked against evidence.
- Load-bearing: passes — The paper’s conclusions depend on it.
- Based: passes — The paper gives a reason why it holds.
A result the paper reports from its own data — it cites no other source for it, so there is none to check. The quote shows it is in the paper.
In the paper
“This difference in treatment effectiveness is reversed with incorporation of the high protein/low carbohydrate diet with combination of exercise where RT is more effective than ET, regardless of intensity (ES of 3.5).”
§ Diet, exercise or diet with exercise: comparing the effectiveness of treatment options for weight-loss and changes in fitness for adults (18–65 years old) who are overfat, or obese; systematic review and meta-analysis > Discussion
plaindirect- Asserted: passes — The authors put it forward as true.
- Checkable: passes — It can be checked against evidence.
- Load-bearing: passes — The paper’s conclusions depend on it.
- Based: passes — The paper gives a reason why it holds.
The paper states this without a source or data behind it here, so there is nothing to check it against. The quote shows it is in the paper.
In the paper
“this difference in effectiveness becomes even more pronounced in favor of the higher intensity exercise protocols (regardless of using ET or RT).”
§ Diet, exercise or diet with exercise: comparing the effectiveness of treatment options for weight-loss and changes in fitness for adults (18–65 years old) who are overfat, or obese; systematic review and meta-analysis > Discussion
plaincorrelational- Asserted: passes — The authors put it forward as true.
- Checkable: passes — It can be checked against evidence.
- Load-bearing: unclear — It is unclear whether the paper’s conclusions depend on it.
- Based: passes — The paper gives a reason why it holds.
A result the paper reports from its own data — it cites no other source for it, so there is none to check. The quote shows it is in the paper.
In the paper
“the combination of diet with exercise (especially RT) being more effective than diet or diet with ET in reduction of body mass and fat mass while retaining of FFM following treatment.”
§ Diet, exercise or diet with exercise: comparing the effectiveness of treatment options for weight-loss and changes in fitness for adults (18–65 years old) who are overfat, or obese; systematic review and meta-analysis > Conclusions
plaindirect- Asserted: passes — The authors put it forward as true.
- Checkable: passes — It can be checked against evidence.
- Load-bearing: passes — The paper’s conclusions depend on it.
- Based: passes — The paper gives a reason why it holds.
The paper states this without a source or data behind it here, so there is nothing to check it against. The quote shows it is in the paper.
In the paper
“there is a favor toward use of RT is seen with eliciting reductions of blood lipids levels, TC, LDL and TG, relative to either dieting alone, or in combination of diet with ET.”
§ Diet, exercise or diet with exercise: comparing the effectiveness of treatment options for weight-loss and changes in fitness for adults (18–65 years old) who are overfat, or obese; systematic review and meta-analysis > Discussion
hedgeddirect- Asserted: passes — The authors put it forward as true.
- Checkable: passes — It can be checked against evidence.
- Load-bearing: passes — The paper’s conclusions depend on it.
- Based: passes — The paper gives a reason why it holds.
A result the paper reports from its own data — it cites no other source for it, so there is none to check. The quote shows it is in the paper.
In the paper
“the relative changes in absolute values note an increase in testosterone and growth hormone that seem to not be related to the intervention used, but instead changes in FM following treatment.”
§ Diet, exercise or diet with exercise: comparing the effectiveness of treatment options for weight-loss and changes in fitness for adults (18–65 years old) who are overfat, or obese; systematic review and meta-analysis > Discussion
hedgedcorrelational- Asserted: passes — The authors put it forward as true.
- Checkable: passes — It can be checked against evidence.
- Load-bearing: unclear — It is unclear whether the paper’s conclusions depend on it.
- Based: passes — The paper gives a reason why it holds.
A result the paper reports from its own data — it cites no other source for it, so there is none to check. The quote shows it is in the paper.
In the paper
“There were too few studies that looked at these changes in relation to the treatments that were used, that did not involve a pharmaceutical intervention.”
§ Diet, exercise or diet with exercise: comparing the effectiveness of treatment options for weight-loss and changes in fitness for adults (18–65 years old) who are overfat, or obese; systematic review and meta-analysis > Discussion
plain- Asserted: passes — The authors put it forward as true.
- Checkable: passes — It can be checked against evidence.
- Load-bearing: passes — The paper’s conclusions depend on it.
- Based: passes — The paper gives a reason why it holds.
A result the paper reports from its own data — it cites no other source for it, so there is none to check. The quote shows it is in the paper.
In the paper
“exercise was more effective at inducing changes in fasting insulin levels than diet.”
§ Diet, exercise or diet with exercise: comparing the effectiveness of treatment options for weight-loss and changes in fitness for adults (18–65 years old) who are overfat, or obese; systematic review and meta-analysis > Discussion
plaindirect- Asserted: passes — The authors put it forward as true.
- Checkable: passes — It can be checked against evidence.
- Load-bearing: passes — The paper’s conclusions depend on it.
- Based: passes — The paper gives a reason why it holds.
The paper states this without a source or data behind it here, so there is nothing to check it against. The quote shows it is in the paper.
In the paper
“there appears to be no relationship between any treatments effectiveness for inducing acute changes in energetic balance with the effectiveness for induced responses to body composition or biomarkers of health from said treatment program.”
§ Diet, exercise or diet with exercise: comparing the effectiveness of treatment options for weight-loss and changes in fitness for adults (18–65 years old) who are overfat, or obese; systematic review and meta-analysis > Conclusions
hedged- Asserted: passes — The authors put it forward as true.
- Checkable: passes — It can be checked against evidence.
- Load-bearing: passes — The paper’s conclusions depend on it.
- Based: passes — The paper gives a reason why it holds.
A result the paper reports from its own data — it cites no other source for it, so there is none to check. The quote shows it is in the paper.
In the paper
“protocols utilizing exercise were more effective than those that employed just a hypocaloric diet.”
§ Diet, exercise or diet with exercise: comparing the effectiveness of treatment options for weight-loss and changes in fitness for adults (18–65 years old) who are overfat, or obese; systematic review and meta-analysis > Conclusions
plaindirect- Asserted: passes — The authors put it forward as true.
- Checkable: passes — It can be checked against evidence.
- Load-bearing: passes — The paper’s conclusions depend on it.
- Based: passes — The paper gives a reason why it holds.
The paper states this without a source or data behind it here, so there is nothing to check it against. The quote shows it is in the paper.
In the paper
“And are at least as effective for changing hormonal levels and blood lipid profiles.”
§ Diet, exercise or diet with exercise: comparing the effectiveness of treatment options for weight-loss and changes in fitness for adults (18–65 years old) who are overfat, or obese; systematic review and meta-analysis > Conclusions
plain- Asserted: passes — The authors put it forward as true.
- Checkable: passes — It can be checked against evidence.
- Load-bearing: passes — The paper’s conclusions depend on it.
- Based: passes — The paper gives a reason why it holds.
A result the paper reports from its own data — it cites no other source for it, so there is none to check. The quote shows it is in the paper.
In the paper
“the use of ET (both alone and in combination with diet or in conjunction of diet and RT) was more effective than RT (either when used alone or in combination with diet) for eliciting changes in insulin.”
§ Diet, exercise or diet with exercise: comparing the effectiveness of treatment options for weight-loss and changes in fitness for adults (18–65 years old) who are overfat, or obese; systematic review and meta-analysis > Discussion
plaindirect- Asserted: passes — The authors put it forward as true.
- Checkable: passes — It can be checked against evidence.
- Load-bearing: passes — The paper’s conclusions depend on it.
- Based: passes — The paper gives a reason why it holds.
The paper states this without a source or data behind it here, so there is nothing to check it against. The quote shows it is in the paper.
In the paper
“the use of higher-intensity exercise was more effective than lower-intensity exercise without regard to diet selection.”
§ Diet, exercise or diet with exercise: comparing the effectiveness of treatment options for weight-loss and changes in fitness for adults (18–65 years old) who are overfat, or obese; systematic review and meta-analysis > Discussion
plaindirect- Asserted: passes — The authors put it forward as true.
- Checkable: passes — It can be checked against evidence.
- Load-bearing: passes — The paper’s conclusions depend on it.
- Based: passes — The paper gives a reason why it holds.
The paper states this without a source or data behind it here, so there is nothing to check it against. The quote shows it is in the paper.
In the paper
“there are differences in effectiveness noted between RT and ET. This is seen regardless of being utilized alone or with modification to diet, or based on the intensities of training.”
§ Diet, exercise or diet with exercise: comparing the effectiveness of treatment options for weight-loss and changes in fitness for adults (18–65 years old) who are overfat, or obese; systematic review and meta-analysis > Discussion
plaindirect- Asserted: passes — The authors put it forward as true.
- Checkable: passes — It can be checked against evidence.
- Load-bearing: passes — The paper’s conclusions depend on it.
- Based: passes — The paper gives a reason why it holds.
A result the paper reports from its own data — it cites no other source for it, so there is none to check. The quote shows it is in the paper.
In the paper
“Analysis of effectiveness of responses both within and between interventions differences for treatment options modalities (e.g., diet, exercise, or combination therein) along with submodality of treatment (e.g., high intensity versus low intensity, high protein/low carbohydrate diets) indicate a continuum of effectiveness.”
§ Diet, exercise or diet with exercise: comparing the effectiveness of treatment options for weight-loss and changes in fitness for adults (18–65 years old) who are overfat, or obese; systematic review and meta-analysis > Conclusions
hedgedcorrelational- Asserted: passes — The authors put it forward as true.
- Checkable: passes — It can be checked against evidence.
- Load-bearing: passes — The paper’s conclusions depend on it.
- Based: passes — The paper gives a reason why it holds.
A result the paper reports from its own data — it cites no other source for it, so there is none to check. The quote shows it is in the paper.
In the paper
“the combination of diet with RT was only intervention that provided a pooled therapeutic ES that did not elicit the possibility of no response (i.e. crosses a point of ES = 0) from treatment relative to the control.”
§ Diet, exercise or diet with exercise: comparing the effectiveness of treatment options for weight-loss and changes in fitness for adults (18–65 years old) who are overfat, or obese; systematic review and meta-analysis > Discussion
plaindirect- Asserted: passes — The authors put it forward as true.
- Checkable: passes — It can be checked against evidence.
- Load-bearing: passes — The paper’s conclusions depend on it.
- Based: passes — The paper gives a reason why it holds.
The paper states this without a source or data behind it here, so there is nothing to check it against. The quote shows it is in the paper.
In the paper
“if utilized as a stand alone intervention, diets can be effective if hypocaloric and comprised of a higher percentage of total caloric intake from protein, with an expectation for at least 55% of the population showing a beneficial response from the intervention.”
§ Diet, exercise or diet with exercise: comparing the effectiveness of treatment options for weight-loss and changes in fitness for adults (18–65 years old) who are overfat, or obese; systematic review and meta-analysis > Conclusions
plainconditional- Asserted: passes — The authors put it forward as true.
- Checkable: passes — It can be checked against evidence.
- Load-bearing: passes — The paper’s conclusions depend on it.
- Based: passes — The paper gives a reason why it holds.
The paper states this without a source or data behind it here, so there is nothing to check it against. The quote shows it is in the paper.
In the paper
“With RT producing a greater level of effectiveness for altering these measures, especially when RT is progressive and periodized with a training volume of 2-to-3 sets at 6-to-10 reps with an intensity of ≥75% 1RM and a rest interval of 60–90 seconds, and utilizes whole body (and free-weight) exercises.”
§ Diet, exercise or diet with exercise: comparing the effectiveness of treatment options for weight-loss and changes in fitness for adults (18–65 years old) who are overfat, or obese; systematic review and meta-analysis > Conclusions
plaindirect- Asserted: passes — The authors put it forward as true.
- Checkable: passes — It can be checked against evidence.
- Load-bearing: passes — The paper’s conclusions depend on it.
- Based: passes — The paper gives a reason why it holds.
A conclusion the paper draws from its own results — it cites no other source for it, so there is none to check. The quote shows it is in the paper.
In the paper
“First, hypocaloric balance is necessary for changing body composition, but the effectiveness for establishing imbalance does not equate with the effectiveness for body compositional changes, or any biomarkers associated with metabolic issues.”
§ Diet, exercise or diet with exercise: comparing the effectiveness of treatment options for weight-loss and changes in fitness for adults (18–65 years old) who are overfat, or obese; systematic review and meta-analysis > Abstract
plaindirect- Asserted: passes — The authors put it forward as true.
- Checkable: passes — It can be checked against evidence.
- Load-bearing: passes — The paper’s conclusions depend on it.
- Based: unclear — It is unclear why the paper says it holds.
A conclusion the paper draws from its own results — it cites no other source for it, so there is none to check. The quote shows it is in the paper.
In the paper
“With analysis showing that there is a necessity to include exercise in combination with diet effectively elicit changes in body composition and biomarkers of metabolic issues.”
§ Diet, exercise or diet with exercise: comparing the effectiveness of treatment options for weight-loss and changes in fitness for adults (18–65 years old) who are overfat, or obese; systematic review and meta-analysis > Abstract
boosteddirect- Asserted: passes — The authors put it forward as true.
- Checkable: passes — It can be checked against evidence.
- Load-bearing: passes — The paper’s conclusions depend on it.
- Based: passes — The paper gives a reason why it holds.
None of the sources cited for this claim have been checked yet.
In the paper
“The greatest impact of these changes appears to be related to alterations in sex hormone (i.e. testosterone and androgens), growth hormone, and a host of adipokines [29,34-46].”
§ Diet, exercise or diet with exercise: comparing the effectiveness of treatment options for weight-loss and changes in fitness for adults (18–65 years old) who are overfat, or obese; systematic review and meta-analysis > Introduction
What the sources say
- Not checked yetcites [29] Fantuzzi G. Adipose tissue, adipokines, and inflammation. J Allergy Clin Immunol. 2005;115:911–9. quiz 920. source
- Not checked yetcites [34] Bastard J-P, Maachi M, Lagathu C, Kim MJ, Caron M, Vidal H, et al. Recent advances in the relationship between obesity, inflammation, and insulin resistance. Eur Cytokine Netw. 2006;17:4–12.
- Not checked yetcites [35] Abate N, Haffner SM, Garg A, Peshock RM, Grundy SM. Sex steroid hormones, upper body obesity, and insulin resistance. J Clin Endocrinol Metab. 2002;87:4522–7. source
- Not checked yetcites [36] Brick DJ, Gerweck AV, Meenaghan E, Lawson EA, Misra M, Fazeli P, et al. Determinants of IGF1 and GH across the weight spectrum: from anorexia nervosa to obesity. Eur J Endocrinol. 2010;163:185–91. source
- Not checked yetcites [37] Dyck DJ. Adipokines as regulators of muscle metabolism and insulin sensitivity. Appl Physiol Nutr Metab. 2009;34:396–402. source
- Not checked yetcites [38] Gerrits MF, Ghosh S, Kavaslar N, Hill B, Tour A, Seifert EL, et al. Distinct skeletal muscle fiber characteristics and gene expression in diet-sensitive versus diet-resistant obesity. J Lipid Res. 2010;51:2394–404. source
- Not checked yetcites [39] Gualillo O, González-Juanatey JR, Lago F. The emerging role of adipokines as mediators of cardiovascular function: physiologic and clinical perspectives. Trends Cardiovasc Med. 2007;17:275–83. source
- Not checked yetcites [40] Guay AT. The emerging link between hypogonadism and metabolic syndrome. J Androl. 2009;30:370–6. source
- Not checked yetcites [41] Mammi C, Calanchini M, Antelmi A, Cinti F, Rosano GMC, Lenzi A, et al. Androgens and adipose tissue in males: a complex and reciprocal interplay. Int J Endocrinol. 2012;2012:789653. source
- Not checked yetcites [42] Maya-Monteiro CM, Bozza PT. Leptin and mTOR: partners in metabolism and inflammation. Cell Cycle. 2008;7:1713–7. source
hedgedcorrelational- Asserted: passes — The authors put it forward as true.
- Checkable: passes — It can be checked against evidence.
- Load-bearing: unclear — It is unclear whether the paper’s conclusions depend on it.
- Based: passes — The paper gives a reason why it holds.
None of the sources cited for this claim have been checked yet.
In the paper
“Where these improvements appear to stem from a number of endocrinological changes that occur with both expression of overfatness and following exposure to exercise that ultimately alters the health status for the individual who is overfat [18,19,26,28,30,32-34].”
§ Diet, exercise or diet with exercise: comparing the effectiveness of treatment options for weight-loss and changes in fitness for adults (18–65 years old) who are overfat, or obese; systematic review and meta-analysis > Introduction
What the sources say
- Not checked yetcites [18] Bruunsgaard H. Physical activity and modulation of systemic low-level inflammation. J Leukoc Biol. 2005;78:819–35. source
- Not checked yetcites [19] Clark JE. An overview of the contribution of fatness and fitness factors, and the role of exercise, in the formation of health status for individuals who are overweight. J Diab Metab Disord. 2012;11:19. source
- Not checked yetcites [26] Booth FW, Gordon SE, Carlson CJ, Hamilton MT. Waging war on modern chronic diseases: primary prevention through exercise biology. J Appl Physiol (Bethesda, Md : 1985). 2000;88:774–87. source
- Not checked yetcites [28] Clark JE, Goon DT. The roles of resistance training for treatment of obesity related health issue and for changing health status of the individual who is overfat or obese: A review. J Sports Med Phys Fit. 2015;55(3):205–22.
- Not checked yetcites [30] Hood DA, Irrcher I, Ljubicic V, Joseph A-M. Coordination of metabolic plasticity in skeletal muscle. J Exp Biol. 2006;209:2265–75. source
- Not checked yetcites [32] Mathur N, Pedersen BK. Exercise as a mean to control low-grade systemic inflammation. Mediators Inflamm. 2008;2008:109502. source
- Not checked yetcites [33] Müssig K, Remer T, Maser-Gluth C. Brief review: Glucocorticoid excretion in obesity. J Steroid Biochem Mol Biol. 2010;121(3–5):589–93. source
- Not checked yetcites [34] Bastard J-P, Maachi M, Lagathu C, Kim MJ, Caron M, Vidal H, et al. Recent advances in the relationship between obesity, inflammation, and insulin resistance. Eur Cytokine Netw. 2006;17:4–12.
hedgedconditional- Asserted: passes — The authors put it forward as true.
- Checkable: passes — It can be checked against evidence.
- Load-bearing: unclear — It is unclear whether the paper’s conclusions depend on it.
- Based: passes — The paper gives a reason why it holds.
In the paper
“and evidence for greater change in body composition from utilization of resistance exercise, both with and without conjunction with hypocaloric diet [51].”
§ Diet, exercise or diet with exercise: comparing the effectiveness of treatment options for weight-loss and changes in fitness for adults (18–65 years old) who are overfat, or obese; systematic review and meta-analysis > Introduction
What the sources say
- Not checked yetcites [51] Bouchard DR, Soucy L, Sénéchal M, Dionne IJ, Brochu M. Impact of resistance training with or without caloric restriction on physical capacity in obese older women. Menopause. 2009;16:66–72. source
plaindirect- Asserted: passes — The authors put it forward as true.
- Checkable: passes — It can be checked against evidence.
- Load-bearing: passes — The paper’s conclusions depend on it.
- Based: passes — The paper gives a reason why it holds.
None of the sources cited for this claim have been checked yet.
In the paper
“And are reversed with exposure to physical activity (e.g., exercise) with speculation that resistance exercise may provide the greatest impact on reversing such issues [28,47-50]”
§ Diet, exercise or diet with exercise: comparing the effectiveness of treatment options for weight-loss and changes in fitness for adults (18–65 years old) who are overfat, or obese; systematic review and meta-analysis > Introduction
What the sources say
- Not checked yetcites [28] Clark JE, Goon DT. The roles of resistance training for treatment of obesity related health issue and for changing health status of the individual who is overfat or obese: A review. J Sports Med Phys Fit. 2015;55(3):205–22.
- Not checked yetcites [47] Balducci S, Zanuso S, Nicolucci A, Fernando F, Cavallo S, Cardelli P, et al. Anti-inflammatory effect of exercise training in subjects with type 2 diabetes and the metabolic syndrome is dependent on exercise modalities and independent of weight loss. Nutr Metab Cardiovasc Dis. 2009;20(8):608–17. source
- Not checked yetcites [48] Pedersen BK, Febbraio MA. Muscles, exercise and obesity: skeletal muscle as a secretory organ. Nat Rev Endocrinol. 2012;8:457–65. source
- Not checked yetcites [49] Shaibi GQ, Roberts CK, Goran MI. Exercise and insulin resistance in youth. Exerc Sport Sci Rev. 2008;36:5–11. source
- Not checked yetcites [50] Tresierras MA, Balady GJ. Resistance training in the treatment of diabetes and obesity: mechanisms and outcomes. J Cardiopulm Rehabil Prev. 2009;29:67–75. source
hedgeddirect- Asserted: passes — The authors put it forward as true.
- Checkable: passes — It can be checked against evidence.
- Load-bearing: passes — The paper’s conclusions depend on it.
- Based: passes — The paper gives a reason why it holds.
A conclusion the paper draws from its own results — it cites no other source for it, so there is none to check. The quote shows it is in the paper.
In the paper
“Such findings indicate that all treatments provide an effective means to elicit change relative to status at start of treatment or to the control treatment.”
§ Diet, exercise or diet with exercise: comparing the effectiveness of treatment options for weight-loss and changes in fitness for adults (18–65 years old) who are overfat, or obese; systematic review and meta-analysis > Results > Pooled effects
hedgeddirect- Asserted: passes — The authors put it forward as true.
- Checkable: passes — It can be checked against evidence.
- Load-bearing: passes — The paper’s conclusions depend on it.
- Based: passes — The paper gives a reason why it holds.
A conclusion the paper draws from its own results — it cites no other source for it, so there is none to check. The quote shows it is in the paper.
In the paper
“In comparison of blood lipid profiles, e.g., total cholesterol (TC), high-density lipoproteins (HDL), low-density lipoproteins (LDL), and triglycerides (TG), all treatment options once again provided an effective means for change relative to either the pre-intervention status or in comparison to the control conditon.”
§ Diet, exercise or diet with exercise: comparing the effectiveness of treatment options for weight-loss and changes in fitness for adults (18–65 years old) who are overfat, or obese; systematic review and meta-analysis > Results > Pooled effects
plaindirect- Asserted: passes — The authors put it forward as true.
- Checkable: passes — It can be checked against evidence.
- Load-bearing: unclear — It is unclear whether the paper’s conclusions depend on it.
- Based: passes — The paper gives a reason why it holds.
None of the sources cited for this claim have been checked yet.
In the paper
“a hypocaloric high-protein/low carbohydrate diet appears to generate the greatest ES for change relative to all hypocaloric, and low fat, diets.”
§ Diet, exercise or diet with exercise: comparing the effectiveness of treatment options for weight-loss and changes in fitness for adults (18–65 years old) who are overfat, or obese; systematic review and meta-analysis > Discussion
What the sources say
- Not checked yetcites [61] Mettler S, Mitchell N, Tipton KD. Increased protein intake reduces lean body mass loss during weight loss in athletes. Med Sci Sports Exerc. 2010;42:326–37. source
- Not checked yetcites [62] Volek JS, Westman EC. Very-low-carbohydrate weight-loss diets revisited. Cleve Clin J Med. 2002;69:849–53. 856–848 passim. source
- Not checked yetcites [63] Volek JS, Sharman MJ, Forsythe CE. Modification of lipoproteins by very low-carbohydrate diets. J Nutr. 2005;135:1339–42. source
- Not checked yetcites [64] Phinney SD. Ketogenic diets and physical performance. Nutri Metabol. 2004;1:2. source
hedgeddirect- Asserted: passes — The authors put it forward as true.
- Checkable: passes — It can be checked against evidence.
- Load-bearing: passes — The paper’s conclusions depend on it.
- Based: passes — The paper gives a reason why it holds.
A conclusion the paper draws from its own results — it cites no other source for it, so there is none to check. The quote shows it is in the paper.
In the paper
“the analysis of ES pooled across studies in aggregate indicate here is that what has been the general classically recommend treatment for overfatness, and associated diseases, may not actually be the most effective.”
§ Diet, exercise or diet with exercise: comparing the effectiveness of treatment options for weight-loss and changes in fitness for adults (18–65 years old) who are overfat, or obese; systematic review and meta-analysis > Discussion
hedgedconditional- Asserted: passes — The authors put it forward as true.
- Checkable: passes — It can be checked against evidence.
- Load-bearing: passes — The paper’s conclusions depend on it.
- Based: passes — The paper gives a reason why it holds.
A conclusion the paper draws from its own results — it cites no other source for it, so there is none to check. The quote shows it is in the paper.
In the paper
“the issue of overfatness is one that is highly complex. Where there a variety of interconnected factors at play beyond the simplistic caloric balance issue”
§ Diet, exercise or diet with exercise: comparing the effectiveness of treatment options for weight-loss and changes in fitness for adults (18–65 years old) who are overfat, or obese; systematic review and meta-analysis > Discussion
plain- Asserted: passes — The authors put it forward as true.
- Checkable: unclear — It is unclear whether it could be checked against evidence.
- Load-bearing: passes — The paper’s conclusions depend on it.
- Based: passes — The paper gives a reason why it holds.
None of the sources cited for this claim have been checked yet.
In the paper
“one of the key indicators for metabolic health issues for adults that are overfat is high levels of circulating insulin”
§ Diet, exercise or diet with exercise: comparing the effectiveness of treatment options for weight-loss and changes in fitness for adults (18–65 years old) who are overfat, or obese; systematic review and meta-analysis > Discussion
What the sources say
- Not checked yetcites [19] Clark JE. An overview of the contribution of fatness and fitness factors, and the role of exercise, in the formation of health status for individuals who are overweight. J Diab Metab Disord. 2012;11:19. source
- Not checked yetcites [26] Booth FW, Gordon SE, Carlson CJ, Hamilton MT. Waging war on modern chronic diseases: primary prevention through exercise biology. J Appl Physiol (Bethesda, Md : 1985). 2000;88:774–87. source
- Not checked yetcites [28] Clark JE, Goon DT. The roles of resistance training for treatment of obesity related health issue and for changing health status of the individual who is overfat or obese: A review. J Sports Med Phys Fit. 2015;55(3):205–22.
- Not checked yetcites [31] Matheson EM, King DE, Everett CJ. Healthy lifestyle habits and mortality in overweight and obese individuals. J Am Board Fam Med. 2012;25:9–15. source
- Not checked yetcites [32] Mathur N, Pedersen BK. Exercise as a mean to control low-grade systemic inflammation. Mediators Inflamm. 2008;2008:109502. source
- Not checked yetcites [33] Müssig K, Remer T, Maser-Gluth C. Brief review: Glucocorticoid excretion in obesity. J Steroid Biochem Mol Biol. 2010;121(3–5):589–93. source
- Not checked yetcites [34] Bastard J-P, Maachi M, Lagathu C, Kim MJ, Caron M, Vidal H, et al. Recent advances in the relationship between obesity, inflammation, and insulin resistance. Eur Cytokine Netw. 2006;17:4–12.
- Not checked yetcites [42] Maya-Monteiro CM, Bozza PT. Leptin and mTOR: partners in metabolism and inflammation. Cell Cycle. 2008;7:1713–7. source
plaincorrelational- Asserted: passes — The authors put it forward as true.
- Checkable: passes — It can be checked against evidence.
- Load-bearing: unclear — It is unclear whether the paper’s conclusions depend on it.
- Based: passes — The paper gives a reason why it holds.
A conclusion the paper draws from its own results — it cites no other source for it, so there is none to check. The quote shows it is in the paper.
In the paper
“utilizing RT can be a more effective treatment for reversing insulin resistance”
§ Diet, exercise or diet with exercise: comparing the effectiveness of treatment options for weight-loss and changes in fitness for adults (18–65 years old) who are overfat, or obese; systematic review and meta-analysis > Discussion
plaindirect- Asserted: passes — The authors put it forward as true.
- Checkable: passes — It can be checked against evidence.
- Load-bearing: passes — The paper’s conclusions depend on it.
- Based: passes — The paper gives a reason why it holds.
A conclusion the paper draws from its own results — it cites no other source for it, so there is none to check. The quote shows it is in the paper.
In the paper
“when combined with the combination of a high protein/low carbohydrate diet, RT exercise (regardless of level of intensity) can be significantly more effective than the standard ET recommendations.”
§ Diet, exercise or diet with exercise: comparing the effectiveness of treatment options for weight-loss and changes in fitness for adults (18–65 years old) who are overfat, or obese; systematic review and meta-analysis > Discussion
plaindirect- Asserted: passes — The authors put it forward as true.
- Checkable: passes — It can be checked against evidence.
- Load-bearing: passes — The paper’s conclusions depend on it.
- Based: passes — The paper gives a reason why it holds.
A conclusion the paper draws from its own results — it cites no other source for it, so there is none to check. The quote shows it is in the paper.
In the paper
“it appears that the better means for prescription of exercise is at the higher levels of training intensities.”
§ Diet, exercise or diet with exercise: comparing the effectiveness of treatment options for weight-loss and changes in fitness for adults (18–65 years old) who are overfat, or obese; systematic review and meta-analysis > Discussion
hedgeddirect- Asserted: passes — The authors put it forward as true.
- Checkable: passes — It can be checked against evidence.
- Load-bearing: passes — The paper’s conclusions depend on it.
- Based: passes — The paper gives a reason why it holds.
A conclusion the paper draws from its own results — it cites no other source for it, so there is none to check. The quote shows it is in the paper.
In the paper
“there is an indication that RT is a viable option for the adult who is overfat and does not self-select towards an ET mode of exercise”
§ Diet, exercise or diet with exercise: comparing the effectiveness of treatment options for weight-loss and changes in fitness for adults (18–65 years old) who are overfat, or obese; systematic review and meta-analysis > Discussion
hedgedconditional- Asserted: passes — The authors put it forward as true.
- Checkable: passes — It can be checked against evidence.
- Load-bearing: passes — The paper’s conclusions depend on it.
- Based: passes — The paper gives a reason why it holds.
- It may state two separate claims as one. 24
- The quote only partly states this claim. 7
- Probably not a substantial claim. 32
A result the paper reports from its own data — it cites no other source for it, so there is none to check. The quote shows it is in the paper.
In the paper
“More importantly, the combination, resistance training (RT) was more effective than endurance training (ET) or combination of RT and ET, particularly when progressive training volume of 2-to-3 sets for 6-to-10 reps at an intensity of ≥75% 1RM, utilizing whole body and free-weight exercises, at altering body compositional measures (ES of 0.47, 0.30, and 0.40 for loss of BM, FM, and retention of FFM”
§ Diet, exercise or diet with exercise: comparing the effectiveness of treatment options for weight-loss and changes in fitness for adults (18–65 years old) who are overfat, or obese; systematic review and meta-analysis > Abstract
plaindirect- Asserted: passes — The authors put it forward as true.
- Checkable: passes — It can be checked against evidence.
- Load-bearing: passes — The paper’s conclusions depend on it.
- Based: passes — The paper gives a reason why it holds.
It may state two separate claims as one.
A result the paper reports from its own data — it cites no other source for it, so there is none to check. The quote shows it is in the paper.
In the paper
“and reducing total cholesterol (ES = 0.85), triglycerides (ES = 0.86) and low-density lipoproteins (ES = 0.60).”
§ Diet, exercise or diet with exercise: comparing the effectiveness of treatment options for weight-loss and changes in fitness for adults (18–65 years old) who are overfat, or obese; systematic review and meta-analysis > Abstract
plaindirect- Asserted: passes — The authors put it forward as true.
- Checkable: passes — It can be checked against evidence.
- Load-bearing: passes — The paper’s conclusions depend on it.
- Based: passes — The paper gives a reason why it holds.
The quote only partly states this claim.
A result the paper reports from its own data — it cites no other source for it, so there is none to check. The quote shows it is in the paper.
In the paper
“and reducing total cholesterol (ES = 0.85), triglycerides (ES = 0.86) and low-density lipoproteins (ES = 0.60).”
§ Diet, exercise or diet with exercise: comparing the effectiveness of treatment options for weight-loss and changes in fitness for adults (18–65 years old) who are overfat, or obese; systematic review and meta-analysis > Abstract
plaindirect- Asserted: passes — The authors put it forward as true.
- Checkable: passes — It can be checked against evidence.
- Load-bearing: passes — The paper’s conclusions depend on it.
- Based: passes — The paper gives a reason why it holds.
The quote only partly states this claim.
A result the paper reports from its own data — it cites no other source for it, so there is none to check. The quote shows it is in the paper.
In the paper
“and reducing total cholesterol (ES = 0.85), triglycerides (ES = 0.86) and low-density lipoproteins (ES = 0.60).”
§ Diet, exercise or diet with exercise: comparing the effectiveness of treatment options for weight-loss and changes in fitness for adults (18–65 years old) who are overfat, or obese; systematic review and meta-analysis > Abstract
plaindirect- Asserted: passes — The authors put it forward as true.
- Checkable: passes — It can be checked against evidence.
- Load-bearing: passes — The paper’s conclusions depend on it.
- Based: passes — The paper gives a reason why it holds.
The quote only partly states this claim.
A result the paper reports from its own data — it cites no other source for it, so there is none to check. The quote shows it is in the paper.
In the paper
“Interestingly, while the combination of diet with ET and RT was more effective then either a diet alone or exercise alone it was less effective then either ET or RT in combination with diet at inducing an energetic imbalance.”
§ Diet, exercise or diet with exercise: comparing the effectiveness of treatment options for weight-loss and changes in fitness for adults (18–65 years old) who are overfat, or obese; systematic review and meta-analysis > Results > Comparison between treatment effects
plaindirect- Asserted: passes — The authors put it forward as true.
- Checkable: passes — It can be checked against evidence.
- Load-bearing: passes — The paper’s conclusions depend on it.
- Based: passes — The paper gives a reason why it holds.
It may state two separate claims as one.
A result the paper reports from its own data — it cites no other source for it, so there is none to check. The quote shows it is in the paper.
In the paper
“favor higher intensity ET at an ES for 0.35 for BM and 0.39 for FM but not for retention of FFM 0.13 relative to lower intensity ET.”
§ Diet, exercise or diet with exercise: comparing the effectiveness of treatment options for weight-loss and changes in fitness for adults (18–65 years old) who are overfat, or obese; systematic review and meta-analysis > Results > Comparison within treatment methods
plaindirect- Asserted: passes — The authors put it forward as true.
- Checkable: passes — It can be checked against evidence.
- Load-bearing: passes — The paper’s conclusions depend on it.
- Based: passes — The paper gives a reason why it holds.
It may state two separate claims as one.
A result the paper reports from its own data — it cites no other source for it, so there is none to check. The quote shows it is in the paper.
In the paper
“comparisons between exercise intensities within the ET and the RT protocols, indicated favor toward ET (ES of 0.66, 1.13, 0.61, and 0.96 for TC, HDL, LDL, and TG respectively), and RT (ES of 0.85, 0.86, and 0.60 for TC, LDL, and TG respectively).”
§ Diet, exercise or diet with exercise: comparing the effectiveness of treatment options for weight-loss and changes in fitness for adults (18–65 years old) who are overfat, or obese; systematic review and meta-analysis > Results > Comparison within treatment methods
hedgedcorrelational- Asserted: passes — The authors put it forward as true.
- Checkable: passes — It can be checked against evidence.
- Load-bearing: passes — The paper’s conclusions depend on it.
- Based: passes — The paper gives a reason why it holds.
It may state two separate claims as one.
A result the paper reports from its own data — it cites no other source for it, so there is none to check. The quote shows it is in the paper.
In the paper
“RT protocols produced a greater ES for changes in adiponectin for higher intensities (ES of 0.74), but not for lower (ES of −1.14) with no differences noted for changes in leptin, relative to ET.”
§ Diet, exercise or diet with exercise: comparing the effectiveness of treatment options for weight-loss and changes in fitness for adults (18–65 years old) who are overfat, or obese; systematic review and meta-analysis > Results > Comparison within treatment methods
plaindirect- Asserted: passes — The authors put it forward as true.
- Checkable: passes — It can be checked against evidence.
- Load-bearing: unclear — It is unclear whether the paper’s conclusions depend on it.
- Based: passes — The paper gives a reason why it holds.
It may state two separate claims as one.
A result the paper reports from its own data — it cites no other source for it, so there is none to check. The quote shows it is in the paper.
In the paper
“lower fat diet was less effective when compared to either a glycemically controlled diet, or the high protein/low carbohydrate diet for the change of any body compositional measures, ES of −0.64. Especially in relation to the high protein/low carbohydrate diet, ES of −1.04.”
§ Diet, exercise or diet with exercise: comparing the effectiveness of treatment options for weight-loss and changes in fitness for adults (18–65 years old) who are overfat, or obese; systematic review and meta-analysis > Results > Comparison within treatment methods
plaindirect- Asserted: passes — The authors put it forward as true.
- Checkable: passes — It can be checked against evidence.
- Load-bearing: passes — The paper’s conclusions depend on it.
- Based: passes — The paper gives a reason why it holds.
It may state two separate claims as one.
A result the paper reports from its own data — it cites no other source for it, so there is none to check. The quote shows it is in the paper.
In the paper
“There were gender differences noted for effectiveness of treatment for HDL and TG but not for LDL or TC, both of which indicate a larger effectiveness for treatment in female grouping versus male counterparts.”
§ Diet, exercise or diet with exercise: comparing the effectiveness of treatment options for weight-loss and changes in fitness for adults (18–65 years old) who are overfat, or obese; systematic review and meta-analysis > Results > Comparison between treatment effects
hedgeddirect- Asserted: passes — The authors put it forward as true.
- Checkable: passes — It can be checked against evidence.
- Load-bearing: unclear — It is unclear whether the paper’s conclusions depend on it.
- Based: passes — The paper gives a reason why it holds.
It may state two separate claims as one.
A result the paper reports from its own data — it cites no other source for it, so there is none to check. The quote shows it is in the paper.
In the paper
“the use of RT either alone, or in combination with diet, was more effective than diet alone it was less effective than ET or the combination of diet with ET and RT”
§ Diet, exercise or diet with exercise: comparing the effectiveness of treatment options for weight-loss and changes in fitness for adults (18–65 years old) who are overfat, or obese; systematic review and meta-analysis > Results > Comparison between treatment effects
plaindirect- Asserted: passes — The authors put it forward as true.
- Checkable: passes — It can be checked against evidence.
- Load-bearing: passes — The paper’s conclusions depend on it.
- Based: passes — The paper gives a reason why it holds.
It may state two separate claims as one.
The paper states this without a source or data behind it here, so there is nothing to check it against. The quote shows it is in the paper.
In the paper
“very few protocols directly measure the imbalance and no study reviewed on the topic directly measured the energetic shift from either the exercise sessions, the recovery from said sessions.”
§ Diet, exercise or diet with exercise: comparing the effectiveness of treatment options for weight-loss and changes in fitness for adults (18–65 years old) who are overfat, or obese; systematic review and meta-analysis > Discussion
plain- Asserted: passes — The authors put it forward as true.
- Checkable: passes — It can be checked against evidence.
- Load-bearing: passes — The paper’s conclusions depend on it.
- Based: passes — The paper gives a reason why it holds.
It may state two separate claims as one.
A result the paper reports from its own data — it cites no other source for it, so there is none to check. The quote shows it is in the paper.
In the paper
“the use of a ET alone, or in combination with RT, and in combination with diet interventions were not more effect than the combination of RT with diet”
§ Diet, exercise or diet with exercise: comparing the effectiveness of treatment options for weight-loss and changes in fitness for adults (18–65 years old) who are overfat, or obese; systematic review and meta-analysis > Discussion
plain- Asserted: passes — The authors put it forward as true.
- Checkable: passes — It can be checked against evidence.
- Load-bearing: passes — The paper’s conclusions depend on it.
- Based: passes — The paper gives a reason why it holds.
It may state two separate claims as one.
The paper states this without a source or data behind it here, so there is nothing to check it against. The quote shows it is in the paper.
In the paper
“ET appeared to have its greatest effect when either in an interval style of ET, or at higher intensities of at ≥75% VO2max (or HRmax/peak), while not at the traditionally recommended moderate (e.g., 55-75% VO2max, or HRmax/peak) steady-state ET for response to changes in BM and FM, but not for changes in FFM.”
§ Diet, exercise or diet with exercise: comparing the effectiveness of treatment options for weight-loss and changes in fitness for adults (18–65 years old) who are overfat, or obese; systematic review and meta-analysis > Discussion
hedgeddirect- Asserted: passes — The authors put it forward as true.
- Checkable: passes — It can be checked against evidence.
- Load-bearing: passes — The paper’s conclusions depend on it.
- Based: passes — The paper gives a reason why it holds.
It may state two separate claims as one.
The paper states this without a source or data behind it here, so there is nothing to check it against. The quote shows it is in the paper.
In the paper
“all treatments offer a small degree of effectiveness for altering lipid profiles for the individual who is overfat.”
§ Diet, exercise or diet with exercise: comparing the effectiveness of treatment options for weight-loss and changes in fitness for adults (18–65 years old) who are overfat, or obese; systematic review and meta-analysis > Discussion
plaindirect- Asserted: passes — The authors put it forward as true.
- Checkable: passes — It can be checked against evidence.
- Load-bearing: unclear — It is unclear whether the paper’s conclusions depend on it.
- Based: passes — The paper gives a reason why it holds.
The quote only partly states this claim.
The paper states this without a source or data behind it here, so there is nothing to check it against. The quote shows it is in the paper.
In the paper
“there is limited analysis to speculate either to the extent, beyond expected changes toward normal levels, or time frame for changes within anabolic hormones for adults who are overfat.”
§ Diet, exercise or diet with exercise: comparing the effectiveness of treatment options for weight-loss and changes in fitness for adults (18–65 years old) who are overfat, or obese; systematic review and meta-analysis > Discussion
plain- Asserted: passes — The authors put it forward as true.
- Checkable: passes — It can be checked against evidence.
- Load-bearing: fails — The paper’s conclusions may not depend on it.
- Based: passes — The paper gives a reason why it holds.
Probably not a substantial claim. The paper’s conclusions may not depend on it.
A result the paper reports from its own data — it cites no other source for it, so there is none to check. The quote shows it is in the paper.
In the paper
“trends in the data towards the use of exercise (ET, RT or combination thereof) either alone or in combination with diet for effectiveness of treatment over the use of simple dietary interventions.”
§ Diet, exercise or diet with exercise: comparing the effectiveness of treatment options for weight-loss and changes in fitness for adults (18–65 years old) who are overfat, or obese; systematic review and meta-analysis > Discussion
hedgeddirect- Asserted: passes — The authors put it forward as true.
- Checkable: passes — It can be checked against evidence.
- Load-bearing: passes — The paper’s conclusions depend on it.
- Based: passes — The paper gives a reason why it holds.
The quote only partly states this claim.
The paper states this without a source or data behind it here, so there is nothing to check it against. The quote shows it is in the paper.
In the paper
“the combination of diet and exercise was more effective than diet alone or exercise alone.”
§ Diet, exercise or diet with exercise: comparing the effectiveness of treatment options for weight-loss and changes in fitness for adults (18–65 years old) who are overfat, or obese; systematic review and meta-analysis > Discussion
plaindirect- Asserted: passes — The authors put it forward as true.
- Checkable: passes — It can be checked against evidence.
- Load-bearing: passes — The paper’s conclusions depend on it.
- Based: passes — The paper gives a reason why it holds.
The quote only partly states this claim.
A result the paper reports from its own data — it cites no other source for it, so there is none to check. The quote shows it is in the paper.
In the paper
“these responses were highly variable and most of the indications for effectiveness, both as a therapeutic effect and treatment effect, near that point of zero difference in effect (i.e. ES = 0).”
§ Diet, exercise or diet with exercise: comparing the effectiveness of treatment options for weight-loss and changes in fitness for adults (18–65 years old) who are overfat, or obese; systematic review and meta-analysis > Discussion
plain- Asserted: passes — The authors put it forward as true.
- Checkable: passes — It can be checked against evidence.
- Load-bearing: unclear — It is unclear whether the paper’s conclusions depend on it.
- Based: passes — The paper gives a reason why it holds.
It may state two separate claims as one.
The paper states this without a source or data behind it here, so there is nothing to check it against. The quote shows it is in the paper.
In the paper
“diet combined with RT induced an almost equal level of effectiveness to that of diet alone. With both indicated as being less effective than the combination of diet with ET or the combination of diet with ET and RT.”
§ Diet, exercise or diet with exercise: comparing the effectiveness of treatment options for weight-loss and changes in fitness for adults (18–65 years old) who are overfat, or obese; systematic review and meta-analysis > Discussion
plaindirect- Asserted: passes — The authors put it forward as true.
- Checkable: passes — It can be checked against evidence.
- Load-bearing: passes — The paper’s conclusions depend on it.
- Based: passes — The paper gives a reason why it holds.
It may state two separate claims as one.
A result the paper reports from its own data — it cites no other source for it, so there is none to check. The quote shows it is in the paper.
In the paper
“For those who self-select toward ET, it appears that ET is more effective when performed at high intensity (e.g., ≥70% VO2max, or HRmax) steady-state method or as an interval training style (based on ES calculated gives an expectations of at least 40% of the population showing beneficial responses to intervention).”
§ Diet, exercise or diet with exercise: comparing the effectiveness of treatment options for weight-loss and changes in fitness for adults (18–65 years old) who are overfat, or obese; systematic review and meta-analysis > Conclusions
hedgeddirect- Asserted: passes — The authors put it forward as true.
- Checkable: passes — It can be checked against evidence.
- Load-bearing: passes — The paper’s conclusions depend on it.
- Based: passes — The paper gives a reason why it holds.
It may state two separate claims as one.
The paper states this without a source or data behind it here, so there is nothing to check it against. The quote shows it is in the paper.
In the paper
“when exercise is utilized at appropriate intensities (i.e. higher levels) both ET and RT provides an effective stimulus to alter TNF-α, CRP, leptin and adiponectin levels that all indicate a reduction in the risk for cardiovascular disease and improved metabolic flexibility for the adult who is overfat.”
§ Diet, exercise or diet with exercise: comparing the effectiveness of treatment options for weight-loss and changes in fitness for adults (18–65 years old) who are overfat, or obese; systematic review and meta-analysis > Conclusions
hedgeddirect- Asserted: passes — The authors put it forward as true.
- Checkable: passes — It can be checked against evidence.
- Load-bearing: passes — The paper’s conclusions depend on it.
- Based: passes — The paper gives a reason why it holds.
It may state two separate claims as one.
None of the sources cited for this claim have been checked yet.
In the paper
“While others [4,9-12] have indicated the responses are more related to an energetic imbalance (e.g., kcal/day, kJ/day) between dietary caloric load and expenditure from activity that results from the intervention of choice (e.g., diet, exercise, or combination therein) than the actual intervention for the adult who is overfat.”
§ Diet, exercise or diet with exercise: comparing the effectiveness of treatment options for weight-loss and changes in fitness for adults (18–65 years old) who are overfat, or obese; systematic review and meta-analysis > Introduction
What the sources say
- Not checked yetcites [4] Hansen D, Dendale P, Berger J, van Loon LJC, Meeusen R. The effects of exercise training on fat-mass loss in obese patients during energy intake restriction. Sports Med. 2007;37:31–46. source
- Not checked yetcites [9] Votruba SB, Horvitz MA, Schoeller DA. The role of exercise in the treatment of obesity. Nutrition. 2000;16:179–88. source
- Not checked yetcites [10] Larson-Meyer DE, Redman L, Heilbronn LK, Martin CK, Ravussin E. Caloric restriction with or without exercise: the fitness versus fatness debate. Med Sci Sports Exerc. 2010;42:152–9. source
- Not checked yetcites [11] Lee S, Kuk JL, Davidson LE, Hudson R, Kilpatrick K, Graham TE, et al. Exercise without weight loss is an effective strategy for obesity reduction in obese individuals with and without Type 2 diabetes. J Appl Physiol. 2005;99:1220–5. source
- Not checked yetcites [12] Williams PT. Health effects resulting from exercise versus those from body fat loss. Med Sci Sports Exerc. 2001;33:S611–21. discussion S640-611. source
hedgedcorrelational- Asserted: passes — The authors put it forward as true.
- Checkable: passes — It can be checked against evidence.
- Load-bearing: passes — The paper’s conclusions depend on it.
- Based: passes — The paper gives a reason why it holds.
Probably not a substantial claim.
None of the sources cited for this claim have been checked yet.
In the paper
“several authors [4-9] have previously noted that there are limited differences in results for absolute changes in body composition with comparison between the various methodologies employed for treatment of weight issues for an individual who is overfat.”
§ Diet, exercise or diet with exercise: comparing the effectiveness of treatment options for weight-loss and changes in fitness for adults (18–65 years old) who are overfat, or obese; systematic review and meta-analysis > Introduction
What the sources say
- Not checked yetcites [4] Hansen D, Dendale P, Berger J, van Loon LJC, Meeusen R. The effects of exercise training on fat-mass loss in obese patients during energy intake restriction. Sports Med. 2007;37:31–46. source
- Not checked yetcites [5] Hainer V, Toplak H, Mitrakou A. Treatment modalities of obesity: what fits whom? Diabetes Care. 2008;31 Suppl 2:S269–77. source
- Not checked yetcites [6] Lee DC, Sui X, Blair SN. Does physical activity ameliorate the health hazards of obesity? Br J Sports Med. 2009;43:49–51. source
- Not checked yetcites [7] Strasser B, Spreitzer A, Haber P. Fat loss depends on energy deficit only, independently of the method for weight loss. Ann Nutr Metab. 2007;51:428–32. source
- Not checked yetcites [8] Varady KA, Bhutani S, Klempel MC, Kroeger CM. Comparison of effects of diet versus exercise weight loss regimens on LDL and HDL particle size in obese adults. Lipids Health Dis. 2011;10:119. source
- Not checked yetcites [9] Votruba SB, Horvitz MA, Schoeller DA. The role of exercise in the treatment of obesity. Nutrition. 2000;16:179–88. source
plain- Asserted: passes — The authors put it forward as true.
- Checkable: passes — It can be checked against evidence.
- Load-bearing: passes — The paper’s conclusions depend on it.
- Based: passes — The paper gives a reason why it holds.
Probably not a substantial claim.
None of the sources cited for this claim have been checked yet.
In the paper
“Something that has become evident in the low attrition rates within many exercise programs and the high rate of repeated hypocaloric diet attempts [13-16].”
§ Diet, exercise or diet with exercise: comparing the effectiveness of treatment options for weight-loss and changes in fitness for adults (18–65 years old) who are overfat, or obese; systematic review and meta-analysis > Introduction
What the sources say
- Not checked yetcites [13] Brock DW, Irving BA, Gower B, Hunter GR. Differences emerge in visceral adipose tissue accumulation after selection for innate cardiovascular fitness. Int J Obesity (2005). 2011;35;2:309–12. source
- Not checked yetcites [14] Eriksson JG. Exercise and the treatment of type 2 diabetes mellitus. An update. Sports Med. 1999;27:381–91. source
- Not checked yetcites [15] Fogelholm M. How physical activity can work? Int J Pediatr Obes. 2008;3 Suppl 1:10–4. source
- Not checked yetcites [16] Hooper LE, Foster-Schubert KE, Weigle DS, Sorensen B, Ulrich CM, McTiernan A. Frequent intentional weight loss is associated with higher ghrelin and lower glucose and androgen levels in postmenopausal women. Nutri Res (New York, NY). 2010;30:163–70. source
plain- Asserted: passes — The authors put it forward as true.
- Checkable: passes — It can be checked against evidence.
- Load-bearing: unclear — It is unclear whether the paper’s conclusions depend on it.
- Based: passes — The paper gives a reason why it holds.
It may state two separate claims as one.
None of the sources cited for this claim have been checked yet.
In the paper
“Even if it is well understood that altering any health behaviors leads to a reduction in the risk factors for preventable non-communicable diseases [18,20,26-33].”
§ Diet, exercise or diet with exercise: comparing the effectiveness of treatment options for weight-loss and changes in fitness for adults (18–65 years old) who are overfat, or obese; systematic review and meta-analysis > Introduction
What the sources say
- Not checked yetcites [18] Bruunsgaard H. Physical activity and modulation of systemic low-level inflammation. J Leukoc Biol. 2005;78:819–35. source
- Not checked yetcites [20] Duncan GE. The “fit but fat” concept revisited: population-based estimates using NHANES. Int J Behav Nutr Phys Act. 2010;7:47. source
- Not checked yetcites [26] Booth FW, Gordon SE, Carlson CJ, Hamilton MT. Waging war on modern chronic diseases: primary prevention through exercise biology. J Appl Physiol (Bethesda, Md : 1985). 2000;88:774–87. source
- Not checked yetcites [27] Clark JE. Role of resistance training in obesity treatments. 1st International Conference on Obesity, OMICS. Philadelphia, PA, 2012.
- Not checked yetcites [28] Clark JE, Goon DT. The roles of resistance training for treatment of obesity related health issue and for changing health status of the individual who is overfat or obese: A review. J Sports Med Phys Fit. 2015;55(3):205–22.
- Not checked yetcites [29] Fantuzzi G. Adipose tissue, adipokines, and inflammation. J Allergy Clin Immunol. 2005;115:911–9. quiz 920. source
- Not checked yetcites [30] Hood DA, Irrcher I, Ljubicic V, Joseph A-M. Coordination of metabolic plasticity in skeletal muscle. J Exp Biol. 2006;209:2265–75. source
- Not checked yetcites [31] Matheson EM, King DE, Everett CJ. Healthy lifestyle habits and mortality in overweight and obese individuals. J Am Board Fam Med. 2012;25:9–15. source
- Not checked yetcites [32] Mathur N, Pedersen BK. Exercise as a mean to control low-grade systemic inflammation. Mediators Inflamm. 2008;2008:109502. source
- Not checked yetcites [33] Müssig K, Remer T, Maser-Gluth C. Brief review: Glucocorticoid excretion in obesity. J Steroid Biochem Mol Biol. 2010;121(3–5):589–93. source
boosteddirect- Asserted: passes — The authors put it forward as true.
- Checkable: passes — It can be checked against evidence.
- Load-bearing: fails — The paper’s conclusions may not depend on it.
- Based: passes — The paper gives a reason why it holds.
Probably not a substantial claim. The paper’s conclusions may not depend on it.
None of the sources cited for this claim have been checked yet.
In the paper
“And a methodological bias in the employment of exercise that leads to an over recommendation of a single type of exercise based on personal preference [27,55-57].”
§ Diet, exercise or diet with exercise: comparing the effectiveness of treatment options for weight-loss and changes in fitness for adults (18–65 years old) who are overfat, or obese; systematic review and meta-analysis > Introduction
What the sources say
- Not checked yetcites [27] Clark JE. Role of resistance training in obesity treatments. 1st International Conference on Obesity, OMICS. Philadelphia, PA, 2012.
- Not checked yetcites [55] American Heart Association Nutritional Committee, Lichtenstein AH, Appel LJ, Brands M, Carnethon M, Daniels S, et al. Diet and lifestyle recommendations revision 2006: a scientific statement from the American Heart Association Nutrition Committee. Circulation. 2006;114:82–96. source
- Not checked yetcites [56] Garland T, Schutz H, Chappell MA, Keeney BK, Meek TH, Copes LE, et al. The biological control of voluntary exercise, spontaneous physical activity and daily energy expenditure in relation to obesity: human and rodent perspectives. J Exp Biol. 2011;214:206–29. source
- Not checked yetcites [57] Booth FW, Laye MJ. Lack of adequate appreciation of physical exercise’s complexities can pre-empt appropriate design and interpretation in scientific discovery. J Physiol Lond. 2009;587:5527–39. source
plaindirect- Asserted: passes — The authors put it forward as true.
- Checkable: passes — It can be checked against evidence.
- Load-bearing: fails — The paper’s conclusions may not depend on it.
- Based: passes — The paper gives a reason why it holds.
Probably not a substantial claim. The paper’s conclusions may not depend on it.
None of the sources cited for this claim have been checked yet.
In the paper
“With low utilization of healthy behaviors eliciting changes indicated to increase the risk for the development of metabolic issues, which may culminate in Type 2 Diabetes Mellitus (T2DM), and are readily associated with reduced work capacity and anabolic hormone response for the individual who is overfat [18,26,27].”
§ Diet, exercise or diet with exercise: comparing the effectiveness of treatment options for weight-loss and changes in fitness for adults (18–65 years old) who are overfat, or obese; systematic review and meta-analysis > Introduction
What the sources say
- Not checked yetcites [18] Bruunsgaard H. Physical activity and modulation of systemic low-level inflammation. J Leukoc Biol. 2005;78:819–35. source
- Not checked yetcites [26] Booth FW, Gordon SE, Carlson CJ, Hamilton MT. Waging war on modern chronic diseases: primary prevention through exercise biology. J Appl Physiol (Bethesda, Md : 1985). 2000;88:774–87. source
- Not checked yetcites [27] Clark JE. Role of resistance training in obesity treatments. 1st International Conference on Obesity, OMICS. Philadelphia, PA, 2012.
hedgedconditional- Asserted: passes — The authors put it forward as true.
- Checkable: passes — It can be checked against evidence.
- Load-bearing: passes — The paper’s conclusions depend on it.
- Based: passes — The paper gives a reason why it holds.
It may state two separate claims as one.
What the paper did — it cites no source for this, so there is none to check. The quote shows it is in the paper.
In the paper
“were retrieved from electronic database search engines (PubMed, EBSCO Host (CINAHL, SPORTDiscus) and Scopus) using the following key words in combination with each other”
§ Diet, exercise or diet with exercise: comparing the effectiveness of treatment options for weight-loss and changes in fitness for adults (18–65 years old) who are overfat, or obese; systematic review and meta-analysis > Methods
plain- Asserted: passes — The authors put it forward as true.
- Checkable: passes — It can be checked against evidence.
- Load-bearing: fails — The paper’s conclusions may not depend on it.
- Based: passes — The paper gives a reason why it holds.
Probably not a substantial claim. The paper’s conclusions may not depend on it.
What the paper did — it cites no source for this, so there is none to check. The quote shows it is in the paper.
In the paper
“Study population was either identified as either “overweight” or “obese” by authors or was indicated within the study as meeting at least 1 of the classification metrics for being overweight or obese (i.e. BMI > 25 kg/m3 or WHO levels of %BF for classification based on age and gender)”
§ Diet, exercise or diet with exercise: comparing the effectiveness of treatment options for weight-loss and changes in fitness for adults (18–65 years old) who are overfat, or obese; systematic review and meta-analysis > Methods
plain- Asserted: passes — The authors put it forward as true.
- Checkable: passes — It can be checked against evidence.
- Load-bearing: passes — The paper’s conclusions depend on it.
- Based: passes — The paper gives a reason why it holds.
Probably not a substantial claim.
What the paper did — it cites no source for this, so there is none to check. The quote shows it is in the paper.
In the paper
“Published in English or translation of article available”
§ Diet, exercise or diet with exercise: comparing the effectiveness of treatment options for weight-loss and changes in fitness for adults (18–65 years old) who are overfat, or obese; systematic review and meta-analysis > Methods
plain- Asserted: passes — The authors put it forward as true.
- Checkable: passes — It can be checked against evidence.
- Load-bearing: fails — The paper’s conclusions may not depend on it.
- Based: passes — The paper gives a reason why it holds.
Probably not a substantial claim. The paper’s conclusions may not depend on it.
What the paper did — it cites no source for this, so there is none to check. The quote shows it is in the paper.
In the paper
“Indication of use of dietary supplement, or pharmacological dosing of anabolic or androgenic hormones.”
§ Diet, exercise or diet with exercise: comparing the effectiveness of treatment options for weight-loss and changes in fitness for adults (18–65 years old) who are overfat, or obese; systematic review and meta-analysis > Methods
plain- Asserted: passes — The authors put it forward as true.
- Checkable: passes — It can be checked against evidence.
- Load-bearing: fails — The paper’s conclusions may not depend on it.
- Based: passes — The paper gives a reason why it holds.
Probably not a substantial claim. The paper’s conclusions may not depend on it.
What the paper did — it cites no source for this, so there is none to check. The quote shows it is in the paper.
In the paper
“Publication was a review article”
§ Diet, exercise or diet with exercise: comparing the effectiveness of treatment options for weight-loss and changes in fitness for adults (18–65 years old) who are overfat, or obese; systematic review and meta-analysis > Methods
plain- Asserted: passes — The authors put it forward as true.
- Checkable: passes — It can be checked against evidence.
- Load-bearing: fails — The paper’s conclusions may not depend on it.
- Based: passes — The paper gives a reason why it holds.
Probably not a substantial claim. The paper’s conclusions may not depend on it.
What the paper did — it cites no source for this, so there is none to check. The quote shows it is in the paper.
In the paper
“Study design examined strictly acute responses (i.e., single exercise bout, or intervention lastly fewer than 4 weeks in duration)”
§ Diet, exercise or diet with exercise: comparing the effectiveness of treatment options for weight-loss and changes in fitness for adults (18–65 years old) who are overfat, or obese; systematic review and meta-analysis > Methods
plain- Asserted: passes — The authors put it forward as true.
- Checkable: passes — It can be checked against evidence.
- Load-bearing: fails — The paper’s conclusions may not depend on it.
- Based: passes — The paper gives a reason why it holds.
Probably not a substantial claim. The paper’s conclusions may not depend on it.
What the paper did — it cites no source for this, so there is none to check. The quote shows it is in the paper.
In the paper
“Study design did not randomly assign subjects to a training group or control, or order of intervention”
§ Diet, exercise or diet with exercise: comparing the effectiveness of treatment options for weight-loss and changes in fitness for adults (18–65 years old) who are overfat, or obese; systematic review and meta-analysis > Methods
plain- Asserted: passes — The authors put it forward as true.
- Checkable: passes — It can be checked against evidence.
- Load-bearing: passes — The paper’s conclusions depend on it.
- Based: passes — The paper gives a reason why it holds.
Probably not a substantial claim.
None of the sources cited for this claim have been checked yet.
In the paper
“Comparison of responses must not come from the absolute value for changes indicated by each study, but as performed here through the aggregation of responses based on the pooled effect for ES that over the sum of all studies. Thus reflecting a more reliable overall effectiveness and provide a greater insight into the treatment phenomenon being offered [22,23].”
§ Diet, exercise or diet with exercise: comparing the effectiveness of treatment options for weight-loss and changes in fitness for adults (18–65 years old) who are overfat, or obese; systematic review and meta-analysis > Introduction
What the sources say
plaindirect- Asserted: passes — The authors put it forward as true.
- Checkable: passes — It can be checked against evidence.
- Load-bearing: passes — The paper’s conclusions depend on it.
- Based: passes — The paper gives a reason why it holds.
It may state two separate claims as one.
What the paper did — it cites no source for this, so there is none to check. The quote shows it is in the paper.
In the paper
“Population age could be classified as adolescent, or juvenile, (average age < 18 years of age) and/or elderly (average age > 65 years of age)”
§ Diet, exercise or diet with exercise: comparing the effectiveness of treatment options for weight-loss and changes in fitness for adults (18–65 years old) who are overfat, or obese; systematic review and meta-analysis > Methods
hedged- Asserted: passes — The authors put it forward as true.
- Checkable: passes — It can be checked against evidence.
- Load-bearing: passes — The paper’s conclusions depend on it.
- Based: passes — The paper gives a reason why it holds.
Probably not a substantial claim.
What the paper did — it cites no source for this, so there is none to check. The quote shows it is in the paper.
In the paper
“pooled ES and confidence intervals (CI.95) of ES for each measure of interest was determined to examine the overall effect relative to a case of no change (i.e. CI.95 crossing zero within the 95% of all expected scores)”
§ Diet, exercise or diet with exercise: comparing the effectiveness of treatment options for weight-loss and changes in fitness for adults (18–65 years old) who are overfat, or obese; systematic review and meta-analysis > Methods
plain- Asserted: passes — The authors put it forward as true.
- Checkable: passes — It can be checked against evidence.
- Load-bearing: passes — The paper’s conclusions depend on it.
- Based: passes — The paper gives a reason why it holds.
Probably not a substantial claim.
What the paper did — it cites no source for this, so there is none to check. The quote shows it is in the paper.
In the paper
“Study population either failed to meet metrics for classification as “obese” or “overweight”, or was indicated to have secondary disease (e.g., cancer, osteoporosis, cardiovascular disease) or had populations indicated to have history of metabolic variables and concurrent treatments (e.g., smoking, pharmacologically controlled type-2 diabetes mellitus (T2DM), cardiovascular diseases) that might co”
§ Diet, exercise or diet with exercise: comparing the effectiveness of treatment options for weight-loss and changes in fitness for adults (18–65 years old) who are overfat, or obese; systematic review and meta-analysis > Methods
plain- Asserted: passes — The authors put it forward as true.
- Checkable: passes — It can be checked against evidence.
- Load-bearing: passes — The paper’s conclusions depend on it.
- Based: passes — The paper gives a reason why it holds.
Probably not a substantial claim. It may state two separate claims as one.
What the paper did — it cites no source for this, so there is none to check. The quote shows it is in the paper.
In the paper
“Results did not report absolute changes in hormones or body mass following intervention”
§ Diet, exercise or diet with exercise: comparing the effectiveness of treatment options for weight-loss and changes in fitness for adults (18–65 years old) who are overfat, or obese; systematic review and meta-analysis > Methods
plain- Asserted: passes — The authors put it forward as true.
- Checkable: passes — It can be checked against evidence.
- Load-bearing: fails — The paper’s conclusions may not depend on it.
- Based: passes — The paper gives a reason why it holds.
Probably not a substantial claim. The paper’s conclusions may not depend on it.
What the paper did — it cites no source for this, so there is none to check. The quote shows it is in the paper.
In the paper
“Published original research from January 1980-April 2013”
§ Diet, exercise or diet with exercise: comparing the effectiveness of treatment options for weight-loss and changes in fitness for adults (18–65 years old) who are overfat, or obese; systematic review and meta-analysis > Methods
plain- Asserted: passes — The authors put it forward as true.
- Checkable: passes — It can be checked against evidence.
- Load-bearing: fails — The paper’s conclusions may not depend on it.
- Based: passes — The paper gives a reason why it holds.
Probably not a substantial claim. The paper’s conclusions may not depend on it.
What the paper did — it cites no source for this, so there is none to check. The quote shows it is in the paper.
In the paper
“Utilized only human participants with reported average age for volunteers ranging from 18 and 65 years of age during the duration for the experiment”
§ Diet, exercise or diet with exercise: comparing the effectiveness of treatment options for weight-loss and changes in fitness for adults (18–65 years old) who are overfat, or obese; systematic review and meta-analysis > Methods
plain- Asserted: passes — The authors put it forward as true.
- Checkable: passes — It can be checked against evidence.
- Load-bearing: passes — The paper’s conclusions depend on it.
- Based: passes — The paper gives a reason why it holds.
Probably not a substantial claim. It may state two separate claims as one.
What the paper did — it cites no source for this, so there is none to check. The quote shows it is in the paper.
In the paper
“Study design utilized an animal model for the problem”
§ Diet, exercise or diet with exercise: comparing the effectiveness of treatment options for weight-loss and changes in fitness for adults (18–65 years old) who are overfat, or obese; systematic review and meta-analysis > Methods
plain- Asserted: passes — The authors put it forward as true.
- Checkable: passes — It can be checked against evidence.
- Load-bearing: fails — The paper’s conclusions may not depend on it.
- Based: passes — The paper gives a reason why it holds.
Probably not a substantial claim. The paper’s conclusions may not depend on it.
What the paper did — it cites no source for this, so there is none to check. The quote shows it is in the paper.
In the paper
“This tiered meta-analysis of 66-population based studies, and 162-studywise groups”
- Also stated in: § Methods · plain
“From the initial abstracts screened, a total of 66 studies were included in the meta-analysis, from which 162 study groups were included for comparison of responses within the review.”
§ Diet, exercise or diet with exercise: comparing the effectiveness of treatment options for weight-loss and changes in fitness for adults (18–65 years old) who are overfat, or obese; systematic review and meta-analysis > Abstract
plain- Asserted: passes — The authors put it forward as true.
- Checkable: passes — It can be checked against evidence.
- Load-bearing: fails — The paper’s conclusions may not depend on it.
- Based: passes — The paper gives a reason why it holds.
Probably not a substantial claim. The paper’s conclusions may not depend on it. It may state two separate claims as one.
- Also stated in: § Methods · plain
What the paper did — it cites no source for this, so there is none to check. The quote shows it is in the paper.
In the paper
“Each included study was then classified by parameter of measurement and method, along with categorization of the method, of therapeutic intervention”
§ Diet, exercise or diet with exercise: comparing the effectiveness of treatment options for weight-loss and changes in fitness for adults (18–65 years old) who are overfat, or obese; systematic review and meta-analysis > Methods
plain- Asserted: passes — The authors put it forward as true.
- Checkable: passes — It can be checked against evidence.
- Load-bearing: passes — The paper’s conclusions depend on it.
- Based: passes — The paper gives a reason why it holds.
Probably not a substantial claim.
What the paper did — it cites no source for this, so there is none to check. The quote shows it is in the paper.
In the paper
“study data (reported means and standard deviation/error for measures of interest, number of subjects in each study groups, duration of study) were entered into database for subsequent analysis”
§ Diet, exercise or diet with exercise: comparing the effectiveness of treatment options for weight-loss and changes in fitness for adults (18–65 years old) who are overfat, or obese; systematic review and meta-analysis > Methods
plain- Asserted: passes — The authors put it forward as true.
- Checkable: passes — It can be checked against evidence.
- Load-bearing: passes — The paper’s conclusions depend on it.
- Based: passes — The paper gives a reason why it holds.
Probably not a substantial claim.
What the paper did — it cites no source for this, so there is none to check. The quote shows it is in the paper.
In the paper
“Studies compared at least two conditions (either within subject cross-over design or comparison to a control or basal/baseline) and involved random assignment to training group(s) or control and to the order or method of training”
§ Diet, exercise or diet with exercise: comparing the effectiveness of treatment options for weight-loss and changes in fitness for adults (18–65 years old) who are overfat, or obese; systematic review and meta-analysis > Methods
plain- Asserted: passes — The authors put it forward as true.
- Checkable: passes — It can be checked against evidence.
- Load-bearing: passes — The paper’s conclusions depend on it.
- Based: passes — The paper gives a reason why it holds.
Probably not a substantial claim. It may state two separate claims as one.
What the paper did — it cites no source for this, so there is none to check. The quote shows it is in the paper.
In the paper
“Study designs examined chronic adaptations (i.e. multiple training sessions, or interventions lasting at least 4 weeks in duration)”
§ Diet, exercise or diet with exercise: comparing the effectiveness of treatment options for weight-loss and changes in fitness for adults (18–65 years old) who are overfat, or obese; systematic review and meta-analysis > Methods
plain- Asserted: passes — The authors put it forward as true.
- Checkable: passes — It can be checked against evidence.
- Load-bearing: passes — The paper’s conclusions depend on it.
- Based: passes — The paper gives a reason why it holds.
Probably not a substantial claim.
What the paper did — it cites no source for this, so there is none to check. The quote shows it is in the paper.
In the paper
“This standardized ES across all studies was undertaken in an effort to control for difference in methods of measurement and distinct (unique) qualified differences in the therapeutic interventions (see Table 1).”
§ Diet, exercise or diet with exercise: comparing the effectiveness of treatment options for weight-loss and changes in fitness for adults (18–65 years old) who are overfat, or obese; systematic review and meta-analysis > Methods
plain- Asserted: passes — The authors put it forward as true.
- Checkable: passes — It can be checked against evidence.
- Load-bearing: passes — The paper’s conclusions depend on it.
- Based: passes — The paper gives a reason why it holds.
Probably not a substantial claim.
None of the sources cited for this claim have been checked yet.
In the paper
“Based on the premise for comparing ES previously utilized [58-60], for each of the measures of interest based on the therapeutic intervention (Figure 1).”
§ Diet, exercise or diet with exercise: comparing the effectiveness of treatment options for weight-loss and changes in fitness for adults (18–65 years old) who are overfat, or obese; systematic review and meta-analysis > Methods
What the sources say
- Not checked yetcites [58] Becker B. Synthesizing stanardized mean-changing measures. Br J Math Stat Psychol. 1988;41:257–78. source
- Not checked yetcites [59] Krieger JW. Single vs. multiple sets of resistance exercise for muscle hypertrophy: a meta-analysis. J Strength Cond Res. 2010;24:1150–9. source
- Not checked yetcites [60] Morris S, DeShon RP. Combining effect size estimates in meta-analysis with repeated measures and independent-groups designs. Psychol Methods. 2002;7:105–25. source
plain- Asserted: passes — The authors put it forward as true.
- Checkable: passes — It can be checked against evidence.
- Load-bearing: fails — The paper’s conclusions may not depend on it.
- Based: passes — The paper gives a reason why it holds.
Probably not a substantial claim. The paper’s conclusions may not depend on it.
None of the sources cited for this claim have been checked yet.
In the paper
“The changes elicited in humoral factors (e.g., hormone/cytokines, blood lipids and biomarkers of inflammation) are necessary for improvement in health status that many have previously discussed in a number of reviews on this topic [18-21,26,31,32,34,42].”
§ Diet, exercise or diet with exercise: comparing the effectiveness of treatment options for weight-loss and changes in fitness for adults (18–65 years old) who are overfat, or obese; systematic review and meta-analysis > Discussion
What the sources say
- Not checked yetcites [18] Bruunsgaard H. Physical activity and modulation of systemic low-level inflammation. J Leukoc Biol. 2005;78:819–35. source
- Not checked yetcites [19] Clark JE. An overview of the contribution of fatness and fitness factors, and the role of exercise, in the formation of health status for individuals who are overweight. J Diab Metab Disord. 2012;11:19. source
- Not checked yetcites [20] Duncan GE. The “fit but fat” concept revisited: population-based estimates using NHANES. Int J Behav Nutr Phys Act. 2010;7:47. source
- Not checked yetcites [21] McAuley PA, Blair SN. Obesity paradoxes. J Sports Sci. 2011;29:773–82. source
- Not checked yetcites [26] Booth FW, Gordon SE, Carlson CJ, Hamilton MT. Waging war on modern chronic diseases: primary prevention through exercise biology. J Appl Physiol (Bethesda, Md : 1985). 2000;88:774–87. source
- Not checked yetcites [31] Matheson EM, King DE, Everett CJ. Healthy lifestyle habits and mortality in overweight and obese individuals. J Am Board Fam Med. 2012;25:9–15. source
- Not checked yetcites [32] Mathur N, Pedersen BK. Exercise as a mean to control low-grade systemic inflammation. Mediators Inflamm. 2008;2008:109502. source
- Not checked yetcites [34] Bastard J-P, Maachi M, Lagathu C, Kim MJ, Caron M, Vidal H, et al. Recent advances in the relationship between obesity, inflammation, and insulin resistance. Eur Cytokine Netw. 2006;17:4–12.
- Not checked yetcites [42] Maya-Monteiro CM, Bozza PT. Leptin and mTOR: partners in metabolism and inflammation. Cell Cycle. 2008;7:1713–7. source
plaindirect- Asserted: passes — The authors put it forward as true.
- Checkable: passes — It can be checked against evidence.
- Load-bearing: fails — The paper’s conclusions may not depend on it.
- Based: passes — The paper gives a reason why it holds.
Probably not a substantial claim. The paper’s conclusions may not depend on it.
A conclusion the paper draws from its own results — it cites no other source for it, so there is none to check. The quote shows it is in the paper.
In the paper
“Indicating a possible metabolic difference between exercise modalities that might induce the differential cardiovascular adaptations noted following these distinct intervention protocols.”
§ Diet, exercise or diet with exercise: comparing the effectiveness of treatment options for weight-loss and changes in fitness for adults (18–65 years old) who are overfat, or obese; systematic review and meta-analysis > Discussion
hedgedconditional- Asserted: passes — The authors put it forward as true.
- Checkable: passes — It can be checked against evidence.
- Load-bearing: fails — The paper’s conclusions may not depend on it.
- Based: passes — The paper gives a reason why it holds.
Probably not a substantial claim. The paper’s conclusions may not depend on it.
None of the sources cited for this claim have been checked yet.
In the paper
“any treatment is able to produce an effective change that leads toward a normal “healthy” range, thus leading to a reduced risk for development of cardiovascular disease and improvements in work capacity and overall health”
§ Diet, exercise or diet with exercise: comparing the effectiveness of treatment options for weight-loss and changes in fitness for adults (18–65 years old) who are overfat, or obese; systematic review and meta-analysis > Discussion
What the sources say
- Not checked yetcites [18] Bruunsgaard H. Physical activity and modulation of systemic low-level inflammation. J Leukoc Biol. 2005;78:819–35. source
- Not checked yetcites [26] Booth FW, Gordon SE, Carlson CJ, Hamilton MT. Waging war on modern chronic diseases: primary prevention through exercise biology. J Appl Physiol (Bethesda, Md : 1985). 2000;88:774–87. source
- Not checked yetcites [32] Mathur N, Pedersen BK. Exercise as a mean to control low-grade systemic inflammation. Mediators Inflamm. 2008;2008:109502. source
- Not checked yetcites [34] Bastard J-P, Maachi M, Lagathu C, Kim MJ, Caron M, Vidal H, et al. Recent advances in the relationship between obesity, inflammation, and insulin resistance. Eur Cytokine Netw. 2006;17:4–12.
- Not checked yetcites [42] Maya-Monteiro CM, Bozza PT. Leptin and mTOR: partners in metabolism and inflammation. Cell Cycle. 2008;7:1713–7. source
- Not checked yetcites [68] Buford TW, Cooke MB, Willoughby DS. Resistance exercise-induced changes of inflammatory gene expression within human skeletal muscle. Eur J Appl Physiol. 2009;107:463–71. source
plaindirect- Asserted: passes — The authors put it forward as true.
- Checkable: passes — It can be checked against evidence.
- Load-bearing: unclear — It is unclear whether the paper’s conclusions depend on it.
- Based: passes — The paper gives a reason why it holds.
It may state two separate claims as one. The quote only partly states this claim.
A conclusion the paper draws from its own results — it cites no other source for it, so there is none to check. The quote shows it is in the paper.
In the paper
“there is an indication for the role of the metabolic demand of treatment eliciting differential response to cytokine and adipokine signals that alter whole body metabolism.”
§ Diet, exercise or diet with exercise: comparing the effectiveness of treatment options for weight-loss and changes in fitness for adults (18–65 years old) who are overfat, or obese; systematic review and meta-analysis > Discussion
hedgeddirect- Asserted: passes — The authors put it forward as true.
- Checkable: passes — It can be checked against evidence.
- Load-bearing: fails — The paper’s conclusions may not depend on it.
- Based: fails — The paper may give no reason why it holds.
Probably not a substantial claim. The paper’s conclusions may not depend on it. The paper may give no reason why it holds.
A conclusion the paper draws from its own results — it cites no other source for it, so there is none to check. The quote shows it is in the paper.
In the paper
“reinforces the idea of a more complex network of factors that influence overall body composition and health issues for the adult who is overfat, and further stresses the idea to focus treatment on generating a metabolic stress to induce chronic endocrinological (and cytokine) changes as opposed to the focus on the kcal/d (kJ/d) ratios of intake to expenditure.”
§ Diet, exercise or diet with exercise: comparing the effectiveness of treatment options for weight-loss and changes in fitness for adults (18–65 years old) who are overfat, or obese; systematic review and meta-analysis > Conclusions
plaindirect- Asserted: passes — The authors put it forward as true.
- Checkable: fails — It may be too vague to check against evidence.
- Load-bearing: passes — The paper’s conclusions depend on it.
- Based: passes — The paper gives a reason why it holds.
Probably not a substantial claim. It may be too vague to check against evidence. It may state two separate claims as one.
A conclusion the paper draws from its own results — it cites no other source for it, so there is none to check. The quote shows it is in the paper.
In the paper
“the concept of self-selection of exercise patterns means that some adults who are overfat may select toward protocols of ET for exercise.”
§ Diet, exercise or diet with exercise: comparing the effectiveness of treatment options for weight-loss and changes in fitness for adults (18–65 years old) who are overfat, or obese; systematic review and meta-analysis > Conclusions
hedgedconditional- Asserted: passes — The authors put it forward as true.
- Checkable: passes — It can be checked against evidence.
- Load-bearing: passes — The paper’s conclusions depend on it.
- Based: fails — The paper may give no reason why it holds.
Probably not a substantial claim. The paper may give no reason why it holds.
A conclusion the paper draws from its own results — it cites no other source for it, so there is none to check. The quote shows it is in the paper.
In the paper
“the energetic imbalance is based on an assumption that might not be held in all cases”
§ Diet, exercise or diet with exercise: comparing the effectiveness of treatment options for weight-loss and changes in fitness for adults (18–65 years old) who are overfat, or obese; systematic review and meta-analysis > Conclusions
hedged- Asserted: passes — The authors put it forward as true.
- Checkable: passes — It can be checked against evidence.
- Load-bearing: fails — The paper’s conclusions may not depend on it.
- Based: fails — The paper may give no reason why it holds.
Probably not a substantial claim. The paper’s conclusions may not depend on it. The paper may give no reason why it holds.
- Rests on an assumption: Changes in body composition and health status in overfat adults arise from a highly elaborate network of interacting factors that confound each other's impact.
The authors state this as an assumption.
There are differences in energetic balance across the various treatment interventions.
“Lastly, as related to changes in caloric (energetic) balance there were no differences noted between any of the pooled ES for the assumed differences in energetic balance across the various treatment interventions.”
The authors state this as an assumption.
The energetic imbalances indicated in the reviewed studies are assumed differences in energetic balance, not directly measured.
“Principally that the indicated energetic imbalances are an assumed difference in energetic balance.”
The authors state this as an assumption.
The relationship between caloric imbalance and body composition changes is classically assumed to be one of equivalence.
“Where if the assumption is correct, there should be a relationship of equivalence in effectiveness for changing caloric balance with body compositional changes between treatment methods.”
The paper relies on this without support.
Changes in body composition and health status in overfat adults arise from a highly elaborate network of interacting factors that confound each other's impact.
“As changes to not only body composition but also health status comes from manipulation of highly elaborate network of factors that interact, compliment and confound the impact of each other for the adult who is overfat leading to not only body compositional changes, but reversal of the deleterious health outcome of being overfat.”
Claims other papers make about this one
Each is checked against this paper’s own text: does it say what the citing paper says it does?
In the citing paper
“whereas improvements in VO2max and in some cases decreased BMI and blood pressure are similarly reported by applying resistance training alone. 16 , 18 , 19 , 20 , 21 , 22 , 23”
From What exercise prescription is optimal to improve body composition and cardiorespiratory fitness in adults living with obesity? A network meta‐analysis (2021) · cites this paper as [18]
In the citing paper
“with both authors reporting, that for weight loss, exercise alone is not an effective therapy, a hypocaloric balance is necessary.”
From What exercise prescription is optimal to improve body composition and cardiorespiratory fitness in adults living with obesity? A network meta‐analysis (2021) · cites this paper as [18]
In the citing paper
“even the most recent meta‐analyses investigating the effectiveness of different exercise interventions for adults living with obesity continue to exclusively focus on anthropometric measures to establish efficacy or effectiveness 18 , 89 and do not include CRF in their analyses.”
From What exercise prescription is optimal to improve body composition and cardiorespiratory fitness in adults living with obesity? A network meta‐analysis (2021) · cites this paper as [18]
Self-check
Percentages, sums and reported differences re-computed from the paper’s own numbers.
Each contradiction between two passages listed here was confirmed by an independent check.
Rated major: it would touch a result — a value a result rests on, reported and recomputed p-values on opposite sides of the significance level, two passages that conflict with no sign which is right, or a cited work retracted before this paper was published.
In the paper
§ Diet, exercise or diet with exercise: comparing the effectiveness of treatment options for weight-loss and changes in fitness for adults (18–65 years old) who are overfat, or obese; systematic review and meta-analysis > Abstract
“reducing total cholesterol (ES = 0.85), triglycerides (ES = 0.86) and low-density lipoproteins (ES = 0.60).”
§ Diet, exercise or diet with exercise: comparing the effectiveness of treatment options for weight-loss and changes in fitness for adults (18–65 years old) who are overfat, or obese; systematic review and meta-analysis > Results > Comparison within treatment methods
“RT (ES of 0.85, 0.86, and 0.60 for TC, LDL, and TG respectively)”
Rated major: it would touch a result — a value a result rests on, reported and recomputed p-values on opposite sides of the significance level, two passages that conflict with no sign which is right, or a cited work retracted before this paper was published.
In the paper
§ Diet, exercise or diet with exercise: comparing the effectiveness of treatment options for weight-loss and changes in fitness for adults (18–65 years old) who are overfat, or obese; systematic review and meta-analysis > Results > Pooled effects
“there were no differences noted between any of the pooled ES for the assumed differences in energetic balance across the various treatment interventions.”
§ Diet, exercise or diet with exercise: comparing the effectiveness of treatment options for weight-loss and changes in fitness for adults (18–65 years old) who are overfat, or obese; systematic review and meta-analysis > Results > Pooled effects
“| Caloric difference | 0.48(−0.15, 1.11) | 0.49$ (−0.15, 1.13) | 1.16*$ (0.15, 2.18) | 0.19(−0.50, 0.79) | | 0.48(−0.15, 1.11) |”
Rated major: it would touch a result — a value a result rests on, reported and recomputed p-values on opposite sides of the significance level, two passages that conflict with no sign which is right, or a cited work retracted before this paper was published.
In the paper
§ Diet, exercise or diet with exercise: comparing the effectiveness of treatment options for weight-loss and changes in fitness for adults (18–65 years old) who are overfat, or obese; systematic review and meta-analysis > Results > Pooled effects
“ET alone appears to less effective to allow for the retention of FFM than dieting alone”
§ Diet, exercise or diet with exercise: comparing the effectiveness of treatment options for weight-loss and changes in fitness for adults (18–65 years old) who are overfat, or obese; systematic review and meta-analysis > Results > Pooled effects
“| Fat-free mass | 0.48(0.001, 0.95) | 0.02$ (−1.05, 1.08) | 0.80(0.61, 0.99) | 1.08*#¢ (0.61, 1.56) | 2.23*(−1.5, 5.95) | 0.20(−0.18, 0.57) |”
Rated minor: it would not touch a result — a value no result rests on, a p-value that stays on the same side of the significance level, or a conflict that is clerical, resolved elsewhere in the paper, or outside its own findings.
In the paper
§ Diet, exercise or diet with exercise: comparing the effectiveness of treatment options for weight-loss and changes in fitness for adults (18–65 years old) who are overfat, or obese; systematic review and meta-analysis > Results > Comparison between treatment effects
“diet with combination of RT was able to produce a much lager ES for these measures in comparison to those induced by diet with combination of ET, for each of these measures, see Figures 4, 5 and 6.”
§ Diet, exercise or diet with exercise: comparing the effectiveness of treatment options for weight-loss and changes in fitness for adults (18–65 years old) who are overfat, or obese; systematic review and meta-analysis > Results > Comparison between treatment effects
“As far as changes in TG, diet with combination of RT appears be the least effective for inducing changes relative to either the diet only or the diet with combination of ET, Figures 4, 5 and 6.”
Citations
Cites
Why Most Published Research Findings Are False
Ioannidis, J. P. A. (2005) · PLoS Medicine · doi:10.1371/journal.pmed.0020124 · Cited by 10,505
Leptin and the regulation of body weight in mammals
Friedman, J. M., & Halaas, J. L. (1998) · Nature · doi:10.1038/27376 · Cited by 5,405
Why Most Published Research Findings Are False
Ioannidis, J. P. A. (2005) · CHANCE · doi:10.1080/09332480.2005.10722754 · Cited by 4,702 · cited 2×
“Thus reflecting a more reliable overall effectiveness and provide a greater insight into the treatment phenomenon being offered [22,23].”
BackgroundMethodEuropean Guidelines for Obesity Management in Adults
Yumuk, V., Tsigos, C., Fried, M., Schindler, K., Busetto, L., Micic, D., & Toplak, H. (2015) · Obesity Facts · doi:10.1159/000442721 · Cited by 3,432
Muscles, exercise and obesity: skeletal muscle as a secretory organ
Pedersen, B. K., & Febbraio, M. A. (2012) · Nature Reviews Endocrinology · doi:10.1038/nrendo.2012.49 · Cited by 2,909
Lichtenstein, A. H., Appel, L. J., Brands, M., Carnethon, M., Daniels, S., Franch, H. A., Franklin, B., Kris-Etherton, P., Harris, W. S., Howard, B., et al. (2006) · Circulation · doi:10.1161/circulationaha.106.176158 · Cited by 2,705
Adipose tissue, adipokines, and inflammation
Fantuzzi, G. (2005) · Journal of Allergy and Clinical Immunology · doi:10.1016/j.jaci.2005.02.023 · Cited by 2,606
Morris, S. B., & DeShon, R. P. (2002) · Psychological Methods · doi:10.1037/1082-989x.7.1.105 · Cited by 2,502
Fuller, N. R., Colagiuri, S., SCHOFIELD, D. J., Olson, A. D., Shrestha, R. N., Holzapfel, C., Wolfenstetter, S. B., Holle, R., Ahern, A. L., Hauner, H., et al. (2012) · International Journal of Obesity · doi:10.1038/ijo.2012.139 · Cited by 2,127
Recent advances in the relationship between obesity, inflammation, and insulin resistance.
Bastard, J., Maachi, M., Lagathu, C., Kim, M. J., Caron, M., Vidal, H., Capeau, J., & Fève, B. (2006) · PubMed · Cited by 2,090
Research works printed but not linked: 1
- Clark JE. Role of resistance training in obesity treatments. 1st International Conference on Obesity, OMICS. Philadelphia, PA, 2012.
Cited by
Sorted by citations
Leggio, M., Lombardi, M., Caldarone, E., Severi, P., D’Emidio, S., Armeni, M., Bravi, V., Bendini, M. G., & Mazza, A. (2017) · Hypertension Research · doi:10.1038/hr.2017.75 · Cited by 319
Hansen, D., Niebauer, J., Cornelissen, V., Barna, O., Neunhäuserer, D., Stettler, C., Tonoli, C., Greco, E., Fagard, R., Coninx, K., et al. (2018) · Sports Medicine · doi:10.1007/s40279-018-0930-4 · Cited by 191
O'Donoghue, G., Blake, C., Cunningham, C., Lennon, O., & Perrotta, C. (2021) · Obesity Reviews · doi:10.1111/obr.13137 · Cited by 190
Effect of exercise training on sleep apnea: A systematic review and meta-analysis
Aiello, K. D., Caughey, W. G., Nelluri, B. K., Sharma, A. K., Mookadam, F., & Mookadam, M. (2016) · Respiratory Medicine · doi:10.1016/j.rmed.2016.05.015 · Cited by 133
Steele, J., Fisher, J. P., Skivington, M., Dunn, C., Arnold, J. T., Tew, G. A., Batterham, A. M., Nunan, D., O’Driscoll, J. M., Mann, S., et al. (2017) · BMC Public Health · doi:10.1186/s12889-017-4209-8 · Cited by 133
Metadata
- Authors
- Clark, J. E.
- Affiliations
- Manchester Community College - Connecticut (US)
- Corresponding author
- Clark, James E
- ORCID
- Clark, James E
- Venue
- Journal of Diabetes & Metabolic Disorders
- Published
- 2015-04-17
- Volume
- 14
- Issue
- 1
- Pages
- 31-31
- ISSN
- 2251-6581 (ISSN-L)
- PMC
- PMC4429709
- OpenAlex
- W2122502708
- Semantic Scholar
- 663e01c27b8be346d635fff0b3b883cb74acd233
- Cited by
- 158
- References
- 149
- Citations by year
- 2026: 6 · 2025: 15 · 2024: 11 · 2023: 13 · 2022: 19 · 2021: 22 · 2020: 14 · 2019: 14 · 2018: 12 · 2017: 15 · 2016: 13 · 2015: 4
- FWCI
- 2.13
- Type
- journal article
- Language
- en
- Update notices
- erratum (2015-09-28)
- Open access
- hybrid
- doi.org
- Locations
- Journal of Diabetes & Metabolic Disorders (publishedVersion, cc-by)
- Europe PMC (PubMed Central) (publishedVersion, cc-by)
- PubMed Central (publishedVersion, cc-by)
- PubMed (publishedVersion)
- Topics
- Health Sciences › Medicine › Public Health, Environmental and Occupational Health › Obesity, Physical Activity, Diet
- Health Sciences › Medicine › Public Health, Environmental and Occupational Health › Physical Activity and Health
- Health Sciences › Medicine › Physiology (medical) › Cardiovascular and exercise physiology
- Keywords
- weight loss, obesity, diet, physical activity, resistance training, endurance training, interval training, body composition, fat-free mass, fat mass, metabolic stress, fasting insulin, cholesterol, triglycerides, low-density lipoprotein, high-intensity exercise, metabolic health, adults, treatment effectiveness comparison, free weight exercises, metabolic biomarkers
About these checks
Registry, retraction, Cites and statistics results are computed, not judged, with one exception: a printed reference that no index lists is read once by a model before it counts as a citation error. Claims are extracted by a model and kept only when their quote appears verbatim in the text; each cited source is then checked, with a model’s help, for whether it says what the claim relies on. Those verdicts can be wrong — read the claim’s quote and the cited source before relying on one.
A language model drew the claims from the paper on 2026-10-10, under version 3 of the claim definition (model deepseek-v4.1-flash, prompt extract-v3).
A second model labelled each claim on 2026-10-10 (model jev-1.13-20260917, definition revision gold-guideline-v0.2).
Statistics and arithmetic are recomputed, not judged.
Confidence bands are shown only for fields calibrated on our annotated test set. None is calibrated yet, so no band is shown.
What counts as a claim ›How we measure confidence ›How we check this ›
Are you an author, or do you see a problem with this page? Request a review
