

The DOI matches its Crossref record; 88 of the 88 references it cites were found in a registry or an index; 74 of the 89 sources its claims cite were checked for support.
Effect of long-term caloric restriction on DNA methylation measures of biological aging in healthy adults from the CALERIE trial
Open accessAbstract
The geroscience hypothesis proposes that therapy to slow or reverse molecular changes that occur with aging can delay or prevent multiple chronic diseases and extend healthy lifespan 1–3 . Caloric restriction (CR), defined as lessening caloric intake without depriving essential nutrients 4 , results in changes in molecular processes that have been associated with aging, including DNA methylation (DNAm) 5–7 , and is established to increase healthy lifespan in multiple species 8,9 . Here we report the results of a post hoc analysis of the influence of CR on DNAm measures of aging in blood samples from the Comprehensive Assessment of Long-term Effects of Reducing Intake of Energy (CALERIE) trial, a randomized controlled trial in which n = 220 adults without obesity were randomized to 25% CR or ad libitum control diet for 2 yr (ref. 10 ). We found that CALERIE intervention slowed the pace of aging, as measured by the DunedinPACE DNAm algorithm, but did not lead to significant changes in biological age estimates measured by various DNAm clocks including PhenoAge and GrimAge. Treatment effect sizes were small. Nevertheless, modest slowing of the pace of aging can have profound effects on population health 11–13 . The finding that CR modified DunedinPACE in a randomized controlled trial supports the geroscience hypothesis, building on evidence from small and uncontrolled studies 14–16 and contrasting with reports that biological aging may not be modifiable 17 . Ultimately, a conclusive test of the geroscience hypothesis will require trials with long-term follow-up to establish effects of intervention on primary healthy-aging endpoints, including incidence of chronic disease and mortality 18–20 .
Overview
AI snapshot
Written from the paper’s full text.
TL;DR
In a post hoc analysis of the CALERIE Phase 2 randomized trial, 2 years of caloric restriction slowed the pace of aging measured by DunedinPACE but did not significantly change PhenoAge or GrimAge DNA methylation clocks. Treatment effect sizes were small, and long-term clinical benefit remains unknown.
Key findings
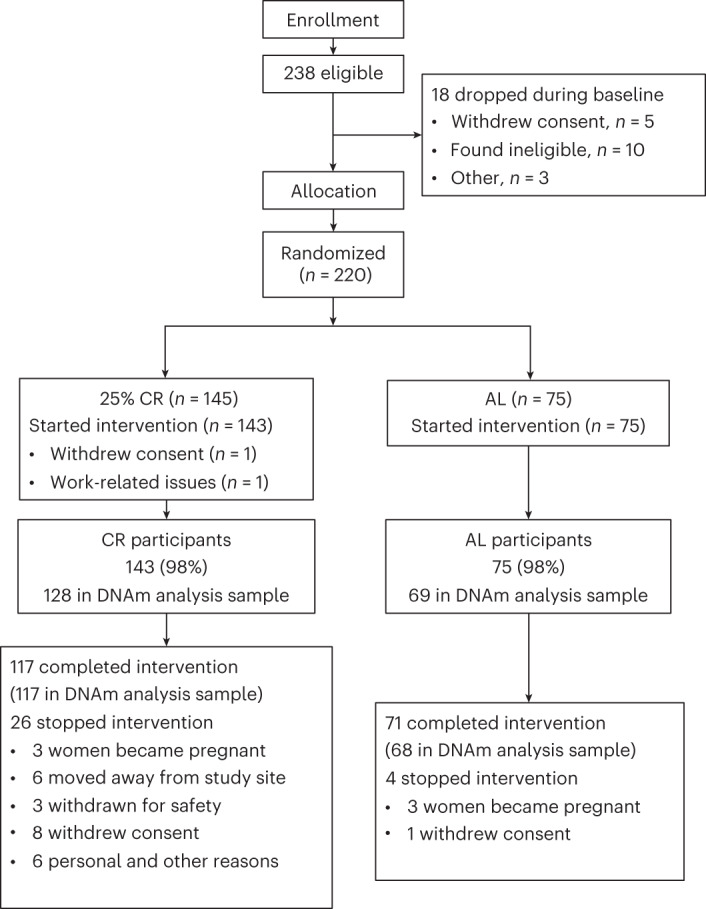
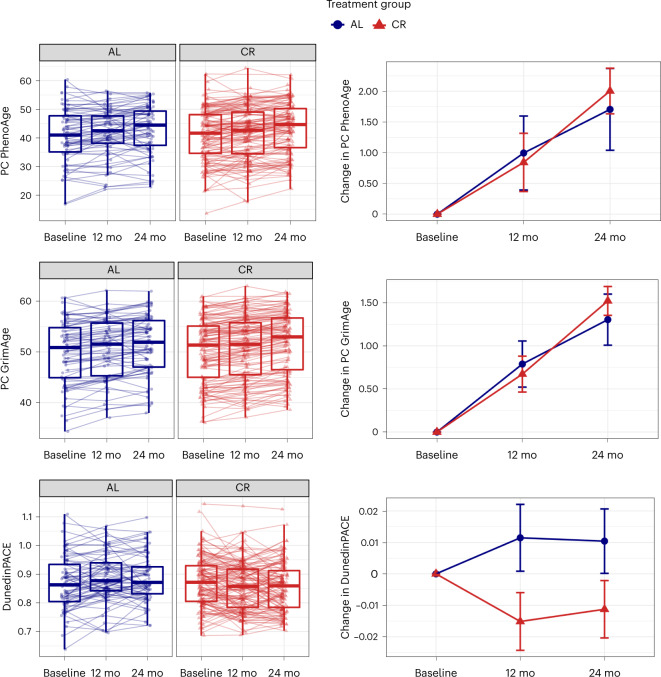
- Among n = 197 participants with DNA methylation data (128 CR, 69 AL), CR did not significantly alter PC PhenoAge or PC GrimAge: PhenoAge 12-month d = −0.03 (95% CI −0.19, 0.12), 24-month d = 0.05 (95% CI −0.11, 0.20), P > 0.50; GrimAge 12-month d = −0.04 (95% CI −0.16, 0.07), 24-month d = 0.05 (95% CI −0.07, 0.17), P > 0.40.
- CR significantly reduced DunedinPACE at 12 months (d = −0.29, 95% CI −0.45, −0.13) and 24 months (d = −0.25, 95% CI −0.41, −0.09), P < 0.003 for both, corresponding to a 2–3% slower pace of aging.
- Dose–response and treatment-on-the-treated analyses suggested larger DunedinPACE effects with higher CR: >10% CR group d = −0.33 at both 12 and 24 months versus <10% CR d = −0.19 and −0.14; instrumental-variable estimate for 20% CR was d = −0.43 (95% CI −0.67, −0.19) at 12 months and d = −0.40 (95% CI −0.67, −0.12) at 24 months.
- Mean achieved CR was 11.9% (s.e.m. = 0.7%), below the prescribed 25%; sex differences in treatment effects were not statistically different from zero.
Methods
- Post hoc analysis of CALERIE Phase 2, a multi-center randomized controlled trial at three US centers in healthy adults (men aged 21–50 years, premenopausal women aged 21–47 years) with BMI 22.0–27.9 kg m−2; participants were randomized 2:1 to 25% CR or ad libitum control for 2 years, stratified by site, sex, and BMI.
- Blood DNA methylation was assayed with Illumina Infinium Methylation EPIC arrays at baseline, 12 months, and 24 months; analysis included n = 197 participants with baseline and at least one follow-up DNAm measurement.
- Primary measures were PC PhenoAge, PC GrimAge, and DunedinPACE. Change scores were analyzed using intent-to-treat repeated-measures ANCOVA under mixed models and treatment-on-the-treated instrumental-variable regression for 20% CR; P < 0.005 was used as the significance threshold.
Limitations
- The paper states there is no gold standard measure of biological aging; the DNAm measures are incomplete summaries with technical limitations, and measurement error may bias effect estimates toward the null, making treatment effects a possible lower bound.
- The paper states that participants did not on average achieve the prescribed 25% CR, some controls reduced caloric intake, the CALERIE sample does not represent the general population, and follow-up did not extend beyond the intervention, so long-term clinical benefit is unknown.
- Evident from the text: this was a post hoc analysis, no statistical methods were used to predetermine sample sizes, treatment effect sizes were small, and DunedinPACE trajectories showed substantial overlap between CR and AL groups (effect-size estimates imply close to 90% overlap).
Model-written summary. Check it against the paper before relying on it.
Integrity signals
Registry
Cites
Statistics
Figures
Verification
Claims the paper makes
20 Partly supported · 17 Supported · 17 Own method · 14 Own result · 8 Own interpretation · 7 No full text of the sources · 4 Supported so far · 4 No basis given · accuracy not yet measured
Every source the paper cites for this claim was checked and supports it.
In the paper
“We tested sensitivity of results to changes in white blood cell populations in response to CALERIE intervention by including covariates in our models for DNAm estimates of cell counts28; these results were similar to unadjusted analyses (Supplementary Table 6).”
§ Effect of long-term caloric restriction on DNA methylation measures of biological aging in healthy adults from the CALERIE trial > Main
What the sources say
- Supportedcites [28] Salas, L. A. et al. An optimized library for reference-based deconvolution of whole-blood biospecimens assayed using the Illumina HumanMethylationEPIC BeadArray. Genome Biol. 19, 64 (2018). source
The citation is attached to the DNAm estimates of cell counts, not to the citing authors’ finding that adjusted and unadjusted CALERIE results were similar. The source’s Discussion describes a DNA methylation reference library for estimating adult blood-cell subtypes and using those estimates to control for cell-population confounding. The similarity of the CALERIE results is attributed to the citing authors’ Supplementary Table 6. (LLM, conf=0.90)
plain- Asserted: passes — The authors put it forward as true.
- Checkable: passes — It can be checked against evidence.
- Load-bearing: unclear — It is unclear whether the paper’s conclusions depend on it.
- Based: passes — The paper gives a reason why it holds.
- Supported
Every source the paper cites for this claim was checked and supports it.
In the paper
“Caloric restriction (CR), defined as lessening caloric intake without depriving essential nutrients4, results in changes in molecular processes that have been associated with aging, including DNA methylation (DNAm)5–7, and is established to increase healthy lifespan in multiple species8,9.”
§ Effect of long-term caloric restriction on DNA methylation measures of biological aging in healthy adults from the CALERIE trial > Abstract
What the sources say
- Supportedcites [5] Maegawa, S. et al. Caloric restriction delays age-related methylation drift. Nat. Commun. 8, 539 (2017). source
The Results section reports that caloric restriction alleviated age-related DNA methylation drift, a molecular change associated with aging. This supports the attributed claim about DNA methylation. (LLM, conf=0.93)
- Supportedcites [6] Hahn, O. et al. Dietary restriction protects from age-associated DNA methylation and induces epigenetic reprogramming of lipid metabolism. Genome Biol. 18, 56 (2017). source
The Background identifies DNA methylation as a process affected by both aging and dietary interventions. The Discussion reports that dietary restriction reduced the erosion of methylation patterns over time, supporting the attributed claim. (LLM, conf=0.92)
- Supportedcites [7] Petkovich, D. A. et al. Using DNA methylation profiling to evaluate biological age and longevity interventions. Cell Metab. 25, 954–960.e6 (2017). source
The Results and Discussion report that calorie-restricted mice had significantly lower age estimates based on DNA methylation, showing that caloric restriction affected an aging-associated methylation pattern. The Introduction also states that DNA methylation systematically varies with age. (LLM, conf=0.91)
plaindirect- Asserted: passes — The authors put it forward as true.
- Checkable: passes — It can be checked against evidence.
- Load-bearing: passes — The paper’s conclusions depend on it.
- Based: passes — The paper gives a reason why it holds.
- Supported
The cited sources support only part of this claim — read each source’s verdict below.
In the paper
“The PhenoAge and GrimAge clocks were developed to predict mortality risk at a single timepoint in mixed-age and older adults.”
§ Effect of long-term caloric restriction on DNA methylation measures of biological aging in healthy adults from the CALERIE trial > Main
What the sources say
- Not checked — no full text of the sourcecites [19] Prentice, R. L. Surrogate endpoints in clinical trials: definition and operational criteria. Stat. Med. 8, 431–440 (1989). source
- Could not verifycites [47] Sierra, F. et al. Moving geroscience from the bench to clinical care and health policy. J. Am. Geriatr. Soc. 69, 2455–2463 (2021). sourceExperimental — accuracy not yet measured
The section on behavioral and social science perspectives discusses measuring the pace of biological aging, and the References name the DunedinPoAm DNA-methylation algorithm. Searches for PhenoAge, GrimAge, and mortality-predicting epigenetic clocks found no passage in our copy addressing how those two clocks were developed or the populations used. (LLM, conf=0.75)
- Could not verifycites [48] Justice, J. et al. Frameworks for proof-of-concept clinical trials of interventions that target fundamental aging processes. J. Gerontol. A Biol. Sci. Med. Sci. 71, 1415–1423 (2016). sourceExperimental — accuracy not yet measured
The Approach section discusses biomarkers and outcomes for proof-of-concept trials targeting aging processes, but does not address the development or purpose of PhenoAge or GrimAge. Searches for both clock names and for mortality-risk prediction at a single timepoint found no supporting passage in our copy. (LLM, conf=0.76)
- Partly supportedcites [49] Justice, J. N. & Kritchevsky, S. B. Putting epigenetic biomarkers to the test for clinical trials. eLife 9, e58592 (2020). sourceExperimental — accuracy not yet measured
The Figure 1 caption (section labeled Abstract; no page given) calls GrimAge a mortality estimator and PhenoAge a health and lifespan biomarker. The discussion contrasts earlier biomarkers calibrated to endpoints such as death with DunedinPoAm’s measure of change over time. It does not specify that both clocks were developed to predict mortality risk at a single timepoint in mixed-age and older adults. (LLM, conf=0.85)
plain- Asserted: passes — The authors put it forward as true.
- Checkable: passes — It can be checked against evidence.
- Load-bearing: passes — The paper’s conclusions depend on it.
- Based: passes — The paper gives a reason why it holds.
Every source the paper cites for this claim was checked and supports it.
In the paper
“In contrast, DunedinPACE was developed to predict multi-system physiological decline over two decades of follow-up from early adulthood to midlife.”
§ Effect of long-term caloric restriction on DNA methylation measures of biological aging in healthy adults from the CALERIE trial > Main
What the sources say
- Supportedcites [24] Belsky, D. W. et al. DunedinPACE, a DNA methylation biomarker of the pace of aging. eLife 11, e73420 (2022). source
The Methods (no page listed) say DunedinPACE was derived from 19 indicators of organ-system decline measured at four time points across two decades. The Results (no page listed) state that its DNA-methylation algorithm was developed to predict the resulting 20-year Pace of Aging; the Introduction describes follow-up from ages 26 to 45. (LLM, conf=0.94)
plain- Asserted: passes — The authors put it forward as true.
- Checkable: passes — It can be checked against evidence.
- Load-bearing: passes — The paper’s conclusions depend on it.
- Based: passes — The paper gives a reason why it holds.
- Supported
The cited sources support only part of this claim — read each source’s verdict below.
In the paper
“In observational studies with long-term follow-up, individuals with slower DunedinPACE are better-off on a range of healthspan metrics, including showing reduced incidence of morbidity and increased survival24,29.”
§ Effect of long-term caloric restriction on DNA methylation measures of biological aging in healthy adults from the CALERIE trial > Main
What the sources say
- Supportedcites [24] Belsky, D. W. et al. DunedinPACE, a DNA methylation biomarker of the pace of aging. eLife 11, e73420 (2022). source
The Results section (‘Faster DunedinPACE is associated with morbidity, disability, and mortality’; page not supplied) reports longitudinal analyses in two cohorts. Faster DunedinPACE was associated with greater risk of incident disease, disability, and death, supporting the claim that individuals with slower DunedinPACE had better healthspan outcomes and survival. (LLM, conf=0.93)
- Partly supportedcites [29] Sugden, K. et al. Association of pace of aging measured by blood-based DNA methylation with age-related cognitive impairment and dementia. Neurology 99, e1402–e1413 (2022). sourceExperimental — accuracy not yet measured
The Results section on the FHS Offspring Cohort reports that faster DunedinPACE predicted greater dementia incidence over up to 14 years of follow-up, supporting one morbidity-related outcome. The cited paper also reports poorer cognitive outcomes with faster DunedinPACE, but our copy does not report increased survival or reduced incidence of morbidity across a range of conditions. (LLM, conf=0.86)
plaincorrelational- Asserted: passes — The authors put it forward as true.
- Checkable: passes — It can be checked against evidence.
- Load-bearing: passes — The paper’s conclusions depend on it.
- Based: passes — The paper gives a reason why it holds.
- Supported
Every source the paper cites for this claim was checked and supports it.
In the paper
“We analyzed versions of the PhenoAge and GrimAge clocks constructed from DNAm principal components (PCs) (hereafter ‘PC clocks’), which have superior technical reliability as compared with the original versions of these measures25; DunedinPACE was originally designed to have high technical reliability.”
§ Effect of long-term caloric restriction on DNA methylation measures of biological aging in healthy adults from the CALERIE trial > Main
What the sources say
- Supportedcites [25] Higgins-Chen, A. T. et al. A computational solution for bolstering reliability of epigenetic clocks: implications for clinical trials and longitudinal tracking. Nat. Aging 2, 644–661 (2022). source
The Results section (‘Reliable epigenetic clocks trained from principal components’) reports improved agreement between technical replicates for PC clocks compared with the original CpG clocks, including a marked improvement for PhenoAge. The Discussion explicitly says the method can increase reliability even for GrimAge, which already has high reliability. (LLM, conf=0.94)
plain- Asserted: passes — The authors put it forward as true.
- Checkable: passes — It can be checked against evidence.
- Load-bearing: passes — The paper’s conclusions depend on it.
- Based: passes — The paper gives a reason why it holds.
- Supported
The cited sources support only part of this claim — read each source’s verdict below.
In the paper
“In the CALERIE Trial, the %CR achieved by participants in the treatment group varied, with most participants achieving doses below the prescribed 25% (mean = 11.9, s.e.m. = 0.7%)10.”
§ Effect of long-term caloric restriction on DNA methylation measures of biological aging in healthy adults from the CALERIE trial > Main
What the sources say
- Partly supportedcites [10] Ravussin, E. et al. A 2-year randomized controlled trial of human caloric restriction: feasibility and effects on predictors of health span and longevity. J. Gerontol. A 70, 1097–1104 (2015). sourceExperimental — accuracy not yet measured
The Intervention and Adherence Measurements section specifies a 25% CR target, and Adherence and Weight Loss reports that the CR group averaged 11.7 ± 0.7% over two years—below that target. The cited paper does not give the claimed mean of 11.9%, and the cited passages do not establish how many individual participants fell below 25%. (LLM, conf=0.88)
plain- Asserted: passes — The authors put it forward as true.
- Checkable: passes — It can be checked against evidence.
- Load-bearing: passes — The paper’s conclusions depend on it.
- Based: passes — The paper gives a reason why it holds.
- Partly supported
The cited sources support only part of this claim — read each source’s verdict below.
In the paper
“The finding that CR modified DunedinPACE in a randomized controlled trial supports the geroscience hypothesis, building on evidence from small and uncontrolled studies14–16 and contrasting with reports that biological aging may not be modifiable17.”
§ Effect of long-term caloric restriction on DNA methylation measures of biological aging in healthy adults from the CALERIE trial > Abstract
What the sources say
- Supportedcites [14] Fahy, G. M. et al. Reversal of epigenetic aging and immunosenescent trends in humans. Aging Cell 18, e13028 (2019). source
The citation is attached to “evidence from small and uncontrolled studies,” not to the randomized trial’s DunedinPACE finding. The paper’s Volunteer recruitment and screening section (page unavailable) describes ten recruited men, and its Results section reports treatment-associated declines in epigenetic age. It therefore fits the cited role of an earlier small, uncontrolled study. (LLM, conf=0.90)
- Partly supportedcites [15] Chen, L. et al. Effects of vitamin D3 supplementation on epigenetic aging in overweight and obese African Americans with suboptimal vitamin D status: a randomized clinical trial. J. Gerontol. A 74, 91–98 (2019). sourceExperimental — accuracy not yet measured
The Discussion (page not available) reports that a randomized trial detected changes in DNA-methylation aging after vitamin D3 supplementation, supporting the broader idea that an intervention can modify a biological-aging measure. It does not report caloric restriction (CR) modifying DunedinPACE; the trial used vitamin D3 and measured epigenetic aging. (LLM, conf=0.85)
- Supportedcites [16] Sae-Lee, C. et al. Dietary intervention modifies DNA methylation age assessed by the epigenetic clock. Mol. Nutr. Food Res. 62, 1800092 (2018). source
This citation supports the sentence’s reference to earlier small, uncontrolled evidence, not its claim about the citing authors’ DunedinPACE trial. The source reports an analysis of before-and-after samples from dietary interventions with 44 and 13 participants (Study design; limitations discussion, page unavailable). Although one underlying intervention randomized participants, the source describes its epigenetic-age analysis as a before-and-after comparison, not a comparison with controls. (LLM, conf=0.88)
- Supportedcites [17] Colchero, F. et al. The long lives of primates and the ‘invariant rate of ageing’ hypothesis. Nat. Commun. 12, 3666 (2021). source
Citation 17 is attached to the reports that biological aging may not be modifiable, not to the randomized-trial finding. The Abstract says the results support biological constraints on how much the human rate of ageing can be slowed, and the Discussion says environmental improvements are unlikely to substantially reduce it. (LLM, conf=0.90)
plaindirectn = 220- Asserted: passes — The authors put it forward as true.
- Checkable: passes — It can be checked against evidence.
- Load-bearing: passes — The paper’s conclusions depend on it.
- Based: passes — The paper gives a reason why it holds.
- Supported
The cited sources support only part of this claim — read each source’s verdict below.
In the paper
“Studies in subsets of CALERIE participants suggest effects of CR on molecular mechanisms of immune and metabolic regulation34,35.”
§ Effect of long-term caloric restriction on DNA methylation measures of biological aging in healthy adults from the CALERIE trial > Main
What the sources say
- Supportedcites [34] Spadaro, O. et al. Caloric restriction in humans reveals immunometabolic regulators of health span. Science 375, 671–677 (2022). source
The supplied passages from the Abstract report findings in a subset of healthy CALERIE participants and describe CR-related changes in thymic function and adipose-tissue gene expression. They identify immune and metabolic pathways affected by CR, supporting the citing sentence’s qualified summary. No page number is supplied. (LLM, conf=0.93)
- Partly supportedcites [35] Redman, L. M. et al. Metabolic slowing and reduced oxidative damage with sustained caloric restriction support the rate of living and oxidative damage theories of aging. Cell Metab. 27, 805–815.e4 (2018). sourceExperimental — accuracy not yet measured
The STAR Methods identify this as an ancillary study of a subset of CALERIE participants. The Results and Discussion report effects of caloric restriction on hormonal mediators of energy metabolism, including leptin and thyroid hormones. Our copy does not report effects on mechanisms of immune regulation. (LLM, conf=0.84)
hedgedconditional- Asserted: passes — The authors put it forward as true.
- Checkable: passes — It can be checked against evidence.
- Load-bearing: unclear — It is unclear whether the paper’s conclusions depend on it.
- Based: passes — The paper gives a reason why it holds.
- Supported
The cited sources support only part of this claim — read each source’s verdict below.
In the paper
“A barrier to advancing translation of these therapies through human trials is that intervention studies run for months or years, but human aging takes decades to cause disease46–48.”
§ Effect of long-term caloric restriction on DNA methylation measures of biological aging in healthy adults from the CALERIE trial > Main
What the sources say
- Partly supportedcites [46] Moffitt, T. E., Belsky, D. W., Danese, A., Poulton, R. & Caspi, A. The longitudinal study of aging in human young adults: knowledge gaps and research agenda. J. Gerontol. A 72, 210–215 (2017). sourceExperimental — accuracy not yet measured
The section “Why Is it Important to Measure the Pace of Aging in Humans as well as in Animals?” says that age-related diseases arise in later decades and that trials using disease or mortality outcomes would require decades of follow-up. This supports the claimed barrier to translation, but our copy does not establish that intervention studies run for months or years. (LLM, conf=0.86)
- Partly supportedcites [47] Sierra, F. et al. Moving geroscience from the bench to clinical care and health policy. J. Am. Geriatr. Soc. 69, 2455–2463 (2021). sourceExperimental — accuracy not yet measured
The section on behavioral and social science perspectives in geroscience says disease diagnosis or death may be too distant to serve as trial endpoints and that waiting many years to judge a therapy is unreasonable. This supports the claimed barrier, but our copy does not specify that intervention studies run for months or years or that aging takes decades to cause disease. (LLM, conf=0.82)
- Partly supportedcites [48] Justice, J. et al. Frameworks for proof-of-concept clinical trials of interventions that target fundamental aging processes. J. Gerontol. A Biol. Sci. Med. Sci. 71, 1415–1423 (2016). sourceExperimental — accuracy not yet measured
In the Approach section (page not available), the paper describes proof-of-concept trials lasting weeks to a month, with follow-up lasting months to a year, and says age-related diseases often progress slowly over years. This supports the mismatch in timescales, but the paper does not state that human aging takes decades to cause disease. (LLM, conf=0.84)
plaindirect- Asserted: passes — The authors put it forward as true.
- Checkable: passes — It can be checked against evidence.
- Load-bearing: passes — The paper’s conclusions depend on it.
- Based: passes — The paper gives a reason why it holds.
- Partly supported
The cited sources support only part of this claim — read each source’s verdict below.
In the paper
“The methods proposed to quantify biological aging analyzed in this study are predictive of aging-related health decline and mortality.”
§ Effect of long-term caloric restriction on DNA methylation measures of biological aging in healthy adults from the CALERIE trial > Main
What the sources say
- Supportedcites [24] Belsky, D. W. et al. DunedinPACE, a DNA methylation biomarker of the pace of aging. eLife 11, e73420 (2022). source
The Results section, “Faster DunedinPACE is associated with morbidity, disability, and mortality” (page not provided), reports that faster DunedinPACE predicted incident chronic disease and mortality in the Normative Aging Study. It also reports increased risks of cardiovascular disease, stroke or TIA, disability, and mortality in the Framingham cohort. (LLM, conf=0.90)
- Partly supportedcites [29] Sugden, K. et al. Association of pace of aging measured by blood-based DNA methylation with age-related cognitive impairment and dementia. Neurology 99, e1402–e1413 (2022). sourceExperimental — accuracy not yet measured
The Discussion (page unavailable) says second-generation clocks were trained to predict mortality and reports that several measures predicted later dementia, an age-related health outcome. It does not establish that all the methods analyzed predict both broader aging-related health decline and mortality; the study tested cognitive outcomes, not mortality. (LLM, conf=0.86)
- Partly supportedcites [30] Hillary, R. F. et al. Epigenetic measures of ageing predict the prevalence and incidence of leading causes of death and disease burden. Clin. Epigenetics 12, 115 (2020). sourceExperimental — accuracy not yet measured
The Conclusions report that epigenetic measures of ageing can predict the incidence of common diseases. However, the Results section 'Associations with all-cause mortality' finds that DNAm GrimAge alone was associated with mortality after adjustment, so the claim overgeneralizes the mortality finding to the methods analyzed as a group. (LLM, conf=0.85)
plaincorrelational- Asserted: passes — The authors put it forward as true.
- Checkable: passes — It can be checked against evidence.
- Load-bearing: passes — The paper’s conclusions depend on it.
- Based: passes — The paper gives a reason why it holds.
- Supported
The cited sources support only part of this claim — read each source’s verdict below.
In the paper
“However, until this study, none had been tested in a randomized controlled trial of a geroscience-based intervention49.”
§ Effect of long-term caloric restriction on DNA methylation measures of biological aging in healthy adults from the CALERIE trial > Main
What the sources say
- Partly supportedcites [49] Justice, J. N. & Kritchevsky, S. B. Putting epigenetic biomarkers to the test for clinical trials. eLife 9, e58592 (2020). sourceExperimental — accuracy not yet measured
The paper’s Abstract describes testing DunedinPoAm in a cohort from the CALERIE caloric-restriction trial. It does not establish that no biological-aging method had previously been tested in a randomized trial; it also discusses earlier small intervention studies, and its References list a 2019 randomized trial examining epigenetic aging. The copy does not establish whether that earlier trial qualifies as a geroscience-based intervention. (LLM, conf=0.82)
plain- Asserted: passes — The authors put it forward as true.
- Checkable: passes — It can be checked against evidence.
- Load-bearing: passes — The paper’s conclusions depend on it.
- Based: passes — The paper gives a reason why it holds.
- Partly supported
The cited sources support only part of this claim — read each source’s verdict below.
In the paper
“In some cases, these effects are larger than the effects we observed for DunedinPACE (for example, d = 0.2–0.3 for DunedinPACE as compared with d = 0.2–0.4 for blood chemistry measures of biological age32).”
§ Effect of long-term caloric restriction on DNA methylation measures of biological aging in healthy adults from the CALERIE trial > Main
What the sources say
- Partly supportedcites [32] Kwon, D. & Belsky, D. W. A toolkit for quantification of biological age from blood chemistry and organ function test data: BioAge. Geroscience 43, 2795–2808 (2021). sourceExperimental — accuracy not yet measured
The CALERIE Analysis and Figure Legends report slower or reversed biological aging under caloric restriction on KDM Biological Age and PhenoAge measures. They do not report the attributed d = 0.2–0.4 range for those measures; searches for standardized effect sizes and 0.4 did not establish it. The DunedinPACE comparison is framed as the citing authors’ own result, not a finding attributed to this source. (LLM, conf=0.85)
plaindirect- Asserted: passes — The authors put it forward as true.
- Checkable: passes — It can be checked against evidence.
- Load-bearing: unclear — It is unclear whether the paper’s conclusions depend on it.
- Based: passes — The paper gives a reason why it holds.
- Partly supported
Every source the paper cites for this claim was checked and supports it.
In the paper
“A limitation of several DNAm clocks is that when residualized for chronological age, values show only moderate test–retest reliability across technical replicates.”
§ Effect of long-term caloric restriction on DNA methylation measures of biological aging in healthy adults from the CALERIE trial > Methods > DNAm clocks and pace-of-aging measures
What the sources say
- Supportedcites [25] Higgins-Chen, A. T. et al. A computational solution for bolstering reliability of epigenetic clocks: implications for clinical trials and longitudinal tracking. Nat. Aging 2, 644–661 (2022). source
The Results section ('Technical noise reduces epigenetic clock reliability'; page unavailable) says that age-acceleration residuals—clock values adjusted for chronological age—have lower ICCs than epigenetic age. It also reports substantial discrepancies between technical replicates for six clocks, supporting the characterization of their test–retest reliability as only moderate. (LLM, conf=0.89)
plain- Asserted: passes — The authors put it forward as true.
- Checkable: passes — It can be checked against evidence.
- Load-bearing: passes — The paper’s conclusions depend on it.
- Based: passes — The paper gives a reason why it holds.
- Supported
Every source the paper cites for this claim was checked and supports it.
In the paper
“The resulting ‘PC clocks’ demonstrate exceptional test–retest reliability across technical replicates.”
§ Effect of long-term caloric restriction on DNA methylation measures of biological aging in healthy adults from the CALERIE trial > Methods > DNAm clocks and pace-of-aging measures
What the sources say
- Supportedcites [25] Higgins-Chen, A. T. et al. A computational solution for bolstering reliability of epigenetic clocks: implications for clinical trials and longitudinal tracking. Nat. Aging 2, 644–661 (2022). source
In Results (“Reliable epigenetic clocks trained from principal components”), the paper says PC-based clocks show greatly improved agreement between technical replicates. It reports ICCs above 0.99 for epigenetic age and above 0.97 for age acceleration across all PC clocks. (LLM, conf=0.95)
boosted- Asserted: passes — The authors put it forward as true.
- Checkable: passes — It can be checked against evidence.
- Load-bearing: passes — The paper’s conclusions depend on it.
- Based: passes — The paper gives a reason why it holds.
- Supported
A result the paper reports from its own data — it cites no other source for it, so there is none to check. The quote shows it is in the paper.
In the paper
“Standardized treatment effects on DunedinPACE correspond to a reduction in the pace of aging of 2–3%.”
§ Effect of long-term caloric restriction on DNA methylation measures of biological aging in healthy adults from the CALERIE trial > Main
plaindirect- Asserted: passes — The authors put it forward as true.
- Checkable: passes — It can be checked against evidence.
- Load-bearing: passes — The paper’s conclusions depend on it.
- Based: passes — The paper gives a reason why it holds.
A result the paper reports from its own data — it cites no other source for it, so there is none to check. The quote shows it is in the paper.
In the paper
“Changes in DunedinPACE in response to CR intervention mediated only small fractions of CR-induced changes in clinical measures (Supplementary Fig. 4).”
§ Effect of long-term caloric restriction on DNA methylation measures of biological aging in healthy adults from the CALERIE trial > Main
plaindirect- Asserted: passes — The authors put it forward as true.
- Checkable: passes — It can be checked against evidence.
- Load-bearing: unclear — It is unclear whether the paper’s conclusions depend on it.
- Based: passes — The paper gives a reason why it holds.
A result the paper reports from its own data — it cites no other source for it, so there is none to check. The quote shows it is in the paper.
In the paper
“Sex differences in treatment effects were not statistically different from zero in any of the models.”
§ Effect of long-term caloric restriction on DNA methylation measures of biological aging in healthy adults from the CALERIE trial > Main
plain- Asserted: passes — The authors put it forward as true.
- Checkable: passes — It can be checked against evidence.
- Load-bearing: unclear — It is unclear whether the paper’s conclusions depend on it.
- Based: passes — The paper gives a reason why it holds.
A result the paper reports from its own data — it cites no other source for it, so there is none to check. The quote shows it is in the paper.
In the paper
“We found that CALERIE intervention slowed the pace of aging, as measured by the DunedinPACE DNAm algorithm, but did not lead to significant changes in biological age estimates measured by various DNAm clocks including PhenoAge and GrimAge.”
- Also stated in: § Main · plain
“However, change in PhenoAge and GrimAge values did not differ between CR and AL groups (for PhenoAge, 12-month d = −0.03 (95% confidence interval (95% CI) −0.19, 0.12), 24-month d = 0.05 (95% CI −0.11, 0.20), P > 0.50 for both; for GrimAge, 12-month d = −0.04 (95% CI −0.16, 0.07), 24-month d = 0.05 (95% CI −0.07, 0.17), P > 0.40 for both).”
- Also stated in: § Main · plain
“CALERIE intervention slowed pace of aging as measured by DunedinPACE, whereas the CR intervention did not affect the PhenoAge and GrimAge DNAm clocks.”
§ Effect of long-term caloric restriction on DNA methylation measures of biological aging in healthy adults from the CALERIE trial > Abstract
plainn = 220- Asserted: passes — The authors put it forward as true.
- Checkable: passes — It can be checked against evidence.
- Load-bearing: passes — The paper’s conclusions depend on it.
- Based: passes — The paper gives a reason why it holds.
- Also stated in: § Main · plain
A result the paper reports from its own data — it cites no other source for it, so there is none to check. The quote shows it is in the paper.
In the paper
“There was no evidence of a dose–response effect for PhenoAge or GrimAge.”
§ Effect of long-term caloric restriction on DNA methylation measures of biological aging in healthy adults from the CALERIE trial > Main
plain- Asserted: passes — The authors put it forward as true.
- Checkable: passes — It can be checked against evidence.
- Load-bearing: passes — The paper’s conclusions depend on it.
- Based: passes — The paper gives a reason why it holds.
A result the paper reports from its own data — it cites no other source for it, so there is none to check. The quote shows it is in the paper.
In the paper
“We found that CALERIE intervention slowed the pace of aging, as measured by the DunedinPACE DNAm algorithm, but did not lead to significant changes in biological age estimates measured by various DNAm clocks including PhenoAge and GrimAge.”
- Also stated in: § Main · plain
“CR treatment reduced participants’ DunedinPACE by the 12-month follow-up and this reduction was maintained through follow-up at 24 months (12-month d = −0.29 (95% CI −0.45, −0.13), 24-month d = −0.25 (95% CI −0.41, −0.09), P < 0.003 for both).”
- Also stated in: § Main · plain
“CALERIE intervention slowed pace of aging as measured by DunedinPACE, whereas the CR intervention did not affect the PhenoAge and GrimAge DNAm clocks.”
§ Effect of long-term caloric restriction on DNA methylation measures of biological aging in healthy adults from the CALERIE trial > Abstract
plaindirectn = 220- Asserted: passes — The authors put it forward as true.
- Checkable: passes — It can be checked against evidence.
- Load-bearing: passes — The paper’s conclusions depend on it.
- Based: passes — The paper gives a reason why it holds.
- Also stated in: § Main · plain
A result the paper reports from its own data — it cites no other source for it, so there is none to check. The quote shows it is in the paper.
In the paper
“Our dose–response and TOT analyses indicated that participants who achieved higher doses of CR experienced more pronounced reductions in DunedinPACE.”
§ Effect of long-term caloric restriction on DNA methylation measures of biological aging in healthy adults from the CALERIE trial > Main
hedgedcorrelational- Asserted: passes — The authors put it forward as true.
- Checkable: passes — It can be checked against evidence.
- Load-bearing: passes — The paper’s conclusions depend on it.
- Based: passes — The paper gives a reason why it holds.
- The authors state this as an assumption: The CALERIE intervention affected participants’ biological aging only through its effect on their caloric intake.
A result the paper reports from its own data — it cites no other source for it, so there is none to check. The quote shows it is in the paper.
In the paper
“IV effect-size estimates for PhenoAge and GrimAge were small (d = −0.13–0.01; P > 0.15).”
§ Effect of long-term caloric restriction on DNA methylation measures of biological aging in healthy adults from the CALERIE trial > Main
plain- Asserted: passes — The authors put it forward as true.
- Checkable: passes — It can be checked against evidence.
- Load-bearing: passes — The paper’s conclusions depend on it.
- Based: passes — The paper gives a reason why it holds.
The paper states this without a source or data behind it here, so there is nothing to check it against. The quote shows it is in the paper.
In the paper
“Treatment effect sizes were small.”
§ Effect of long-term caloric restriction on DNA methylation measures of biological aging in healthy adults from the CALERIE trial > Abstract
plainn = 220- Asserted: passes — The authors put it forward as true.
- Checkable: passes — It can be checked against evidence.
- Load-bearing: unclear — It is unclear whether the paper’s conclusions depend on it.
- Based: passes — The paper gives a reason why it holds.
A result the paper reports from its own data — it cites no other source for it, so there is none to check. The quote shows it is in the paper.
In the paper
“This analysis identified sex, baseline BMI and their interaction as statistically significant predictors of CR dose at the alpha = 0.05 level.”
§ Effect of long-term caloric restriction on DNA methylation measures of biological aging in healthy adults from the CALERIE trial > Methods > Specification of TOT regression models
plaincorrelational- Asserted: passes — The authors put it forward as true.
- Checkable: passes — It can be checked against evidence.
- Load-bearing: unclear — It is unclear whether the paper’s conclusions depend on it.
- Based: passes — The paper gives a reason why it holds.
A conclusion the paper draws from its own results — it cites no other source for it, so there is none to check. The quote shows it is in the paper.
In the paper
“DunedinPACE may therefore be more sensitive than PhenoAge and GrimAge to changes induced by 2 yr of CALERIE intervention.”
§ Effect of long-term caloric restriction on DNA methylation measures of biological aging in healthy adults from the CALERIE trial > Main
hedgedconditional- Asserted: passes — The authors put it forward as true.
- Checkable: passes — It can be checked against evidence.
- Load-bearing: passes — The paper’s conclusions depend on it.
- Based: passes — The paper gives a reason why it holds.
A conclusion the paper draws from its own results — it cites no other source for it, so there is none to check. The quote shows it is in the paper.
In the paper
“Our general measures of biological aging thus provide a reasonable test of cross-system impacts.”
§ Effect of long-term caloric restriction on DNA methylation measures of biological aging in healthy adults from the CALERIE trial > Main
plain- Asserted: passes — The authors put it forward as true.
- Checkable: unclear — It is unclear whether it could be checked against evidence.
- Load-bearing: passes — The paper’s conclusions depend on it.
- Based: passes — The paper gives a reason why it holds.
What the paper did — it cites no source for this, so there is none to check. The quote shows it is in the paper.
In the paper
“Participants had a mean age of 38 yr (s.d. = 7), 70% were women and 77% were white; there were no differences in age, sex or race/ethnicity between AL and CR at baseline (Table 1).”
- Also stated in: § Statistics and reproducibility · plain
“there were no differences in age, sex or race/ethnicity between AL and CR at baseline (Table 1).”
§ Effect of long-term caloric restriction on DNA methylation measures of biological aging in healthy adults from the CALERIE trial > Main
plainn = 197- Asserted: passes — The authors put it forward as true.
- Checkable: passes — It can be checked against evidence.
- Load-bearing: unclear — It is unclear whether the paper’s conclusions depend on it.
- Based: passes — The paper gives a reason why it holds.
- Also stated in: § Statistics and reproducibility · plain
What the paper did — it cites no source for this, so there is none to check. The quote shows it is in the paper.
In the paper
“Treatment effects on aspects of biological aging not captured by the DNAm measures are not included in effect estimates; measurement error due to technical limitations of DNAm assays may bias effect estimates towards the null.”
§ Effect of long-term caloric restriction on DNA methylation measures of biological aging in healthy adults from the CALERIE trial > Main
hedgedconditional- Asserted: passes — The authors put it forward as true.
- Checkable: passes — It can be checked against evidence.
- Load-bearing: unclear — It is unclear whether the paper’s conclusions depend on it.
- Based: passes — The paper gives a reason why it holds.
A conclusion the paper draws from its own results — it cites no other source for it, so there is none to check. The quote shows it is in the paper.
In the paper
“DunedinPACE findings broaden evidence of molecular changes in response to CR to a DNAm biomarker of aging established to predict morbidity and mortality.”
§ Effect of long-term caloric restriction on DNA methylation measures of biological aging in healthy adults from the CALERIE trial > Main
boosteddirect- Asserted: passes — The authors put it forward as true.
- Checkable: passes — It can be checked against evidence.
- Load-bearing: passes — The paper’s conclusions depend on it.
- Based: passes — The paper gives a reason why it holds.
A conclusion the paper draws from its own results — it cites no other source for it, so there is none to check. The quote shows it is in the paper.
In the paper
“Treatment effect estimates may therefore represent a lower-bound of the true impact of CALERIE intervention on biological aging.”
§ Effect of long-term caloric restriction on DNA methylation measures of biological aging in healthy adults from the CALERIE trial > Main
hedgedconditional- Asserted: passes — The authors put it forward as true.
- Checkable: passes — It can be checked against evidence.
- Load-bearing: passes — The paper’s conclusions depend on it.
- Based: passes — The paper gives a reason why it holds.
What the paper did — it cites no source for this, so there is none to check. The quote shows it is in the paper.
In the paper
“Follow-up in the CALERIE Trial did not extend beyond the intervention.”
§ Effect of long-term caloric restriction on DNA methylation measures of biological aging in healthy adults from the CALERIE trial > Main
plain- Asserted: passes — The authors put it forward as true.
- Checkable: passes — It can be checked against evidence.
- Load-bearing: passes — The paper’s conclusions depend on it.
- Based: passes — The paper gives a reason why it holds.
A conclusion the paper draws from its own results — it cites no other source for it, so there is none to check. The quote shows it is in the paper.
In the paper
“The evidence reported from CALERIE suggests that DunedinPACE may be helpful in identifying short-term interventions worthy of long-term follow-up to generate such evidence.”
§ Effect of long-term caloric restriction on DNA methylation measures of biological aging in healthy adults from the CALERIE trial > Main
hedgedconditional- Asserted: passes — The authors put it forward as true.
- Checkable: passes — It can be checked against evidence.
- Load-bearing: passes — The paper’s conclusions depend on it.
- Based: passes — The paper gives a reason why it holds.
A conclusion the paper draws from its own results — it cites no other source for it, so there is none to check. The quote shows it is in the paper.
In the paper
“The ITT estimate may therefore underestimate the effect of CR on biological aging.”
§ Effect of long-term caloric restriction on DNA methylation measures of biological aging in healthy adults from the CALERIE trial > Methods > Specification of TOT regression models
hedgedconditional- Asserted: passes — The authors put it forward as true.
- Checkable: passes — It can be checked against evidence.
- Load-bearing: passes — The paper’s conclusions depend on it.
- Based: passes — The paper gives a reason why it holds.
- It may state two separate claims as one. 24
- Probably not a substantial claim. 41
The cited sources support only part of this claim — read each source’s verdict below.
In the paper
“Despite this imperfect adherence, treatment group participants experienced substantial and sustained weight loss and related changes in body and tissue composition, broad improvement in cardiometabolic health and a slowing of aging-related physiological changes26,31,44,45.”
§ Effect of long-term caloric restriction on DNA methylation measures of biological aging in healthy adults from the CALERIE trial > Main
What the sources say
- Partly supportedcites [26] Kraus, W. E. et al. 2 years of calorie restriction and cardiometabolic risk (CALERIE): exploratory outcomes of a multicentre, phase 2, randomised controlled trial. Lancet Diabetes Endocrinol. 7, 673–683 (2019). sourceExperimental — accuracy not yet measured
Split into 2 atoms — 1 confirmed, 1 partially supported, 0 disputed, 0 misattributed, 0 unverifiable. Expand the claim to see per-atom verdicts.
- Not checked — no full text of the sourcecites [31] Belsky, D. W., Huffman, K. M., Pieper, C. F., Shalev, I. & Kraus, W. E. Change in the rate of biological aging in response to caloric restriction: CALERIE Biobank Analysis. J. Gerontol. A 73, 4–10 (2017). source
- Partly supportedcites [44] Das, S. K. et al. Body-composition changes in the Comprehensive Assessment of Long-term Effects of Reducing Intake of Energy (CALERIE)-2 study: a 2-y randomized controlled trial of calorie restriction in nonobese humans. Am. J. Clin. Nutr. 105, 913–927 (2017). sourceExperimental — accuracy not yet measured
Split into 2 atoms — 1 confirmed, 1 partially supported, 0 disputed, 0 misattributed, 0 unverifiable. Expand the claim to see per-atom verdicts.
- Partly supportedcites [45] Shen, W. et al. Effect of 2-year caloric restriction on organ and tissue size in nonobese 21- to 50-year-old adults in a randomized clinical trial: the CALERIE study. Am. J. Clin. Nutr. 114, 1295–1303 (2021). sourceExperimental — accuracy not yet measured
Split into 2 atoms — 1 confirmed, 1 partially supported, 0 disputed, 0 misattributed, 0 unverifiable. Expand the claim to see per-atom verdicts.
plaindirect- Asserted: passes — The authors put it forward as true.
- Checkable: passes — It can be checked against evidence.
- Load-bearing: passes — The paper’s conclusions depend on it.
- Based: passes — The paper gives a reason why it holds.
It may state two separate claims as one.
- Partly supported
Every source the paper cites for this claim was checked and supports it.
In the paper
“DunedinPACE was originally designed to have high technical reliability.”
§ Effect of long-term caloric restriction on DNA methylation measures of biological aging in healthy adults from the CALERIE trial > Main
What the sources say
- Supportedcites [24] Belsky, D. W. et al. DunedinPACE, a DNA methylation biomarker of the pace of aging. eLife 11, e73420 (2022). source
The Discussion says DunedinPACE was developed by excluding CpG probes with low test-retest reliability, supporting that high technical reliability was a design goal. The Results section, “DunedinPACE shows exceptional test-retest reliability,” reports that this restriction contributed to its technical improvement over DunedinPoAm. (LLM, conf=0.93)
plain- Asserted: passes — The authors put it forward as true.
- Checkable: passes — It can be checked against evidence.
- Load-bearing: fails — The paper’s conclusions may not depend on it.
- Based: passes — The paper gives a reason why it holds.
Probably not a substantial claim. The paper’s conclusions may not depend on it.
- Supported
The sources with a verdict support this claim; the rest weren’t checked yet, have no full text we could read, or their verdicts aren’t rated yet.
In the paper
“Nevertheless, modest slowing of the pace of aging can have profound effects on population health11–13.”
§ Effect of long-term caloric restriction on DNA methylation measures of biological aging in healthy adults from the CALERIE trial > Abstract
What the sources say
- Supportedcites [11] Scott, A. J., Ellison, M. & Sinclair, D. A. The economic value of targeting aging. Nat. Aging 1, 616–623 (2021). source
In Results (‘Slowing aging’), the paper says slowing aging produces simultaneous improvements in health and mortality. The Conclusion says delaying aging affects many diseases and produces large gains across society, supporting the paraphrase about population health. Page numbers are unavailable in our copy. (LLM, conf=0.90)
- Not checked — no full text of the sourcecites [12] Kaeberlein, M. It is time to embrace 21st-century medicine. Public Policy Aging Rep. 29, 111–115 (2019). source
- Supportedcites [13] Goldman, D. P. et al. Substantial health and economic returns from delayed aging may warrant a new focus for medical research. Health Aff. 32, 1698–1705 (2013). source
In Study Data and Methods > Scenarios (page unavailable), the paper models delayed aging through a phased-in 1.25% annual reduction in disease onset, disability, and mortality risk after age fifty. Study Results (page unavailable) projects 2.2 additional years of life expectancy and 15% more nondisabled older adults than in the status quo scenario, supporting the claim about substantial population-health effects. (LLM, conf=0.91)
plainconditional- Asserted: passes — The authors put it forward as true.
- Checkable: fails — It may be too vague to check against evidence.
- Load-bearing: fails — The paper’s conclusions may not depend on it.
- Based: passes — The paper gives a reason why it holds.
Probably not a substantial claim. It may be too vague to check against evidence. The paper’s conclusions may not depend on it.
- Supported
Every source the paper cites for this claim was checked and supports it.
In the paper
“There is no gold standard measure of biological aging37.”
§ Effect of long-term caloric restriction on DNA methylation measures of biological aging in healthy adults from the CALERIE trial > Main
What the sources say
- Supportedcites [37] Ferrucci, L. et al. Measuring biological aging in humans: a quest. Aging Cell 19, e13080 (2020). source
The section on connecting aging biology with multimorbidity says that developing a proxy measure of biological aging in humans still requires work. The translational-value section likewise says substantial investment is needed to develop a robust, reliable estimator, supporting the claim that no gold-standard measure is yet established. (LLM, conf=0.90)
plain- Asserted: passes — The authors put it forward as true.
- Checkable: passes — It can be checked against evidence.
- Load-bearing: passes — The paper’s conclusions depend on it.
- Based: passes — The paper gives a reason why it holds.
Probably not a substantial claim.
- Supported
The cited sources support only part of this claim — read each source’s verdict below.
In the paper
“All three measures have evidence for validity as biomarkers of aging, in particular, evidence of association with aging-related morbidity and mortality and with exposures associated with shortened healthy lifespan24,29,30.”
§ Effect of long-term caloric restriction on DNA methylation measures of biological aging in healthy adults from the CALERIE trial > Main
What the sources say
- Supportedcites [24] Belsky, D. W. et al. DunedinPACE, a DNA methylation biomarker of the pace of aging. eLife 11, e73420 (2022). source
The Results sections on morbidity, disability, and mortality and on childhood poverty and victimization report both types of association for DunedinPACE. This supports the claim as it pertains to the measure documented by this citation; the other citations may address the other two measures. Our copy provides no page numbers for these passages. (LLM, conf=0.90)
- Partly supportedcites [29] Sugden, K. et al. Association of pace of aging measured by blood-based DNA methylation with age-related cognitive impairment and dementia. Neurology 99, e1402–e1413 (2022). sourceExperimental — accuracy not yet measured
The Results section on dementia in the FHS Offspring Cohort reports that several DNA-methylation measures were associated with future dementia, supporting evidence of an aging-related disease association. The paper examines five measures across three generations, however, and does not establish that all three measures in the citing sentence are associated with mortality or with exposures linked to shortened healthy lifespan. (LLM, conf=0.84)
- Partly supportedcites [30] Hillary, R. F. et al. Epigenetic measures of ageing predict the prevalence and incidence of leading causes of death and disease burden. Clin. Epigenetics 12, 115 (2020). sourceExperimental — accuracy not yet measured
The Discussion reports disease-incidence associations for DNAm GrimAge, DunedinPoAm and DNAm PhenoAge, and the Results associate these measures with smoking or deprivation. But the Results on all-cause mortality identify DNAm GrimAge alone; this paper does not establish a mortality association for all three measures. (LLM, conf=0.86)
plaincorrelational- Asserted: passes — The authors put it forward as true.
- Checkable: passes — It can be checked against evidence.
- Load-bearing: passes — The paper’s conclusions depend on it.
- Based: passes — The paper gives a reason why it holds.
It may state two separate claims as one.
- Supported
The sources with a verdict support this claim; the rest weren’t checked yet, have no full text we could read, or their verdicts aren’t rated yet.
In the paper
“Nevertheless, these measures are acknowledged to be incomplete summaries of biological changes that occur with aging and to have technical limitations39,40.”
§ Effect of long-term caloric restriction on DNA methylation measures of biological aging in healthy adults from the CALERIE trial > Main
What the sources say
- Supportedcites [39] Bell, C. G. et al. DNA methylation aging clocks: challenges and recommendations. Genome Biol. 20, 249 (2019). source
Challenge 1 describes biological aging as a wide range of changes with no single gold-standard measure, and says different DNAm clocks capture aspects of aging to different extents. Challenge 4 identifies technical limits of array coverage, including the under-representation of repetitive elements. Together, these support the characterization of DNAm measures as incomplete summaries with technical limitations. (LLM, conf=0.91)
- Not checked — no full text of the sourcecites [40] Belsky, D. W. et al. Eleven telomere, epigenetic clock, and biomarker-composite quantifications of biological aging: do they measure the same thing? Am. J. Epidemiol. 187, 1220–1230 (2018). source
plain- Asserted: passes — The authors put it forward as true.
- Checkable: passes — It can be checked against evidence.
- Load-bearing: passes — The paper’s conclusions depend on it.
- Based: passes — The paper gives a reason why it holds.
Probably not a substantial claim. It may state two separate claims as one.
- Supported
The sources with a verdict support this claim; the rest weren’t checked yet, have no full text we could read, or their verdicts aren’t rated yet.
In the paper
“Our previous reports on CALERIE establish that CR intervention improved participants’ cardiometabolic health and slowed aging-related changes in physiological system integrity26,31,32.”
§ Effect of long-term caloric restriction on DNA methylation measures of biological aging in healthy adults from the CALERIE trial > Main
What the sources say
- Supportedcites [26] Kraus, W. E. et al. 2 years of calorie restriction and cardiometabolic risk (CALERIE): exploratory outcomes of a multicentre, phase 2, randomised controlled trial. Lancet Diabetes Endocrinol. 7, 673–683 (2019). source
For the cardiometabolic-health component of this multi-citation sentence, the Discussion reports that two years of calorie restriction improved multiple cardiometabolic risk factors in healthy, non-obese young and middle-aged adults. This is the outcome the cited trial evaluates. (LLM, conf=0.91)
- Not checked — no full text of the sourcecites [31] Belsky, D. W., Huffman, K. M., Pieper, C. F., Shalev, I. & Kraus, W. E. Change in the rate of biological aging in response to caloric restriction: CALERIE Biobank Analysis. J. Gerontol. A 73, 4–10 (2017). source
- Supportedcites [32] Kwon, D. & Belsky, D. W. A toolkit for quantification of biological age from blood chemistry and organ function test data: BioAge. Geroscience 43, 2795–2808 (2021). source
Part 3 (CALERIE Analysis) says the CR group experienced physiological changes indicating improved cardiometabolic health and cites an earlier report of slower biological aging than in the control group. The Discussion says this paper's analysis likewise found slower biological aging on the KDM and PhenoAge measures. The Introduction describes biological aging as a decline in system integrity. (LLM, conf=0.90)
boosteddirect- Asserted: passes — The authors put it forward as true.
- Checkable: passes — It can be checked against evidence.
- Load-bearing: unclear — It is unclear whether the paper’s conclusions depend on it.
- Based: passes — The paper gives a reason why it holds.
It may state two separate claims as one.
- Supported
The sources with a verdict support this claim; the rest weren’t checked yet, have no full text we could read, or their verdicts aren’t rated yet.
In the paper
“New measurements that summarize biological changes occurring with aging have potential to overcome this challenge; measurements to quantify biological aging that both predict future disease, disability and mortality and can detect changes in aging processes over short timescales have potential to function as surrogate endpoints for intervention effects on healthy lifespan38,49.”
§ Effect of long-term caloric restriction on DNA methylation measures of biological aging in healthy adults from the CALERIE trial > Main
What the sources say
- Not checked — no full text of the sourcecites [38] Kritchevsky, S. B. & Justice, J. N. Testing the geroscience hypothesis: early days. J. Gerontol. A 75, 99–101 (2020). source
- Supportedcites [49] Justice, J. N. & Kritchevsky, S. B. Putting epigenetic biomarkers to the test for clinical trials. eLife 9, e58592 (2020). source
Split into 2 atoms — 2 confirmed, 0 partially supported, 0 disputed, 0 misattributed, 0 unverifiable. Expand the claim to see per-atom verdicts.
hedgedcorrelational- Asserted: passes — The authors put it forward as true.
- Checkable: passes — It can be checked against evidence.
- Load-bearing: passes — The paper’s conclusions depend on it.
- Based: passes — The paper gives a reason why it holds.
It may state two separate claims as one.
The cited sources support only part of this claim — read each source’s verdict below.
In the paper
“The measures we studied summarize biological aging in general and do not isolate system-specific aging processes41.”
§ Effect of long-term caloric restriction on DNA methylation measures of biological aging in healthy adults from the CALERIE trial > Main
What the sources say
- Partly supportedcites [41] Ahadi, S. et al. Personal aging markers and ageotypes revealed by deep longitudinal profiling. Nat. Med. 26, 83–90 (2020). sourceExperimental — accuracy not yet measured
The passage on DNA methylation clocks (section labeled Abstract; no page supplied) describes them as associated with chronological and biological age, supporting the general-aging part of the claim. It contrasts those clocks with the paper’s pathway-level ageotypes, but does not establish that the particular DNAm measures studied by the citing authors cannot isolate system-specific aging processes. (LLM, conf=0.82)
plain- Asserted: passes — The authors put it forward as true.
- Checkable: passes — It can be checked against evidence.
- Load-bearing: passes — The paper’s conclusions depend on it.
- Based: passes — The paper gives a reason why it holds.
It may state two separate claims as one.
- Partly supported
The cited sources support only part of this claim — read each source’s verdict below.
In the paper
“DunedinPACE has high test–retest reliability and shows strong associations with healthspan endpoints in validation analyses24,29.”
§ Effect of long-term caloric restriction on DNA methylation measures of biological aging in healthy adults from the CALERIE trial > Main
What the sources say
- Supportedcites [24] Belsky, D. W. et al. DunedinPACE, a DNA methylation biomarker of the pace of aging. eLife 11, e73420 (2022). source
The Results section reports excellent test–retest reliability for DunedinPACE, with ICCs of 0.96, 0.97, and 0.87 across replicate datasets. The Results section on morbidity, disability, and mortality also reports associations with healthspan endpoints, including associations that remained statistically different from zero after adjustment for GrimAge. Page numbers are not provided in our copy. (LLM, conf=0.93)
- Partly supportedcites [29] Sugden, K. et al. Association of pace of aging measured by blood-based DNA methylation with age-related cognitive impairment and dementia. Neurology 99, e1402–e1413 (2022). sourceExperimental — accuracy not yet measured
The Results (FHS Offspring Cohort; page not available) report that DunedinPACE predicted incident dementia, supporting an association with an age-related health outcome. The Methods (DNA Methylation Data; page not available) say test–retest replicate samples were removed, but do not report DunedinPACE’s test–retest reliability. This paper’s validation evidence concerns cognitive outcomes and dementia, not healthspan endpoints generally. (LLM, conf=0.85)
boostedcorrelational- Asserted: passes — The authors put it forward as true.
- Checkable: passes — It can be checked against evidence.
- Load-bearing: passes — The paper’s conclusions depend on it.
- Based: passes — The paper gives a reason why it holds.
It may state two separate claims as one.
- Supported
Every source the paper cites for this claim was checked and supports it.
In the paper
“However, CR has diverse effects across multiple biological systems42,43.”
§ Effect of long-term caloric restriction on DNA methylation measures of biological aging in healthy adults from the CALERIE trial > Main
What the sources say
- Supportedcites [42] Ma, S. et al. Caloric restriction reprograms the single-cell transcriptional landscape of Rattus norvegicus aging. Cell 180, 984–1001.e22 (2020). source
The Introduction reports effects of caloric restriction across nine rat tissue types, including changes in cell composition, gene expression, and cell communication. The Results also describe tissue-specific effects and changes in immune and nutrient-sensing pathways, supporting the broad claim that CR has diverse effects across biological systems. Page numbers are not available in the supplied passages. (LLM, conf=0.93)
- Supportedcites [43] Dorling, J. L., Martin, C. K. & Redman, L. M. Calorie restriction for enhanced longevity: the role of novel dietary strategies in the present obesogenic environment. Ageing Res. Rev. 64, 101038 (2020). source
The “Calorie restriction in humans” section reports effects on energy expenditure, hormones, oxidative stress, body composition, cardiometabolic risk, inflammation, and aerobic fitness. These findings support the broad claim that CR affects multiple biological systems. (LLM, conf=0.94)
plaindirect- Asserted: passes — The authors put it forward as true.
- Checkable: fails — It may be too vague to check against evidence.
- Load-bearing: passes — The paper’s conclusions depend on it.
- Based: passes — The paper gives a reason why it holds.
Probably not a substantial claim. It may be too vague to check against evidence.
- Supported
The cited sources support only part of this claim — read each source’s verdict below.
In the paper
“and is established to increase healthy lifespan in multiple species8,9.”
§ Effect of long-term caloric restriction on DNA methylation measures of biological aging in healthy adults from the CALERIE trial > Abstract
What the sources say
- Supportedcites [8] Anderson, R. M. & Weindruch, R. The caloric restriction paradigm: implications for healthy human aging. Am. J. Hum. Biol. 24, 101–106 (2012). source
The Introduction reports that caloric restriction extends lifespan in rodents and opposes a broad range of age-associated changes, so the animals stay “younger longer.” It also discusses caloric-restriction research in yeast, nematodes and flies, supporting the claim about multiple experimental species. The claim does not assert that increased lifespan is established in humans. (LLM, conf=0.90)
- Partly supportedcites [9] Mattison, J. A. et al. Impact of caloric restriction on health and survival in rhesus monkeys from the NIA study. Nature 489, 318–321 (2012). sourceExperimental — accuracy not yet measured
The Abstract reports that caloric restriction has been associated with longer lifespan and healthspan in a variety of animals, supporting the multiple-species background claim. But “established” is stronger than the paper’s qualified account: its NIA rhesus-monkey study found no significant survival benefit, even though some health measures improved. (LLM, conf=0.86)
boosteddirect- Asserted: passes — The authors put it forward as true.
- Checkable: passes — It can be checked against evidence.
- Load-bearing: passes — The paper’s conclusions depend on it.
- Based: passes — The paper gives a reason why it holds.
Probably not a substantial claim.
- Supported
Every source the paper cites for this claim was checked and supports it.
In the paper
“The geroscience hypothesis proposes that therapy to slow or reverse molecular changes that occur with aging can delay or prevent multiple chronic diseases and extend healthy lifespan1–3.”
§ Effect of long-term caloric restriction on DNA methylation measures of biological aging in healthy adults from the CALERIE trial > Abstract
What the sources say
- Supportedcites [1] Kaeberlein, M. Longevity and aging. F1000Prime Rep. 5, 5 (2013). source
The Introduction says that interventions targeting the molecular processes of aging can simultaneously delay the onset and progression of most age-related disorders. It also predicts added years spent largely free from chronic disease and disability, which supports the claim about extending healthy lifespan. (LLM, conf=0.92)
- Supportedcites [2] Kennedy, B. K. et al. Geroscience: linking aging to chronic disease. Cell 159, 709–713 (2014). source
The Introduction says geroscience seeks approaches that prevent or treat multiple diseases and extend healthspan. The Aging Research Initiative links therapies for multiple chronic diseases and longer human healthspan to targeting aging directly; its discussion of molecular pathways and interventions supports the paraphrase. Page numbers were not supplied in our copy. (LLM, conf=0.88)
- Supportedcites [3] Campisi, J. et al. From discoveries in ageing research to therapeutics for healthy ageing. Nature 571, 183–192 (2019). source
In “Using geroscience to treat age-related disease” (page unavailable), the paper says that targeting conserved ageing pathways should prevent or ameliorate multiple clinical problems, while noting that the hypothesis remains to be tested in clinical trials. In “The need for biomarkers of ageing” (page unavailable), it describes the promise of increasing human healthspan by preventing or delaying age-related pathologies. The citing sentence presents this as a hypothesis, not an established clinical result. (LLM, conf=0.91)
plainconditional- Asserted: passes — The authors put it forward as true.
- Checkable: passes — It can be checked against evidence.
- Load-bearing: passes — The paper’s conclusions depend on it.
- Based: passes — The paper gives a reason why it holds.
Probably not a substantial claim.
- Supported
The cited sources support only part of this claim — read each source’s verdict below.
In the paper
“Comprehensive Assessment of Long-term Effects of Reducing Intake of Energy (CALERIE) Phase 2 was a multi-center, randomized controlled trial conducted at three clinical centers in the United States10.”
§ Effect of long-term caloric restriction on DNA methylation measures of biological aging in healthy adults from the CALERIE trial > Main
What the sources say
- Partly supportedcites [10] Ravussin, E. et al. A 2-year randomized controlled trial of human caloric restriction: feasibility and effects on predictors of health span and longevity. J. Gerontol. A 70, 1097–1104 (2015). sourceExperimental — accuracy not yet measured
The paper’s opening summary (page unavailable) identifies CALERIE as a three-site randomized controlled trial, supporting the multi-center design and number of sites. The passages in our copy do not specify that the three clinical centers were in the United States. (LLM, conf=0.82)
plain- Asserted: passes — The authors put it forward as true.
- Checkable: passes — It can be checked against evidence.
- Load-bearing: fails — The paper’s conclusions may not depend on it.
- Based: passes — The paper gives a reason why it holds.
Probably not a substantial claim. The paper’s conclusions may not depend on it. It may state two separate claims as one.
- Partly supported
Every source the paper cites for this claim was checked and supports it.
In the paper
“In CALERIE, adherence was imperfect; the average CR achieved in the treatment group was roughly half the prescribed dose of 25% (ref. 10).”
§ Effect of long-term caloric restriction on DNA methylation measures of biological aging in healthy adults from the CALERIE trial > Methods > Specification of TOT regression models
What the sources say
- Supportedcites [10] Ravussin, E. et al. A 2-year randomized controlled trial of human caloric restriction: feasibility and effects on predictors of health span and longevity. J. Gerontol. A 70, 1097–1104 (2015). source
The Intervention and Adherence Measurements section says the prescribed target was 25% caloric restriction. The Adherence and Weight Loss section reports that the treatment group averaged 11.7 ± 0.7% over two years—roughly half the target. (LLM, conf=0.94)
plain- Asserted: passes — The authors put it forward as true.
- Checkable: passes — It can be checked against evidence.
- Load-bearing: passes — The paper’s conclusions depend on it.
- Based: passes — The paper gives a reason why it holds.
It may state two separate claims as one.
- Supported
Every source the paper cites for this claim was checked and supports it.
In the paper
“IV regression is a method commonly used to reduce the impact of confounding in association analysis. It can also be applied to account for contamination/nonadherence in randomized trials64.”
§ Effect of long-term caloric restriction on DNA methylation measures of biological aging in healthy adults from the CALERIE trial > Methods > Specification of TOT regression models
What the sources say
- Supportedcites [64] Sussman, J. B. & Hayward, R. A. An IV for the RCT: using instrumental variables to adjust for treatment contamination in randomised controlled trials. Brit. Med. J. 340, c2073 (2010). source
The section “Using instrumental variables to help us understand results of randomised controlled trials” says IV analysis is becoming common in observational medical studies and describes its use to disentangle a confounded causal relation. The same section explains how IV analysis adjusts for treatment contamination and non-adherence in randomised trials. (LLM, conf=0.91)
plaindirect- Asserted: passes — The authors put it forward as true.
- Checkable: passes — It can be checked against evidence.
- Load-bearing: passes — The paper’s conclusions depend on it.
- Based: passes — The paper gives a reason why it holds.
Probably not a substantial claim. It may state two separate claims as one.
- Supported
Every source the paper cites for this claim was checked and supports it.
In the paper
“The DunedinPACE DNAm algorithm was derived from elastic net regression of the physiological pace-of-aging composite on Illumina EPIC array DNAm data derived from blood samples collected at the age 45 follow-up assessment.”
§ Effect of long-term caloric restriction on DNA methylation measures of biological aging in healthy adults from the CALERIE trial > Methods > DNAm clocks and pace-of-aging measures
What the sources say
- Supportedcites [24] Belsky, D. W. et al. DunedinPACE, a DNA methylation biomarker of the pace of aging. eLife 11, e73420 (2022). source
The Results state that DunedinPACE was developed using elastic-net regression to predict the 20-year Pace of Aging from Illumina EPIC array DNA methylation data collected from blood at age 45. The Materials and methods section explains that the Pace of Aging criterion was a composite of longitudinal changes in 19 physiological biomarkers. (LLM, conf=0.95)
plain- Asserted: passes — The authors put it forward as true.
- Checkable: passes — It can be checked against evidence.
- Load-bearing: fails — The paper’s conclusions may not depend on it.
- Based: passes — The paper gives a reason why it holds.
Probably not a substantial claim. The paper’s conclusions may not depend on it.
- Supported
Every source the paper cites for this claim was checked and supports it.
In the paper
“Based on analysis of pace of aging in the Dunedin Study (n = 817 participants examined at ages 26, 32, 38 and 45 yr)24, pace of aging was measured from within-person change over time in 19 blood chemistry and organ function test metrics of system integrity24.”
§ Effect of long-term caloric restriction on DNA methylation measures of biological aging in healthy adults from the CALERIE trial > Methods > Pace of aging
What the sources say
- Supportedcites [24] Belsky, D. W. et al. DunedinPACE, a DNA methylation biomarker of the pace of aging. eLife 11, e73420 (2022). source
Split into 2 atoms — 2 confirmed, 0 partially supported, 0 disputed, 0 misattributed, 0 unverifiable. Expand the claim to see per-atom verdicts.
plain- Asserted: passes — The authors put it forward as true.
- Checkable: passes — It can be checked against evidence.
- Load-bearing: fails — The paper’s conclusions may not depend on it.
- Based: passes — The paper gives a reason why it holds.
Probably not a substantial claim. The paper’s conclusions may not depend on it. It may state two separate claims as one.
- Supported
The cited sources support only part of this claim — read each source’s verdict below.
In the paper
“The GrimAge clock was based on analysis of eight plasma protein markers, smoking pack years, age, sex and mortality data from the Framingham Heart Study Offspring and Gen3 Cohorts (n = 2,751 participants aged 24–92 yr)47–49.”
§ Effect of long-term caloric restriction on DNA methylation measures of biological aging in healthy adults from the CALERIE trial > Methods > DNAm clocks
What the sources say
- Could not verifycites [47] Sierra, F. et al. Moving geroscience from the bench to clinical care and health policy. J. Am. Geriatr. Soc. 69, 2455–2463 (2021). sourceExperimental — accuracy not yet measured
The section on behavioral and social science perspectives discusses measuring biological aging but does not describe how GrimAge was developed. Searches for GrimAge, plasma protein markers, smoking pack years, and the Framingham cohorts found no passage in our copy addressing the claim, including its participant count or age range. (LLM, conf=0.73)
- Could not verifycites [48] Justice, J. et al. Frameworks for proof-of-concept clinical trials of interventions that target fundamental aging processes. J. Gerontol. A Biol. Sci. Med. Sci. 71, 1415–1423 (2016). sourceExperimental — accuracy not yet measured
The Approach section discusses biomarkers for proof-of-concept aging trials, but does not describe how the GrimAge clock was developed. Searches for GrimAge, the eight plasma proteins, smoking pack-years, and the Framingham cohorts found no passage addressing the claim; page numbers are unavailable in our copy. (LLM, conf=0.78)
- Partly supportedcites [49] Justice, J. N. & Kritchevsky, S. B. Putting epigenetic biomarkers to the test for clinical trials. eLife 9, e58592 (2020). sourceExperimental — accuracy not yet measured
The Figure 1 caption (Abstract; no page given) identifies GrimAge as a mortality estimator. Our copy does not describe its inputs, the Framingham cohorts, participant count, or age range, so those details are not supported by this source. (LLM, conf=0.83)
plainn = 2,751- Asserted: passes — The authors put it forward as true.
- Checkable: passes — It can be checked against evidence.
- Load-bearing: fails — The paper’s conclusions may not depend on it.
- Based: passes — The paper gives a reason why it holds.
Probably not a substantial claim. The paper’s conclusions may not depend on it.
- Could not verify
The cited sources support only part of this claim — read each source’s verdict below.
In the paper
“DunedinPACE was developed by modeling within-individual multi-system physiological change across four timepoints in same-age individuals in the Dunedin Study 1972–1973 birth cohort60,61, when participants were aged 26, 32, 38 and 45 yr.”
§ Effect of long-term caloric restriction on DNA methylation measures of biological aging in healthy adults from the CALERIE trial > Methods > DNAm clocks and pace-of-aging measures
What the sources say
- Supportedcites [24] Belsky, D. W. et al. DunedinPACE, a DNA methylation biomarker of the pace of aging. eLife 11, e73420 (2022). source
The Introduction describes a same-age 1972–1973 Dunedin birth cohort and tracks declines across multiple organ systems at ages 26, 32, 38, and 45. The Methods passage states that within-individual change across those four timepoints was modeled as Pace of Aging and then distilled into DunedinPACE. (LLM, conf=0.95)
- Partly supportedcites [60] Belsky, D. W. et al. Quantification of biological aging in young adults. Proc. Natl Acad. Sci. USA 112, E4104–E4110 (2015). sourceExperimental — accuracy not yet measured
The Sample section identifies the Dunedin Study as a 1972–1973 birth cohort, and the Significance section describes modeling within-individual physiological change across multiple systems. But this paper’s analysis used three timepoints—ages 26, 32, and 38—not four through age 45; the Discussion says follow-up extended only to age 38. It describes a Pace of Aging measure, not the development of DunedinPACE. (LLM, conf=0.90)
- Partly supportedcites [61] Elliott, M. L. et al. Disparities in the pace of biological aging among midlife adults of the same chronological age have implications for future frailty risk and policy. Nat. Aging 1, 295–308 (2021). sourceExperimental — accuracy not yet measured
The Introduction and Methods (pages unavailable) describe modeling changes in multiple physiological systems in the same-age Dunedin 1972–1973 birth cohort at ages 26, 32, 38, and 45. They call the resulting measure the “Pace of Aging,” however; our copy does not say that this paper developed DunedinPACE. (LLM, conf=0.86)
plain- Asserted: passes — The authors put it forward as true.
- Checkable: passes — It can be checked against evidence.
- Load-bearing: fails — The paper’s conclusions may not depend on it.
- Based: passes — The paper gives a reason why it holds.
Probably not a substantial claim. The paper’s conclusions may not depend on it.
- Supported
Every source the paper cites for this claim was checked and supports it.
In the paper
“These clocks also include an intermediate step in which DNAm data are fitted to physiological parameters.”
§ Effect of long-term caloric restriction on DNA methylation measures of biological aging in healthy adults from the CALERIE trial > Methods > DNAm clocks and pace-of-aging measures
What the sources say
- Supportedcites [22] Levine, M. E. et al. An epigenetic biomarker of aging for lifespan and healthspan. Aging 10, 573–591 (2018). source
The Results section’s Figure 1 roadmap describes a two-step process: first deriving phenotypic age from clinical biomarkers, then fitting blood DNA methylation data to that measure. This supports the attributed intermediate step for the DNAm PhenoAge clock. (LLM, conf=0.90)
- Supportedcites [23] Lu, A. T. et al. DNA methylation GrimAge strongly predicts lifespan and healthspan. Aging 11, 303–327 (2019). source
The Introduction describes GrimAge as a two-stage clock whose first stage derives DNAm-based surrogates for plasma proteins and smoking pack-years. The Results section, “Stage 1: DNAm-based surrogate biomarkers of plasma proteins and smoking pack-years,” specifies that protein levels were regressed on CpG levels, supporting the described intermediate step. (LLM, conf=0.89)
plain- Asserted: passes — The authors put it forward as true.
- Checkable: passes — It can be checked against evidence.
- Load-bearing: fails — The paper’s conclusions may not depend on it.
- Based: passes — The paper gives a reason why it holds.
Probably not a substantial claim. The paper’s conclusions may not depend on it.
- Supported
The cited sources support only part of this claim — read each source’s verdict below.
In the paper
“Our primary analysis focused on the PC versions of the PhenoAge and GrimAge second-generation clocks and DunedinPACE, all of which show exceptional test–retest reliability in technical replicates.”
§ Effect of long-term caloric restriction on DNA methylation measures of biological aging in healthy adults from the CALERIE trial > Methods > DNAm clocks and pace-of-aging measures
What the sources say
- Partly supportedcites [25] Higgins-Chen, A. T. et al. A computational solution for bolstering reliability of epigenetic clocks: implications for clinical trials and longitudinal tracking. Nat. Aging 2, 644–661 (2022). sourceExperimental — accuracy not yet measured
The Results section (‘Reliable epigenetic clocks trained from principal components’; page unavailable) reports exceptional agreement between technical replicates for PC clocks, including PCPhenoAge and PCGrimAge. Our copy does not establish the same test–retest reliability for DunedinPACE, so it does not support the claim about all three measures. (LLM, conf=0.88)
- Partly supportedcites [24] Belsky, D. W. et al. DunedinPACE, a DNA methylation biomarker of the pace of aging. eLife 11, e73420 (2022). sourceExperimental — accuracy not yet measured
The Results section, “DunedinPACE shows exceptional test-retest reliability” (page unavailable), reports excellent reliability for DunedinPACE in technical replicates (ICC 0.96) and says it is as reliable as the GrimAge clock. It does not establish exceptional reliability for the PC versions of PhenoAge and GrimAge; it says DunedinPACE is more reliable than the other clocks tested and notes that methods have been proposed to improve their reliability. (LLM, conf=0.88)
boosted- Asserted: passes — The authors put it forward as true.
- Checkable: passes — It can be checked against evidence.
- Load-bearing: unclear — It is unclear whether the paper’s conclusions depend on it.
- Based: passes — The paper gives a reason why it holds.
It may state two separate claims as one.
- Partly supported
The cited sources support only part of this claim — read each source’s verdict below.
In the paper
“The second-generation clocks are more predictive of morbidity and mortality as compared with the first-generation clocks59 and are proposed to have improved potential for testing impacts of interventions to slow aging14.”
§ Effect of long-term caloric restriction on DNA methylation measures of biological aging in healthy adults from the CALERIE trial > Methods > DNAm clocks and pace-of-aging measures
What the sources say
- Not checked — no full text of the sourcecites [59] Levine, M. E. Assessment of epigenetic clocks as biomarkers of aging in basic and population research. J. Gerontol. A 75, 463–465 (2020). source
- Partly supportedcites [14] Fahy, G. M. et al. Reversal of epigenetic aging and immunosenescent trends in humans. Aging Cell 18, e13028 (2019). sourceExperimental — accuracy not yet measured
The Discussion (page unavailable) proposes using epigenetic clocks to estimate the effectiveness of putative aging interventions, supporting the point attached to this citation. It does not say that second-generation clocks have improved potential for that purpose relative to first-generation clocks. The separate citation 59 is attached to the sentence’s morbidity-and-mortality comparison, so that comparison is not attributed to this paper. (LLM, conf=0.82)
plaincorrelational- Asserted: passes — The authors put it forward as true.
- Checkable: passes — It can be checked against evidence.
- Load-bearing: passes — The paper’s conclusions depend on it.
- Based: passes — The paper gives a reason why it holds.
It may state two separate claims as one.
Every source the paper cites for this claim was checked and supports it.
In the paper
“The second-generation DNAm clocks were developed with the goal of improving quantification of biological aging by focusing on differences in mortality risk instead of on differences in chronological age22,23.”
§ Effect of long-term caloric restriction on DNA methylation measures of biological aging in healthy adults from the CALERIE trial > Methods > DNAm clocks and pace-of-aging measures
What the sources say
- Supportedcites [22] Levine, M. E. et al. An epigenetic biomarker of aging for lifespan and healthspan. Aging 10, 573–591 (2018). source
The Introduction explains that first-generation DNAm clocks were developed to predict chronological age, whereas capturing differences in risk among people of the same age was an important goal. The Discussion says DNAm PhenoAge was optimized to predict phenotypic age, a proxy for physiological dysregulation, and thereby captured variation in death risk rather than only chronological age. (LLM, conf=0.91)
- Supportedcites [23] Lu, A. T. et al. DNA methylation GrimAge strongly predicts lifespan and healthspan. Aging 11, 303–327 (2019). source
The Introduction contrasts earlier DNAm estimators built for chronological age with newer biomarkers developed to predict lifespan. It describes GrimAge as a mortality-risk estimate transformed into an age estimate, and the Discussion reports that it outperforms earlier clocks on health-related measures. The supplied passages have section labels but no page numbers. (LLM, conf=0.90)
plain- Asserted: passes — The authors put it forward as true.
- Checkable: passes — It can be checked against evidence.
- Load-bearing: fails — The paper’s conclusions may not depend on it.
- Based: passes — The paper gives a reason why it holds.
Probably not a substantial claim. The paper’s conclusions may not depend on it.
- Supported
Every source the paper cites for this claim was checked and supports it.
In the paper
“The set of CpG sites included in the DNAm dataset used to develop the DunedinPACE algorithm was restricted to those showing acceptable test–retest reliability as determined in the analysis in ref. 62.”
§ Effect of long-term caloric restriction on DNA methylation measures of biological aging in healthy adults from the CALERIE trial > Methods > DNAm clocks and pace-of-aging measures
What the sources say
- Supportedcites [62] Sugden, K. et al. Patterns of reliability: assessing the reproducibility and integrity of DNA methylation measurement. Patterns 1, 100014 (2020). source
The Results section reports CpG probe reliability estimates, and the Discussion says the authors made reliability metrics for all measured probes available in Data S1 and recommend filtering data on that basis. The citation identifies the analysis used to assess acceptable reliability; it does not attribute the development of DunedinPACE to this paper. Page numbers are unavailable in our copy. (LLM, conf=0.88)
plain- Asserted: passes — The authors put it forward as true.
- Checkable: passes — It can be checked against evidence.
- Load-bearing: fails — The paper’s conclusions may not depend on it.
- Based: passes — The paper gives a reason why it holds.
Probably not a substantial claim. The paper’s conclusions may not depend on it.
- Supported
The cited sources support only part of this claim — read each source’s verdict below.
In the paper
“These clocks were highly accurate in predicting the chronological age of new samples and also showed some capacity for predicting differences in mortality risk, although effect sizes tend to be small and inconsistent across studies56–58.”
§ Effect of long-term caloric restriction on DNA methylation measures of biological aging in healthy adults from the CALERIE trial > Methods > DNAm clocks and pace-of-aging measures
What the sources say
- Partly supportedcites [56] Horvath, S. DNA methylation age of human tissues and cell types. Genome Biol. 14, R115 (2013). sourceExperimental — accuracy not yet measured
In “The multi-tissue age predictor used for defining DNAm age” (page unavailable), Horvath reports high accuracy in independent test data: an age correlation of 0.96 and a median error of 3.6 years. The passages found do not assess mortality-risk prediction or report small, inconsistent mortality effects across studies, so that part of the attributed claim is unsupported by this paper. (LLM, conf=0.88)
- Partly supportedcites [57] Hannum, G. et al. Genome-wide methylation profiles reveal quantitative views of human aging rates. Mol. Cell 49, 359–367 (2013). sourceExperimental — accuracy not yet measured
In “A predictive model for the aging methylome” (page unavailable), the paper reports highly accurate age predictions in 174 independent samples. It does not report whether the clock predicts mortality risk or assess the size or consistency of mortality effects across studies; the Conclusions discuss longevity only as a potential future application. (LLM, conf=0.90)
- Partly supportedcites [58] Chen, B. H. et al. DNA methylation-based measures of biological age: meta-analysis predicting time to death. Aging 8, 1844–1865 (2016). sourceExperimental — accuracy not yet measured
The Introduction describes epigenetic clocks as robust estimators of chronological age, and the Results (Epigenetic age estimation) report correlations of 0.65–0.89. The Results (Cox regression models of all-cause mortality) find that all examined age-acceleration measures predicted mortality. The claim that effects were inconsistent across studies is not supported by these passages; the Results (Subgroup analysis) instead say hazard-ratio estimates were highly consistent across examined subgroups. (LLM, conf=0.86)
plaincorrelational- Asserted: passes — The authors put it forward as true.
- Checkable: passes — It can be checked against evidence.
- Load-bearing: fails — The paper’s conclusions may not depend on it.
- Based: passes — The paper gives a reason why it holds.
Probably not a substantial claim. The paper’s conclusions may not depend on it. It may state two separate claims as one.
- Partly supported
A result the paper reports from its own data — it cites no other source for it, so there is none to check. The quote shows it is in the paper.
In the paper
“For DunedinPACE, the treatment effect in the >10% CR group was d = −0.33 at 12 months and d = −0.33 at 24 months, as compared with d = −0.19 at 12 months and d = −0.14 at 24 months in the <10% CR group.”
§ Effect of long-term caloric restriction on DNA methylation measures of biological aging in healthy adults from the CALERIE trial > Main
plaincorrelational- Asserted: passes — The authors put it forward as true.
- Checkable: passes — It can be checked against evidence.
- Load-bearing: passes — The paper’s conclusions depend on it.
- Based: passes — The paper gives a reason why it holds.
It may state two separate claims as one.
A result the paper reports from its own data — it cites no other source for it, so there is none to check. The quote shows it is in the paper.
In the paper
“In IV analysis, the effect of 20% CR on DunedinPACE was d = −0.43 (95% CI −0.67, −0.19) at 12 months and d = −0.40 (95% CI −0.67, −0.12) at 24 months (P < 0.005 for both).”
§ Effect of long-term caloric restriction on DNA methylation measures of biological aging in healthy adults from the CALERIE trial > Main
plaindirect- Asserted: passes — The authors put it forward as true.
- Checkable: passes — It can be checked against evidence.
- Load-bearing: passes — The paper’s conclusions depend on it.
- Based: passes — The paper gives a reason why it holds.
It may state two separate claims as one.
- The authors state this as an assumption: The CALERIE intervention affected participants’ biological aging only through its effect on their caloric intake.
The paper states this without a source or data behind it here, so there is nothing to check it against. The quote shows it is in the paper.
In the paper
“As expected, participants’ PhenoAge and GrimAge values tended to increase over time.”
§ Effect of long-term caloric restriction on DNA methylation measures of biological aging in healthy adults from the CALERIE trial > Main
hedgedcorrelational- Asserted: passes — The authors put it forward as true.
- Checkable: passes — It can be checked against evidence.
- Load-bearing: fails — The paper’s conclusions may not depend on it.
- Based: passes — The paper gives a reason why it holds.
Probably not a substantial claim. The paper’s conclusions may not depend on it.
A result the paper reports from its own data — it cites no other source for it, so there is none to check. The quote shows it is in the paper.
In the paper
“Moreover, changes in DunedinPACE over follow-up showed substantial overlap between the CR treatment group and the AL control group; effect-size estimates imply close to 90% overlap of DunedinPACE trajectories between the two groups.”
§ Effect of long-term caloric restriction on DNA methylation measures of biological aging in healthy adults from the CALERIE trial > Main
plain- Asserted: passes — The authors put it forward as true.
- Checkable: passes — It can be checked against evidence.
- Load-bearing: unclear — It is unclear whether the paper’s conclusions depend on it.
- Based: passes — The paper gives a reason why it holds.
It may state two separate claims as one.
A result the paper reports from its own data — it cites no other source for it, so there is none to check. The quote shows it is in the paper.
In the paper
“Participants had mean age of 38 yr (s.d. = 7), 70% were women and 77% were white”
§ Effect of long-term caloric restriction on DNA methylation measures of biological aging in healthy adults from the CALERIE trial > Methods > Statistics and reproducibility
plainn = 197- Asserted: passes — The authors put it forward as true.
- Checkable: passes — It can be checked against evidence.
- Load-bearing: fails — The paper’s conclusions may not depend on it.
- Based: passes — The paper gives a reason why it holds.
Probably not a substantial claim. The paper’s conclusions may not depend on it. It may state two separate claims as one.
A result the paper reports from its own data — it cites no other source for it, so there is none to check. The quote shows it is in the paper.
In the paper
“The 20% CR level represented the 75th percentile of the treatment group CR distribution at 12-month follow-up and the 87th percentile of the treatment group CR distribution at 24-month follow-up.”
§ Effect of long-term caloric restriction on DNA methylation measures of biological aging in healthy adults from the CALERIE trial > Methods > Specification of TOT regression models
plain- Asserted: passes — The authors put it forward as true.
- Checkable: passes — It can be checked against evidence.
- Load-bearing: passes — The paper’s conclusions depend on it.
- Based: passes — The paper gives a reason why it holds.
It may state two separate claims as one.
What the paper did — it cites no source for this, so there is none to check. The quote shows it is in the paper.
In the paper
“CALERIE follow-up is, so far, limited to the end of the intervention period.”
§ Effect of long-term caloric restriction on DNA methylation measures of biological aging in healthy adults from the CALERIE trial > Main
plain- Asserted: passes — The authors put it forward as true.
- Checkable: passes — It can be checked against evidence.
- Load-bearing: fails — The paper’s conclusions may not depend on it.
- Based: passes — The paper gives a reason why it holds.
Probably not a substantial claim. The paper’s conclusions may not depend on it.
What the paper did — it cites no source for this, so there is none to check. The quote shows it is in the paper.
In the paper
“Participants were randomly assigned at a ratio of 2:1 to a CR behavioral intervention or to an ad libitum (AL) control group stratified by site, sex and BMI.”
- Also stated in: § Randomization and masking · plain
“After baseline testing, participants were randomly assigned at a ratio of 2:1 to a CR behavioral intervention or to an AL control group. Randomization was stratified by site, sex and BMI. A permuted block randomization technique was used.”
§ Effect of long-term caloric restriction on DNA methylation measures of biological aging in healthy adults from the CALERIE trial > Main
plainn = 220- Asserted: passes — The authors put it forward as true.
- Checkable: passes — It can be checked against evidence.
- Load-bearing: passes — The paper’s conclusions depend on it.
- Based: passes — The paper gives a reason why it holds.
Probably not a substantial claim.
- Also stated in: § Randomization and masking · plain
A conclusion the paper draws from its own results — it cites no other source for it, so there is none to check. The quote shows it is in the paper.
In the paper
“Our findings highlight DunedinPACE as a measure with potential utility in future trials.”
§ Effect of long-term caloric restriction on DNA methylation measures of biological aging in healthy adults from the CALERIE trial > Main
hedged- Asserted: passes — The authors put it forward as true.
- Checkable: fails — It may be too vague to check against evidence.
- Load-bearing: passes — The paper’s conclusions depend on it.
- Based: passes — The paper gives a reason why it holds.
Probably not a substantial claim. It may be too vague to check against evidence.
In the paper
“We analyzed several measures which represent the current state-of-the-art in DNAm quantification of biological aging38.”
§ Effect of long-term caloric restriction on DNA methylation measures of biological aging in healthy adults from the CALERIE trial > Main
What the sources say
- Not checked — no full text of the sourcecites [38] Kritchevsky, S. B. & Justice, J. N. Testing the geroscience hypothesis: early days. J. Gerontol. A 75, 99–101 (2020). source
plain- Asserted: passes — The authors put it forward as true.
- Checkable: fails — It may be too vague to check against evidence.
- Load-bearing: fails — The paper’s conclusions may not depend on it.
- Based: passes — The paper gives a reason why it holds.
Probably not a substantial claim. It may be too vague to check against evidence. The paper’s conclusions may not depend on it.
A conclusion the paper draws from its own results — it cites no other source for it, so there is none to check. The quote shows it is in the paper.
In the paper
“The CALERIE Trial sample does not represent the general population and treatment effects may not generalize beyond the population of healthy volunteers recruited to participate.”
§ Effect of long-term caloric restriction on DNA methylation measures of biological aging in healthy adults from the CALERIE trial > Main
hedgedconditional- Asserted: passes — The authors put it forward as true.
- Checkable: passes — It can be checked against evidence.
- Load-bearing: fails — The paper’s conclusions may not depend on it.
- Based: fails — The paper may give no reason why it holds.
Probably not a substantial claim. The paper’s conclusions may not depend on it. The paper may give no reason why it holds. It may state two separate claims as one.
In the paper
“These previous studies suggest that the CALERIE treatment effect of 2–3% slower pace of aging corresponds to a reduction in mortality risk of as much as 10–15%, similar in magnitude to the effect of smoking cessation intervention36.”
§ Effect of long-term caloric restriction on DNA methylation measures of biological aging in healthy adults from the CALERIE trial > Main
What the sources say
- Not checked — no full text of the sourcecites [36] Anthonisen, N. R. et al. The effects of a smoking cessation intervention on 14.5-year mortality: a randomized clinical trial. Ann. Intern. Med. 142, 233–239 (2005). source
hedgeddirect- Asserted: passes — The authors put it forward as true.
- Checkable: passes — It can be checked against evidence.
- Load-bearing: unclear — It is unclear whether the paper’s conclusions depend on it.
- Based: passes — The paper gives a reason why it holds.
It may state two separate claims as one.
What the paper did — it cites no source for this, so there is none to check. The quote shows it is in the paper.
In the paper
“On average, trial participants did not achieve the prescribed dose of 25% CR and some control group participants reduced their caloric intake.”
§ Effect of long-term caloric restriction on DNA methylation measures of biological aging in healthy adults from the CALERIE trial > Main
plain- Asserted: passes — The authors put it forward as true.
- Checkable: passes — It can be checked against evidence.
- Load-bearing: unclear — It is unclear whether the paper’s conclusions depend on it.
- Based: passes — The paper gives a reason why it holds.
It may state two separate claims as one.
In the paper
“The PhenoAge clock was based on analysis of nine blood chemistry markers, age and mortality data from the US National Health and Nutrition Examination Surveys (n = 9,926 participants aged 18 yr and older; 23 yr of mortality follow-up); DNAm and blood chemistry data from the Invecchiare in Chianti (InCHIANTI) Study (n = 912 participants aged 21–100 yr); and the US Health and Retirement Study (n = 3”
§ Effect of long-term caloric restriction on DNA methylation measures of biological aging in healthy adults from the CALERIE trial > Methods > DNAm clocks
What the sources say
- Not checked — no full text of the sourcecites [19] Prentice, R. L. Surrogate endpoints in clinical trials: definition and operational criteria. Stat. Med. 8, 431–440 (1989). source
plain- Asserted: passes — The authors put it forward as true.
- Checkable: passes — It can be checked against evidence.
- Load-bearing: fails — The paper’s conclusions may not depend on it.
- Based: passes — The paper gives a reason why it holds.
Probably not a substantial claim. The paper’s conclusions may not depend on it.
What the paper did — it cites no source for this, so there is none to check. The quote shows it is in the paper.
In the paper
“After baseline testing, n = 220 participants were randomly assigned at a ratio of 2:1 to a CR behavioral intervention or to an AL control group.”
§ Effect of long-term caloric restriction on DNA methylation measures of biological aging in healthy adults from the CALERIE trial > Methods > Statistics and reproducibility
plainn = 220- Asserted: passes — The authors put it forward as true.
- Checkable: passes — It can be checked against evidence.
- Load-bearing: passes — The paper’s conclusions depend on it.
- Based: passes — The paper gives a reason why it holds.
Probably not a substantial claim.
What the paper did — it cites no source for this, so there is none to check. The quote shows it is in the paper.
In the paper
“The assays of the biospecimens were conducted blind to the conditions of the trial.”
§ Effect of long-term caloric restriction on DNA methylation measures of biological aging in healthy adults from the CALERIE trial > Methods
plain- Asserted: passes — The authors put it forward as true.
- Checkable: passes — It can be checked against evidence.
- Load-bearing: fails — The paper’s conclusions may not depend on it.
- Based: passes — The paper gives a reason why it holds.
Probably not a substantial claim. The paper’s conclusions may not depend on it.
What the paper did — it cites no source for this, so there is none to check. The quote shows it is in the paper.
In the paper
“Randomization was stratified by site, sex and BMI.”
§ Effect of long-term caloric restriction on DNA methylation measures of biological aging in healthy adults from the CALERIE trial > Methods > Statistics and reproducibility
plainn = 220- Asserted: passes — The authors put it forward as true.
- Checkable: passes — It can be checked against evidence.
- Load-bearing: fails — The paper’s conclusions may not depend on it.
- Based: passes — The paper gives a reason why it holds.
Probably not a substantial claim. The paper’s conclusions may not depend on it.
What the paper did — it cites no source for this, so there is none to check. The quote shows it is in the paper.
In the paper
“To the extent possible, baseline, 12-month and 24-month samples from the same individual were processed in the same array batch and on the same BeadChip to minimize batch effects; CR treatment and AL control participants were included on all chips.”
§ Effect of long-term caloric restriction on DNA methylation measures of biological aging in healthy adults from the CALERIE trial > Methods > DNAm data
hedged- Asserted: passes — The authors put it forward as true.
- Checkable: passes — It can be checked against evidence.
- Load-bearing: passes — The paper’s conclusions depend on it.
- Based: passes — The paper gives a reason why it holds.
Probably not a substantial claim. It may state two separate claims as one.
What the paper did — it cites no source for this, so there is none to check. The quote shows it is in the paper.
In the paper
“A permuted block randomization technique was used.”
§ Effect of long-term caloric restriction on DNA methylation measures of biological aging in healthy adults from the CALERIE trial > Methods > Statistics and reproducibility
plain- Asserted: passes — The authors put it forward as true.
- Checkable: passes — It can be checked against evidence.
- Load-bearing: fails — The paper’s conclusions may not depend on it.
- Based: passes — The paper gives a reason why it holds.
Probably not a substantial claim. The paper’s conclusions may not depend on it.
What the paper did — it cites no source for this, so there is none to check. The quote shows it is in the paper.
In the paper
“The assays of the biospecimens were conducted blind to the conditions of the trial.”
§ Effect of long-term caloric restriction on DNA methylation measures of biological aging in healthy adults from the CALERIE trial > Methods > Statistics and reproducibility
plain- Asserted: passes — The authors put it forward as true.
- Checkable: passes — It can be checked against evidence.
- Load-bearing: fails — The paper’s conclusions may not depend on it.
- Based: passes — The paper gives a reason why it holds.
Probably not a substantial claim. The paper’s conclusions may not depend on it.
What the paper did — it cites no source for this, so there is none to check. The quote shows it is in the paper.
In the paper
“No statistical methods were used to predetermine sample sizes”
§ Effect of long-term caloric restriction on DNA methylation measures of biological aging in healthy adults from the CALERIE trial > Methods > Statistics and reproducibility
plain- Asserted: passes — The authors put it forward as true.
- Checkable: passes — It can be checked against evidence.
- Load-bearing: fails — The paper’s conclusions may not depend on it.
- Based: passes — The paper gives a reason why it holds.
Probably not a substantial claim. The paper’s conclusions may not depend on it.
The paper states this without a source or data behind it here, so there is nothing to check it against. The quote shows it is in the paper.
In the paper
“The clocks we analyzed were developed to predict mortality risk.”
§ Effect of long-term caloric restriction on DNA methylation measures of biological aging in healthy adults from the CALERIE trial > Methods > DNAm clocks
plain- Asserted: passes — The authors put it forward as true.
- Checkable: passes — It can be checked against evidence.
- Load-bearing: fails — The paper’s conclusions may not depend on it.
- Based: passes — The paper gives a reason why it holds.
Probably not a substantial claim. The paper’s conclusions may not depend on it.
What the paper did — it cites no source for this, so there is none to check. The quote shows it is in the paper.
In the paper
“Normality of distribution of error terms was evaluated by visual inspection of histograms of residuals and the Shapiro–Wilk test.”
§ Effect of long-term caloric restriction on DNA methylation measures of biological aging in healthy adults from the CALERIE trial > Methods > Statistics and reproducibility
plain- Asserted: passes — The authors put it forward as true.
- Checkable: passes — It can be checked against evidence.
- Load-bearing: fails — The paper’s conclusions may not depend on it.
- Based: passes — The paper gives a reason why it holds.
Probably not a substantial claim. The paper’s conclusions may not depend on it.
A claim is checked only against the cited paper’s full text, never its abstract, and none is available for its sources.
In the paper
“Equality of variances was evaluated according to the tests proposed by Brown and Forsythe68 and Markowski and Markowski69.”
§ Effect of long-term caloric restriction on DNA methylation measures of biological aging in healthy adults from the CALERIE trial > Methods > Statistics and reproducibility
What the sources say
- Not checked — no full text of the sourcecites [68] Brown, M. B. & Forsythe, A. B. Robust tests for the equality of variances. J. Am. Stat. Assoc. 69, 364–367 (1974). source
- Not checked — no full text of the sourcecites [69] Markowski, C. A. & Markowski, E. P. Conditions for the effectiveness of a preliminary test of variance. Am. Stat. 44, 322–326 (1990). source
plain- Asserted: passes — The authors put it forward as true.
- Checkable: passes — It can be checked against evidence.
- Load-bearing: fails — The paper’s conclusions may not depend on it.
- Based: passes — The paper gives a reason why it holds.
Probably not a substantial claim. The paper’s conclusions may not depend on it.
In the paper
“Normality of outcome variables was evaluated by visual inspection of distributions and the Shapiro–Wilk test67.”
§ Effect of long-term caloric restriction on DNA methylation measures of biological aging in healthy adults from the CALERIE trial > Methods > Statistics and reproducibility
What the sources say
- Not checked — no full text of the sourcecites [67] Shapiro, S. S. & Wilk, M. B. An analysis of variance test for normality (complete samples). Biometrika 52, 591–611 (1965). source
plain- Asserted: passes — The authors put it forward as true.
- Checkable: passes — It can be checked against evidence.
- Load-bearing: fails — The paper’s conclusions may not depend on it.
- Based: passes — The paper gives a reason why it holds.
Probably not a substantial claim. The paper’s conclusions may not depend on it.
In the paper
“Under conditions of nonadherence, traditional ITT analysis can result in a biased estimate of the treatment effect and an IV estimator can provide a complement66.”
§ Effect of long-term caloric restriction on DNA methylation measures of biological aging in healthy adults from the CALERIE trial > Methods > Specification of TOT regression models
What the sources say
- Not checked — no full text of the sourcecites [66] Bang, H. & Davis, C. E. On estimating treatment effects under non-compliance in randomized clinical trials: are intent-to-treat or instrumental variables analyses perfect solutions? Stat. Med. 26, 954–964 (2007). source
plaindirect- Asserted: passes — The authors put it forward as true.
- Checkable: passes — It can be checked against evidence.
- Load-bearing: passes — The paper’s conclusions depend on it.
- Based: passes — The paper gives a reason why it holds.
It may state two separate claims as one.
In the paper
“The first-generation DNAm clocks were developed from machine-learning analyses comparing samples from individuals of different chronological age.”
§ Effect of long-term caloric restriction on DNA methylation measures of biological aging in healthy adults from the CALERIE trial > Methods > DNAm clocks and pace-of-aging measures
What the sources say
- Not checked — no full text of the sourcecites [55] Horvath, S. & Raj, K. DNA methylation-based biomarkers and the epigenetic clock theory of ageing. Nat. Rev. Genet. 19, 371–384 (2018). source
plaindirect- Asserted: passes — The authors put it forward as true.
- Checkable: passes — It can be checked against evidence.
- Load-bearing: fails — The paper’s conclusions may not depend on it.
- Based: passes — The paper gives a reason why it holds.
Probably not a substantial claim. The paper’s conclusions may not depend on it.
What the paper did — it cites no source for this, so there is none to check. The quote shows it is in the paper.
In the paper
“Models used to test ITT and TOT effects were fitted with heteroskedasticity-robust standard errors.”
§ Effect of long-term caloric restriction on DNA methylation measures of biological aging in healthy adults from the CALERIE trial > Methods > Statistics and reproducibility
plain- Asserted: passes — The authors put it forward as true.
- Checkable: passes — It can be checked against evidence.
- Load-bearing: fails — The paper’s conclusions may not depend on it.
- Based: passes — The paper gives a reason why it holds.
Probably not a substantial claim. The paper’s conclusions may not depend on it.
What the paper did — it cites no source for this, so there is none to check. The quote shows it is in the paper.
In the paper
“Sensitivity analysis involving re-estimating the IV regression models omitting this final instrument did not change results.”
§ Effect of long-term caloric restriction on DNA methylation measures of biological aging in healthy adults from the CALERIE trial > Methods > Specification of TOT regression models
plain- Asserted: passes — The authors put it forward as true.
- Checkable: passes — It can be checked against evidence.
- Load-bearing: fails — The paper’s conclusions may not depend on it.
- Based: passes — The paper gives a reason why it holds.
Probably not a substantial claim. The paper’s conclusions may not depend on it.
- Rests on an assumption: The instrumental variable analysis assumes that randomization condition affects biological aging only through the CR dose (exclusion restriction) and that the instrument is valid.
What the paper did — it cites no source for this, so there is none to check. The quote shows it is in the paper.
In the paper
“Data met model assumptions.”
§ Effect of long-term caloric restriction on DNA methylation measures of biological aging in healthy adults from the CALERIE trial > Methods > Statistics and reproducibility
plain- Asserted: passes — The authors put it forward as true.
- Checkable: passes — It can be checked against evidence.
- Load-bearing: passes — The paper’s conclusions depend on it.
- Based: passes — The paper gives a reason why it holds.
Probably not a substantial claim.
The paper states this without a source or data behind it here, so there is nothing to check it against. The quote shows it is in the paper.
In the paper
“Test–retest reliability is a critical feature of measurements used to evaluate the impact of intervention because change from preintervention to postintervention cannot be distinguished from technical noise unless reliability is high.”
§ Effect of long-term caloric restriction on DNA methylation measures of biological aging in healthy adults from the CALERIE trial > Methods > DNAm clocks and pace-of-aging measures
plaindirect- Asserted: passes — The authors put it forward as true.
- Checkable: passes — It can be checked against evidence.
- Load-bearing: passes — The paper’s conclusions depend on it.
- Based: passes — The paper gives a reason why it holds.
Probably not a substantial claim.
The authors state this as an assumption.
The CALERIE intervention affected participants’ biological aging only through its effect on their caloric intake.
“IV analysis assumes that CALERIE intervention affected participants’ biological aging only through its effect on their caloric intake.”
The paper relies on this without support.
The instrumental variable analysis assumes that randomization condition affects biological aging only through the CR dose (exclusion restriction) and that the instrument is valid.
“In TOT analysis, we tested the effect of the CR intervention on aging measure change scores using IV regression implemented using a two-stage least squares approach64.”
Self-check
Percentages, sums and reported differences re-computed from the paper’s own numbers.
Each contradiction between two passages listed here was confirmed by an independent check.
Rated minor: it would not touch a result — a value no result rests on, a p-value that stays on the same side of the significance level, or a conflict that is clerical, resolved elsewhere in the paper, or outside its own findings.
In the paper
“| 25.0–27.9 kg m−2 | 38 | (55%) | 75 | (52%) |”
§ Effect of long-term caloric restriction on DNA methylation measures of biological aging in healthy adults from the CALERIE trial > Main
Reported 55 · recomputed 50.666667
Rated minor: it would not touch a result — a value no result rests on, a p-value that stays on the same side of the significance level, or a conflict that is clerical, resolved elsewhere in the paper, or outside its own findings.
In the paper
“| 22.0–24.9 kg m−2 | 37 | (54%) | 70 | (48%) |”
§ Effect of long-term caloric restriction on DNA methylation measures of biological aging in healthy adults from the CALERIE trial > Main
Reported 54 · recomputed 49.333333
Rated minor: it would not touch a result — a value no result rests on, a p-value that stays on the same side of the significance level, or a conflict that is clerical, resolved elsewhere in the paper, or outside its own findings.
In the paper
§ Effect of long-term caloric restriction on DNA methylation measures of biological aging in healthy adults from the CALERIE trial > Main
“Based on analysis of eight plasma protein markers, smoking pack years, age, sex and mortality data from the Framingham Heart Study Offspring Cohort (n = 2,356 participants aged 24–92 yr)47–49.”
§ Effect of long-term caloric restriction on DNA methylation measures of biological aging in healthy adults from the CALERIE trial > Methods > DNAm clocks
“The GrimAge clock was based on analysis of eight plasma protein markers, smoking pack years, age, sex and mortality data from the Framingham Heart Study Offspring and Gen3 Cohorts (n = 2,751 participants aged 24–92 yr)47–49.”
Rated minor: it would not touch a result — a value no result rests on, a p-value that stays on the same side of the significance level, or a conflict that is clerical, resolved elsewhere in the paper, or outside its own findings.
In the paper
§ Effect of long-term caloric restriction on DNA methylation measures of biological aging in healthy adults from the CALERIE trial > Main
“Of the n = 197 participants for whom DNAm data were available from baseline and at least one follow-up assessment, baseline to 12-month change was measured for n = 125 CR and n = 66 AL participants and baseline to 24-month change was measured for n = 117 CR and n = 68 AL participants.”
§ Effect of long-term caloric restriction on DNA methylation measures of biological aging in healthy adults from the CALERIE trial > Main
“Blood DNAm data were generated at baseline and at least one follow-up timepoint for n = 197 participants (128 CR and 69 AL). Of this analysis sample, n = 105 (82%) CR participants and n = 59 (86%) AL participants had DNAm data available from all three timepoints (baseline, 12 months and 24 months).”
Citations
Cites
An analysis of variance test for normality (complete samples)
SHAPIRO, S. S., & WILK, M. B. (1965) · Biometrika · doi:10.1093/biomet/52.3-4.591 · Cited by 23,480
Regularization and Variable Selection Via the Elastic Net
Zou, H., & Hastie, T. (2005) · Journal of the Royal Statistical Society Series B: Statistical Methodology · doi:10.1111/j.1467-9868.2005.00503.x · Cited by 20,957
López-Otín, C., Blasco, M. A., Partridge, L., Serrano, M., & Kroemer, G. (2013) · Cell · doi:10.1016/j.cell.2013.05.039 · Cited by 14,982
DNA methylation age of human tissues and cell types
Horvath, S. (2013) · Genome Biology · doi:10.1186/gb-2013-14-10-r115 · Cited by 7,075
Aryee, M. J., Jaffe, A. E., Bravo, H. C., Ladd‐Acosta, C., Feinberg, A. P., Hansen, K. D., & Irizarry, R. A. (2014) · Bioinformatics · doi:10.1093/bioinformatics/btu049 · Cited by 4,389
Genome-wide methylation profiles reveal quantitative views of human aging rates
Hannum, G., Guinney, J., Zhao, L., Zhang, L., Hughes, G., Sadda, S., Klotzle, B., Bibikova, M., Fan, J.-B., Gao, Y., et al. (2013) · Molecular Cell · doi:10.1016/j.molcel.2012.10.016 · Cited by 4,270
An epigenetic biomarker of aging for lifespan and healthspan
Levine, M. E., Lu, A. T., Quach, A., Chen, B. H., Assimes, T. L., Bandinelli, S., Hou, L., Baccarelli, A. A., Stewart, J. D., Li, Y., et al. (2018) · Aging · doi:10.18632/aging.101414 · Cited by 3,675
Self-citationOrchestrating high-throughput genomic analysis with Bioconductor
Huber, W. K., Carey, V. J., Gentleman, R. C., Anders, S., Carlson, M. R. J., Carvalho, B. S., Bravo, H. C., Davis, S. R., Gatto, L., Girke, T., et al. (2015) · Nature Methods · doi:10.1038/nmeth.3252 · Cited by 3,614
Robust Tests for the Equality of Variances
Brown, M. B., & Forsythe, A. B. (1974) · Journal of the American Statistical Association · doi:10.1080/01621459.1974.10482955 · Cited by 3,216
DNA methylation-based biomarkers and the epigenetic clock theory of ageing
Horvath, S., & Raj, K. (2018) · Nature Reviews Genetics · doi:10.1038/s41576-018-0004-3 · Cited by 3,095
Cited by
Sorted by citations
Biomarkers of aging for the identification and evaluation of longevity interventions
Moqri, M., Herzog, C., Poganik, J. R., Justice, J., Belsky, D. W., Higgins-Chen, A., Moskalev, A., Fuellen, G., Cohen, A. A., Bautmans, I., et al. (2023) · Cell · doi:10.1016/j.cell.2023.08.003 · Cited by 736
Self-citationEpigenetic ageing clocks: statistical methods and emerging computational challenges
Teschendorff, A. E., & Horvath, S. (2025) · Nature Reviews Genetics · doi:10.1038/s41576-024-00807-w · Cited by 226
Antiageing strategy for neurodegenerative diseases: from mechanisms to clinical advances
Jiang, Q., Liu, J., Huang, S., Wang, X.-Y., Chen, X., Liu, G.-H., Ye, K., Song, W., Masters, C. L., Wang, J., et al. (2025) · Signal Transduction and Targeted Therapy · doi:10.1038/s41392-025-02145-7 · Cited by 165
Stress, epigenetics, and aging: Unraveling the intricate crosstalk
Wu, Z., Qu, J. T., Zhang, W., & Liu, G. (2023) · Molecular Cell · doi:10.1016/j.molcel.2023.10.006 · Cited by 145
Bischoff-Ferrari, H. A., Gängler, S., Wieczorek, M., Belsky, D. W., Ryan, J., Kressig, R. W., Stähelin, H. B., Theiler, R., Dawson-Hughes, B., Rizzoli, R., et al. (2025) · Nature Aging · doi:10.1038/s43587-024-00793-y · Cited by 140
Self-citation
Metadata
- Authors
- Waziry, R., Ryan, C. P., Corcoran, D. L., Huffman, K. M., Kobor, M. S., Kothari, M., Graf, G. H., Kraus, V. B., Kraus, W. E., Lin, D. T. S., Pieper, C. F., Ramaker, M. E., Bhapkar, M., Das, S. K., Ferrucci, L., Hastings, W. J., Kebbe, M., Parker, D. C., Racette, S. B., Shalev, I., Schilling, B., & Belsky, D. W.
- Affiliations
- Columbia University (US)
- University of North Carolina at Chapel Hill (US)
- Duke University (US)
- University of British Columbia (CA)
- Tufts University (US)
- National Institute on Aging (US)
- Pennsylvania State University (US)
- Pennington Biomedical Research Center (US)
- Washington University in St. Louis (US)
- Buck Institute for Research on Aging (US)
- Corresponding author
- Belsky, D. W.
- ORCID
- Venue
- Nature Aging
- Published
- 2023-02-09
- Volume
- 3
- Issue
- 3
- Pages
- 248-257
- ISSN
- 2662-8465 (ISSN-L)
- PMC
- PMC10148951
- OpenAlex
- W4319946457
- Semantic Scholar
- a8afddeb0e959136e8cea575f88d34d758a07d8b
- Cited by
- 217
- References
- 88
- Citations by year
- 2026: 55 · 2025: 62 · 2024: 62 · 2023: 31
- FWCI
- 16.54
- Type
- journal article
- Language
- en
- Update notices
- correction (2023-05-09)
- Open access
- hybrid
- doi.org
- Locations
- Nature Aging (publishedVersion, cc-by)
- medRxiv (acceptedVersion, cc-by)
- PubMed Central (publishedVersion, cc-by)
- PubMed (publishedVersion)
- Carolina Digital Repository (University of North Carolina at Chapel Hill) (submittedVersion, cc-by)
- UNC Libraries
- Funders
- American Brain Foundation
- U.S. Department of Health & Human Services | NIH | National Institute on Aging (R33AG070455, P30AG028716, R01AG054840, R01AG071717, R03AG071549, U01AG060906, R01AG061378)
- Gouvernement du Canada | Canadian Institutes of Health Research (RN439810)
- Topics
- Life Sciences › Biochemistry, Genetics and Molecular Biology › Molecular Biology › Epigenetics and DNA Methylation
- Life Sciences › Biochemistry, Genetics and Molecular Biology › Aging › Genetics, Aging, and Longevity in Model Organisms
- Health Sciences › Medicine › Physiology (medical) › Dietary Effects on Health
- Keywords
- caloric restriction, biological aging, DNA methylation, epigenetic clocks, pace of aging, DunedinPACE, GrimAge clock, healthspan
- MeSH terms
- Adult, Aging, Energy Intake, Humans, Longevity, DNA Methylation, Caloric Restriction
About these checks
Registry, retraction, Cites and statistics results are computed, not judged, with one exception: a printed reference that no index lists is read once by a model before it counts as a citation error. Claims are extracted by a model and kept only when their quote appears verbatim in the text; each cited source is then checked, with a model’s help, for whether it says what the claim relies on. Those verdicts can be wrong — read the claim’s quote and the cited source before relying on one.
A language model drew the claims from the paper on 2026-11-09, under version 3 of the claim definition (model deepseek-v4.1-flash, prompt extract-v3).
A second model labelled each claim on 2026-11-09 (model jev-1.13-20260917, definition revision gold-guideline-v0.2).
Cited sources are checked with a language model’s help (gpt-6-sol).
Statistics and arithmetic are recomputed, not judged.
Confidence bands are shown only for fields calibrated on our annotated test set. None is calibrated yet, so no band is shown.
What counts as a claim ›How we measure confidence ›How we check this ›
Are you an author, or do you see a problem with this page? Request a review
