

The DOI matches its Crossref record; 157 of the 157 references it cites were found in a registry or an index; none of the 132 sources its claims cite is checked for support yet.
Drivers of diversity in human thermal perception – A review for holistic comfort models
Open accessAbstract
Understanding the drivers leading to individual differences in human thermal perception has become increasingly important, amongst other things due to challenges such as climate change and an ageing society. This review summarizes existing knowledge related to physiological, psychological, and context-related drivers of diversity in thermal perception. Furthermore, the current state of knowledge is discussed in terms of its applicability in thermal comfort models, by combining modelling approaches of the thermoneutral zone (TNZ) and adaptive thermal heat balance model (ATHB). In conclusion, the results of this review show the clear contribution of some physiological and psychological factors, such as body composition, metabolic rate, adaptation to certain thermal environments and perceived control, to differences in thermal perception. However, the role of other potential diversity-causing parameters, such as age and sex, remain uncertain. Further research is suggested, especially regarding the interaction of different diversity-driving factors with each other, both physiological and psychological, to help establishing a holistic picture.
Overview
AI snapshot
Written from the paper’s full text.
TL;DR
This review synthesizes physiological, psychological, and contextual drivers of individual differences in human thermal perception and discusses how they might be integrated into holistic comfort models. It finds clear contributions from body composition, metabolic rate, thermal adaptation, and perceived control, while evidence for age and sex remains inconclusive.
Key findings
- The review identifies body composition, metabolic rate, adaptation to thermal environments, and perceived control as important established drivers of diversity; age- and sex-related differences are described as ambiguous/inconclusive.
- Personal control showed significant effects in 7 of 9 studies; where neutral temperature effects were reported, they ranged from 0 K to 3.4 K, with a mean effect of 2.16 K (SD = 1.28), and the review later states neutral temperature differs by about 2 K between high and low personal control.
- For body composition, overweight children perceived the thermal environment as hotter, and higher BMI was associated with lower comfort temperature (−0.4°C in Southern Brazil and −0.7°C in India); frail/less healthy individuals preferred higher temperatures (1.5°C higher in winter and 0.8°C higher in summer).
- For sex, a systematic review by Wang et al. found no significant neutral-temperature differences between men and women in 9 of 11 laboratory studies and 18 of 25 field studies, although women were often reported as more sensitive to temperature fluctuations and more often dissatisfied.
Methods
- Two-stage review: stage 1 reviewed existing review papers for physiological drivers; stage 2 used rapid evidence assessments of original papers for psychological and context-related drivers, searching Science Direct and Scopus in June and July 2018 and using Parsifal for screening.
- Table 2 reports records processed: for the review of reviews, 408 identified, 290 after de-duplication, 19 included by title/abstract, and 9 after full screening; for psychological drivers, 332 identified, 207 after de-duplication, 59 included by title/abstract, and 12 after full screening; for context-related drivers, 408 identified, 290 after de-duplication, 6 included by title/abstract, and 4 after full screening.
- The modelling discussion combines the thermoneutral zone (TNZ) model by Kingma et al. with the adaptive thermal heat balance (ATHB) framework by Schweiker and Wagner, using pdfTNZ and predicted percentage of satisfied (PPS) comparisons.
Limitations
- The paper states that the review is not fully systematic, so relevant publications might have been missed; the physiological part included only existing literature reviews, and the physiological adaptation literature was predominantly focused on (sub)tropical conditions with few cold-environment examples.
- The paper states that the modelling comparison is based solely on combining TNZ and ATHB; metabolic rate was estimated by scaling predicted resting metabolic rate (0.8 MET) to the ASHRAE MET equivalent, with unknown scaling error, and body tissue insulation lacks dedicated papers on variation across subpopulations.
- The paper states that using height and weight to estimate resting metabolic rate cannot distinguish higher weight due to muscular tissue from other causes; evident from the text, psychological evidence is limited (12 studies, 9 on personal control), proposed psychological pathways remain hypotheses, some tissue-insulation values are assumed, and transient effects/alliesthesia cannot yet be replicated by heat-balance or thermophysiological models.
Model-written summary. Check it against the paper before relying on it.
Integrity signals
Registry
Cites
Statistics
Figures


Verification
Claims the paper makes
91 Not checked yet · 52 No basis given · 28 Own interpretation · 11 Own result · 6 Own method
None of the sources cited for this claim have been checked yet.
In the paper
“Five review papers have been identified that discuss the influence of age on preferred temperature or synonymous concepts such as neutral temperature or thermal comfort (Table 3) [58–62].”
§ Drivers of diversity in human thermal perception – A review for holistic comfort models > Review results > Physiological drivers of diversity in thermal perception
What the sources say
plain- Asserted: passes — The authors put it forward as true.
- Checkable: passes — It can be checked against evidence.
- Load-bearing: unclear — It is unclear whether the paper’s conclusions depend on it.
- Based: passes — The paper gives a reason why it holds.
The paper states this without a source or data behind it here, so there is nothing to check it against. The quote shows it is in the paper.
In the paper
“Overall, the results were ambiguous.”
§ Drivers of diversity in human thermal perception – A review for holistic comfort models > Review results > Physiological drivers of diversity in thermal perception
plain- Asserted: passes — The authors put it forward as true.
- Checkable: passes — It can be checked against evidence.
- Load-bearing: unclear — It is unclear whether the paper’s conclusions depend on it.
- Based: passes — The paper gives a reason why it holds.
A result the paper reports from its own data — it cites no other source for it, so there is none to check. The quote shows it is in the paper.
In the paper
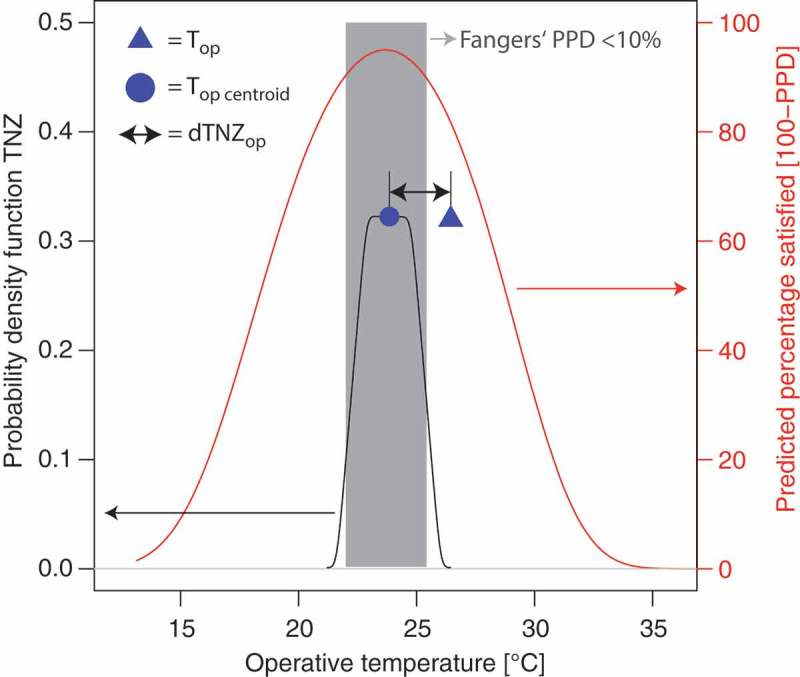
“For the same environmental conditions, Figure 3 shows a close relationship between pdfTNZ and the PPS curve – the latter based on Fangers’ PMV.”
§ Drivers of diversity in human thermal perception – A review for holistic comfort models > Methods > Modelling
plaincorrelational- Asserted: passes — The authors put it forward as true.
- Checkable: passes — It can be checked against evidence.
- Load-bearing: passes — The paper’s conclusions depend on it.
- Based: passes — The paper gives a reason why it holds.
None of the sources cited for this claim have been checked yet.
In the paper
“Several earlier physiological researches report higher body temperatures in obese individuals when compared with lean counterparts upon heat exposure and exercise [69–71].”
§ Drivers of diversity in human thermal perception – A review for holistic comfort models > Review results > Physiological drivers of diversity in thermal perception
What the sources say
plaincorrelational- Asserted: passes — The authors put it forward as true.
- Checkable: passes — It can be checked against evidence.
- Load-bearing: unclear — It is unclear whether the paper’s conclusions depend on it.
- Based: passes — The paper gives a reason why it holds.
None of the sources cited for this claim have been checked yet.
In the paper
“Out of four laboratory studies in normal-weight and overweight children, three show significant differences in thermal sensation between the two groups [70,74,77].”
§ Drivers of diversity in human thermal perception – A review for holistic comfort models > Review results > Physiological drivers of diversity in thermal perception
What the sources say
plaincorrelational- Asserted: passes — The authors put it forward as true.
- Checkable: passes — It can be checked against evidence.
- Load-bearing: passes — The paper’s conclusions depend on it.
- Based: passes — The paper gives a reason why it holds.
None of the sources cited for this claim have been checked yet.
In the paper
“Similar results were obtained by office studies in adults, showing that comfort temperature decreased with increasing BMI [78–80].”
§ Drivers of diversity in human thermal perception – A review for holistic comfort models > Review results > Physiological drivers of diversity in thermal perception
What the sources say
plaincorrelational- Asserted: passes — The authors put it forward as true.
- Checkable: passes — It can be checked against evidence.
- Load-bearing: unclear — It is unclear whether the paper’s conclusions depend on it.
- Based: passes — The paper gives a reason why it holds.
The paper states this without a source or data behind it here, so there is nothing to check it against. The quote shows it is in the paper.
In the paper
“In contrast, young children and infants preferred lower temperatures, when compared with college-aged/middle-aged populations.”
§ Drivers of diversity in human thermal perception – A review for holistic comfort models > Review results > Physiological drivers of diversity in thermal perception
plaincorrelational- Asserted: passes — The authors put it forward as true.
- Checkable: passes — It can be checked against evidence.
- Load-bearing: unclear — It is unclear whether the paper’s conclusions depend on it.
- Based: passes — The paper gives a reason why it holds.
The paper states this without a source or data behind it here, so there is nothing to check it against. The quote shows it is in the paper.
In the paper
“If a difference is reported, in all but one case, higher preferred temperatures in elderly were evident.”
§ Drivers of diversity in human thermal perception – A review for holistic comfort models > Review results > Physiological drivers of diversity in thermal perception
plaincorrelational- Asserted: passes — The authors put it forward as true.
- Checkable: passes — It can be checked against evidence.
- Load-bearing: passes — The paper’s conclusions depend on it.
- Based: passes — The paper gives a reason why it holds.
In the paper
“For neutral temperature, however, a systematic review by Wang et al. [62], presenting results from eleven laboratory and 25 field studies, found no significant differences between men and women in nine out of eleven laboratory studies and in 18 out of 25 field studies.”
§ Drivers of diversity in human thermal perception – A review for holistic comfort models > Review results > Physiological drivers of diversity in thermal perception
What the sources say
- Not checked yetcites [62] source
plain- Asserted: passes — The authors put it forward as true.
- Checkable: passes — It can be checked against evidence.
- Load-bearing: passes — The paper’s conclusions depend on it.
- Based: passes — The paper gives a reason why it holds.
The paper states this without a source or data behind it here, so there is nothing to check it against. The quote shows it is in the paper.
In the paper
“Only few of the studies mentioned in the respective reviews presented in Table 3 describe a distinct, significant difference of neutral/preferred/comfort temperature amongst different age groups.”
§ Drivers of diversity in human thermal perception – A review for holistic comfort models > Review results > Physiological drivers of diversity in thermal perception
plain- Asserted: passes — The authors put it forward as true.
- Checkable: passes — It can be checked against evidence.
- Load-bearing: passes — The paper’s conclusions depend on it.
- Based: passes — The paper gives a reason why it holds.
- Probably not a substantial claim. 55
- It may state two separate claims as one. 69
- The quote only partly states this claim. 1
A result the paper reports from its own data — it cites no other source for it, so there is none to check. The quote shows it is in the paper.
In the paper
“As there were no relevant review articles identified for psychological drivers in stage one, a rapid evidence assessment on original empirical works (as opposed to review papers) was conducted.”
§ Drivers of diversity in human thermal perception – A review for holistic comfort models > Methods > Review methods
plain- Asserted: passes — The authors put it forward as true.
- Checkable: passes — It can be checked against evidence.
- Load-bearing: passes — The paper’s conclusions depend on it.
- Based: passes — The paper gives a reason why it holds.
Probably not a substantial claim.
The paper states this without a source or data behind it here, so there is nothing to check it against. The quote shows it is in the paper.
In the paper
“For both psychological and contextual factors, existing review literature identified by the first stage of search was scarce and not sufficiently covering potential drivers of diversity, which is why in a second stage, original literature was reviewed for both factors.”
§ Drivers of diversity in human thermal perception – A review for holistic comfort models > Methods > Review methods
plaindirect- Asserted: passes — The authors put it forward as true.
- Checkable: passes — It can be checked against evidence.
- Load-bearing: passes — The paper’s conclusions depend on it.
- Based: passes — The paper gives a reason why it holds.
It may state two separate claims as one.
The paper states this without a source or data behind it here, so there is nothing to check it against. The quote shows it is in the paper.
In the paper
“The potentially diversity-driving factors that have been identified amongst these review papers include age, sex, body composition and fitness, metabolic rate, and physiological adaptation due to temperature acclimation and habituation of different climatic zones, seasonal adaptation, and circadian/diurnal rhythm.”
§ Drivers of diversity in human thermal perception – A review for holistic comfort models > Review results > Physiological drivers of diversity in thermal perception
hedgedcorrelational- Asserted: passes — The authors put it forward as true.
- Checkable: passes — It can be checked against evidence.
- Load-bearing: passes — The paper’s conclusions depend on it.
- Based: passes — The paper gives a reason why it holds.
It may state two separate claims as one.
The paper states this without a source or data behind it here, so there is nothing to check it against. The quote shows it is in the paper.
In the paper
“Nine records were retained for the review.”
§ Drivers of diversity in human thermal perception – A review for holistic comfort models > Review results > Physiological drivers of diversity in thermal perception
plain- Asserted: passes — The authors put it forward as true.
- Checkable: passes — It can be checked against evidence.
- Load-bearing: fails — The paper’s conclusions may not depend on it.
- Based: passes — The paper gives a reason why it holds.
Probably not a substantial claim. The paper’s conclusions may not depend on it. The quote only partly states this claim.
A result the paper reports from its own data — it cites no other source for it, so there is none to check. The quote shows it is in the paper.
In the paper
“Several relevant review papers for context-related drivers were identified in stage one, but additional search terms were used to focus on specific aspects of the built environment that impact thermal perception.”
§ Drivers of diversity in human thermal perception – A review for holistic comfort models > Methods > Review methods
plain- Asserted: passes — The authors put it forward as true.
- Checkable: passes — It can be checked against evidence.
- Load-bearing: fails — The paper’s conclusions may not depend on it.
- Based: passes — The paper gives a reason why it holds.
Probably not a substantial claim. The paper’s conclusions may not depend on it.
None of the sources cited for this claim have been checked yet.
In the paper
“Overweight children perceived the thermal environment as being hotter than the non-overweight group, with corresponding higher body temperatures in the overweight children.”
§ Drivers of diversity in human thermal perception – A review for holistic comfort models > Review results > Physiological drivers of diversity in thermal perception
What the sources say
plaincorrelational- Asserted: passes — The authors put it forward as true.
- Checkable: passes — It can be checked against evidence.
- Load-bearing: passes — The paper’s conclusions depend on it.
- Based: passes — The paper gives a reason why it holds.
It may state two separate claims as one.
None of the sources cited for this claim have been checked yet.
In the paper
“Also, different clothing patterns of women and men are regularly reported in field studies, with women usually exhibiting lower CLO values than men [59,67].”
§ Drivers of diversity in human thermal perception – A review for holistic comfort models > Review results > Physiological drivers of diversity in thermal perception
plaincorrelational- Asserted: passes — The authors put it forward as true.
- Checkable: passes — It can be checked against evidence.
- Load-bearing: unclear — It is unclear whether the paper’s conclusions depend on it.
- Based: passes — The paper gives a reason why it holds.
It may state two separate claims as one.
None of the sources cited for this claim have been checked yet.
In the paper
“However, other studies have shown no effect of body fat percentage on heat loss and/or body temperature, which the authors have attributed to high skin blood flow in heat and exercise [72–74].”
§ Drivers of diversity in human thermal perception – A review for holistic comfort models > Review results > Physiological drivers of diversity in thermal perception
What the sources say
plain- Asserted: passes — The authors put it forward as true.
- Checkable: passes — It can be checked against evidence.
- Load-bearing: fails — The paper’s conclusions may not depend on it.
- Based: passes — The paper gives a reason why it holds.
Probably not a substantial claim. The paper’s conclusions may not depend on it. It may state two separate claims as one.
The paper states this without a source or data behind it here, so there is nothing to check it against. The quote shows it is in the paper.
In the paper
“In general, the evidence for age-related differences of preferred temperature/comfort temperature is unclear and it is therefore difficult to draw definite conclusions from the available data.”
§ Drivers of diversity in human thermal perception – A review for holistic comfort models > Review results > Physiological drivers of diversity in thermal perception
hedged- Asserted: passes — The authors put it forward as true.
- Checkable: passes — It can be checked against evidence.
- Load-bearing: passes — The paper’s conclusions depend on it.
- Based: passes — The paper gives a reason why it holds.
It may state two separate claims as one.
None of the sources cited for this claim have been checked yet.
In the paper
“In summary, most original studies identified by the review papers presented in Table 4 report women to be more sensitive to temperature fluctuations, women to be more often dissatisfied than men, women to have smaller comfort zones and to be more often uncomfortably hot or cold than men [59–61,67].”
§ Drivers of diversity in human thermal perception – A review for holistic comfort models > Review results > Physiological drivers of diversity in thermal perception
What the sources say
plaincorrelational- Asserted: passes — The authors put it forward as true.
- Checkable: passes — It can be checked against evidence.
- Load-bearing: passes — The paper’s conclusions depend on it.
- Based: passes — The paper gives a reason why it holds.
It may state two separate claims as one.
In the paper
“Regarding the effect of metabolic rate on subjective perception, Luo et al. [82] report two studies showing that level of activity influences preferred ambient temperature: the more active an individual is, the lower is the preferred temperature.”
§ Drivers of diversity in human thermal perception – A review for holistic comfort models > Review results > Physiological drivers of diversity in thermal perception
What the sources say
- Not checked yetcites [82] source
plaindirect- Asserted: passes — The authors put it forward as true.
- Checkable: passes — It can be checked against evidence.
- Load-bearing: unclear — It is unclear whether the paper’s conclusions depend on it.
- Based: passes — The paper gives a reason why it holds.
It may state two separate claims as one.
The paper states this without a source or data behind it here, so there is nothing to check it against. The quote shows it is in the paper.
In the paper
“Seven out of nine studies found a significant effect of personal control, three of which took place in the field as opposed to a lab setting.”
§ Drivers of diversity in human thermal perception – A review for holistic comfort models > Review results > Psychological drivers of diversity
plaincorrelational- Asserted: passes — The authors put it forward as true.
- Checkable: passes — It can be checked against evidence.
- Load-bearing: passes — The paper’s conclusions depend on it.
- Based: passes — The paper gives a reason why it holds.
It may state two separate claims as one.
A result the paper reports from its own data — it cites no other source for it, so there is none to check. The quote shows it is in the paper.
In the paper
“When considering those five studies that reported an effect of personal control on the thermal neutral temperature, the effect was between 0 K4 and 3.4 K. The mean effect was 2.16 K (SD = 1.28).”
§ Drivers of diversity in human thermal perception – A review for holistic comfort models > Review results > Psychological drivers of diversity
plaindirect- Asserted: passes — The authors put it forward as true.
- Checkable: passes — It can be checked against evidence.
- Load-bearing: unclear — It is unclear whether the paper’s conclusions depend on it.
- Based: passes — The paper gives a reason why it holds.
It may state two separate claims as one.
In the paper
“A general overview of literature on thermal perception under heterogeneous (non-uniform) and dynamic indoor conditions is provided by Mishra et al. [104] showing that in general, the indoor environment can be variable and acceptable at the same time.”
§ Drivers of diversity in human thermal perception – A review for holistic comfort models > Review results > Contextual drivers of diversity
What the sources say
- Not checked yetcites [104] source
plain- Asserted: passes — The authors put it forward as true.
- Checkable: passes — It can be checked against evidence.
- Load-bearing: fails — The paper’s conclusions may not depend on it.
- Based: passes — The paper gives a reason why it holds.
Probably not a substantial claim. The paper’s conclusions may not depend on it.
None of the sources cited for this claim have been checked yet.
In the paper
“It is important to note that the cited studies often exchange the terms thermal comfort and thermal sensation and, repeatedly, treat them as synonyms.”
§ Drivers of diversity in human thermal perception – A review for holistic comfort models > Review results > Contextual drivers of diversity
plain- Asserted: passes — The authors put it forward as true.
- Checkable: passes — It can be checked against evidence.
- Load-bearing: fails — The paper’s conclusions may not depend on it.
- Based: passes — The paper gives a reason why it holds.
Probably not a substantial claim. The paper’s conclusions may not depend on it.
In the paper
“Data obtained from laboratory studies showed that thermal sensation was affected significantly by the trait extraversion, and thermal preference was affected by neuroticism, openness and specSE.”
§ Drivers of diversity in human thermal perception – A review for holistic comfort models > Review results > Psychological drivers of diversity
What the sources say
- Not checked yetcites [49] source
plaindirect- Asserted: passes — The authors put it forward as true.
- Checkable: passes — It can be checked against evidence.
- Load-bearing: passes — The paper’s conclusions depend on it.
- Based: passes — The paper gives a reason why it holds.
It may state two separate claims as one.
In the paper
“Regarding the effect of physical fitness on temperature perception, a field study in hospitals showed that higher perceived fitness was associated with significantly lower preferred temperatures, and the other way round, people who reported feeling frail and less vigorous preferred warmer environments [81].”
§ Drivers of diversity in human thermal perception – A review for holistic comfort models > Review results > Physiological drivers of diversity in thermal perception
What the sources say
- Not checked yetcites [81] source
plaincorrelational- Asserted: passes — The authors put it forward as true.
- Checkable: passes — It can be checked against evidence.
- Load-bearing: unclear — It is unclear whether the paper’s conclusions depend on it.
- Based: passes — The paper gives a reason why it holds.
It may state two separate claims as one.
The paper states this without a source or data behind it here, so there is nothing to check it against. The quote shows it is in the paper.
In the paper
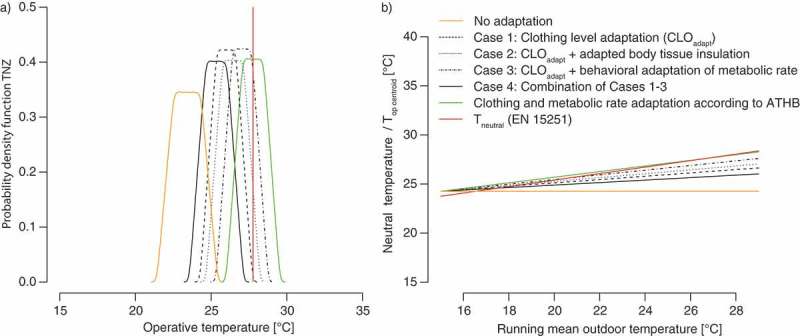
“The approach by Schweiker et al. can also be applied to the TNZ model by adjusting clothing insulation level and metabolic rate based on the running mean outdoor temperature (Trm). Consequently, the pdfTNZ is shifted towards higher operative temperatures (Figure 5a green line) and the Top centroid (Figure 5b green line) shows the same trend as the neutral temperature calculated according to EN 152”
§ Drivers of diversity in human thermal perception – A review for holistic comfort models > Discussion of diversity drivers with respect to the prediction of thermal perception > Physiological differences
plaindirect- Asserted: passes — The authors put it forward as true.
- Checkable: passes — It can be checked against evidence.
- Load-bearing: unclear — It is unclear whether the paper’s conclusions depend on it.
- Based: passes — The paper gives a reason why it holds.
It may state two separate claims as one.
The paper states this without a source or data behind it here, so there is nothing to check it against. The quote shows it is in the paper.
In the paper
“It has been established based on the existing literature that habituation of different climatic zones, as well as seasonal changes of the thermal environment, induce physiological adaptation, which is also accompanied by subjective adaptation of thermal perception.”
§ Drivers of diversity in human thermal perception – A review for holistic comfort models > Discussion of diversity drivers with respect to the prediction of thermal perception > Physiological differences
boosteddirect- Asserted: passes — The authors put it forward as true.
- Checkable: passes — It can be checked against evidence.
- Load-bearing: fails — The paper’s conclusions may not depend on it.
- Based: fails — The paper may give no reason why it holds.
Probably not a substantial claim. The paper’s conclusions may not depend on it. The paper may give no reason why it holds. It may state two separate claims as one.
None of the sources cited for this claim have been checked yet.
In the paper
“The literature review has shown ambiguous results for age- and sex-related differences, but a clear trend for body composition (weight and BMI) and metabolic rate.”
§ Drivers of diversity in human thermal perception – A review for holistic comfort models > Discussion of diversity drivers with respect to the prediction of thermal perception > Physiological differences
boostedcorrelational- Asserted: passes — The authors put it forward as true.
- Checkable: passes — It can be checked against evidence.
- Load-bearing: passes — The paper’s conclusions depend on it.
- Based: passes — The paper gives a reason why it holds.
It may state two separate claims as one.
The paper states this without a source or data behind it here, so there is nothing to check it against. The quote shows it is in the paper.
In the paper
“The review on psychological drivers describes personal control as one othe most investigated psychological driver with clear effects on thermal perception.”
§ Drivers of diversity in human thermal perception – A review for holistic comfort models > Discussion of diversity drivers with respect to the prediction of thermal perception > Differences due to psychological drivers of diversity
boosteddirect- Asserted: passes — The authors put it forward as true.
- Checkable: passes — It can be checked against evidence.
- Load-bearing: fails — The paper’s conclusions may not depend on it.
- Based: fails — The paper may give no reason why it holds.
Probably not a substantial claim. The paper’s conclusions may not depend on it. The paper may give no reason why it holds. It may state two separate claims as one.
In the paper
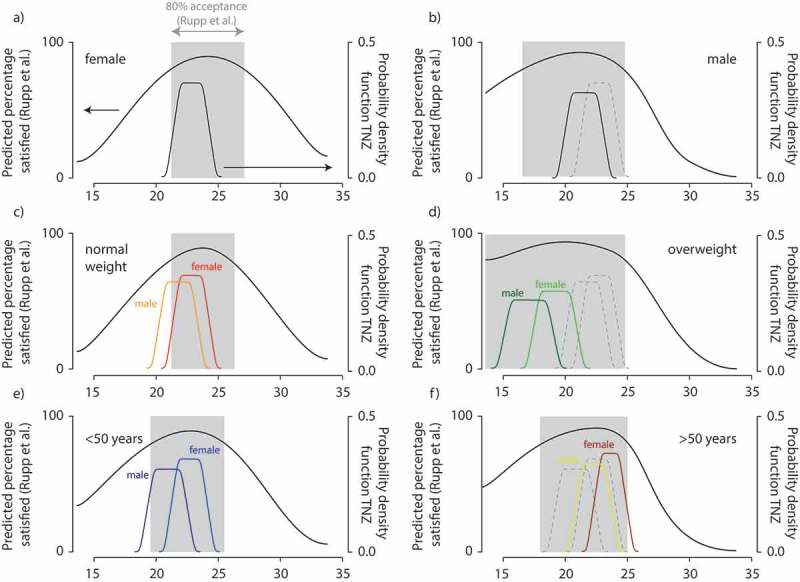
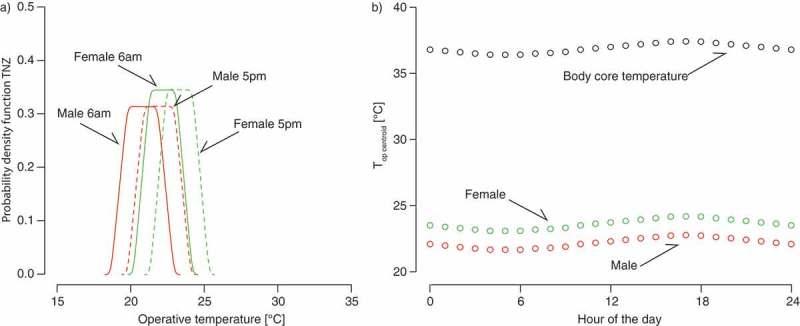
“For instance, the pdfTNZ for males is shifted to the cold side compared to that for females in a similar way like the PPS curve shifts and the pdfTNZ for males has a wider plateau while the shaded area of 80%-acceptance from Rupp et al. is also wider for males.”
§ Drivers of diversity in human thermal perception – A review for holistic comfort models > Discussion of diversity drivers with respect to the prediction of thermal perception > Physiological differences
What the sources say
- Not checked yetcites [80] source
plaincorrelational- Asserted: passes — The authors put it forward as true.
- Checkable: passes — It can be checked against evidence.
- Load-bearing: unclear — It is unclear whether the paper’s conclusions depend on it.
- Based: passes — The paper gives a reason why it holds.
It may state two separate claims as one.
The paper states this without a source or data behind it here, so there is nothing to check it against. The quote shows it is in the paper.
In the paper
“However, these studies do not discuss potential pathways or mechanisms how perceived control may affect thermal perception.”
§ Drivers of diversity in human thermal perception – A review for holistic comfort models > Discussion of diversity drivers with respect to the prediction of thermal perception > Differences due to psychological drivers of diversity
plain- Asserted: passes — The authors put it forward as true.
- Checkable: passes — It can be checked against evidence.
- Load-bearing: passes — The paper’s conclusions depend on it.
- Based: passes — The paper gives a reason why it holds.
Probably not a substantial claim.
The paper states this without a source or data behind it here, so there is nothing to check it against. The quote shows it is in the paper.
In the paper
“The topic of control, here the effect of control on indoor environmental conditions, and clothing adaptation, which are both drivers of diversity between individuals, are well known and replicable by means of existing thermal comfort models.”
§ Drivers of diversity in human thermal perception – A review for holistic comfort models > Discussion of diversity drivers with respect to the prediction of thermal perception > Context-related differences
boosteddirect- Asserted: passes — The authors put it forward as true.
- Checkable: passes — It can be checked against evidence.
- Load-bearing: fails — The paper’s conclusions may not depend on it.
- Based: passes — The paper gives a reason why it holds.
Probably not a substantial claim. The paper’s conclusions may not depend on it.
The paper states this without a source or data behind it here, so there is nothing to check it against. The quote shows it is in the paper.
In the paper
“The review on contextual drivers showed that local effects and radiant asymmetries do affect thermal perception of individual body parts and can affect the overall sensation.”
§ Drivers of diversity in human thermal perception – A review for holistic comfort models > Discussion of diversity drivers with respect to the prediction of thermal perception > Context-related differences
plaindirect- Asserted: passes — The authors put it forward as true.
- Checkable: passes — It can be checked against evidence.
- Load-bearing: passes — The paper’s conclusions depend on it.
- Based: unclear — It is unclear why the paper says it holds.
It may state two separate claims as one.
The paper states this without a source or data behind it here, so there is nothing to check it against. The quote shows it is in the paper.
In the paper
“This review confirms that many different variables have been taken into consideration to explain the vast diversity of thermal perception among humans, as exemplarily demonstrated in Figure 1.”
§ Drivers of diversity in human thermal perception – A review for holistic comfort models > General discussion and conclusions
boostedcorrelational- Asserted: passes — The authors put it forward as true.
- Checkable: passes — It can be checked against evidence.
- Load-bearing: passes — The paper’s conclusions depend on it.
- Based: passes — The paper gives a reason why it holds.
Probably not a substantial claim.
The paper states this without a source or data behind it here, so there is nothing to check it against. The quote shows it is in the paper.
In the paper
“For example, the existing review publications regarding physiological adaptation and thermal perception was predominantly focused on (sub)tropical conditions but lacked examples for cold environments.”
§ Drivers of diversity in human thermal perception – A review for holistic comfort models > General discussion and conclusions > Limitations
plain- Asserted: passes — The authors put it forward as true.
- Checkable: passes — It can be checked against evidence.
- Load-bearing: fails — The paper’s conclusions may not depend on it.
- Based: passes — The paper gives a reason why it holds.
Probably not a substantial claim. The paper’s conclusions may not depend on it. It may state two separate claims as one.
The paper states this without a source or data behind it here, so there is nothing to check it against. The quote shows it is in the paper.
In the paper
“With respect to physiological adaptation, modelling the adaptation of metabolic rate and body tissue insulation can replicate the observations of field studies.”
§ Drivers of diversity in human thermal perception – A review for holistic comfort models > General discussion and conclusions > Demographic and physiological drivers of diversity
plaindirect- Asserted: passes — The authors put it forward as true.
- Checkable: passes — It can be checked against evidence.
- Load-bearing: fails — The paper’s conclusions may not depend on it.
- Based: fails — The paper may give no reason why it holds.
Probably not a substantial claim. The paper’s conclusions may not depend on it. The paper may give no reason why it holds.
The paper states this without a source or data behind it here, so there is nothing to check it against. The quote shows it is in the paper.
In the paper
“In conclusion, there is a huge variety of potential drivers of diversity and much more research is required to understand better the underlying mechanism of diversity.”
§ Drivers of diversity in human thermal perception – A review for holistic comfort models > General discussion and conclusions > Conclusions
plain- Asserted: passes — The authors put it forward as true.
- Checkable: fails — It may be too vague to check against evidence.
- Load-bearing: passes — The paper’s conclusions depend on it.
- Based: fails — The paper may give no reason why it holds.
Probably not a substantial claim. It may be too vague to check against evidence. The paper may give no reason why it holds.
The paper states this without a source or data behind it here, so there is nothing to check it against. The quote shows it is in the paper.
In the paper
“In our review, we show that body composition, metabolic rate, adaptation to certain thermal environments, and personal control can be considered as important previously-established drivers of diversity.”
§ Drivers of diversity in human thermal perception – A review for holistic comfort models > General discussion and conclusions
plaincorrelational- Asserted: passes — The authors put it forward as true.
- Checkable: passes — It can be checked against evidence.
- Load-bearing: passes — The paper’s conclusions depend on it.
- Based: passes — The paper gives a reason why it holds.
It may state two separate claims as one.
The paper states this without a source or data behind it here, so there is nothing to check it against. The quote shows it is in the paper.
In the paper
“As shown above, both pathways can replicate the effects of psychological drivers found in the literature.”
§ Drivers of diversity in human thermal perception – A review for holistic comfort models > Discussion of diversity drivers with respect to the prediction of thermal perception > Differences due to psychological drivers of diversity
plaindirect- Asserted: passes — The authors put it forward as true.
- Checkable: passes — It can be checked against evidence.
- Load-bearing: fails — The paper’s conclusions may not depend on it.
- Based: fails — The paper may give no reason why it holds.
Probably not a substantial claim. The paper’s conclusions may not depend on it. The paper may give no reason why it holds. It may state two separate claims as one.
The paper states this without a source or data behind it here, so there is nothing to check it against. The quote shows it is in the paper.
In the paper
“While psychological variability can be replicated by adjusting the metabolic rate or by a shift in the interpretation of the physiological signal, much more research is needed to fully understand what the drivers of psychological variability are and how they exert an influence.”
§ Drivers of diversity in human thermal perception – A review for holistic comfort models > General discussion and conclusions > Psychological drivers of diversity
plaindirect- Asserted: passes — The authors put it forward as true.
- Checkable: fails — It may be too vague to check against evidence.
- Load-bearing: passes — The paper’s conclusions depend on it.
- Based: passes — The paper gives a reason why it holds.
Probably not a substantial claim. It may be too vague to check against evidence. It may state two separate claims as one.
A result the paper reports from its own data — it cites no other source for it, so there is none to check. The quote shows it is in the paper.
In the paper
“However, a review of the relationship between perceived control, stress, and metabolic rate was beyond the scope of this review and initial searches did not reveal any paper measuring the metabolic rate under different thermal and psychological stressors.”
§ Drivers of diversity in human thermal perception – A review for holistic comfort models > Discussion of diversity drivers with respect to the prediction of thermal perception > Differences due to psychological drivers of diversity
plain- Asserted: passes — The authors put it forward as true.
- Checkable: passes — It can be checked against evidence.
- Load-bearing: fails — The paper’s conclusions may not depend on it.
- Based: passes — The paper gives a reason why it holds.
Probably not a substantial claim. The paper’s conclusions may not depend on it. It may state two separate claims as one.
The paper states this without a source or data behind it here, so there is nothing to check it against. The quote shows it is in the paper.
In the paper
“This review has shown that body composition co-determines people’s perception of the thermal environment; people with overweight have been shown to prefer cooler environments.”
§ Drivers of diversity in human thermal perception – A review for holistic comfort models > General discussion and conclusions > Holistic perspectives
boostedcorrelational- Asserted: passes — The authors put it forward as true.
- Checkable: passes — It can be checked against evidence.
- Load-bearing: passes — The paper’s conclusions depend on it.
- Based: unclear — It is unclear why the paper says it holds.
It may state two separate claims as one.
The paper states this without a source or data behind it here, so there is nothing to check it against. The quote shows it is in the paper.
In the paper
“In addition, those ramps found to be perceived and not explainable by a steady-state approach, i.e. ramps with a change >2 K/h, are beyond temperature ramps found in buildings in reality, which are below 1 K/h due to existing thermal mass.”
§ Drivers of diversity in human thermal perception – A review for holistic comfort models > Discussion of diversity drivers with respect to the prediction of thermal perception > Context-related differences
plaindirect- Asserted: passes — The authors put it forward as true.
- Checkable: passes — It can be checked against evidence.
- Load-bearing: fails — The paper’s conclusions may not depend on it.
- Based: fails — The paper may give no reason why it holds.
Probably not a substantial claim. The paper’s conclusions may not depend on it. The paper may give no reason why it holds. It may state two separate claims as one.
A result the paper reports from its own data — it cites no other source for it, so there is none to check. The quote shows it is in the paper.
In the paper
“Using the pdfTNZ approach, we show that theoretically, there is an overlap of neutral temperatures for males and females, but towards the fringes of the probability density function, this overlap gradually disappears.”
§ Drivers of diversity in human thermal perception – A review for holistic comfort models > General discussion and conclusions > Demographic and physiological drivers of diversity
boostedcorrelational- Asserted: passes — The authors put it forward as true.
- Checkable: passes — It can be checked against evidence.
- Load-bearing: passes — The paper’s conclusions depend on it.
- Based: passes — The paper gives a reason why it holds.
It may state two separate claims as one.
The paper states this without a source or data behind it here, so there is nothing to check it against. The quote shows it is in the paper.
In the paper
“The effect of temperature gradients is ambiguous and not related to gradients naturally occurring in buildings.”
§ Drivers of diversity in human thermal perception – A review for holistic comfort models > General discussion and conclusions
plain- Asserted: passes — The authors put it forward as true.
- Checkable: passes — It can be checked against evidence.
- Load-bearing: unclear — It is unclear whether the paper’s conclusions depend on it.
- Based: unclear — It is unclear why the paper says it holds.
It may state two separate claims as one.
The paper states this without a source or data behind it here, so there is nothing to check it against. The quote shows it is in the paper.
In the paper
“The overlap shifts to different temperatures and/or decreases in magnitude with a change of body composition and also with age.”
§ Drivers of diversity in human thermal perception – A review for holistic comfort models > General discussion and conclusions > Demographic and physiological drivers of diversity
plaindirect- Asserted: passes — The authors put it forward as true.
- Checkable: passes — It can be checked against evidence.
- Load-bearing: passes — The paper’s conclusions depend on it.
- Based: passes — The paper gives a reason why it holds.
It may state two separate claims as one.
In the paper
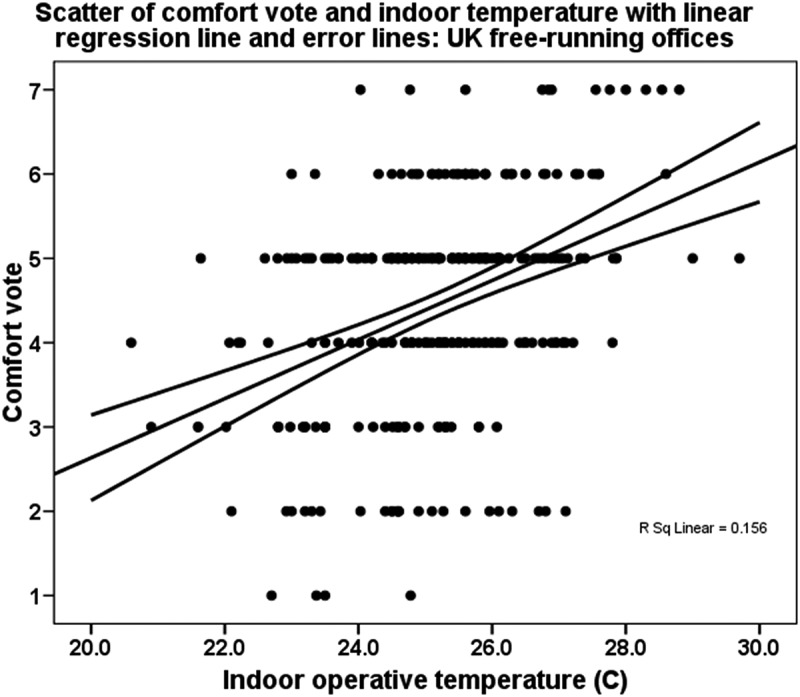
“The data presented uncovers the diversity of thermal perception: on the one hand, people are feeling comfortable (4 on y-axis) between 20°C and 28°C. On the other hand, in the range between 22°C and 28°C votes between ‘much too warm’ (7 on y-axis) and ‘much too cool’ (1 on y-axis) can be found for any given temperature.”
§ Drivers of diversity in human thermal perception – A review for holistic comfort models > Introduction > Individual differences
What the sources say
- Not checked yetcites [1] source
plain- Asserted: passes — The authors put it forward as true.
- Checkable: passes — It can be checked against evidence.
- Load-bearing: passes — The paper’s conclusions depend on it.
- Based: passes — The paper gives a reason why it holds.
It may state two separate claims as one.
The paper states this without a source or data behind it here, so there is nothing to check it against. The quote shows it is in the paper.
In the paper
“In contrast, the adjusted heat balance models try to capture effects of thermal adaptation. However, the majority is based on the PMV approach, which – due to its partly empirical nature – does not offer a straightforward solution to include individual differences in physiological characteristics.”
§ Drivers of diversity in human thermal perception – A review for holistic comfort models > Introduction > Modelling approaches
plaindirect- Asserted: passes — The authors put it forward as true.
- Checkable: passes — It can be checked against evidence.
- Load-bearing: passes — The paper’s conclusions depend on it.
- Based: passes — The paper gives a reason why it holds.
It may state two separate claims as one.
The paper states this without a source or data behind it here, so there is nothing to check it against. The quote shows it is in the paper.
In the paper
“it is now understood and accepted that people’s thermal perception is diverse (either due to physiological differences or through their lifestyle/behavior).”
§ Drivers of diversity in human thermal perception – A review for holistic comfort models > Objectives, scope and definitions > Objectives
boosteddirect- Asserted: passes — The authors put it forward as true.
- Checkable: fails — It may be too vague to check against evidence.
- Load-bearing: passes — The paper’s conclusions depend on it.
- Based: fails — The paper may give no reason why it holds.
Probably not a substantial claim. It may be too vague to check against evidence. The paper may give no reason why it holds.
In the paper
“Secondly, in the EU-28, the proportion of adults (aged 18 years and over) who were considered to be overweight is steadily rising and was estimated in 2014 to be approximately 51.6%, whereof 15.9% were obese (BMI >30 kg/m2) [40].”
§ Drivers of diversity in human thermal perception – A review for holistic comfort models > Introduction > Global and local challenges related to thermal perception
What the sources say
- Not checked yetcites [40] European Commission. European health interview survey (EHIS): overweight and obesity – BMI statistics. 2017.
hedged- Asserted: passes — The authors put it forward as true.
- Checkable: passes — It can be checked against evidence.
- Load-bearing: fails — The paper’s conclusions may not depend on it.
- Based: passes — The paper gives a reason why it holds.
Probably not a substantial claim. The paper’s conclusions may not depend on it. It may state two separate claims as one.
In the paper
“Firstly, the population in many European countries is ageing; predictions for the EU-28 indicate that the share of the elderly in the total population will increase from 19.2% at the start of 2016 to 29.1% by 2080, corresponding to more than 50 million people [39].”
§ Drivers of diversity in human thermal perception – A review for holistic comfort models > Introduction > Global and local challenges related to thermal perception
What the sources say
- Not checked yetcites [39] Eurostat. People in the EU – population projections. 2018 [cited 2018 Jul 26]. Available from: http://ec.europa.eu/eurostat/statistics-explained/index.php?title=People_in_the_EU_-_population_projections.
hedged- Asserted: passes — The authors put it forward as true.
- Checkable: passes — It can be checked against evidence.
- Load-bearing: passes — The paper’s conclusions depend on it.
- Based: passes — The paper gives a reason why it holds.
It may state two separate claims as one.
The paper states this without a source or data behind it here, so there is nothing to check it against. The quote shows it is in the paper.
In the paper
“However, as outlined in the next section of this introduction, existing thermal comfort models do not (fully) capture the diversity observed.”
- Also stated in: § Modelling approaches · plain
“Despite their variety and in parts complexity, neither of these approaches is able to capture the observed individual differences.”
- Also stated in: § Objectives · plain
“However (2), up until now, existing models predicting thermal perception do not capture such adaptive processes and individual or subpopulation differences holistically.”
§ Drivers of diversity in human thermal perception – A review for holistic comfort models > Introduction > Individual differences
plain- Asserted: passes — The authors put it forward as true.
- Checkable: passes — It can be checked against evidence.
- Load-bearing: passes — The paper’s conclusions depend on it.
- Based: passes — The paper gives a reason why it holds.
It may state two separate claims as one.
- Also stated in: § Modelling approaches · plain
None of the sources cited for this claim have been checked yet.
In the paper
“At the same time, research has shown that people accept much broader thermal conditions than anticipated by above standards [1,3,14,47], andtheir perception of thermal conditions is much more dynamic [48–51].”
§ Drivers of diversity in human thermal perception – A review for holistic comfort models > Objectives, scope and definitions > Scope and definitions
What the sources say
boosted- Asserted: passes — The authors put it forward as true.
- Checkable: passes — It can be checked against evidence.
- Load-bearing: passes — The paper’s conclusions depend on it.
- Based: passes — The paper gives a reason why it holds.
It may state two separate claims as one.
None of the sources cited for this claim have been checked yet.
In the paper
“Around the comfort temperature determined at a particular day, for 80% occupancy acceptability, a comfort zone width of ±3.5 K [41], or ±3.0 K is allowed [43].”
§ Drivers of diversity in human thermal perception – A review for holistic comfort models > Objectives, scope and definitions > Scope and definitions
What the sources say
- Not checked yetcites [41] ASHRAE. Standard 55-2013. Thermal environmental conditions for human occupancy. Am. Soc. Heating, Refrig. Air-Conditioning Eng. Atlanta, USA. 2013;
- Not checked yetcites [43] CEN 15251. Indoor environmental input parameters for design and assessment of energy performance of buildings addressing indoor air quality, thermal environment, lighting and acoustics; German version EN 15251:2012. 2012.
plain- Asserted: passes — The authors put it forward as true.
- Checkable: passes — It can be checked against evidence.
- Load-bearing: fails — The paper’s conclusions may not depend on it.
- Based: passes — The paper gives a reason why it holds.
Probably not a substantial claim. The paper’s conclusions may not depend on it. It may state two separate claims as one.
None of the sources cited for this claim have been checked yet.
In the paper
“Climate change predicts increased average and maximum temperatures in summer and a higher frequency and severity of heat waves [29,30], but also higher precipitation rates, rising sea levels due to melting snow and ice, and warmer oceans.”
§ Drivers of diversity in human thermal perception – A review for holistic comfort models > Introduction > Global and local challenges related to thermal perception
plaindirect- Asserted: passes — The authors put it forward as true.
- Checkable: passes — It can be checked against evidence.
- Load-bearing: fails — The paper’s conclusions may not depend on it.
- Based: passes — The paper gives a reason why it holds.
Probably not a substantial claim. The paper’s conclusions may not depend on it. It may state two separate claims as one.
None of the sources cited for this claim have been checked yet.
In the paper
“It is broadly established that heat waves and cold spells are associated with thermal discomfort, decreased physical and cognitive performance [36], and increased mortality [37].”
§ Drivers of diversity in human thermal perception – A review for holistic comfort models > Introduction > Global and local challenges related to thermal perception
boostedcorrelational- Asserted: passes — The authors put it forward as true.
- Checkable: passes — It can be checked against evidence.
- Load-bearing: fails — The paper’s conclusions may not depend on it.
- Based: passes — The paper gives a reason why it holds.
Probably not a substantial claim. The paper’s conclusions may not depend on it. It may state two separate claims as one.
In the paper
“While this does not make thermal comfort synonymous to health or productivity per se [38], the constructs are aligned in the way that thermally comfortable conditions are associated with minimal thermoregulatory effort for the body.”
§ Drivers of diversity in human thermal perception – A review for holistic comfort models > Introduction > Global and local challenges related to thermal perception
What the sources say
- Not checked yetcites [38] source
plaincorrelational- Asserted: passes — The authors put it forward as true.
- Checkable: passes — It can be checked against evidence.
- Load-bearing: fails — The paper’s conclusions may not depend on it.
- Based: passes — The paper gives a reason why it holds.
Probably not a substantial claim. The paper’s conclusions may not depend on it.
In the paper
“Predictions forecast that climate change will increase the need for cooling in summer and decrease the heating demand in winter, with total energy use predicted to rise if no countermeasures are implemented [32].”
§ Drivers of diversity in human thermal perception – A review for holistic comfort models > Introduction > Global and local challenges related to thermal perception
What the sources say
- Not checked yetcites [32] Aebischer B, 2007, Proc Eceee
plaindirect- Asserted: passes — The authors put it forward as true.
- Checkable: passes — It can be checked against evidence.
- Load-bearing: fails — The paper’s conclusions may not depend on it.
- Based: passes — The paper gives a reason why it holds.
Probably not a substantial claim. The paper’s conclusions may not depend on it. It may state two separate claims as one.
In the paper
“While these seven variables are able to explain part of the variance seen e.g. in Figure 1 by Nicol et al. [1], which is based on operative temperature only, there remains a high variance even when all six variables are considered.”
§ Drivers of diversity in human thermal perception – A review for holistic comfort models > Objectives, scope and definitions > Scope and definitions
What the sources say
- Not checked yetcites [1] source
plaincorrelational- Asserted: passes — The authors put it forward as true.
- Checkable: passes — It can be checked against evidence.
- Load-bearing: passes — The paper’s conclusions depend on it.
- Based: passes — The paper gives a reason why it holds.
It may state two separate claims as one.
In the paper
“In theory, this might lead to a higher preferred temperature of the elderly, however, from his analysis he concluded that age did not have an influence on preferred ambient temperature.”
§ Drivers of diversity in human thermal perception – A review for holistic comfort models > Review results > Physiological drivers of diversity in thermal perception
What the sources say
- Not checked yetcites [58] Fanger PO, 1973, Br J Ind Med
plain- Asserted: passes — The authors put it forward as true.
- Checkable: passes — It can be checked against evidence.
- Load-bearing: fails — The paper’s conclusions may not depend on it.
- Based: passes — The paper gives a reason why it holds.
Probably not a substantial claim. The paper’s conclusions may not depend on it.
A conclusion the paper draws from its own results — it cites no other source for it, so there is none to check. The quote shows it is in the paper.
In the paper
“At the same time, the TNZ model is still a rather simple model compared to more complex thermoregulative models, so that the implementation of adaptive mechanisms could be done straightforward.”
§ Drivers of diversity in human thermal perception – A review for holistic comfort models > Methods > Modelling
hedgedconditional- Asserted: passes — The authors put it forward as true.
- Checkable: passes — It can be checked against evidence.
- Load-bearing: passes — The paper’s conclusions depend on it.
- Based: fails — The paper may give no reason why it holds.
Probably not a substantial claim. The paper may give no reason why it holds. It may state two separate claims as one.
A conclusion the paper draws from its own results — it cites no other source for it, so there is none to check. The quote shows it is in the paper.
In the paper
“Such results imply that the TNZ model can be applied also in the context of thermal satisfaction or thermal comfort.”
§ Drivers of diversity in human thermal perception – A review for holistic comfort models > Methods > Modelling
plain- Asserted: passes — The authors put it forward as true.
- Checkable: passes — It can be checked against evidence.
- Load-bearing: passes — The paper’s conclusions depend on it.
- Based: passes — The paper gives a reason why it holds.
Probably not a substantial claim.
- The authors state this as an assumption: The internal heat balance is dependent on heat production, body tissue insulation, body core, and skin temperatures.
- The authors state this as an assumption: The external heat balance is dependent on heat production, clothing insulation, air speed, skin wettedness, relative humidity, skin and operative temperatures.
- The authors state this as an assumption: Physiologically feasible solutions are defined where body core temperature is within a specific range (e.g. 36.5°C to 37.5°C), and body tissue insulation is constrained to what is within thermoregulatory bounds.
The paper states this without a source or data behind it here, so there is nothing to check it against. The quote shows it is in the paper.
In the paper
“This physical condition of an individual’s body is determined by demographic factors, which are a given, such as sex and age, and a number of physiological variables such as body composition, adaptation state, and level of fitness, which might change over time or according to the situation.”
§ Drivers of diversity in human thermal perception – A review for holistic comfort models > Review results > Physiological drivers of diversity in thermal perception
plaindirect- Asserted: passes — The authors put it forward as true.
- Checkable: passes — It can be checked against evidence.
- Load-bearing: passes — The paper’s conclusions depend on it.
- Based: passes — The paper gives a reason why it holds.
Probably not a substantial claim.
A conclusion the paper draws from its own results — it cites no other source for it, so there is none to check. The quote shows it is in the paper.
In the paper
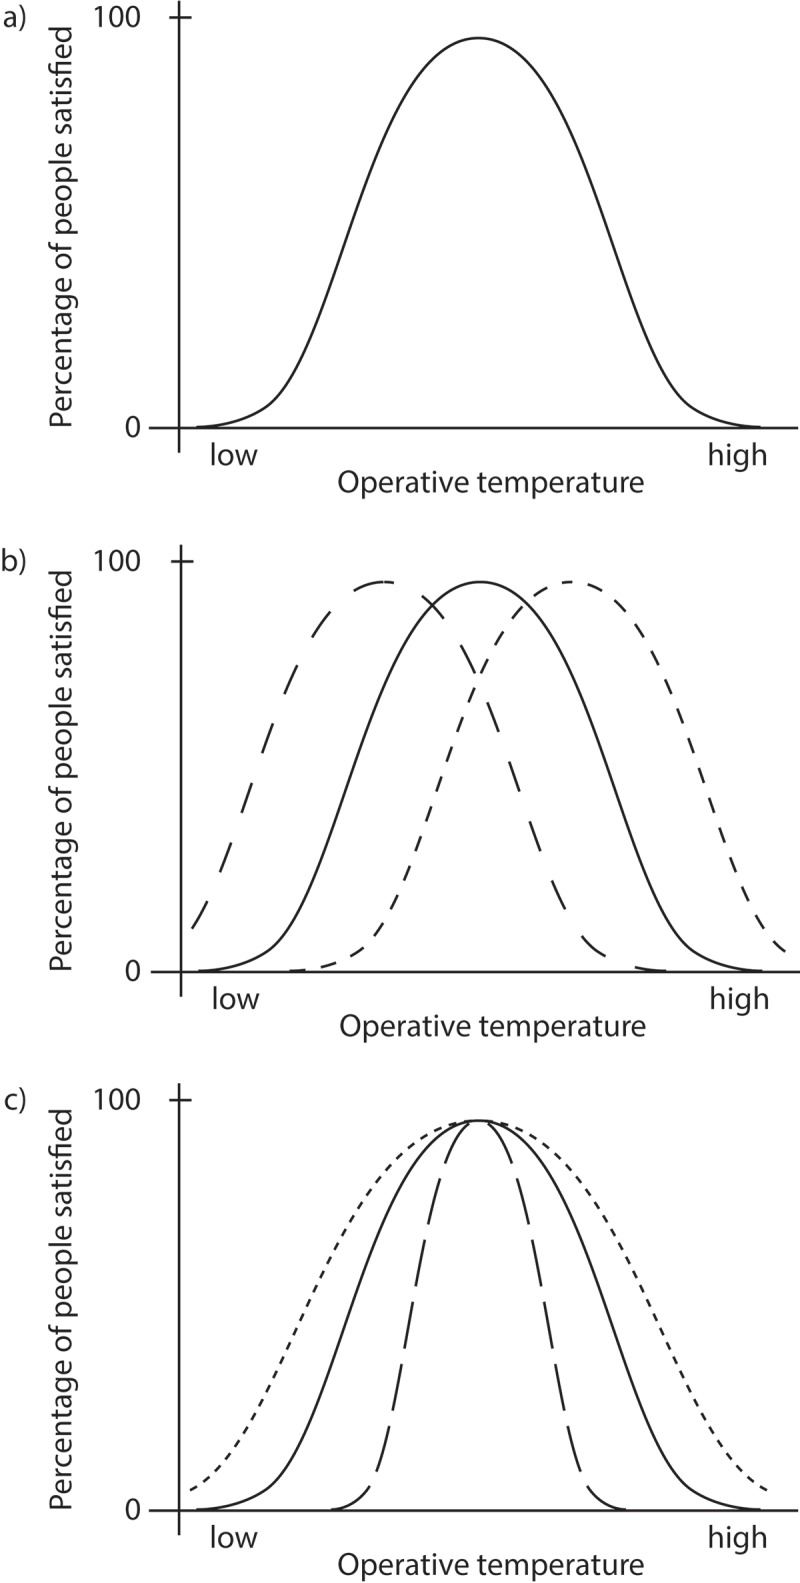
“Inter- or intrapersonal differences in physiological, psychological, and/or context related drivers can lead to (b) a shift of the PPS-curve to the left or right and/or (c) a wider/narrower curve.”
§ Drivers of diversity in human thermal perception – A review for holistic comfort models > Objectives, scope and definitions > Scope and definitions
plaindirect- Asserted: passes — The authors put it forward as true.
- Checkable: passes — It can be checked against evidence.
- Load-bearing: passes — The paper’s conclusions depend on it.
- Based: fails — The paper may give no reason why it holds.
Probably not a substantial claim. The paper may give no reason why it holds.
In the paper
“They are a consequence of changes of thermal effectors such as the abilities to sweat, shiver and control skin blood flow, and also changes in sensory function, which is also likely to cause discrepancies in thermal perception [56].”
§ Drivers of diversity in human thermal perception – A review for holistic comfort models > Review results > Physiological drivers of diversity in thermal perception
What the sources say
- Not checked yetcites [56] source
hedgeddirect- Asserted: passes — The authors put it forward as true.
- Checkable: passes — It can be checked against evidence.
- Load-bearing: passes — The paper’s conclusions depend on it.
- Based: passes — The paper gives a reason why it holds.
It may state two separate claims as one.
None of the sources cited for this claim have been checked yet.
In the paper
“These physiological changes include, for example, a lower body temperature in both older males and females as well as structural changes of the skin and metabolic alterations.”
§ Drivers of diversity in human thermal perception – A review for holistic comfort models > Review results > Physiological drivers of diversity in thermal perception
plaindirect- Asserted: passes — The authors put it forward as true.
- Checkable: passes — It can be checked against evidence.
- Load-bearing: unclear — It is unclear whether the paper’s conclusions depend on it.
- Based: passes — The paper gives a reason why it holds.
It may state two separate claims as one.
In the paper
“b. physiological adaptation by adjusting the metabolic rate related to the given activity (MET0) based on Trm through (2)”
§ Drivers of diversity in human thermal perception – A review for holistic comfort models > Methods > Modelling
What the sources say
- Not checked yetcites [14] source
plaindirect- Asserted: passes — The authors put it forward as true.
- Checkable: passes — It can be checked against evidence.
- Load-bearing: fails — The paper’s conclusions may not depend on it.
- Based: passes — The paper gives a reason why it holds.
Probably not a substantial claim. The paper’s conclusions may not depend on it.
The paper states this without a source or data behind it here, so there is nothing to check it against. The quote shows it is in the paper.
In the paper
“In contrast to PMV and SET, the TNZ model also offers the potential to vary additional input parameters such as age, sex, and body tissue insulation, relevant for the discussion of findings based on the literature review.”
§ Drivers of diversity in human thermal perception – A review for holistic comfort models > Methods > Modelling
hedged- Asserted: passes — The authors put it forward as true.
- Checkable: passes — It can be checked against evidence.
- Load-bearing: passes — The paper’s conclusions depend on it.
- Based: passes — The paper gives a reason why it holds.
Probably not a substantial claim.
- The authors state this as an assumption: The internal heat balance is dependent on heat production, body tissue insulation, body core, and skin temperatures.
- The authors state this as an assumption: The external heat balance is dependent on heat production, clothing insulation, air speed, skin wettedness, relative humidity, skin and operative temperatures.
- The authors state this as an assumption: Physiologically feasible solutions are defined where body core temperature is within a specific range (e.g. 36.5°C to 37.5°C), and body tissue insulation is constrained to what is within thermoregulatory bounds.
In the paper
“It has been proposed that the relative contribution of core and skin temperatures to thermal comfort is approximately 50%:50% [55].”
§ Drivers of diversity in human thermal perception – A review for holistic comfort models > Review results > Physiological drivers of diversity in thermal perception
What the sources say
- Not checked yetcites [55] source
hedgedcorrelational- Asserted: fails — The authors may not put it forward as true.
- Checkable: passes — It can be checked against evidence.
- Load-bearing: fails — The paper’s conclusions may not depend on it.
- Based: passes — The paper gives a reason why it holds.
Probably not a substantial claim. The authors may not put it forward as true. The paper’s conclusions may not depend on it.
In the paper
“a. behavioral adaptation by adjusting the clothing insulation level based on the running mean outdoor temperature (Trm) according to (1)”
§ Drivers of diversity in human thermal perception – A review for holistic comfort models > Methods > Modelling
What the sources say
- Not checked yetcites [14] source
plaindirect- Asserted: passes — The authors put it forward as true.
- Checkable: passes — It can be checked against evidence.
- Load-bearing: fails — The paper’s conclusions may not depend on it.
- Based: passes — The paper gives a reason why it holds.
Probably not a substantial claim. The paper’s conclusions may not depend on it.
In the paper
“In contrast, a later review by van Hoof [61] established that differences in preferred ambient temperatures were evident in several studies, stating that older people preferred higher temperatures, which the author ascribed to lower activity levels and lower basal metabolic rate.”
§ Drivers of diversity in human thermal perception – A review for holistic comfort models > Review results > Physiological drivers of diversity in thermal perception
What the sources say
- Not checked yetcites [61] source
boosteddirect- Asserted: passes — The authors put it forward as true.
- Checkable: passes — It can be checked against evidence.
- Load-bearing: fails — The paper’s conclusions may not depend on it.
- Based: passes — The paper gives a reason why it holds.
Probably not a substantial claim. The paper’s conclusions may not depend on it. It may state two separate claims as one.
The paper states this without a source or data behind it here, so there is nothing to check it against. The quote shows it is in the paper.
In the paper
“The TNZ model offers similar opportunities to include individual processes for adaptive mechanisms as the PMV and SET model.”
§ Drivers of diversity in human thermal perception – A review for holistic comfort models > Methods > Modelling
plain- Asserted: passes — The authors put it forward as true.
- Checkable: passes — It can be checked against evidence.
- Load-bearing: passes — The paper’s conclusions depend on it.
- Based: fails — The paper may give no reason why it holds.
Probably not a substantial claim. The paper may give no reason why it holds.
- The authors state this as an assumption: The internal heat balance is dependent on heat production, body tissue insulation, body core, and skin temperatures.
- The authors state this as an assumption: The external heat balance is dependent on heat production, clothing insulation, air speed, skin wettedness, relative humidity, skin and operative temperatures.
- The authors state this as an assumption: Physiologically feasible solutions are defined where body core temperature is within a specific range (e.g. 36.5°C to 37.5°C), and body tissue insulation is constrained to what is within thermoregulatory bounds.
In the paper
“c. psychological adaptation by adjusting the metabolic rate either based on a fixed value related to a specific and fixed psychological effect such as the number of persons in a room or a variable value depending e.g. on indoor operative temperature.”
§ Drivers of diversity in human thermal perception – A review for holistic comfort models > Methods > Modelling
What the sources say
- Not checked yetcites [14] source
plaindirect- Asserted: passes — The authors put it forward as true.
- Checkable: passes — It can be checked against evidence.
- Load-bearing: fails — The paper’s conclusions may not depend on it.
- Based: passes — The paper gives a reason why it holds.
Probably not a substantial claim. The paper’s conclusions may not depend on it. It may state two separate claims as one.
A conclusion the paper draws from its own results — it cites no other source for it, so there is none to check. The quote shows it is in the paper.
In the paper
“Therefore, these two approaches offer the potential to look at individual differences and adaptive processes in thermal sensation and thermal satisfaction.”
§ Drivers of diversity in human thermal perception – A review for holistic comfort models > Methods > Modelling
hedgedconditional- Asserted: passes — The authors put it forward as true.
- Checkable: passes — It can be checked against evidence.
- Load-bearing: passes — The paper’s conclusions depend on it.
- Based: passes — The paper gives a reason why it holds.
It may state two separate claims as one.
In the paper
“With the introduction of the TNZ model it was also shown that the ”thermal comfort zone“ lies within the physiological thermoneutral zone, and that they share the same center [15].”
§ Drivers of diversity in human thermal perception – A review for holistic comfort models > Methods > Modelling
What the sources say
- Not checked yetcites [15] source
plaincorrelational- Asserted: passes — The authors put it forward as true.
- Checkable: passes — It can be checked against evidence.
- Load-bearing: passes — The paper’s conclusions depend on it.
- Based: passes — The paper gives a reason why it holds.
It may state two separate claims as one.
A conclusion the paper draws from its own results — it cites no other source for it, so there is none to check. The quote shows it is in the paper.
In the paper
“This can be explained with a smaller absolute mass in children, as equal changes in metabolic rate (W/m2) should therefore result in a larger change in body temperature in children compared to adults, and therefore may explain a greater sensitivity to changes in metabolic rate.”
§ Drivers of diversity in human thermal perception – A review for holistic comfort models > Review results > Physiological drivers of diversity in thermal perception
hedgedconditional- Asserted: passes — The authors put it forward as true.
- Checkable: passes — It can be checked against evidence.
- Load-bearing: passes — The paper’s conclusions depend on it.
- Based: passes — The paper gives a reason why it holds.
It may state two separate claims as one.
None of the sources cited for this claim have been checked yet.
In the paper
“women have a higher surface-to-volume ratio (which allows for greater heat loss via the skin), different body composition (higher fat mass and less muscle mass) and lower metabolic rate (less [metabolically-active] fat-free mass in women and thus up to 20% less heat production [63–65]).”
§ Drivers of diversity in human thermal perception – A review for holistic comfort models > Review results > Physiological drivers of diversity in thermal perception
What the sources say
plaindirect- Asserted: passes — The authors put it forward as true.
- Checkable: passes — It can be checked against evidence.
- Load-bearing: passes — The paper’s conclusions depend on it.
- Based: passes — The paper gives a reason why it holds.
It may state two separate claims as one.
In the paper
“Three studies indicate elderly feeling cooler or preferring a higher ambient temperature; two papers state differences in neutral temperature but results of those not conclusive.”
§ Drivers of diversity in human thermal perception – A review for holistic comfort models > Review results > Physiological drivers of diversity in thermal perception
What the sources say
- Not checked yetcites [59] source
hedgedcorrelational- Asserted: passes — The authors put it forward as true.
- Checkable: passes — It can be checked against evidence.
- Load-bearing: passes — The paper’s conclusions depend on it.
- Based: passes — The paper gives a reason why it holds.
Probably not a substantial claim. It may state two separate claims as one.
In the paper
“This lower heat production in women is partly compensated for by their lower body surface area, but not completely [66].”
§ Drivers of diversity in human thermal perception – A review for holistic comfort models > Review results > Physiological drivers of diversity in thermal perception
What the sources say
- Not checked yetcites [66] source
plaindirect- Asserted: passes — The authors put it forward as true.
- Checkable: passes — It can be checked against evidence.
- Load-bearing: unclear — It is unclear whether the paper’s conclusions depend on it.
- Based: passes — The paper gives a reason why it holds.
It may state two separate claims as one.
In the paper
“Moreover, one of the factors mentioned is that children seem to have a greater sensitivity to changes in their metabolism.”
§ Drivers of diversity in human thermal perception – A review for holistic comfort models > Review results > Physiological drivers of diversity in thermal perception
What the sources say
- Not checked yetcites [60] source
hedgedcorrelational- Asserted: passes — The authors put it forward as true.
- Checkable: passes — It can be checked against evidence.
- Load-bearing: fails — The paper’s conclusions may not depend on it.
- Based: passes — The paper gives a reason why it holds.
Probably not a substantial claim. The paper’s conclusions may not depend on it.
The paper states this without a source or data behind it here, so there is nothing to check it against. The quote shows it is in the paper.
In the paper
“However, it is well known that in real-life situations the environmental conditions that humans are experiencing are often varying, sometimes mildly and gradually, such as increasing the heating set-point, but sometimes more extreme and abrupt, for example when entering an air-conditioned building during a hot summer day.”
§ Drivers of diversity in human thermal perception – A review for holistic comfort models > Review results > Contextual drivers of diversity
boosted- Asserted: passes — The authors put it forward as true.
- Checkable: passes — It can be checked against evidence.
- Load-bearing: passes — The paper’s conclusions depend on it.
- Based: fails — The paper may give no reason why it holds.
Probably not a substantial claim. The paper may give no reason why it holds. It may state two separate claims as one.
In the paper
“Thermal sensation of subjects could be well predicted by the PMV model in an experiment with active cooling through convection by mixing ventilation (uniform conditions), but not for the case in which active cooling through radiation by the floor was combined with displacement ventilation.”
§ Drivers of diversity in human thermal perception – A review for holistic comfort models > Review results > Contextual drivers of diversity
What the sources say
- Not checked yetcites [106] source
hedged- Asserted: passes — The authors put it forward as true.
- Checkable: passes — It can be checked against evidence.
- Load-bearing: passes — The paper’s conclusions depend on it.
- Based: passes — The paper gives a reason why it holds.
It may state two separate claims as one.
None of the sources cited for this claim have been checked yet.
In the paper
“A small steady rate of change (0.5 K/h) is in general not significantly noticeable [108–111], but its effect increases after some time and significantly affects sensation after 3 – 4 hours (depending on clothing) [113].”
§ Drivers of diversity in human thermal perception – A review for holistic comfort models > Review results > Contextual drivers of diversity
What the sources say
plaindirect- Asserted: passes — The authors put it forward as true.
- Checkable: passes — It can be checked against evidence.
- Load-bearing: unclear — It is unclear whether the paper’s conclusions depend on it.
- Based: passes — The paper gives a reason why it holds.
It may state two separate claims as one.
The paper states this without a source or data behind it here, so there is nothing to check it against. The quote shows it is in the paper.
In the paper
“The heat balance approach, such as incorporated in the PMV model, relies on steady state and deterministic effects.”
§ Drivers of diversity in human thermal perception – A review for holistic comfort models > Review results > Contextual drivers of diversity
plaindirect- Asserted: passes — The authors put it forward as true.
- Checkable: passes — It can be checked against evidence.
- Load-bearing: fails — The paper’s conclusions may not depend on it.
- Based: fails — The paper may give no reason why it holds.
Probably not a substantial claim. The paper’s conclusions may not depend on it. The paper may give no reason why it holds.
In the paper
“For visitors who had been inside for 20 min or less, the thermal sensation vote had a significant relation with the outdoor temperature but not the indoor temperature.”
§ Drivers of diversity in human thermal perception – A review for holistic comfort models > Review results > Contextual drivers of diversity
What the sources say
- Not checked yetcites [116] source
plaincorrelational- Asserted: passes — The authors put it forward as true.
- Checkable: passes — It can be checked against evidence.
- Load-bearing: unclear — It is unclear whether the paper’s conclusions depend on it.
- Based: passes — The paper gives a reason why it holds.
It may state two separate claims as one.
In the paper
“Their literature review reveals that sample sizes are small, studies are predominantly confined to climate chamber experiments, and results are not consistent.”
§ Drivers of diversity in human thermal perception – A review for holistic comfort models > Review results > Contextual drivers of diversity
What the sources say
- Not checked yetcites [105] source
plain- Asserted: passes — The authors put it forward as true.
- Checkable: passes — It can be checked against evidence.
- Load-bearing: passes — The paper’s conclusions depend on it.
- Based: passes — The paper gives a reason why it holds.
Probably not a substantial claim. It may state two separate claims as one.
In the paper
“Hensen [112] concluded from several studies that if the amplitude of the cyclical variation is larger than 1 K, the acceptable temperature range decreases with increasing variation frequency, i.e. larger rate of changes, and the largest acceptable temperature range is under steady state conditions.”
§ Drivers of diversity in human thermal perception – A review for holistic comfort models > Review results > Contextual drivers of diversity
What the sources say
- Not checked yetcites [112] source
plaindirect- Asserted: passes — The authors put it forward as true.
- Checkable: passes — It can be checked against evidence.
- Load-bearing: unclear — It is unclear whether the paper’s conclusions depend on it.
- Based: passes — The paper gives a reason why it holds.
It may state two separate claims as one.
In the paper
“They showed that a temperature drift of 2 K/h resulted in slightly decreased thermal comfort compared to constant temperatures, but drifting conditions were still perceived as acceptable.”
§ Drivers of diversity in human thermal perception – A review for holistic comfort models > Review results > Contextual drivers of diversity
What the sources say
- Not checked yetcites [114] source
plaindirect- Asserted: passes — The authors put it forward as true.
- Checkable: passes — It can be checked against evidence.
- Load-bearing: unclear — It is unclear whether the paper’s conclusions depend on it.
- Based: passes — The paper gives a reason why it holds.
It may state two separate claims as one.
In the paper
“Moreover, the radiant field is mostly perceived in the combined form of radiant asymmetry and mean radiant temperature (MRT), which is a result of the asymmetry.”
§ Drivers of diversity in human thermal perception – A review for holistic comfort models > Review results > Contextual drivers of diversity
What the sources say
- Not checked yetcites [105] source
plaindirect- Asserted: passes — The authors put it forward as true.
- Checkable: passes — It can be checked against evidence.
- Load-bearing: unclear — It is unclear whether the paper’s conclusions depend on it.
- Based: passes — The paper gives a reason why it holds.
It may state two separate claims as one.
In the paper
“After entering the museum, most people felt warm due to the warm outdoor conditions and perceived the cool indoor conditions as comfortable, but as visitors were longer in the museum, they gradually started feeling cooler and more uncomfortable.”
§ Drivers of diversity in human thermal perception – A review for holistic comfort models > Review results > Contextual drivers of diversity
What the sources say
- Not checked yetcites [116] source
plaindirect- Asserted: passes — The authors put it forward as true.
- Checkable: passes — It can be checked against evidence.
- Load-bearing: unclear — It is unclear whether the paper’s conclusions depend on it.
- Based: passes — The paper gives a reason why it holds.
It may state two separate claims as one.
In the paper
“Personal conditioning typically targets local discomfort, and hence, results in non-uniform environments [122]: the hands and arms are critical body parts in cool environments, whereas the head and neck are critical body parts in warm environments.”
§ Drivers of diversity in human thermal perception – A review for holistic comfort models > Review results > Contextual drivers of diversity
What the sources say
- Not checked yetcites [122] source
plaindirect- Asserted: passes — The authors put it forward as true.
- Checkable: passes — It can be checked against evidence.
- Load-bearing: passes — The paper’s conclusions depend on it.
- Based: passes — The paper gives a reason why it holds.
It may state two separate claims as one.
None of the sources cited for this claim have been checked yet.
In the paper
“Evidence regarding clothing level differences between males and females differs; while Schiavon & Lee [130] report similar clothing insulation levels, de Vecchi et al. [131] state that males’ clothing insulation level is less variable than that of females.”
§ Drivers of diversity in human thermal perception – A review for holistic comfort models > Review results > Contextual drivers of diversity
What the sources say
- Not checked yetcites [130] source
- Not checked yetcites [131] De VR, 2017
plaincorrelational- Asserted: passes — The authors put it forward as true.
- Checkable: passes — It can be checked against evidence.
- Load-bearing: unclear — It is unclear whether the paper’s conclusions depend on it.
- Based: passes — The paper gives a reason why it holds.
It may state two separate claims as one.
In the paper
“Parkinson et al. [118] concluded that it is even possible to evoke alliesthesia within the TNZ, which is most representative for the physiological state of building occupants in most indoor environments.”
§ Drivers of diversity in human thermal perception – A review for holistic comfort models > Review results > Contextual drivers of diversity
What the sources say
- Not checked yetcites [118] source
hedgedconditional- Asserted: passes — The authors put it forward as true.
- Checkable: passes — It can be checked against evidence.
- Load-bearing: fails — The paper’s conclusions may not depend on it.
- Based: passes — The paper gives a reason why it holds.
Probably not a substantial claim. The paper’s conclusions may not depend on it.
A conclusion the paper draws from its own results — it cites no other source for it, so there is none to check. The quote shows it is in the paper.
In the paper
“Besides the psychological effect on thermal perception as discussed in the previous section on personal control, building control can significantly influence the course of indoor environmental parameters, and hence, occupants’ thermal comfort.”
§ Drivers of diversity in human thermal perception – A review for holistic comfort models > Review results > Contextual drivers of diversity
plaindirect- Asserted: passes — The authors put it forward as true.
- Checkable: passes — It can be checked against evidence.
- Load-bearing: fails — The paper’s conclusions may not depend on it.
- Based: fails — The paper may give no reason why it holds.
Probably not a substantial claim. The paper’s conclusions may not depend on it. The paper may give no reason why it holds. It may state two separate claims as one.
None of the sources cited for this claim have been checked yet.
In the paper
“A first intent can be seen in the approach by Schweiker et al., which adjusts the metabolic rate as input to either PMV [13,14] and/or SET [13] calculation to model effects of physiological adaptation as described in section ”Methodology”, Equation (2). As a result, the output of the PMV model aligns with the results of the adaptive comfort model [13,14].”
§ Drivers of diversity in human thermal perception – A review for holistic comfort models > Discussion of diversity drivers with respect to the prediction of thermal perception > Physiological differences
plaindirect- Asserted: passes — The authors put it forward as true.
- Checkable: passes — It can be checked against evidence.
- Load-bearing: unclear — It is unclear whether the paper’s conclusions depend on it.
- Based: passes — The paper gives a reason why it holds.
It may state two separate claims as one.
None of the sources cited for this claim have been checked yet.
In the paper
“Comfort can be maintained by chair heating at air temperatures down to 15°C [126] and by radiant floor heating at air temperatures down to 18°C [127].”
§ Drivers of diversity in human thermal perception – A review for holistic comfort models > Review results > Contextual drivers of diversity
plaindirect- Asserted: passes — The authors put it forward as true.
- Checkable: passes — It can be checked against evidence.
- Load-bearing: unclear — It is unclear whether the paper’s conclusions depend on it.
- Based: passes — The paper gives a reason why it holds.
It may state two separate claims as one.
What the paper did — it cites no source for this, so there is none to check. The quote shows it is in the paper.
In the paper
“Firstly, as the present review is not of a fully systematic nature, relevant publications might have been missed.”
§ Drivers of diversity in human thermal perception – A review for holistic comfort models > General discussion and conclusions > Limitations
hedgedconditional- Asserted: passes — The authors put it forward as true.
- Checkable: passes — It can be checked against evidence.
- Load-bearing: fails — The paper’s conclusions may not depend on it.
- Based: passes — The paper gives a reason why it holds.
Probably not a substantial claim. The paper’s conclusions may not depend on it.
What the paper did — it cites no source for this, so there is none to check. The quote shows it is in the paper.
In the paper
“Secondly, the comparison of review results with implications for modelling is based solely on the combination of TNZ and ATHB approach.”
§ Drivers of diversity in human thermal perception – A review for holistic comfort models > General discussion and conclusions > Limitations
plain- Asserted: passes — The authors put it forward as true.
- Checkable: passes — It can be checked against evidence.
- Load-bearing: fails — The paper’s conclusions may not depend on it.
- Based: passes — The paper gives a reason why it holds.
Probably not a substantial claim. The paper’s conclusions may not depend on it.
A conclusion the paper draws from its own results — it cites no other source for it, so there is none to check. The quote shows it is in the paper.
In the paper
“These differences are, however, difficult to pick up, if a survey is conducted without collecting all relevant variables and at stable thermal conditions.”
§ Drivers of diversity in human thermal perception – A review for holistic comfort models > General discussion and conclusions > Demographic and physiological drivers of diversity
plain- Asserted: passes — The authors put it forward as true.
- Checkable: passes — It can be checked against evidence.
- Load-bearing: fails — The paper’s conclusions may not depend on it.
- Based: fails — The paper may give no reason why it holds.
Probably not a substantial claim. The paper’s conclusions may not depend on it. The paper may give no reason why it holds.
What the paper did — it cites no source for this, so there is none to check. The quote shows it is in the paper.
In the paper
“The required physiological input parameter “metabolic rate” was estimated by scaling the predicted resting metabolic rate (measured in reclined position: 0.8 MET) to the ASHRAE MET equivalent corresponding to resting/seated activity. It is not known how the scaling influences the error of the metabolic rate production.”
§ Drivers of diversity in human thermal perception – A review for holistic comfort models > General discussion and conclusions > Limitations
plain- Asserted: passes — The authors put it forward as true.
- Checkable: passes — It can be checked against evidence.
- Load-bearing: fails — The paper’s conclusions may not depend on it.
- Based: passes — The paper gives a reason why it holds.
Probably not a substantial claim. The paper’s conclusions may not depend on it.
A conclusion the paper draws from its own results — it cites no other source for it, so there is none to check. The quote shows it is in the paper.
In the paper
“It is likely that physiological adaptation differs even more, for example, between groups with different age and/or body composition.”
§ Drivers of diversity in human thermal perception – A review for holistic comfort models > General discussion and conclusions > Demographic and physiological drivers of diversity
hedgedcorrelational- Asserted: passes — The authors put it forward as true.
- Checkable: passes — It can be checked against evidence.
- Load-bearing: fails — The paper’s conclusions may not depend on it.
- Based: fails — The paper may give no reason why it holds.
Probably not a substantial claim. The paper’s conclusions may not depend on it. The paper may give no reason why it holds.
A conclusion the paper draws from its own results — it cites no other source for it, so there is none to check. The quote shows it is in the paper.
In the paper
“However, this approach requires a clear understanding of all physical and physiological influences on thermal perception, which – according to this review – does not exist yet.”
§ Drivers of diversity in human thermal perception – A review for holistic comfort models > General discussion and conclusions > Context-related drivers of diversity
plain- Asserted: passes — The authors put it forward as true.
- Checkable: passes — It can be checked against evidence.
- Load-bearing: passes — The paper’s conclusions depend on it.
- Based: passes — The paper gives a reason why it holds.
It may state two separate claims as one.
What the paper did — it cites no source for this, so there is none to check. The quote shows it is in the paper.
In the paper
“Firstly, as the present review is not of a fully systematic nature, relevant publications might have been missed.”
§ Drivers of diversity in human thermal perception – A review for holistic comfort models > General discussion and conclusions > Limitations
plain- Asserted: passes — The authors put it forward as true.
- Checkable: passes — It can be checked against evidence.
- Load-bearing: fails — The paper’s conclusions may not depend on it.
- Based: passes — The paper gives a reason why it holds.
Probably not a substantial claim. The paper’s conclusions may not depend on it.
A conclusion the paper draws from its own results — it cites no other source for it, so there is none to check. The quote shows it is in the paper.
In the paper
“The effect of context-related differences on thermal perception, such as radiant asymmetries or step changes, requires more complex modelling approaches than heat balance models.”
§ Drivers of diversity in human thermal perception – A review for holistic comfort models > General discussion and conclusions > Context-related drivers of diversity
plaindirect- Asserted: passes — The authors put it forward as true.
- Checkable: fails — It may be too vague to check against evidence.
- Load-bearing: passes — The paper’s conclusions depend on it.
- Based: fails — The paper may give no reason why it holds.
Probably not a substantial claim. It may be too vague to check against evidence. The paper may give no reason why it holds.
A conclusion the paper draws from its own results — it cites no other source for it, so there is none to check. The quote shows it is in the paper.
In the paper
“Being able to model the effect of important individual drivers on thermal perception and related knowledge regarding the boundaries of thermal comfort can serve as a basis to look at variables affecting diversity in the adaptive capacity.”
§ Drivers of diversity in human thermal perception – A review for holistic comfort models > General discussion and conclusions > Holistic perspectives
plaincorrelational- Asserted: passes — The authors put it forward as true.
- Checkable: fails — It may be too vague to check against evidence.
- Load-bearing: passes — The paper’s conclusions depend on it.
- Based: fails — The paper may give no reason why it holds.
Probably not a substantial claim. It may be too vague to check against evidence. The paper may give no reason why it holds.
A conclusion the paper draws from its own results — it cites no other source for it, so there is none to check. The quote shows it is in the paper.
In the paper
“Evaluation of demographic and physiological differences showed that differences between age- and sex-groups, as well as the ambiguity of results related to these drivers, may be explained by differences in resting metabolic rate and body composition.”
§ Drivers of diversity in human thermal perception – A review for holistic comfort models > General discussion and conclusions > Demographic and physiological drivers of diversity
hedgedconditional- Asserted: passes — The authors put it forward as true.
- Checkable: passes — It can be checked against evidence.
- Load-bearing: passes — The paper’s conclusions depend on it.
- Based: passes — The paper gives a reason why it holds.
It may state two separate claims as one.
A conclusion the paper draws from its own results — it cites no other source for it, so there is none to check. The quote shows it is in the paper.
In the paper
“However, these adaptive processes are highly speculative and more complex mechanisms are most likely in place.”
§ Drivers of diversity in human thermal perception – A review for holistic comfort models > General discussion and conclusions > Demographic and physiological drivers of diversity
hedged- Asserted: passes — The authors put it forward as true.
- Checkable: fails — It may be too vague to check against evidence.
- Load-bearing: fails — The paper’s conclusions may not depend on it.
- Based: fails — The paper may give no reason why it holds.
Probably not a substantial claim. It may be too vague to check against evidence. The paper’s conclusions may not depend on it. The paper may give no reason why it holds. It may state two separate claims as one.
A conclusion the paper draws from its own results — it cites no other source for it, so there is none to check. The quote shows it is in the paper.
In the paper
“In the context of global warming, this leads to a further rise in the cooling demand of buildings, in order to achieve thermal comfort of building occupants, given the fact that obesity prevalence is expected to increase even more in future.”
§ Drivers of diversity in human thermal perception – A review for holistic comfort models > General discussion and conclusions > Holistic perspectives
plaindirect- Asserted: passes — The authors put it forward as true.
- Checkable: passes — It can be checked against evidence.
- Load-bearing: fails — The paper’s conclusions may not depend on it.
- Based: fails — The paper may give no reason why it holds.
Probably not a substantial claim. The paper’s conclusions may not depend on it. The paper may give no reason why it holds. It may state two separate claims as one.
A conclusion the paper draws from its own results — it cites no other source for it, so there is none to check. The quote shows it is in the paper.
In the paper
“Knowing the true drivers of diversity will be helpful in preparation for global challenges because the indoor thermal conditions chosen by an individual do not only affect the energy use – in itself a driver of climate change – but also affect health, wellbeing, and productivity.”
§ Drivers of diversity in human thermal perception – A review for holistic comfort models > General discussion and conclusions > Conclusions
plaindirect- Asserted: passes — The authors put it forward as true.
- Checkable: fails — It may be too vague to check against evidence.
- Load-bearing: passes — The paper’s conclusions depend on it.
- Based: passes — The paper gives a reason why it holds.
Probably not a substantial claim. It may be too vague to check against evidence.
- Rests on an assumption: Indoor thermal conditions chosen by an individual affect energy use.
- Rests on an assumption: Energy use is a driver of climate change.
- Rests on an assumption: Indoor thermal conditions chosen by an individual affect health, wellbeing, and productivity.
A conclusion the paper draws from its own results — it cites no other source for it, so there is none to check. The quote shows it is in the paper.
In the paper
“Hence, there are likely to be temperatures (temperature ranges) at which men are still comfortable, but women are not, and the other way around.”
§ Drivers of diversity in human thermal perception – A review for holistic comfort models > General discussion and conclusions > Demographic and physiological drivers of diversity
hedgedcorrelational- Asserted: passes — The authors put it forward as true.
- Checkable: passes — It can be checked against evidence.
- Load-bearing: passes — The paper’s conclusions depend on it.
- Based: passes — The paper gives a reason why it holds.
It may state two separate claims as one.
The authors state this as an assumption.
Occupants can freely adjust and acclimatize to several environmental parameters such as air speed, humidity levels and clothing.
“The extended comfort ranges (seasonal variation) of adaptive comfort models rely on the assumption that occupants can freely adjust, and acclimatize to several environmental parameters such as air speed, humidity levels and clothing.”
The authors state this as an assumption.
Dissatisfaction is expressed by thermal sensation votes outside the three middle categories.
“the assumption that dissatisfaction is expressed by thermal sensation votes outside the three middle categories [8]”
The authors state this as an assumption.
The internal heat balance is dependent on heat production, body tissue insulation, body core, and skin temperatures.
“The internal heat balance is dependent on heat production, body tissue insulation, body core, and skin temperatures.”
The authors state this as an assumption.
The external heat balance is dependent on heat production, clothing insulation, air speed, skin wettedness, relative humidity, skin and operative temperatures.
“The external heat balance is dependent on heat production, clothing insulation, air speed, skin wettedness, relative humidity, skin and operative temperatures.”
The authors state this as an assumption.
Physiologically feasible solutions are defined where body core temperature is within a specific range (e.g. 36.5°C to 37.5°C), and body tissue insulation is constrained to what is within thermoregulatory bounds.
“Physiologically feasible solutions are defined where body core temperature is within a specific range (e.g. 36.5°C to 37.5°C), and body tissue insulation is constrained to what is within thermoregulatory bounds (e.g. highest body tissue insulation for maximal vasoconstriction and lowest body tissue insulation for maximal vasodilation).”
The authors state this as an assumption.
Thermal perception and preferred temperature are affected by body composition.
“Therefore, it can be assumed that thermal perception and preferred temperature are affected by body composition.”
The authors state this as an assumption.
A shift of thermal sensation and comfort temperatures over the year occurs in climatic regions with distinct seasonal temperature differences.
“From the perspective of physiological adaptation presented in the above, also a shift of thermal sensation and comfort temperatures over the year may be assumed, at least for those climatic regions, which have distinct temperature differences over the different seasons.”
The authors state this as an assumption.
A decrease of metabolic rate in hot environments is not due to physiological changes but is rather attributable to behavioral adjustments.
“it can be assumed that a decrease of metabolic rate in hot environments, which has earlier been suggested to be a physiological consequence of heat adaptation [140], is not due to physiological changes but is rather attributable to behavioral adjustments [90].”
The authors state this as an assumption.
Body tissue insulation decreases with adaptation to heat.
“from the increased peripheral blood flow resulting from heat adaptation, it is plausible that body tissue insulation decreases.”
The authors state this as an assumption.
There is a relationship between stress level (potentially increased by a lack of perceived control) and metabolic rate.
“following the assumption of a relationship between stress level (potentially increased by a lack of perceived control) and metabolic rate [14].”
The paper relies on this without support.
The PMV's double heat balance equation only accounts for the mean radiant temperature (MRT).
“However, the PMV’s double heat balance equation only accounts for the MRT.”
The paper relies on this without support.
Indoor thermal conditions chosen by an individual affect energy use.
“Knowing the true drivers of diversity will be helpful in preparation for global challenges because the indoor thermal conditions chosen by an individual do not only affect the energy use – in itself a driver of climate change – but also affect health, wellbeing, and productivity.”
The paper relies on this without support.
Energy use is a driver of climate change.
“Knowing the true drivers of diversity will be helpful in preparation for global challenges because the indoor thermal conditions chosen by an individual do not only affect the energy use – in itself a driver of climate change – but also affect health, wellbeing, and productivity.”
The paper relies on this without support.
Indoor thermal conditions chosen by an individual affect health, wellbeing, and productivity.
“Knowing the true drivers of diversity will be helpful in preparation for global challenges because the indoor thermal conditions chosen by an individual do not only affect the energy use – in itself a driver of climate change – but also affect health, wellbeing, and productivity.”
Claims other papers make about this one
Each is checked against this paper’s own text: does it say what the citing paper says it does?
In the citing paper
“Wang [24] and Schweiker [25] independently surveyed sources of diversity in human thermal perception and dedicated a paragraph to circadian rhythms related to variations in core body temperature. However, none of these works focused specifically on reviewing studies investigating the dependency of thermal perception on the time of day.”
From Human thermal perception and time of day: A review (2021) · cites this paper as [25]
Self-check
Percentages, sums and reported differences re-computed from the paper’s own numbers.
Rated minor: it would not touch a result — a value no result rests on, a p-value that stays on the same side of the significance level, or a conflict that is clerical, resolved elsewhere in the paper, or outside its own findings.
In the paper
“| Rupp, Vasquez and Lamberts, 2015 [60] | 8 | Systematic review; 2 laboratory studies, 3 field studies |”
§ Drivers of diversity in human thermal perception – A review for holistic comfort models > Review results > Physiological drivers of diversity in thermal perception
Reported 8 · recomputed 5
Citations
Cites
2011 Compendium of Physical Activities: A Second Update of Codes and MET Values
AINSWORTH, B. E., HASKELL, W. L., HERRMANN, S. D., MECKES, N., BASSETT, D. R., TUDOR-LOCKE, C., GREER, J. L., VEZINA, J., WHITT-GLOVER, M. C., & LEON, A. S. (2011) · Medicine & Science in Sports & Exercise · doi:10.1249/mss.0b013e31821ece12 · Cited by 6,317
Thermal Environmental Conditions for Human Occupancy
Ashrae, S. (1992) · Medical Entomology and Zoology · Cited by 6,092
A formula to estimate the approximate surface area if height and weight be known. 1916.
Bois, D. D., & Bois, E. F. D. (1989) · PubMed · Cited by 5,303
Thermal comfort: Analysis and applications in environmental engineering
Fanger, P. O. (1972) · Applied Ergonomics · doi:10.1016/s0003-6870(72)80074-7 · Cited by 4,515
Compendium of Physical Activities: Classification of energy costs of human physical activities
AINSWORTH, B. E., HASKELL, W. L., LEON, A. S., JACOBS, D. R., MONTOYE, H. J., SALLIS, J. F., & PAFFENBARGER, R. S. (1993) · Medicine & Science in Sports & Exercise · doi:10.1249/00005768-199301000-00011 · Cited by 4,102
Are there social limits to adaptation to climate change?
Adger, W. N., Dessai, S., Goulden, M. C., Hulme, M., Lorenzoni, I., Nelson, D. R., Næss, L. O., Wolf, J., & Wreford, A. (2008) · Climatic Change · doi:10.1007/s10584-008-9520-z · Cited by 2,684
Scaling: Why is Animal Size so Important?
Schmidt-Nielsen, K. (1984) · doi:10.1017/cbo9781139167826 · Cited by 2,677
Heat Stress and Public Health: A Critical Review
Kovats, S. R., & Hajat, S. (2007) · Annual Review of Public Health · doi:10.1146/annurev.publhealth.29.020907.090843 · Cited by 2,011
Adaptive thermal comfort and sustainable thermal standards for buildings
Nicol, F., & Humphreys, M. (2002) · Energy and Buildings · doi:10.1016/s0378-7788(02)00006-3 · Cited by 1,986
A biometric study of human basal metabolism
Harris, J. A., & Benedict, F. G. (1918) · Proceedings of the National Academy of Sciences · doi:10.1073/pnas.4.12.370 · Cited by 1,980
(1998) · eScholarship (California Digital Library) · Cited by 1,934
Cabanac, M. (1971) · Science · doi:10.1126/science.173.4002.1103 · Cited by 1,521
A standard predictive index of human response to the thermal environment
Gagge, A. P., Fobelets, A. P. R., & Berglund, L. G. (1986) · ASHRAE winter conference papers · Cited by 1,053
A review of human thermal comfort in the built environment
Rupp, R. F., Vásquez, N. G., & Lamberts, R. (2015) · Energy and Buildings · doi:10.1016/j.enbuild.2015.07.047 · Cited by 907
Fiala, D., Lomas, K. J., & Stohrer, M. (1999) · Journal of Applied Physiology · doi:10.1152/jappl.1999.87.5.1957 · Cited by 867
Cold acclimation recruits human brown fat and increases nonshivering thermogenesis
van der Lans, A. A. J. J., Hoeks, J., Brans, B. T., Vijgen, G. H. E. J., Visser, M. G. W., Vosselman, M. J., Hansen, J., Jörgensen, J. A., Wu, J., Mottaghy, F. M., et al. (2013) · Journal of Clinical Investigation · doi:10.1172/jci68993 · Cited by 860
Extension of the PMV model to non-air-conditioned buildings in warm climates
Ole Fanger, P., & Toftum, J. (2002) · Energy and Buildings · doi:10.1016/s0378-7788(02)00003-8 · Cited by 853
The Harris Benedict equation reevaluated: resting energy requirements and the body cell mass
Roza, A. M., & Shizgal, H. M. (1984) · The American Journal of Clinical Nutrition · doi:10.1093/ajcn/40.1.168 · Cited by 824 · cited 3×
“Interestingly, resting metabolic rate varies between groups of different age, sex, and body composition [132] and using adjusted metabolic rates for subpopulations were found to improve the prediction of thermal comfort [133].”
BackgroundForty years of Fanger’s model of thermal comfort: comfort for all?
van Hoof, J. (2008) · Indoor Air · doi:10.1111/j.1600-0668.2007.00516.x · Cited by 733
The validity of ISO-PMV for predicting comfort votes in every-day thermal environments
Humphreys, M., & Nicol, F. (2002) · Energy and Buildings · doi:10.1016/s0378-7788(02)00018-x · Cited by 716
A theoretical adaptive model of thermal comfort – Adaptive Predicted Mean Vote (aPMV)
Yao, R., Li, B., & Liu, J. (2009) · Building and Environment · doi:10.1016/j.buildenv.2009.02.014 · Cited by 713
Périard, J. D., Racinais, S., & Sawka, M. N. (2015) · Scandinavian Journal of Medicine and Science in Sports · doi:10.1111/sms.12408 · Cited by 696
Individual difference in thermal comfort: A literature review
Wang, Z., de Dear, R., Luo, M., Lin, B., He, Y., Ghahramani, A., & Zhu, Y. (2018) · Building and Environment · doi:10.1016/j.buildenv.2018.04.040 · Cited by 675
The impact of heat waves and cold spells on mortality rates in the Dutch population.
Huynen, M. M., Martens, P., Schram, D., Weijenberg, M. P., & Kunst, A. E. (2001) · Environmental Health Perspectives · doi:10.1289/ehp.01109463 · Cited by 672
Adaptive Thermal Comfort: Principles and Practice
Nicol, F., Humphreys, M., & Roaf, S. (2012) · doi:10.4324/9780203123010 · Cited by 636
Introducing the prebound effect: the gap between performance and actual energy consumption
Sunikka, M. M., & Galvin, R. (2012) · Building Research & Information · doi:10.1080/09613218.2012.690952 · Cited by 633
Thermoreception and temperature regulation
Hensel, H. (1991) · General Pharmacology The Vascular System · doi:10.1016/0306-3623(91)90495-r · Cited by 630
Short-term cold acclimation improves insulin sensitivity in patients with type 2 diabetes mellitus
Hanssen, M. J. W., Hoeks, J., Brans, B. T., van der Lans, A. A. J. J., Schaart, G., van den Driessche, J. J., Jörgensen, J. A., Boekschoten, M. V., Hesselink, M. K. C., Havekes, B., et al. (2015) · Nature Medicine · doi:10.1038/nm.3891 · Cited by 613
Cunningham, J. (1991) · The American Journal of Clinical Nutrition · doi:10.1093/ajcn/54.6.963 · Cited by 607
A model of human physiology and comfort for assessing complex thermal environments
Huizenga, C., Hui, Z., & Arens, E. (2001) · Building and Environment · doi:10.1016/s0360-1323(00)00061-5 · Cited by 585
Tanabe, S., Kobayashi, K., Nakano, J., Ozeki, Y., & Konishi, M. (2002) · Energy and Buildings · doi:10.1016/s0378-7788(02)00014-2 · Cited by 538
Thermal comfort and gender: a literature review
Karjalainen, S. (2012) · Indoor Air · doi:10.1111/j.1600-0668.2011.00747.x · Cited by 536
Metabolic equivalent: one size does not fit all
Byrne, N. M., Hills, A. P., Hunter, G. R., Weinsier, R. L., & Schutz, Y. (2005) · Journal of Applied Physiology · doi:10.1152/japplphysiol.00023.2004 · Cited by 527
The Impact of Heat Waves and Cold Spells on Mortality Rates in the Dutch Population
Huynen, M. M. T. E., Martens, P., Schram-Bijkerk, D., et al. (2001) · Environmental Health Perspectives · doi:10.2307/3454704 · Cited by 510
Kim, J., Zhou, Y., Schiavon, S., Raftery, P., & Brager, G. S. (2017) · Building and Environment · doi:10.1016/j.buildenv.2017.12.011 · Cited by 492
Zhang, H., Arens, E. A., Huizenga, C., & Han, T. (2009) · Building and Environment · doi:10.1016/j.buildenv.2009.06.015 · Cited by 478
Developing an adaptive control algorithm for Europe
McCartney, K. J., & Nicol, F. (2002) · Energy and Buildings · doi:10.1016/s0378-7788(02)00013-0 · Cited by 476
Assessment of man's thermal comfort in practice
Fanger, P. O. (1973) · Occupational and Environmental Medicine · doi:10.1136/oem.30.4.313 · Cited by 438
A review of the corrective power of personal comfort systems in non-neutral ambient environments
Zhang, H., Arens, E. A., & Zhai, Y. (2015) · Building and Environment · doi:10.1016/j.buildenv.2015.03.013 · Cited by 425
Thermal comfort in residential buildings: Comfort values and scales for building energy simulation
Peeters, L., de Dear, R., Hensen, J. J., & D’haeseleer, W. D. (2008) · Applied Energy · doi:10.1016/j.apenergy.2008.07.011 · Cited by 419
A review of thermal comfort models and indicators for indoor environments
Enescu, D. (2017) · Renewable and Sustainable Energy Reviews · doi:10.1016/j.rser.2017.05.175 · Cited by 410
Outdoor temperatures and comfort indoors
Humphreys, M. (1978) · Batiment International Building Research and Practice · doi:10.1080/09613217808550656 · Cited by 378
Schellen, L., Van Marken Lichtenbelt, W. D., Loomans, M. G. L. C., Toftum, J., & De Wit, M. H. (2010) · Indoor Air · doi:10.1111/j.1600-0668.2010.00657.x · Cited by 377
Prediction of resting energy expenditure from fat-free mass and fat mass
Nelson, K., Weinsier, R., Long, C., & Schutz, Y. (1992) · The American Journal of Clinical Nutrition · doi:10.1093/ajcn/56.5.848 · Cited by 371 · cited 1×
“Next to insulation, lean mass strongly determines heat production (metabolic rate) of the body: the greater the muscle mass, the more heat is produced by the body, even in a resting state [75,76].”
BackgroundOperable windows, personal control and occupant comfort.
Brager, G. S., Paliaga, G., & de Dear, R. (2004) · eScholarship (California Digital Library) · Cited by 347
Wagner, A., Gossauer, E., Moosmann, C., Gropp, T., & Leonhart, R. (2007) · Energy and Buildings · doi:10.1016/j.enbuild.2007.02.013 · Cited by 343
Frank, S. M., Raja, S. N., Bulcao, C. F., & Goldstein, D. S. (1999) · Journal of Applied Physiology · doi:10.1152/jappl.1999.86.5.1588 · Cited by 343
Field studies on human thermal comfort — An overview
Mishra, A. K., & Ramgopal, M. (2013) · Building and Environment · doi:10.1016/j.buildenv.2013.02.015 · Cited by 336
Revisiting an old hypothesis of human thermal perception: alliesthesia
de Dear, R. (2011) · Building Research & Information · doi:10.1080/09613218.2011.552269 · Cited by 333
Taylor, N. A. S. (2014) · Comprehensive Physiology · doi:10.1002/cphy.c130022 · Cited by 331
Impacts of heat waves and corresponding measures: a review
Zuo, J., Pullen, S., Palmer, J., Bennetts, H., Chileshe, N., & Ma, T. (2015) · Journal of Cleaner Production · doi:10.1016/j.jclepro.2014.12.078 · Cited by 322
Personalized conditioning and its impact on thermal comfort and energy performance – A review
Veselý, M., & Zeiler, W. (2014) · Renewable and Sustainable Energy Reviews · doi:10.1016/j.rser.2014.03.024 · Cited by 322
Short-term Cold Acclimation Recruits Brown Adipose Tissue in Obese Humans
Hanssen, M. J. W., van der Lans, A. A. J. J., Brans, B. T., Hoeks, J., Jardon, K. M. C., Schaart, G., Mottaghy, F. M., Schrauwen, P., & Lichtenbelt, W. D. V. M. (2015) · Diabetes · doi:10.2337/db15-1372 · Cited by 302
Individualized model of human thermoregulation for the simulation of heat stress response
Havenith, G. (2001) · Journal of Applied Physiology · doi:10.1152/jappl.2001.90.5.1943 · Cited by 299
Age-Dependent Changes in Temperature Regulation – A Mini Review
Blatteis, C. M. (2011) · Gerontology · doi:10.1159/000333148 · Cited by 284
Thermal comfort models: A review and numerical investigation
Cheng, Y., Niu, J., & Gao, N. (2011) · Building and Environment · doi:10.1016/j.buildenv.2011.05.011 · Cited by 271
Thermal pleasure in built environments: physiology of alliesthesia
Parkinson, T., & de Dear, R. (2015) · Building Research & Information · doi:10.1080/09613218.2015.989662 · Cited by 263
Glossary of terms for thermal physiology (Third Edition)
IUPSThermalCommission (2001) · The Japanese Journal of Physiology · Cited by 260
Do people like to feel ‘neutral’?
Humphreys, M. A., & Hancock, M. (2007) · Energy and Buildings · doi:10.1016/j.enbuild.2007.02.014 · Cited by 259
Thermophysiological models and their applications: A review
Katić, K., Li, R., & Zeiler, W. (2016) · Building and Environment · doi:10.1016/j.buildenv.2016.06.031 · Cited by 259
Energy performance gap in refurbished German dwellings: Lesson learned from a field test
Calı̀, D., Osterhage, T., Streblow, R., & Müller, D. (2016) · Energy and Buildings · doi:10.1016/j.enbuild.2016.05.020 · Cited by 249
Energy consumption in buildings and female thermal demand
Kingma, B., & van Marken Lichtenbelt, W. (2015) · Nature Climate Change · doi:10.1038/nclimate2741 · Cited by 240
Self-citationComfort under personally controlled air movement in warm and humid environments
Zhai, Y., Zhang, H., Zhang, Y., Pasut, W., Arens, E., & Meng, Q. (2013) · Building and Environment · doi:10.1016/j.buildenv.2013.03.022 · Cited by 231
Human metabolic rate and thermal comfort in buildings: The problem and challenge
Luo, M., Wang, Z., Ke, K., Cao, B., Zhai, Y., & Zhou, X. (2018) · Building and Environment · doi:10.1016/j.buildenv.2018.01.005 · Cited by 231
FIELD STUDIES OF THERMAL COMFORD COMPARED AND APPLIED.
Humphreys, M. (1976) · Cited by 223
Jazizadeh, F., Ghahramani, A., Becerik-Gerber, B., Kichkaylo, T., & Orosz, M. D. (2013) · Energy and Buildings · doi:10.1016/j.enbuild.2013.11.066 · Cited by 221
Heat Acclimation Decay and Re-Induction: A Systematic Review and Meta-Analysis
Daanen, H. A. M., Racinais, S., & Périard, J. D. (2017) · Sports Medicine · doi:10.1007/s40279-017-0808-x · Cited by 219
Dynamic predictive clothing insulation models based on outdoor air and indoor operative temperatures
Schiavon, S., & Lee, K. H. (2013) · Building and Environment · doi:10.1016/j.buildenv.2012.08.024 · Cited by 208
Beyond the classic thermoneutral zone: Including thermal comfort
Kingma, B. R., Frijns, A. J., Schellen, L., & van Marken Lichtenbelt, W. D. (2014) · Temperature · doi:10.4161/temp.29702 · Cited by 207
Self-citationde Dear, R. (2004) · Indoor Air · doi:10.1111/j.1600-0668.2004.00270.x · Cited by 207
Thermal comfort in offices in India: Behavioral adaptation and the effect of age and gender
Indraganti, M., Ooka, R., & Rijal, H. B. (2015) · Energy and Buildings · doi:10.1016/j.enbuild.2015.05.042 · Cited by 207
Schellen, L., Loomans, M. G. L. C., de Wit, M. H., Olesen, B. W., & Lichtenbelt, W. D. V. M. (2012) · Physiology & Behavior · doi:10.1016/j.physbeh.2012.07.008 · Cited by 206
Cedeño Laurent, J. G., Williams, A., Oulhote, Y., Zanobetti, A., Allen, J. G., & Spengler, J. D. (2018) · PLoS Medicine · doi:10.1371/journal.pmed.1002605 · Cited by 205 · cited 1×
“It is broadly established that heat waves and cold spells are associated with thermal discomfort, decreased physical and cognitive performance [36], and increased mortality [37].”
BackgroundReport on thermal comfort and building energy studies in Jakarta—Indonesia
Karyono, T. H. (2000) · Building and Environment · doi:10.1016/s0360-1323(98)00066-3 · Cited by 205
Impact of stress on metabolism and energy balance
Rabasa, C., & Dickson, S. L. (2016) · Current Opinion in Behavioral Sciences · doi:10.1016/j.cobeha.2016.01.011 · Cited by 201
Havenith, G., & van Middendorp, H. (1990) · European Journal of Applied Physiology and Occupational Physiology · doi:10.1007/bf00236062 · Cited by 198
Impaired defense of core temperature in aged humans during mild cold stress
DeGroot, D. W., & Kenney, W. L. (2006) · American Journal of Physiology-Regulatory, Integrative and Comparative Physiology · doi:10.1152/ajpregu.00074.2006 · Cited by 191
Hemingway, A. (1963) · Physiological Reviews · doi:10.1152/physrev.1963.43.3.397 · Cited by 190
First principles modeling of thermal sensation responses in steady-state and transient conditions
Fiala, D., Lomas, K. J., & Stohrer, M. (2003) · Loughborough University Institutional Repository (Loughborough University) · Cited by 177
Luo, M., Cao, B., Ji, W., Ouyang, Q., Lin, B., & Zhu, Y. (2015) · Energy and Buildings · doi:10.1016/j.enbuild.2015.11.004 · Cited by 176
How is the circadian rhythm of core body temperature regulated?
Kr�uchi, K. (2002) · Clinical Autonomic Research · doi:10.1007/s10286-002-0043-9 · Cited by 174
Thermal comfort of heterogeneous and dynamic indoor conditions — An overview
Mishra, A. K., Loomans, M. G. L. C., & Hensen, J. L. M. (2016) · Building and Environment · doi:10.1016/j.buildenv.2016.09.016 · Cited by 167
Weather, clothing and thermal adaptation to indoor climate
Morgan, C., & de Dear, R. (2003) · Climate Research · doi:10.3354/cr024267 · Cited by 166
Superficial shell insulation in resting and exercising men in cold water
Veicsteinas, A., Ferretti, G., & Rennie, D. W. (1982) · Journal of Applied Physiology · doi:10.1152/jappl.1982.52.6.1557 · Cited by 161 · cited 2×
“The maximum tissue insulation can be adjusted for subcutaneous fat and skin thickness [134,135] to discriminate between lean and obese (but not adults vs.”
BackgroundPeople's clothing behaviour according to external weather and indoor environment
De Carli, M., Olesen, B. W., Zarrella, A., & Zecchin, R. (2007) · Building and Environment · doi:10.1016/j.buildenv.2006.06.038 · Cited by 149
Luo, M., Cao, B., Zhou, X. J., Li, M., Zhang, J., Ouyang, Q., & Zhu, Y. (2014) · Energy and Buildings · doi:10.1016/j.enbuild.2013.12.057 · Cited by 149
Patient thermal comfort requirement for hospital environments in Taiwan
Hwang, R.-L., Lin, T.-P., Cheng, M.-J., & Chien, J.-H. (2007) · Building and Environment · doi:10.1016/j.buildenv.2006.07.035 · Cited by 148
Literature review on thermal comfort in transient conditions
Hensen, J. L. M. (1990) · Building and Environment · doi:10.1016/0360-1323(90)90004-b · Cited by 147
The effect of occupancy on perceived control, neutral temperature, and behavioral patterns
Schweiker, M., & Wagner, A. (2016) · Energy and Buildings · doi:10.1016/j.enbuild.2015.10.051 · Cited by 146
Self-citationHavenith, G., Coenen, J. M. L., Kistemaker, L., & Kenney, W. L. (1998) · European Journal of Applied Physiology · doi:10.1007/s004210050327 · Cited by 146
Could increased time spent in a thermal comfort zone contribute to population increases in obesity?
Johnson, F., Mavrogianni, A., Ucci, M., Vidal‐Puig, A., & Wardle, J. (2011) · Obesity Reviews · doi:10.1111/j.1467-789x.2010.00851.x · Cited by 143
Projections of heat waves with high impact on human health in Europe
Amengual, A., Homar, V., Romero, R., Brooks, H. E., Ramis, C., Gordaliza, M., & Alonso, S. (2014) · Global and Planetary Change · doi:10.1016/j.gloplacha.2014.05.006 · Cited by 141
A framework for an adaptive thermal heat balance model (ATHB)
Schweiker, M., & Wagner, A. (2015) · Building and Environment · doi:10.1016/j.buildenv.2015.08.018 · Cited by 140
Self-citationHuman whole body cold adaptation
Daanen, H. A. M., & Lichtenbelt, W. D. V. M. (2016) · Temperature · doi:10.1080/23328940.2015.1135688 · Cited by 140
Hancock, P. A., & Vasmatzidis, I. (1998) · Ergonomics · doi:10.1080/001401398186469 · Cited by 136
Heat acclimation improves cutaneous vascular function and sweating in trained cyclists
Lorenzo, S., & Minson, C. T. (2010) · Journal of Applied Physiology · doi:10.1152/japplphysiol.00725.2010 · Cited by 135
Hayward, M. G., & Keatinge, W. R. (1981) · The Journal of Physiology · doi:10.1113/jphysiol.1981.sp013946 · Cited by 134
Yang, W., & Zhang, G. (2008) · International Journal of Biometeorology · doi:10.1007/s00484-007-0133-4 · Cited by 134
Halawa, E., van Hoof, J., & Soebarto, V. (2014) · Renewable and Sustainable Energy Reviews · doi:10.1016/j.rser.2014.05.040 · Cited by 133
Rijal, H. B., Tuohy, P. G., Humphreys, M., Nicol, F., Samuel, A., Raja, I. A., & Clarke, J. A. (2008) · Strathprints: The University of Strathclyde institutional repository (University of Strathclyde) · Cited by 132
Thermal comfort assessment and application of radiant cooling: A case study
Memon, R. A., Chirarattananon, S., & Vangtook, P. (2008) · Building and Environment · doi:10.1016/j.buildenv.2006.04.025 · Cited by 130
Thermal pleasure in built environments: alliesthesia in different thermoregulatory zones
Parkinson, T., de Dear, R., & Candido, C. (2016) · Building Research & Information · doi:10.1080/09613218.2015.1059653 · Cited by 126
Energetics of stress: linking plasma cortisol levels to metabolic rate in mammals
Haase, C. G., Long, A. K., & Gillooly, J. F. (2016) · Biology Letters · doi:10.1098/rsbl.2015.0867 · Cited by 120
Seasonal Variation in Total Energy Expenditure and Physical Activity in Dutch Young Adults
Plasqui, G., & Westerterp, K. R. (2004) · Obesity Research · doi:10.1038/oby.2004.80 · Cited by 117
Ring, J. W., & de Dear, R. (1991) · Indoor Air · doi:10.1111/j.1600-0668.1991.00009.x · Cited by 113
Rupp, R. F., Kim, J., de Dear, R., & Ghisi, E. (2018) · Building and Environment · doi:10.1016/j.buildenv.2018.02.049 · Cited by 113
Boerstra, A., Kulve, M. T., Toftum, J., Loomans, M. G. L. C., Olesen, B. W., & Hensen, J. J. (2015) · Building and Environment · doi:10.1016/j.buildenv.2014.12.022 · Cited by 111
Cold exposure – an approach to increasing energy expenditure in humans
Lichtenbelt, W. D. V. M., Kingma, B., van der Lans, A. A. J. J., & Schellen, L. (2014) · Trends in Endocrinology and Metabolism · doi:10.1016/j.tem.2014.01.001 · Cited by 110
Self-citationHealthy excursions outside the thermal comfort zone
van Marken Lichtenbelt, W., Hanssen, M., Pallubinsky, H., Kingma, B., & Schellen, L. (2017) · Building Research & Information · doi:10.1080/09613218.2017.1307647 · Cited by 109
Self-citationHori, S. (1995) · The Japanese Journal of Physiology · doi:10.2170/jjphysiol.45.921 · Cited by 106
Ethnic differences in thermoregulation: Genotypic versus phenotypic heat adaptation
Taylor, N. A. S. (2006) · Journal of Thermal Biology · doi:10.1016/j.jtherbio.2005.11.007 · Cited by 106
Web application for thermal comfort visualization and calculation according to ASHRAE Standard 55
Schiavon, S., Hoyt, T., & Piccioli, A. (2013) · Building Simulation · doi:10.1007/s12273-013-0162-3 · Cited by 102
The influence of heated or cooled seats on the acceptable ambient temperature range
Zhang, Y. F., Wyon, D. P., Fang, L., & Melikov, A. K. (2007) · Ergonomics · doi:10.1080/00140130601154921 · Cited by 100
Exercise in a hot environment: the skin circulation
Johnson, J. M. (2010) · Scandinavian Journal of Medicine and Science in Sports · doi:10.1111/j.1600-0838.2010.01206.x · Cited by 96
Effect of local exposure on human responses
Zhang, Y., & Zhao, R. (2006) · Building and Environment · doi:10.1016/j.buildenv.2006.07.014 · Cited by 96
Van Someren, E. J. W. (2007) · American Journal of Physiology-Regulatory, Integrative and Comparative Physiology · doi:10.1152/ajpregu.00557.2006 · Cited by 89
Impact of climate change on thermal comfort, heating and cooling energy demand in Europe
Aebischer, B., Jakob, M., & Catenazzi, G. (2007) · Cited by 88
Anatomie, Physiologie, Pathophysiologie des Menschen
Vaupel, P. W., Schaible, H., & Mutschler, E. (2017) · doi:10.52778/9783804737242 · Cited by 87
Cao, B., Zhu, Y., Li, M., & Ouyang, Q. (2014) · Energy and Buildings · doi:10.1016/j.enbuild.2014.03.063 · Cited by 84
Review on modeling heat transfer and thermoregulatory responses in human body
Fu, M., Weng, W., Chen, W., & Luo, N. (2016) · Journal of Thermal Biology · doi:10.1016/j.jtherbio.2016.06.018 · Cited by 83
Kingma, B., Frijns, A. A., Saris, W. H. M., van Steenhoven, A. A., & Lichtenbelt, W. D. V. M. (2011) · Acta Physiologica · doi:10.1111/j.1748-1716.2011.02336.x · Cited by 80
Self-citationZhou, X., Ouyang, Q., Zhu, Y., Feng, C., & Zhang, X. (2013) · Indoor Air · doi:10.1111/ina.12067 · Cited by 75
Selecting air speeds for cooling at sedentary and non-sedentary office activity levels
Zhai, Y., Arens, E. A., Elsworth, K., & Zhang, H. (2017) · Building and Environment · doi:10.1016/j.buildenv.2017.06.027 · Cited by 69
Indices of thermoregulatory strain for moderate exercise in the heat
Gonzalez, R. R., Berglund, L. G., & Gagge, A. P. (1978) · Journal of Applied Physiology · doi:10.1152/jappl.1978.44.6.889 · Cited by 67
Predicting thermal comfort in office buildings in a Brazilian temperate and humid climate
Forgiarini Rupp, R., & Ghisi, E. (2017) · Energy and Buildings · doi:10.1016/j.enbuild.2017.03.039 · Cited by 66
Development and validation of a methodology to challenge the adaptive comfort model
Schweiker, M., Brasche, S., Bischof, W., Hawighorst, M., Voss, K., & Wagner, A. (2011) · Building and Environment · doi:10.1016/j.buildenv.2011.08.002 · Cited by 63
Self-citationThe influence of personality traits on occupant behavioural patterns
Schweiker, M., Hawighorst, M., & Wagner, A. (2016) · Energy and Buildings · doi:10.1016/j.enbuild.2016.09.019 · Cited by 63
Self-citationFoda, E., & Sirén, K. (2012) · Energy and Buildings · doi:10.1016/j.enbuild.2012.04.019 · Cited by 62
Thermophysiological adaptations to passive mild heat acclimation
Pallubinsky, H., Schellen, L., Kingma, B., Dautzenberg, B., van Baak, M. A., & Lichtenbelt, W. D. V. M. (2017) · Temperature · doi:10.1080/23328940.2017.1303562 · Cited by 55
Self-citationLocal cooling in a warm environment
Pallubinsky, H., Schellen, L., Rieswijk, T. A., Breukel, C. M. G. A. M., Kingma, B. R. M., & van Marken Lichtenbelt, W. D. (2016) · Energy and Buildings · doi:10.1016/j.enbuild.2015.12.016 · Cited by 54
Self-citationEffect of individual characteristics on a mathematical model of human thermoregulation
van Marken Lichtenbelt, W. D., Frijns, A. J. H., Fiala, D., Janssen, F. E. M., van Ooijen, A. M. J., & van Steenhoven, A. A. (2004) · Journal of Thermal Biology · doi:10.1016/j.jtherbio.2004.08.081 · Cited by 53
Critical environmental limits for exercising heat-acclimated lean and obese boys
Dougherty, K. A., Chow, M., & Larry Kenney, W. (2010) · European Journal of Applied Physiology · doi:10.1007/s00421-009-1290-4 · Cited by 48
Effects of different cooling principles on thermal sensation and physiological responses
Schellen, L., Loomans, M. G. L. C., de Wit, M. H., Olesen, B. W., & Lichtenbelt, W. D. V. M. (2013) · Energy and Buildings · doi:10.1016/j.enbuild.2013.01.007 · Cited by 46
Ventilation Parameters and Thermal Comfort of Naturally and Mechanically Ventilated Offices
Daghigh, R., Adam, N. M., & Sahari, B. B. (2009) · Indoor and Built Environment · doi:10.1177/1420326x09103013 · Cited by 45
Thermo-specific self-efficacy (specSE) in relation to perceived comfort and control
Hawighorst, M., Schweiker, M., & Wagner, A. (2016) · Building and Environment · doi:10.1016/j.buildenv.2016.03.014 · Cited by 45
Self-citationResponses of Lean and Obese Boys to Repeated Summer Exercise in the Heat Bouts
DOUGHERTY, K. A., CHOW, M., & KENNEY, W. L. (2009) · Medicine & Science in Sports & Exercise · doi:10.1249/mss.0b013e318185d341 · Cited by 44
Responses of Obese and Lean Girls Exercising under Heat and Thermoneutral Conditions
Leites, G. T., Sehl, P. L., Cunha, G. D. S., Detoni Filho, A., & Meyer, F. (2013) · The Journal of Pediatrics · doi:10.1016/j.jpeds.2012.10.047 · Cited by 42
Sensitivity to Temporal Variations in Thermal Conditions
GRIFFITHS, I. D., & McINTYRE, D. A. (1974) · Ergonomics · doi:10.1080/00140137408931380 · Cited by 41
Liu, W., Deng, Q., Ma, W., Huangfu, H., & Zhao, J. Y. (2013) · Building and Environment · doi:10.1016/j.buildenv.2013.05.024 · Cited by 40
Tissue heat transfer in water: lessons from the Korean divers
RENNIE, D. W. (1988) · Medicine & Science in Sports & Exercise · doi:10.1249/00005768-198810001-00016 · Cited by 38 · cited 2×
“For example, a thick subcutaneous fat layer increases insulation and attenuates heat exchange via the skin, which helps maintaining body core temperature in a cold environment [15,68].”
BackgroundResponses of Obese and Non-obese Boys Cycling in the Heat
Sehl, P., Leites, G., Martins, J., & Meyer, F. (2012) · International Journal of Sports Medicine · doi:10.1055/s-0031-1301314 · Cited by 33 · cited 1×
“Out of four laboratory studies in normal-weight and overweight children, three show significant differences in thermal sensation between the two groups [70,74,77].”
BackgroundIncorporating neurophysiological concepts in mathematical thermoregulation models
Kingma, B., Vosselman, M. J., Frijns, A. A., van Steenhoven, A. A., & Lichtenbelt, W. D. V. M. (2013) · International Journal of Biometeorology · doi:10.1007/s00484-012-0628-5 · Cited by 31
Self-citationInfluences on the predictive performance of thermal sensation indices
Schweiker, M., & Wagner, A. (2017) · Building Research & Information · doi:10.1080/09613218.2017.1256673 · Cited by 31
Self-citationAdams, J. D., Ganio, M. S., Burchfield, J. M., Matthews, A. C., Werner, R. N., Chokbengboun, A. J., Dougherty, E. K., & LaChance, A. A. (2015) · European Journal of Applied Physiology · doi:10.1007/s00421-014-3002-y · Cited by 30
Human Adaptation to Arctic Zones
Moran, E. F. (1981) · Annual Review of Anthropology · doi:10.1146/annurev.an.10.100181.000245 · Cited by 30
Building and occupant energetics: a physiological hypothesis
Lichtenbelt, W. D. V. M., & Kingma, B. (2013) · Architectural Science Review · doi:10.1080/00038628.2012.759377 · Cited by 29
Self-citationMishra, A. K., Kramer, R. P., Loomans, M. G. L. C., & Schellen, H. L. (2016) · Building and Environment · doi:10.1016/j.buildenv.2016.05.026 · Cited by 28
Self-citationThe effect of warmth acclimation on behaviour, thermophysiology and perception
Pallubinsky, H., Kingma, B., Schellen, L., Dautzenberg, B., van Baak, M. A., & Lichtenbelt, W. D. V. M. (2017) · Building Research & Information · doi:10.1080/09613218.2017.1278652 · Cited by 24
Self-citationStevens, C. J., Plews, D. J., Laursen, P. B., Kittel, A. B., & Taylor, L. K. (2017) · Temperature · doi:10.1080/23328940.2017.1365108 · Cited by 21
The role of clothing in thermal comfort: how people dress in a temperate and humid climate in Brazil
Vecchi, R. D., Lamberts, R., & Cândido, C. (2016) · Ambiente Construído · doi:10.1590/s1678-86212017000100124 · Cited by 20
Exploring internal body heat balance to understand thermal sensation
Kingma, B., Schweiker, M., Wagner, A., & Lichtenbelt, W. D. V. M. (2017) · Building Research & Information · doi:10.1080/09613218.2017.1299996 · Cited by 20
Self-citationDiversity in Thermal Sensation: drivers of variance and methodological artefacts
Shipworth, D., Huebner, G. M., Schweiker, M., & Kingma, B. (2016) · Research Publications (Maastricht University) · Cited by 15
Self-citationMorning Anaerobic Performance Is Not Altered by Vigilance Impairment
Lericollais, R., Gauthier, A., Bessot, N., Zouabi, A., & Davenne, D. (2013) · PLoS ONE · doi:10.1371/journal.pone.0058638 · Cited by 12
Kramer, R., Schellen, L., Schellen, H., & Kingma, B. (2017) · Temperature · doi:10.1080/23328940.2017.1301851 · Cited by 12
Self-citationEvaluating the performance of thermal sensation prediction with a biophysical model
Schweiker, M., Kingma, B., & Wagner, A. (2017) · Indoor Air · doi:10.1111/ina.12372 · Cited by 8
Self-citationOlesen, B. W., Toftum, J., & Kolařík, J. (2007) · Technical University of Denmark, DTU Orbit (Technical University of Denmark, DTU) · Cited by 2
Research works printed but not linked: 21
- Shipworth D, 2016, Proc. 9th Wind. Conf. Mak. Comf. Relev., 1
- de Dear RJ, 1997, Final Rep. ASHRAE Res. Proj. 884. Macquarie Univ. Sydney
- Rijal HB, 2008, ASHRAE Trans, 114, 555
- Humphreys MA, 1976, J Inst Heat Vent Eng, 44, 5
- Gagge AP, 1986, ASHRAE Trans, 92, 709
- Fiala D, 2009, ASHRAE Trans, 109, 179
- Aebischer B, 2007, Proc Eceee
- Hensel H, 1981, Monogr Physiol Soc, 38, 18
- Fanger PO, 1973, Br J Ind Med, 30, 313
- Tc IUPS, 2001, Jpn J Physiol, 51, 245
- Pallubinsky H, 2017, Temp (Austin, Tex.), 4, 176
- Candido C, 2012, Transform Mark Built Environ Routledge
- Paciuk M, 1990, Environ Des Res Assoc, 21, 303
- Auliciems A, 1975, Build Serv Eng, 43, 94
- Berglund L, 1978, Ashrae J, 20, 38
- Rohles JRF, 1985, ASHRAE Trans, 91, 116
- Kolarik J, 2005, Proc. Energy Effic. Technol. Indoor Environ. Gliwice, Poland
- Wyon D, 1971, Proc. 5th Int. Congr. heating, Vent. air Cond, 87
- Du Bois D, 1989, Nutrition, 5, 303
- Huebner GM, 2017, Int Conf Environ Psychol Coruna
- Brager GS, 2004, ASHRAE Trans, 110, 17
Cited by
Sorted by citations
Review of multi‐domain approaches to indoor environmental perception and behaviour
Schweiker, M., Ampatzi, E., Andargie, M. S., Andersen, R. K., Azar, E., Barthelmes, V. M., Berger, C., Bourikas, L., Carlucci, S., Chinazzo, G., et al. (2020) · Building and Environment · doi:10.1016/j.buildenv.2020.106804 · Cited by 353
Self-citationO’Brien, W., Wagner, A., Schweiker, M., Mahdavi, A., Day, J. K., Kjærgaard, M. B., Carlucci, S., Dong, B., Tahmasebi, F., Yan, D., et al. (2020) · Building and Environment · doi:10.1016/j.buildenv.2020.106738 · Cited by 345
“An extensive body of literature (including review papers) deals with single-domain influences, such as thermal [34-37], visual [38, 39], or aural [40, 41] perception.”
BackgroundSelf-citationPersonal comfort systems: A review on comfort, energy, and economics
Rawal, R., Schweiker, M., Kazanci, O. B., Vardhan, V., Jin, Q., & Duanmu, L. (2020) · Energy and Buildings · doi:10.1016/j.enbuild.2020.109858 · Cited by 239
“These ‘personalised’ settings help fine tune the cooling, heating, and ventilation as per the occupant’s needs, which depends on factors such as the age, gender, clothing levels, metabolic rates, personal preference, etc. [25]–[28].”
BackgroundSelf-citationReview on occupant-centric thermal comfort sensing, predicting, and controlling
Xie, J., Li, H., Li, C., Zhang, J., & Luo, M. (2020) · Energy and Buildings · doi:10.1016/j.enbuild.2020.110392 · Cited by 214
High-density thermal sensitivity maps of the human body
Luo, M., Wang, Z., Zhang, H., Arens, E. A., Filingeri, D., Jin, L., Ghahramani, A., Chen, W., He, Y., & Si, B. (2019) · Building and Environment · doi:10.1016/j.buildenv.2019.106435 · Cited by 177
“A recent review [34] shows clear contributions from body composition, metabolic rate, thermal adaptation and perceived control, while the role of other potential contributors such as age and sex remain uncertain.”
Background
Metadata
- Authors
- Schweiker, M., Huebner, G. M., Kingma, B. R. M., Kramer, R., & Pallubinsky, H.
- Affiliations
- Karlsruhe Institute of Technology (DE)
- Energy Institute (GB)
- Netherlands Organisation for Applied Scientific Research (NL)
- Maastricht University (NL)
- Corresponding author
- Kingma, Boris R. M.
- Venue
- Temperature
- Publisher
- Informa UK Limited
- Published
- 2018-10-02
- Volume
- 5
- Issue
- 4
- Pages
- 308-342
- ISSN
- 2332-8940 (ISSN-L)
- 2332-8959
- PMC
- PMC6298492
- OpenAlex
- W2898597150
- Semantic Scholar
- 963169b7d9de143d8748abbbac298d0661e83499
- Cited by
- 231
- References
- 156
- Citations by year
- 2026: 49 · 2025: 23 · 2024: 35 · 2023: 26 · 2022: 26 · 2021: 33 · 2020: 26 · 2019: 13
- FWCI
- 1.99
- Type
- journal article
- Language
- en
- Open access
- hybrid
- doi.org
- Licence
- cc-by-nc-nd
- Locations
- Temperature (publishedVersion, cc-by-nc-nd)
- Europe PMC (PubMed Central) (publishedVersion, cc-by-nc-nd)
- PubMed Central (publishedVersion, cc-by-nc-nd)
- PubMed (publishedVersion)
- Research Publications (Maastricht University) (publishedVersion, cc-by-nc-nd)
- TU/e Research Portal (publishedVersion, other-oa)
- Repository KITopen (Karlsruhe Institute of Technology) (submittedVersion, cc-by-nc-nd)
- TNO Repository (submittedVersion)
- TU/e Research Portal (submittedVersion)
- UCL Discovery (University College London) (submittedVersion)
- Repository hosted by TU Delft Library (TU Delft) (submittedVersion)
- Data Archiving and Networked Services (DANS) (submittedVersion, other-oa)
- TU/e Research Portal (submittedVersion, other-oa)
- Research Publications (Maastricht University) (submittedVersion, other-oa)
- KITopen
- Funders
- Heidelberger Akademie der Wissenschaften (WIN-Kolleg Thermal comfort and pain)
- Horizon 2020 (668786)
- RCUK Centre for Energy Epidemiology (EP/K011839/1)
- Topics
- Physical Sciences › Engineering › Building and Construction › Building Energy and Comfort Optimization
- Health Sciences › Medicine › Physiology (medical) › Thermoregulation and physiological responses
- Physical Sciences › Environmental Science › Environmental Engineering › Urban Heat Island Mitigation
- Keywords
- thermal sensation, individual differences, thermal comfort models, thermoneutral zone, psychological factors, perceived control, body composition, metabolic rate, thermal adaptation, aging, sex differences, age differences
About these checks
Registry, retraction, Cites and statistics results are computed, not judged, with one exception: a printed reference that no index lists is read once by a model before it counts as a citation error. Claims are extracted by a model and kept only when their quote appears verbatim in the text; each cited source is then checked, with a model’s help, for whether it says what the claim relies on. Those verdicts can be wrong — read the claim’s quote and the cited source before relying on one.
A language model drew the claims from the paper on 2026-10-10, under version 3 of the claim definition (model deepseek-v4.1-flash, prompt extract-v3).
A second model labelled each claim on 2026-10-10 (model jev-1.13-20260917, definition revision gold-guideline-v0.2).
Statistics and arithmetic are recomputed, not judged.
Confidence bands are shown only for fields calibrated on our annotated test set. None is calibrated yet, so no band is shown.
What counts as a claim ›How we measure confidence ›How we check this ›
Are you an author, or do you see a problem with this page? Request a review
