

The DOI matches its Crossref record; 77 of the 77 references it cites were found in a registry or an index; 2 of the 40 sources its claims cite were checked for support.
SARS-CoV-2 variants of concern partially escape humoral but not T cell responses in COVID-19 convalescent donors and vaccine recipients
Open accessAbstract
Infection- or vaccination-induced SARS-CoV-2 S–specific CD4 + T cells are indifferent to the S mutations of variants of concern.
Overview
AI snapshot
Written from the paper’s full text.
TL;DR
In a prospective cohort of 121 BNT162b2-vaccinated health care workers, prior COVID-19 led to rapid recall after one dose, while COVID-19–naive donors required two doses for comparable humoral responses. B.1.351 partially escaped neutralizing and Fc-mediated antibody responses, but CD4+ T cell responses to WT, B.1.1.7, and B.1.351 S proteins were comparable.
Key findings
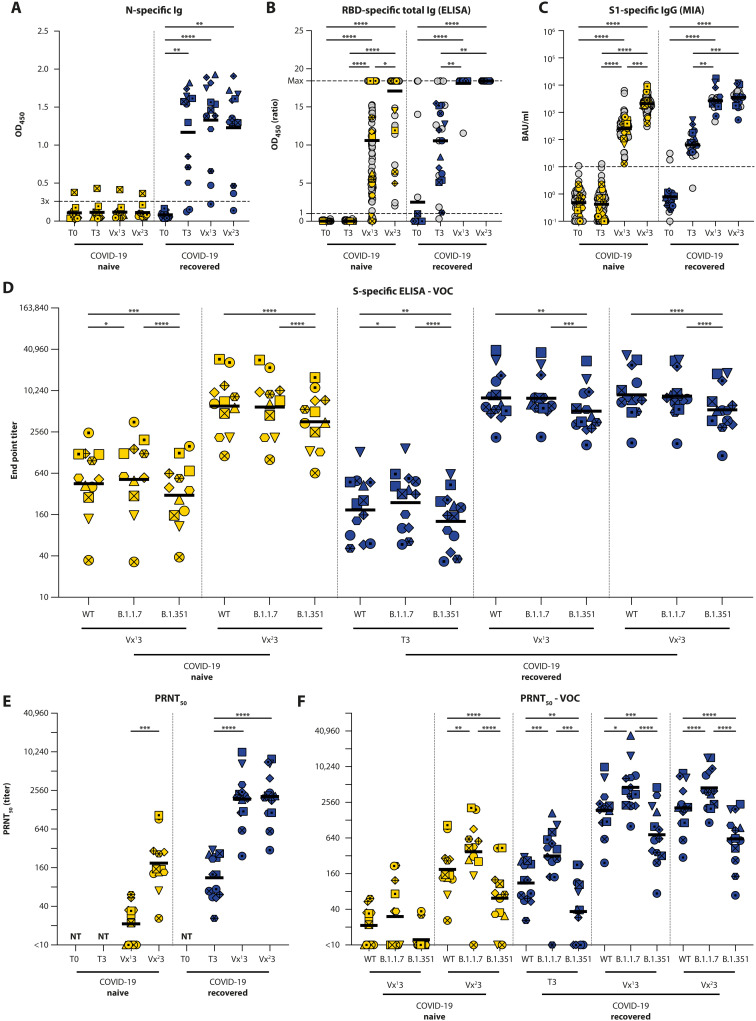
- Among 121 HCWs (23 COVID-19–recovered, 98 naive), one vaccine dose boosted binding antibodies in all recovered donors; in naive donors, 92.5% had detectable anti-RBD Ig after one dose but only 53.2% had OD ratio >10, rising after dose two to all detectable and 93.3% with ratio >10. S1 IgG by MIA rose from geometric mean 252.6 ± 49.55 to 2088.5 ± 287.5 BAU/ml in naive donors after the second dose (P < 0.0001).
- Neutralizing antibodies against WT were detected in all 13 recovered donors before vaccination; one dose boosted PRNT50 to a geometric mean plateau of 1:1874. Naive donors reached a lower peak after two doses (geometric mean titer 1:189, P < 0.0001 vs recovered). Against B.1.351, titers were consistently lower: 2.7-fold and 3.3-fold decreases post-vaccinations 1 and 2 in recovered donors, and a 3.1-fold decrease after dose two in naive donors; B.1.1.7 titers were higher (2.5-fold and 2.2-fold increases in recovered donors).
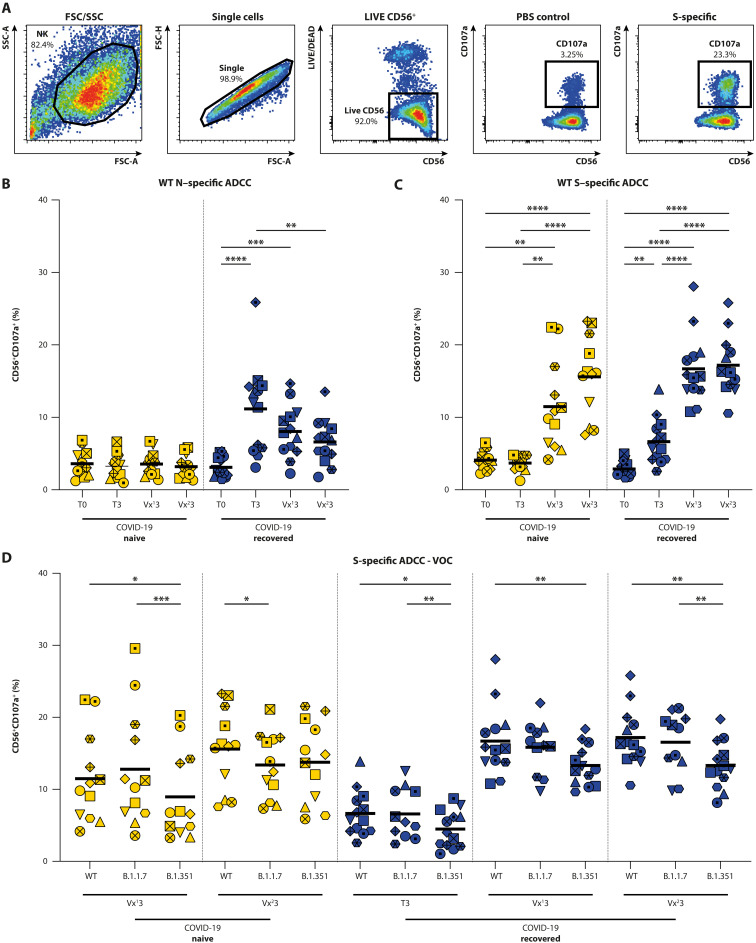
- S-specific ADCC-mediating antibodies were induced by infection and vaccination, with comparable activity against WT and B.1.1.7 S, but significantly reduced activity against B.1.351 S at almost all time points in both naive and recovered donors.
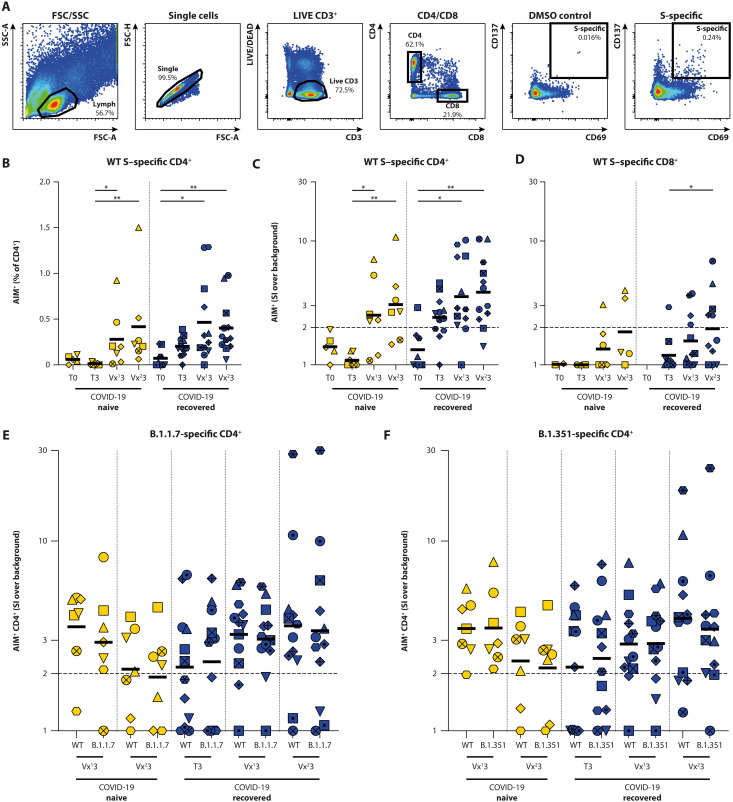
- CD4+ T cell responses did not differ between WT S and B.1.1.7 S or WT S and B.1.351 S. In naive donors, 5 of 7 were CD4+ T cell responders after one or two vaccinations; in recovered donors, 8 of 12 responded before vaccination and 10 of 12 after one or two vaccinations. CD8+ S-specific responses were difficult to detect and were not used to draw conclusions on VOC cross-reactivity.
Methods
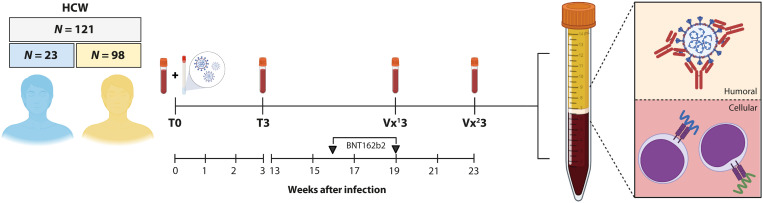
- Prospective cohort of 121 symptomatic HCWs in the Netherlands enrolled from April 2020; 98 classified COVID-19–naive and 23 COVID-19–recovered by RT-PCR and serology. All received two BNT162b2 mRNA doses 21 days apart. Binding antibody assays were performed on all 121; in-depth humoral analyses on 25 (13 recovered, 12 naive); T cell analyses on 20 (13 recovered, 7 naive).
- Humoral assays included Wantai RBD total Ig ELISA, Luminex S1 IgG MIA, in-house N/S ELISA, and PRNT50 using infectious WT SARS-CoV-2 (D614G), B.1.1.7, and B.1.351. ADCC was measured by NK92.05-CD16 degranulation (CD107a) against WT N, WT S, B.1.1.7 S, and B.1.351 S.
- T cell responses were measured by AIM flow cytometry (CD69/CD137 in CD4+ and CD8+ subsets) after stimulation with overlapping WT S peptide pools or peptide pools covering mutated regions of B.1.1.7 and B.1.351, with IFN-γ ELISA in a subset. Statistical analyses used GraphPad Prism 9.0.2.
Limitations
- The paper states the study population was selected HCWs, relatively young, predominantly female, and with mild COVID-19 if previously infected; it was underpowered to compare age groups or comorbidities.
- The paper states in-depth T cell profiling was limited to 20 donors, focused only on S-specific T cells, and could not further address CD8+ T cell responses to VOCs because of low SARS-CoV-2–specific CD8+ T cell frequency; peptide pools of 15-mers may have limited sensitivity, and some pre-exposure S-specific T cells were probably cross-reactive with seasonal human coronaviruses.
- The paper states it did not analyze the P.1 VOC, and future studies are needed to assess whether neutralizing antibody differences correlate with breakthrough infection risk and whether ADCC should be measured with infectious virus and primary cells. Evident from the text: the study reports immune responses, not clinical protection or breakthrough infection outcomes.
Model-written summary. Check it against the paper before relying on it.
Integrity signals
Registry
Cites
Statistics
Figures
Verification
Claims the paper makes
55 Own result · 18 Not checked yet · 12 Own method · 12 Own interpretation · 2 No basis given · 1 Partly supported · accuracy not yet measured
A result the paper reports from its own data — it cites no other source for it, so there is none to check. The quote shows it is in the paper.
In the paper
“Percentages of degranulating NK cells were comparable between WT and B.1.1.7 S at all time points, regardless of whether donors had been previously exposed to SARS-CoV-2 or not, and the number of vaccinations.”
§ SARS-CoV-2 variants of concern partially escape humoral but not T cell responses in COVID-19 convalescent donors and vaccine recipients > RESULTS > Antibodies have reduced Fc-mediated functionality against B.1.351
plain- Asserted: passes — The authors put it forward as true.
- Checkable: passes — It can be checked against evidence.
- Load-bearing: unclear — It is unclear whether the paper’s conclusions depend on it.
- Based: passes — The paper gives a reason why it holds.
A result the paper reports from its own data — it cites no other source for it, so there is none to check. The quote shows it is in the paper.
In the paper
“In both COVID-19–naive and –recovered donors and at all time points assessed, sera had reduced binding affinity for the B.1.351 S protein when compared with the WT S protein.”
§ SARS-CoV-2 variants of concern partially escape humoral but not T cell responses in COVID-19 convalescent donors and vaccine recipients > RESULTS > S-specific antibodies have reduced binding affinity for the B.1.351 S protein
plaindirect- Asserted: passes — The authors put it forward as true.
- Checkable: passes — It can be checked against evidence.
- Load-bearing: passes — The paper’s conclusions depend on it.
- Based: passes — The paper gives a reason why it holds.
A result the paper reports from its own data — it cites no other source for it, so there is none to check. The quote shows it is in the paper.
In the paper
“A nonsignificant trend for increasing CD8+ T cell responses (both AIM and SI, Fig. 4D; data at T0 from COVID-19–recovered donors lacking due to low counts in CD8+ gate) was observed after vaccination of COVID-19–negative donors.”
§ SARS-CoV-2 variants of concern partially escape humoral but not T cell responses in COVID-19 convalescent donors and vaccine recipients > RESULTS > Rapid boosting of S-specific T cells in COVID-19–recovered donors
plainconditionaln = 7- Asserted: passes — The authors put it forward as true.
- Checkable: passes — It can be checked against evidence.
- Load-bearing: unclear — It is unclear whether the paper’s conclusions depend on it.
- Based: passes — The paper gives a reason why it holds.
A result the paper reports from its own data — it cites no other source for it, so there is none to check. The quote shows it is in the paper.
In the paper
“Neutralizing antibodies against WT SARS-CoV-2 (which contained the D614G mutation) were detected in all sera collected from N = 13 COVID-19–recovered HCWs before vaccination.”
§ SARS-CoV-2 variants of concern partially escape humoral but not T cell responses in COVID-19 convalescent donors and vaccine recipients > RESULTS > Neutralizing antibodies have reduced activity against B.1.351
plainn = 13- Asserted: passes — The authors put it forward as true.
- Checkable: passes — It can be checked against evidence.
- Load-bearing: unclear — It is unclear whether the paper’s conclusions depend on it.
- Based: passes — The paper gives a reason why it holds.
A result the paper reports from its own data — it cites no other source for it, so there is none to check. The quote shows it is in the paper.
In the paper
“In COVID-19–naive donors, WT S–specific CD4+ T cells expressing AIM (CD69+CD137+) were detected after the first and second vaccination (Fig. 4B, T3 to Vx13, P = 0.0374; T3 to Vx23, P = 0.0016, Kruskal-Wallis test).”
§ SARS-CoV-2 variants of concern partially escape humoral but not T cell responses in COVID-19 convalescent donors and vaccine recipients > RESULTS > Rapid boosting of S-specific T cells in COVID-19–recovered donors
plain- Asserted: passes — The authors put it forward as true.
- Checkable: passes — It can be checked against evidence.
- Load-bearing: unclear — It is unclear whether the paper’s conclusions depend on it.
- Based: passes — The paper gives a reason why it holds.
A result the paper reports from its own data — it cites no other source for it, so there is none to check. The quote shows it is in the paper.
In the paper
“whereas titers against B.1.351 were consistently lower [2.7-fold and 3.3-fold decrease post-vaccinations 1 and 2, P = 0.0004 and P < 0.0001 (RM one-way ANOVA), respectively] (summarized in table S3).”
§ SARS-CoV-2 variants of concern partially escape humoral but not T cell responses in COVID-19 convalescent donors and vaccine recipients > RESULTS > Neutralizing antibodies have reduced activity against B.1.351
plaincorrelational- Asserted: passes — The authors put it forward as true.
- Checkable: passes — It can be checked against evidence.
- Load-bearing: passes — The paper’s conclusions depend on it.
- Based: passes — The paper gives a reason why it holds.
A result the paper reports from its own data — it cites no other source for it, so there is none to check. The quote shows it is in the paper.
In the paper
“However, ADCC-mediating antibodies had significantly reduced activity against B.1.351 S at almost all time points in COVID-19–naive and –recovered donors (tested by mixed-effect models; Fig. 3D).”
§ SARS-CoV-2 variants of concern partially escape humoral but not T cell responses in COVID-19 convalescent donors and vaccine recipients > RESULTS > Antibodies have reduced Fc-mediated functionality against B.1.351
plaindirect- Asserted: passes — The authors put it forward as true.
- Checkable: passes — It can be checked against evidence.
- Load-bearing: passes — The paper’s conclusions depend on it.
- Based: passes — The paper gives a reason why it holds.
A result the paper reports from its own data — it cites no other source for it, so there is none to check. The quote shows it is in the paper.
In the paper
“In COVID-19–naive participants before vaccination, CD8+ T cell responses were never observed.”
§ SARS-CoV-2 variants of concern partially escape humoral but not T cell responses in COVID-19 convalescent donors and vaccine recipients > RESULTS > Rapid boosting of S-specific T cells in COVID-19–recovered donors
plainn = 7- Asserted: passes — The authors put it forward as true.
- Checkable: passes — It can be checked against evidence.
- Load-bearing: unclear — It is unclear whether the paper’s conclusions depend on it.
- Based: passes — The paper gives a reason why it holds.
A result the paper reports from its own data — it cites no other source for it, so there is none to check. The quote shows it is in the paper.
In the paper
“In N = 13 COVID-19–recovered donors, N-specific ADCC-mediating antibodies were detected in the convalescent phase initially. These N-specific antibodies gradually waned over time (convalescent versus post-vaccination 2: P = 0.005, Friedman test).”
§ SARS-CoV-2 variants of concern partially escape humoral but not T cell responses in COVID-19 convalescent donors and vaccine recipients > RESULTS > Antibodies have reduced Fc-mediated functionality against B.1.351
plaincorrelationaln = 13 ·- Asserted: passes — The authors put it forward as true.
- Checkable: passes — It can be checked against evidence.
- Load-bearing: unclear — It is unclear whether the paper’s conclusions depend on it.
- Based: passes — The paper gives a reason why it holds.
A result the paper reports from its own data — it cites no other source for it, so there is none to check. The quote shows it is in the paper.
In the paper
“In COVID-19–naive HCWs, a single vaccine dose led to detectable levels of neutralizing antibodies in 7 of 12 donors.”
§ SARS-CoV-2 variants of concern partially escape humoral but not T cell responses in COVID-19 convalescent donors and vaccine recipients > RESULTS > Neutralizing antibodies have reduced activity against B.1.351
plaindirectn = 12- Asserted: passes — The authors put it forward as true.
- Checkable: passes — It can be checked against evidence.
- Load-bearing: unclear — It is unclear whether the paper’s conclusions depend on it.
- Based: passes — The paper gives a reason why it holds.
- Probably not a substantial claim. 28
- It may state two separate claims as one. 30
- The quote only partly states this claim. 1
The cited sources support only part of this claim — read each source’s verdict below.
In the paper
“In ex vivo studies, NK cells from patients with COVID-19 displayed impaired cytotoxicity (64, 65)”
§ SARS-CoV-2 variants of concern partially escape humoral but not T cell responses in COVID-19 convalescent donors and vaccine recipients > DISCUSSION
What the sources say
- Supportedcites [64] M. Zheng, Y. Gao, G. Wang, G. Song, S. Liu, D. Sun, Y. Xu, Z. Tian, Functional exhaustion of antiviral lymphocytes in COVID-19 patients. Cell. Mol. Immunol. 17, 533– 535 (2020). 32203188 PMC7091858 source
The main text and Fig. 1c report reduced CD107a and other cytotoxic-function markers in NK cells from COVID-19 patients compared with healthy controls. The authors interpret these findings as functional exhaustion of cytotoxic lymphocytes, supporting the claim that patient NK cells displayed impaired cytotoxicity. (LLM, conf=0.88)
- Partly supportedcites [65] A. J. Wilk, A. Rustagi, N. Q. Zhao, J. Roque, G. J. Martinez-Colon, J. L. McKechnie, G. T. Ivison, T. Ranganath, R. Vergara, T. Hollis, L. J. Simpson, P. Grant, A. Subramanian, A. J. Rogers, C. A. Blish, A single-cell atlas of the peripheral immune response in patients with severe COVID-19. Nat. Med. 26, 1070– 1076 (2020). 32514174 PMC7382903 sourceExperimental — accuracy not yet measured
The NK-cell analysis (indexed as Abstract; page unavailable) reports depletion of the cytotoxic CD56dim subset in ventilator-dependent patients and exhaustion-marker expression in NK cells from most patients. It does not report an ex vivo cytotoxicity assay or demonstrate impaired killing, so the functional claim goes beyond these findings. (LLM, conf=0.85)
plain- Asserted: passes — The authors put it forward as true.
- Checkable: passes — It can be checked against evidence.
- Load-bearing: fails — The paper’s conclusions may not depend on it.
- Based: passes — The paper gives a reason why it holds.
Probably not a substantial claim. The paper’s conclusions may not depend on it.
- Supported
A result the paper reports from its own data — it cites no other source for it, so there is none to check. The quote shows it is in the paper.
In the paper
“In COVID-19–recovered donors, 8 of 12 responders were identified before vaccination, which increased to 10 of 12 responders after one or two vaccinations.”
§ SARS-CoV-2 variants of concern partially escape humoral but not T cell responses in COVID-19 convalescent donors and vaccine recipients > RESULTS > Rapid boosting of S-specific T cells in COVID-19–recovered donors
plaindirect- Asserted: passes — The authors put it forward as true.
- Checkable: passes — It can be checked against evidence.
- Load-bearing: unclear — It is unclear whether the paper’s conclusions depend on it.
- Based: passes — The paper gives a reason why it holds.
It may state two separate claims as one.
A result the paper reports from its own data — it cites no other source for it, so there is none to check. The quote shows it is in the paper.
In the paper
“Percentages of CD107a+ NK cells were significantly correlated to the binding antibody titers (shown in Fig. 2D); however, the correlation was not evident at all time points assessed separately (fig. S2).”
§ SARS-CoV-2 variants of concern partially escape humoral but not T cell responses in COVID-19 convalescent donors and vaccine recipients > RESULTS > Antibodies have reduced Fc-mediated functionality against B.1.351
plaincorrelational- Asserted: passes — The authors put it forward as true.
- Checkable: passes — It can be checked against evidence.
- Load-bearing: unclear — It is unclear whether the paper’s conclusions depend on it.
- Based: passes — The paper gives a reason why it holds.
It may state two separate claims as one.
A result the paper reports from its own data — it cites no other source for it, so there is none to check. The quote shows it is in the paper.
In the paper
“Neutralizing antibodies were detected after one vaccination in 7 of 12, 6 of 12, and 2 of 12 COVID-19–naive donors against WT SARS-CoV-2, B.1.1.7, and B.1.351, respectively. A second vaccine dose boosted that to 12 of 12, 11 of 12, and 10 of 12.”
§ SARS-CoV-2 variants of concern partially escape humoral but not T cell responses in COVID-19 convalescent donors and vaccine recipients > RESULTS > Neutralizing antibodies have reduced activity against B.1.351
plaindirectn = 12- Asserted: passes — The authors put it forward as true.
- Checkable: passes — It can be checked against evidence.
- Load-bearing: passes — The paper’s conclusions depend on it.
- Based: passes — The paper gives a reason why it holds.
It may state two separate claims as one.
A result the paper reports from its own data — it cites no other source for it, so there is none to check. The quote shows it is in the paper.
In the paper
“In COVID-19–recovered donors, S-specific CD4+ T cells were already detected in the convalescent phase, which were boosted after the first vaccination. A second vaccination did not lead to an additional boosting effect (Fig. 4B).”
§ SARS-CoV-2 variants of concern partially escape humoral but not T cell responses in COVID-19 convalescent donors and vaccine recipients > RESULTS > Rapid boosting of S-specific T cells in COVID-19–recovered donors
plaindirect- Asserted: passes — The authors put it forward as true.
- Checkable: passes — It can be checked against evidence.
- Load-bearing: passes — The paper’s conclusions depend on it.
- Based: passes — The paper gives a reason why it holds.
It may state two separate claims as one.
A result the paper reports from its own data — it cites no other source for it, so there is none to check. The quote shows it is in the paper.
In the paper
“In prevaccination sera from COVID-19–recovered donors, neutralizing antibodies against WT SARS-CoV-2 (D614G), B.1.1.7, and B.1.351 were detected in 13 of 13, 12 of 13, and 7 of 13 donors, respectively (table S1).”
§ SARS-CoV-2 variants of concern partially escape humoral but not T cell responses in COVID-19 convalescent donors and vaccine recipients > RESULTS > Neutralizing antibodies have reduced activity against B.1.351
plainn = 13- Asserted: passes — The authors put it forward as true.
- Checkable: passes — It can be checked against evidence.
- Load-bearing: passes — The paper’s conclusions depend on it.
- Based: passes — The paper gives a reason why it holds.
It may state two separate claims as one.
A result the paper reports from its own data — it cites no other source for it, so there is none to check. The quote shows it is in the paper.
In the paper
“In COVID-19–naive donors, CD4+ T cell responders were not observed before vaccination, whereas five of seven responders were identified after one or two vaccinations.”
§ SARS-CoV-2 variants of concern partially escape humoral but not T cell responses in COVID-19 convalescent donors and vaccine recipients > RESULTS > Rapid boosting of S-specific T cells in COVID-19–recovered donors
plain- Asserted: passes — The authors put it forward as true.
- Checkable: passes — It can be checked against evidence.
- Load-bearing: unclear — It is unclear whether the paper’s conclusions depend on it.
- Based: passes — The paper gives a reason why it holds.
It may state two separate claims as one.
A result the paper reports from its own data — it cites no other source for it, so there is none to check. The quote shows it is in the paper.
In the paper
“The absence of S-specific antibodies before vaccination was confirmed by both assays in the COVID-19–naive cohort, whereas S-specific antibodies were detected before vaccination in 22 of 23 COVID-19–recovered donors [optical density (OD) ratio >1 in Wantai ELISA and binding antibody units (BAU)/ml >10.08 in MIA].”
§ SARS-CoV-2 variants of concern partially escape humoral but not T cell responses in COVID-19 convalescent donors and vaccine recipients > RESULTS > Rapid boosting of S-specific antibodies in COVID-19–recovered donors
boostedn = 23- Asserted: passes — The authors put it forward as true.
- Checkable: passes — It can be checked against evidence.
- Load-bearing: unclear — It is unclear whether the paper’s conclusions depend on it.
- Based: passes — The paper gives a reason why it holds.
It may state two separate claims as one.
A result the paper reports from its own data — it cites no other source for it, so there is none to check. The quote shows it is in the paper.
In the paper
“In MIA, all participants had detectable antibodies after one vaccination (Fig. 2C and table S1).”
§ SARS-CoV-2 variants of concern partially escape humoral but not T cell responses in COVID-19 convalescent donors and vaccine recipients > RESULTS > Rapid boosting of S-specific antibodies in COVID-19–recovered donors
plain- Asserted: fails — The authors may not put it forward as true.
- Checkable: passes — It can be checked against evidence.
- Load-bearing: fails — The paper’s conclusions may not depend on it.
- Based: fails — The paper may give no reason why it holds.
Probably not a substantial claim. The authors may not put it forward as true. The paper’s conclusions may not depend on it. The paper may give no reason why it holds. The quote only partly states this claim.
A result the paper reports from its own data — it cites no other source for it, so there is none to check. The quote shows it is in the paper.
In the paper
“In COVID-19–naive participants, 92.5% had detectable total anti-RBD Ig after one vaccine dose, but only 53.2% had an OD ratio >10 (Fig. 2B).”
§ SARS-CoV-2 variants of concern partially escape humoral but not T cell responses in COVID-19 convalescent donors and vaccine recipients > RESULTS > Rapid boosting of S-specific antibodies in COVID-19–recovered donors
plain- Asserted: passes — The authors put it forward as true.
- Checkable: passes — It can be checked against evidence.
- Load-bearing: unclear — It is unclear whether the paper’s conclusions depend on it.
- Based: passes — The paper gives a reason why it holds.
It may state two separate claims as one.
A result the paper reports from its own data — it cites no other source for it, so there is none to check. The quote shows it is in the paper.
In the paper
“A single vaccination boosted the PRNT50 titers to a geometric mean plateau value of 1:1874 [P < 0.0001, repeated measures (RM) one-way analysis of variance (ANOVA)]. Titers did not increase further after a second vaccination.”
§ SARS-CoV-2 variants of concern partially escape humoral but not T cell responses in COVID-19 convalescent donors and vaccine recipients > RESULTS > Neutralizing antibodies have reduced activity against B.1.351
plaindirectn = 13 ·- Asserted: passes — The authors put it forward as true.
- Checkable: passes — It can be checked against evidence.
- Load-bearing: unclear — It is unclear whether the paper’s conclusions depend on it.
- Based: passes — The paper gives a reason why it holds.
It may state two separate claims as one.
A result the paper reports from its own data — it cites no other source for it, so there is none to check. The quote shows it is in the paper.
In the paper
“N-specific antibodies were not detected in 11 of 12 COVID-19–naive donors (1 low positive), whereas substantial levels of N-specific antibodies were detected in 12 of 13 COVID-19–recovered donors.”
§ SARS-CoV-2 variants of concern partially escape humoral but not T cell responses in COVID-19 convalescent donors and vaccine recipients > RESULTS > Rapid boosting of S-specific antibodies in COVID-19–recovered donors
plaincorrelationaln = 12- Asserted: passes — The authors put it forward as true.
- Checkable: passes — It can be checked against evidence.
- Load-bearing: unclear — It is unclear whether the paper’s conclusions depend on it.
- Based: passes — The paper gives a reason why it holds.
It may state two separate claims as one.
A result the paper reports from its own data — it cites no other source for it, so there is none to check. The quote shows it is in the paper.
In the paper
“A clear boosting effect after the second vaccination was observed in COVID-19–naive donors. All participants then had detectable antibodies, and 93.3% had a ratio >10 in ELISA, and significantly higher levels of S1-specific IgG were observed in MIA (geometric mean 252.6 ± 49.55 to 2088.5 ± 287.5 BAU/ml, P < 0.0001, Friedman test).”
§ SARS-CoV-2 variants of concern partially escape humoral but not T cell responses in COVID-19 convalescent donors and vaccine recipients > RESULTS > Rapid boosting of S-specific antibodies in COVID-19–recovered donors
boosteddirect- Asserted: passes — The authors put it forward as true.
- Checkable: passes — It can be checked against evidence.
- Load-bearing: unclear — It is unclear whether the paper’s conclusions depend on it.
- Based: passes — The paper gives a reason why it holds.
It may state two separate claims as one.
A result the paper reports from its own data — it cites no other source for it, so there is none to check. The quote shows it is in the paper.
In the paper
“The quantitatively interpretable MIA also showed that a second vaccination of COVID-19–recovered participants did not further boost S1-specific IgG antibodies; a plateau was reached after a single shot.”
§ SARS-CoV-2 variants of concern partially escape humoral but not T cell responses in COVID-19 convalescent donors and vaccine recipients > RESULTS > Rapid boosting of S-specific antibodies in COVID-19–recovered donors
plain- Asserted: passes — The authors put it forward as true.
- Checkable: passes — It can be checked against evidence.
- Load-bearing: unclear — It is unclear whether the paper’s conclusions depend on it.
- Based: passes — The paper gives a reason why it holds.
It may state two separate claims as one.
A result the paper reports from its own data — it cites no other source for it, so there is none to check. The quote shows it is in the paper.
In the paper
“After one vaccination, all COVID-19–recovered participants showed a surge in antibody levels with OD ratios >10 detected by ELISA (Fig. 2B, P < 0.0001, Friedman test).”
- Also stated in: § Rapid boosting of S-specific antibodies in COVID-19–recovered donors · plain
“This increase was confirmed by MIA (Fig. 2C, P = 0.0001, Friedman test; table S1).”
§ SARS-CoV-2 variants of concern partially escape humoral but not T cell responses in COVID-19 convalescent donors and vaccine recipients > RESULTS > Rapid boosting of S-specific antibodies in COVID-19–recovered donors
plaindirect- Asserted: passes — The authors put it forward as true.
- Checkable: passes — It can be checked against evidence.
- Load-bearing: unclear — It is unclear whether the paper’s conclusions depend on it.
- Based: passes — The paper gives a reason why it holds.
It may state two separate claims as one.
- Also stated in: § Rapid boosting of S-specific antibodies in COVID-19–recovered donors · plain
A result the paper reports from its own data — it cites no other source for it, so there is none to check. The quote shows it is in the paper.
In the paper
“In COVID-19–recovered donors, ADCC-mediating antibodies were already boosted by a single vaccination to peak levels, and the second shot did not lead to an additional boosting (reminiscent of binding and neutralizing antibodies; see Fig. 2).”
§ SARS-CoV-2 variants of concern partially escape humoral but not T cell responses in COVID-19 convalescent donors and vaccine recipients > RESULTS > Antibodies have reduced Fc-mediated functionality against B.1.351
plaindirect- Asserted: passes — The authors put it forward as true.
- Checkable: passes — It can be checked against evidence.
- Load-bearing: unclear — It is unclear whether the paper’s conclusions depend on it.
- Based: passes — The paper gives a reason why it holds.
It may state two separate claims as one.
A result the paper reports from its own data — it cites no other source for it, so there is none to check. The quote shows it is in the paper.
In the paper
“PRNT50 values were boosted by a second vaccination to detectable levels in all donors (P = 0.0005, Wilcoxon test; table S1), but the peak titer was significantly lower compared with COVID-19–recovered participants (geometric mean titer 1:189, P < 0.0001, unpaired t test).”
§ SARS-CoV-2 variants of concern partially escape humoral but not T cell responses in COVID-19 convalescent donors and vaccine recipients > RESULTS > Neutralizing antibodies have reduced activity against B.1.351
plaindirectn = 12- Asserted: passes — The authors put it forward as true.
- Checkable: passes — It can be checked against evidence.
- Load-bearing: unclear — It is unclear whether the paper’s conclusions depend on it.
- Based: passes — The paper gives a reason why it holds.
It may state two separate claims as one.
A result the paper reports from its own data — it cites no other source for it, so there is none to check. The quote shows it is in the paper.
In the paper
“In COVID-19–naive donors, the first vaccination led to low-level detection of ADCC-mediating antibodies, which were further boosted by the second vaccination.”
§ SARS-CoV-2 variants of concern partially escape humoral but not T cell responses in COVID-19 convalescent donors and vaccine recipients > RESULTS > Antibodies have reduced Fc-mediated functionality against B.1.351
plaindirect- Asserted: passes — The authors put it forward as true.
- Checkable: passes — It can be checked against evidence.
- Load-bearing: unclear — It is unclear whether the paper’s conclusions depend on it.
- Based: passes — The paper gives a reason why it holds.
It may state two separate claims as one.
A result the paper reports from its own data — it cites no other source for it, so there is none to check. The quote shows it is in the paper.
In the paper
“In addition, at two time points, a slightly increased binding affinity for B.1.1.7 S was observed (Vx13 for naive donors and T3 for convalescent donors).”
§ SARS-CoV-2 variants of concern partially escape humoral but not T cell responses in COVID-19 convalescent donors and vaccine recipients > RESULTS > S-specific antibodies have reduced binding affinity for the B.1.351 S protein
plaincorrelational- Asserted: passes — The authors put it forward as true.
- Checkable: passes — It can be checked against evidence.
- Load-bearing: fails — The paper’s conclusions may not depend on it.
- Based: passes — The paper gives a reason why it holds.
Probably not a substantial claim. The paper’s conclusions may not depend on it.
A result the paper reports from its own data — it cites no other source for it, so there is none to check. The quote shows it is in the paper.
In the paper
“A single vaccination was sufficient to boost neutralizing antibodies to detectable levels for all SARS-CoV-2 variants, and a second dose did not further boost antibody titers.”
§ SARS-CoV-2 variants of concern partially escape humoral but not T cell responses in COVID-19 convalescent donors and vaccine recipients > RESULTS > Neutralizing antibodies have reduced activity against B.1.351
plaindirectn = 13- Asserted: passes — The authors put it forward as true.
- Checkable: passes — It can be checked against evidence.
- Load-bearing: unclear — It is unclear whether the paper’s conclusions depend on it.
- Based: passes — The paper gives a reason why it holds.
It may state two separate claims as one.
A result the paper reports from its own data — it cites no other source for it, so there is none to check. The quote shows it is in the paper.
In the paper
“In COVID-19–naive donors, WT S–specific ADCC-mediating antibodies were not detected before vaccination, whereas in COVID-19–recovered donors, WT S–specific ADCC-mediating antibodies were detected in the convalescent phase (Fig. 3C, P = 0.0038, RM one-way ANOVA; table S1).”
§ SARS-CoV-2 variants of concern partially escape humoral but not T cell responses in COVID-19 convalescent donors and vaccine recipients > RESULTS > Antibodies have reduced Fc-mediated functionality against B.1.351
plain- Asserted: passes — The authors put it forward as true.
- Checkable: passes — It can be checked against evidence.
- Load-bearing: unclear — It is unclear whether the paper’s conclusions depend on it.
- Based: passes — The paper gives a reason why it holds.
It may state two separate claims as one.
A result the paper reports from its own data — it cites no other source for it, so there is none to check. The quote shows it is in the paper.
In the paper
“In some sera, we observed increased binding to B.1.1.7 S by ELISA as well, but not at all time points”
§ SARS-CoV-2 variants of concern partially escape humoral but not T cell responses in COVID-19 convalescent donors and vaccine recipients > DISCUSSION
plain- Asserted: passes — The authors put it forward as true.
- Checkable: passes — It can be checked against evidence.
- Load-bearing: unclear — It is unclear whether the paper’s conclusions depend on it.
- Based: passes — The paper gives a reason why it holds.
It may state two separate claims as one.
The paper states this without a source or data behind it here, so there is nothing to check it against. The quote shows it is in the paper.
In the paper
“Because this sensitive assay is often used in diagnostic laboratories, we show here that the presence of antibodies in response to vaccination (in the absence or presence of preexisting SARS-CoV-2 immunity) can indeed be measured but not accurately quantified.”
§ SARS-CoV-2 variants of concern partially escape humoral but not T cell responses in COVID-19 convalescent donors and vaccine recipients > DISCUSSION
plain- Asserted: passes — The authors put it forward as true.
- Checkable: passes — It can be checked against evidence.
- Load-bearing: unclear — It is unclear whether the paper’s conclusions depend on it.
- Based: passes — The paper gives a reason why it holds.
It may state two separate claims as one.
A result the paper reports from its own data — it cites no other source for it, so there is none to check. The quote shows it is in the paper.
In the paper
“In COVID-19–recovered participants, CD8+ S–specific T cells were already observed in the convalescent phase, with increased levels after two vaccinations (P = 0.046, Wilcoxon rank test).”
§ SARS-CoV-2 variants of concern partially escape humoral but not T cell responses in COVID-19 convalescent donors and vaccine recipients > RESULTS > Rapid boosting of S-specific T cells in COVID-19–recovered donors
plaindirectn = 13 ·- Asserted: passes — The authors put it forward as true.
- Checkable: passes — It can be checked against evidence.
- Load-bearing: passes — The paper’s conclusions depend on it.
- Based: passes — The paper gives a reason why it holds.
It may state two separate claims as one.
A result the paper reports from its own data — it cites no other source for it, so there is none to check. The quote shows it is in the paper.
In the paper
“With these pools, S-specific CD4+ T cell responses were again detected (SI > 2) in the post-vaccination samples from COVID-19–naive samples and in the convalescent and post-vaccination samples of COVID-19–recovered donors (Fig. 4, E and F, shown as percentages of activated cells within the CD4+ T cell subset in fig. S4), but T cell responses were not observed before vaccination in the COVID-19–na”
§ SARS-CoV-2 variants of concern partially escape humoral but not T cell responses in COVID-19 convalescent donors and vaccine recipients > RESULTS > S-specific CD4+ T cells have comparable reactivity with VOCs
plain- Asserted: passes — The authors put it forward as true.
- Checkable: passes — It can be checked against evidence.
- Load-bearing: passes — The paper’s conclusions depend on it.
- Based: passes — The paper gives a reason why it holds.
It may state two separate claims as one.
In the paper
“The Luminex MIA, on the other hand, allowed clear interpretation and quantitative comparison of antibody responses within the groups and at different time points (45).”
§ SARS-CoV-2 variants of concern partially escape humoral but not T cell responses in COVID-19 convalescent donors and vaccine recipients > DISCUSSION
What the sources say
- Not checked yetcites [45] G. den Hartog, R. M. Schepp, M. Kuijer, C. GeurtsvanKessel, J. van Beek, N. Rots, M. P. G. Koopmans, F. R. M. van der Klis, R. S. van Binnendijk, SARS-CoV-2-specific antibody detection for seroepidemiology: A multiplex analysis approach accounting for accurate seroprevalence. J. Infect. Dis. 222, 1452– 1461 (2020). 32766833 PMC7454740 source
boosteddirect- Asserted: passes — The authors put it forward as true.
- Checkable: passes — It can be checked against evidence.
- Load-bearing: fails — The paper’s conclusions may not depend on it.
- Based: passes — The paper gives a reason why it holds.
Probably not a substantial claim. The paper’s conclusions may not depend on it.
What the paper did — it cites no source for this, so there is none to check. The quote shows it is in the paper.
In the paper
“No significant differences were observed in binding antibody data as determined by MIA between the total cohort and samples selected for in-depth analysis (table S2).”
§ SARS-CoV-2 variants of concern partially escape humoral but not T cell responses in COVID-19 convalescent donors and vaccine recipients > RESULTS > Rapid boosting of S-specific antibodies in COVID-19–recovered donors
plain- Asserted: passes — The authors put it forward as true.
- Checkable: passes — It can be checked against evidence.
- Load-bearing: fails — The paper’s conclusions may not depend on it.
- Based: passes — The paper gives a reason why it holds.
Probably not a substantial claim. The paper’s conclusions may not depend on it.
None of the sources cited for this claim have been checked yet.
In the paper
“ADCC-mediating antibodies have been detected in plasma of COVID-19 convalescent donors (16, 67, 68).”
§ SARS-CoV-2 variants of concern partially escape humoral but not T cell responses in COVID-19 convalescent donors and vaccine recipients > DISCUSSION
What the sources say
- Not checked yetcites [16] F. Y. Tso, S. J. Lidenge, L. K. Poppe, P. B. Pena, S. R. Privatt, S. J. Bennett, J. R. Ngowi, J. Mwaiselage, M. Belshan, J. A. Siedlik, M. A. Raine, J. B. Ochoa, J. Garcia-Diaz, B. Nossaman, L. Buckner, W. M. Roberts, M. J. Dean, A. C. Ochoa, J. T. West, C. Wood, Presence of antibody-dependent cellular cytotoxicity (ADCC) against SARS-CoV-2 in COVID-19 plasma. PLOS ONE 16, e0247640 (2021). 33661923 PMC7932539 source
- Not checked yetcites [67] J. Dufloo, L. Grzelak, I. Staropoli, Y. Madec, L. Tondeur, A. Francois, S. Pelleau, A. Wiedemann, C. Planchais, J. Buchrieser, R. Robinot, M. Ungeheuer, H. Mouquet, P. Charneau, M. White, Y. Levy, B. Hoen, A. Fontanet, O. Schwartz, T. Bruel, Asymptomatic and symptomatic SARS-CoV-2 infections elicit polyfunctional antibodies. Cell Rep. Med. 2, 100275 (2021). 33899033 PMC8057765 source
- Not checked yetcites [68] M. D. Larsen, E. L. de Graaf, M. E. Sonneveld, H. R. Plomp, J. Nouta, W. Hoepel, H. J. Chen, F. Linty, R. Visser, M. Brinkhaus, T. Sustic, S. W. de Taeye, A. E. H. Bentlage, S. Toivonen, C. A. M. Koeleman, S. Sainio, N. A. Kootstra, P. J. M. Brouwer, C. E. Geyer, N. I. L. Derksen, G. Wolbink, M. de Winther, R. W. Sanders, M. J. van Gils, S. de Bruin, A. P. J. Vlaar; Amsterdam UMC COVIS-19; Biobank Study Group, T. Rispens, J. den Dunnen, H. L. Zaaijer, M. Wuhrer, C. E. van der Schoot, G. Vidarsson, Afucosylated IgG characterizes enveloped viral responses and correlates with COVID-19 severity. S source
plain- Asserted: passes — The authors put it forward as true.
- Checkable: passes — It can be checked against evidence.
- Load-bearing: fails — The paper’s conclusions may not depend on it.
- Based: passes — The paper gives a reason why it holds.
Probably not a substantial claim. The paper’s conclusions may not depend on it.
None of the sources cited for this claim have been checked yet.
In the paper
“Concerning neutralization of VOCs, recent studies have consistently reported lower neutralizing antibody titers against B.1.351 after vaccination but not against B.1.1.7 (39, 42, 48–59).”
§ SARS-CoV-2 variants of concern partially escape humoral but not T cell responses in COVID-19 convalescent donors and vaccine recipients > DISCUSSION
What the sources say
- Not checked yetcites [39] S. A. Madhi, V. Baillie, C. L. Cutland, M. Voysey, A. L. Koen, L. Fairlie, S. D. Padayachee, K. Dheda, S. L. Barnabas, Q. E. Bhorat, C. Briner, G. Kwatra, K. Ahmed, P. Aley, S. Bhikha, J. N. Bhiman, A. E. Bhorat, J. du Plessis, A. Esmail, M. Groenewald, E. Horne, S. H. Hwa, A. Jose, T. Lambe, M. Laubscher, M. Malahleha, M. Masenya, M. Masilela, S. McKenzie, K. Molapo, A. Moultrie, S. Oelofse, F. Patel, S. Pillay, S. Rhead, H. Rodel, L. Rossouw, C. Taoushanis, H. Tegally, A. Thombrayil, S. van Eck, C. K. Wibmer, N. M. Durham, E. J. Kelly, T. L. Villafana, S. Gilbert, A. J. Pollard, T. de Olivei source
- Not checked yetcites [42] R. R. Goel, S. A. Apostolidis, M. M. Painter, D. Mathew, A. Pattekar, O. Kuthuru, S. Gouma, P. Hicks, W. Meng, A. M. Rosenfeld, S. Dysinger, K. A. Lundgreen, L. Kuri-Cervantes, S. Adamski, A. Hicks, S. Korte, D. A. Oldridge, A. E. Baxter, J. R. Giles, M. E. Weirick, C. M. McAllister, J. Dougherty, S. Long, K. D’Andrea, J. T. Hamilton, M. R. Betts, E. T. Luning Prak, P. Bates, S. E. Hensley, A. R. Greenplate, E. J. Wherry, Distinct antibody and memory B cell responses in SARS-CoV-2 naïve and recovered individuals following mRNA vaccination. Sci. Immunol. 6, eabi6950 (2021). 33858945 PMC8158969 source
- Not checked yetcites [48] D. Planas, T. Bruel, L. Grzelak, F. Guivel-Benhassine, I. Staropoli, F. Porrot, C. Planchais, J. Buchrieser, M. M. Rajah, E. Bishop, M. Albert, F. Donati, M. Prot, S. Behillil, V. Enouf, M. Maquart, M. Smati-Lafarge, E. Varon, F. Schortgen, L. Yahyaoui, M. Gonzalez, J. De Seze, H. Pere, D. Veyer, A. Seve, E. Simon-Loriere, S. Fafi-Kremer, K. Stefic, H. Mouquet, L. Hocqueloux, S. van der Werf, T. Prazuck, O. Schwartz, Sensitivity of infectious SARS-CoV-2 B.1.1.7 and B.1.351 variants to neutralizing antibodies. Nat. Med. 27, 917– 924 (2021). 33772244 source
- Not checked yetcites [49] T. Tada, B. M. Dcosta, M. Samanovic-Golden, R. S. Herati, A. Cornelius, M. J. Mulligan, N. R. Landau, Neutralization of viruses with European, South African, and United States SARS-CoV-2 variant spike proteins by convalescent sera and BNT162b2 mRNA vaccine-elicited antibodies. bioRxiv 10.1101/2021.02.05.430003 (2021).
- Not checked yetcites [50] P. Wang, M. S. Nair, L. Liu, S. Iketani, Y. Luo, Y. Guo, M. Wang, J. Yu, B. Zhang, P. D. Kwong, B. S. Graham, J. R. Mascola, J. Y. Chang, M. T. Yin, M. Sobieszczyk, C. A. Kyratsous, L. Shapiro, Z. Sheng, Y. Huang, D. D. Ho, Increased resistance of SARS-CoV-2 variants B.1.351 and B.1.1.7 to antibody neutralization. bioRxiv 10.1101/2021.01.25.428137 (2021). 33684923
- Not checked yetcites [51] D. Zhou, W. Dejnirattisai, P. Supasa, C. Liu, A. J. Mentzer, H. M. Ginn, Y. Zhao, H. M. E. Duyvesteyn, A. Tuekprakhon, R. Nutalai, B. Wang, G. C. Paesen, C. Lopez-Camacho, J. Slon-Campos, B. Hallis, N. Coombes, K. Bewley, S. Charlton, T. S. Walter, D. Skelly, S. F. Lumley, C. Dold, R. Levin, T. Dong, A. J. Pollard, J. C. Knight, D. Crook, T. Lambe, E. Clutterbuck, S. Bibi, A. Flaxman, M. Bittaye, S. Belij-Rammerstorfer, S. Gilbert, W. James, M. W. Carroll, P. Klenerman, E. Barnes, S. J. Dunachie, E. E. Fry, J. Mongkolsapaya, J. Ren, D. I. Stuart, G. R. Screaton, Evidence of escape of SARS-CoV- source
- Not checked yetcites [52] R. E. Chen, X. Zhang, J. B. Case, E. S. Winkler, Y. Liu, L. A. VanBlargan, J. Liu, J. M. Errico, X. Xie, N. Suryadevara, P. Gilchuk, S. J. Zost, S. Tahan, L. Droit, J. S. Turner, W. Kim, A. J. Schmitz, M. Thapa, D. Wang, A. C. M. Boon, R. M. Presti, J. A. O’Halloran, A. H. J. Kim, P. Deepak, D. Pinto, D. H. Fremont, J. E. Crowe Jr., D. Corti, H. W. Virgin, A. H. Ellebedy, P.-Y. Shi, M. S. Diamond, Resistance of SARS-CoV-2 variants to neutralization by monoclonal and serum-derived polyclonal antibodies. Nat. Med. 27, 717– 726 (2021). 33664494 PMC8058618 source
- Not checked yetcites [53] S. Jangra, C. Ye, R. Rathnasinghe, D. Stadlbauer, F. Krammer, V. Simon, L. Martinez-Sobrido, A. Garcia-Sastre, M. Schotsaert, The E484K mutation in the SARS-CoV-2 spike protein reduces but does not abolish neutralizing activity of human convalescent and post-vaccination sera. medRxiv 10.1101/2021.01.26.21250543 (2021).
- Not checked yetcites [54] K. Wu, A. P. Werner, J. I. Moliva, M. Koch, A. Choi, G. B. E. Stewart-Jones, H. Bennett, S. Boyoglu-Barnum, W. Shi, B. S. Graham, A. Carfi, K. S. Corbett, R. A. Seder, D. K. Edwards, mRNA-1273 vaccine induces neutralizing antibodies against spike mutants from global SARS-CoV-2 variants. bioRxiv 10.1101/2021.01.25.427948 (2021).
- Not checked yetcites [55] X. Xie, J. Zou, C. R. Fontes-Garfias, H. Xia, K. A. Swanson, M. Cutler, D. Cooper, V. D. Menachery, S. Weaver, P. R. Dormitzer, P. Y. Shi, Neutralization of N501Y mutant SARS-CoV-2 by BNT162b2 vaccine-elicited sera. bioRxiv 10.1101/2021.01.07.425740 (2021). 33558724
boosteddirect- Asserted: passes — The authors put it forward as true.
- Checkable: passes — It can be checked against evidence.
- Load-bearing: unclear — It is unclear whether the paper’s conclusions depend on it.
- Based: passes — The paper gives a reason why it holds.
It may state two separate claims as one.
A conclusion the paper draws from its own results — it cites no other source for it, so there is none to check. The quote shows it is in the paper.
In the paper
“The study was performed in a selected population of HCWs working with COVID-19 patients who were eligible for rapid vaccination in the Netherlands. The participants were relatively young, predominantly female, with a history of mild COVID-19 disease if previously infected.”
§ SARS-CoV-2 variants of concern partially escape humoral but not T cell responses in COVID-19 convalescent donors and vaccine recipients > DISCUSSION
plain- Asserted: passes — The authors put it forward as true.
- Checkable: passes — It can be checked against evidence.
- Load-bearing: unclear — It is unclear whether the paper’s conclusions depend on it.
- Based: passes — The paper gives a reason why it holds.
It may state two separate claims as one.
None of the sources cited for this claim have been checked yet.
In the paper
“The neutralization data reported here are in line with previous reports (42, 47–49).”
§ SARS-CoV-2 variants of concern partially escape humoral but not T cell responses in COVID-19 convalescent donors and vaccine recipients > DISCUSSION
What the sources say
- Not checked yetcites [42] R. R. Goel, S. A. Apostolidis, M. M. Painter, D. Mathew, A. Pattekar, O. Kuthuru, S. Gouma, P. Hicks, W. Meng, A. M. Rosenfeld, S. Dysinger, K. A. Lundgreen, L. Kuri-Cervantes, S. Adamski, A. Hicks, S. Korte, D. A. Oldridge, A. E. Baxter, J. R. Giles, M. E. Weirick, C. M. McAllister, J. Dougherty, S. Long, K. D’Andrea, J. T. Hamilton, M. R. Betts, E. T. Luning Prak, P. Bates, S. E. Hensley, A. R. Greenplate, E. J. Wherry, Distinct antibody and memory B cell responses in SARS-CoV-2 naïve and recovered individuals following mRNA vaccination. Sci. Immunol. 6, eabi6950 (2021). 33858945 PMC8158969 source
- Not checked yetcites [47] Y. Liu, J. Liu, H. Xia, X. Zhang, C. R. Fontes-Garfias, K. A. Swanson, H. Cai, R. Sarkar, W. Chen, M. Cutler, D. Cooper, S. C. Weaver, A. Muik, U. Sahin, K. U. Jansen, X. Xie, P. R. Dormitzer, P. Y. Shi, Neutralizing activity of BNT162b2-elicited serum. N. Engl. J. Med. 384, 1466– 1468 (2021). 33684280 PMC7944950 source
- Not checked yetcites [48] D. Planas, T. Bruel, L. Grzelak, F. Guivel-Benhassine, I. Staropoli, F. Porrot, C. Planchais, J. Buchrieser, M. M. Rajah, E. Bishop, M. Albert, F. Donati, M. Prot, S. Behillil, V. Enouf, M. Maquart, M. Smati-Lafarge, E. Varon, F. Schortgen, L. Yahyaoui, M. Gonzalez, J. De Seze, H. Pere, D. Veyer, A. Seve, E. Simon-Loriere, S. Fafi-Kremer, K. Stefic, H. Mouquet, L. Hocqueloux, S. van der Werf, T. Prazuck, O. Schwartz, Sensitivity of infectious SARS-CoV-2 B.1.1.7 and B.1.351 variants to neutralizing antibodies. Nat. Med. 27, 917– 924 (2021). 33772244 source
- Not checked yetcites [49] T. Tada, B. M. Dcosta, M. Samanovic-Golden, R. S. Herati, A. Cornelius, M. J. Mulligan, N. R. Landau, Neutralization of viruses with European, South African, and United States SARS-CoV-2 variant spike proteins by convalescent sera and BNT162b2 mRNA vaccine-elicited antibodies. bioRxiv 10.1101/2021.02.05.430003 (2021).
plain- Asserted: passes — The authors put it forward as true.
- Checkable: passes — It can be checked against evidence.
- Load-bearing: fails — The paper’s conclusions may not depend on it.
- Based: passes — The paper gives a reason why it holds.
Probably not a substantial claim. The paper’s conclusions may not depend on it.
In the paper
“In addition to direct virus neutralization, antibodies can have multiple other modes of action that are primarily mediated by IgG1 and IgG3 subclass antibodies (60).”
§ SARS-CoV-2 variants of concern partially escape humoral but not T cell responses in COVID-19 convalescent donors and vaccine recipients > DISCUSSION
What the sources say
- Not checked yetcites [60] P. Bruhns, B. Iannascoli, P. England, D. A. Mancardi, N. Fernandez, S. Jorieux, M. Daeron, Specificity and affinity of human Fcgamma receptors and their polymorphic variants for human IgG subclasses. Blood 113, 3716– 3725 (2009). 19018092 source
plaindirect- Asserted: passes — The authors put it forward as true.
- Checkable: passes — It can be checked against evidence.
- Load-bearing: fails — The paper’s conclusions may not depend on it.
- Based: passes — The paper gives a reason why it holds.
Probably not a substantial claim. The paper’s conclusions may not depend on it.
In the paper
“In line with previous studies (42), a single vaccination led to a rapid and strong recall response in COVID-19–recovered participants, without detectable boosting after the second dose.”
§ SARS-CoV-2 variants of concern partially escape humoral but not T cell responses in COVID-19 convalescent donors and vaccine recipients > DISCUSSION
What the sources say
- Not checked yetcites [42] R. R. Goel, S. A. Apostolidis, M. M. Painter, D. Mathew, A. Pattekar, O. Kuthuru, S. Gouma, P. Hicks, W. Meng, A. M. Rosenfeld, S. Dysinger, K. A. Lundgreen, L. Kuri-Cervantes, S. Adamski, A. Hicks, S. Korte, D. A. Oldridge, A. E. Baxter, J. R. Giles, M. E. Weirick, C. M. McAllister, J. Dougherty, S. Long, K. D’Andrea, J. T. Hamilton, M. R. Betts, E. T. Luning Prak, P. Bates, S. E. Hensley, A. R. Greenplate, E. J. Wherry, Distinct antibody and memory B cell responses in SARS-CoV-2 naïve and recovered individuals following mRNA vaccination. Sci. Immunol. 6, eabi6950 (2021). 33858945 PMC8158969 source
plaindirect- Asserted: passes — The authors put it forward as true.
- Checkable: passes — It can be checked against evidence.
- Load-bearing: unclear — It is unclear whether the paper’s conclusions depend on it.
- Based: passes — The paper gives a reason why it holds.
It may state two separate claims as one.
A conclusion the paper draws from its own results — it cites no other source for it, so there is none to check. The quote shows it is in the paper.
In the paper
“Here, we show that in both COVID-19–recovered and –naive individuals, BNT162b2 mRNA vaccination induces robust SARS-CoV-2–specific neutralizing antibodies, ADCC-mediating antibodies, and CD4+ and CD8+ T cells.”
§ SARS-CoV-2 variants of concern partially escape humoral but not T cell responses in COVID-19 convalescent donors and vaccine recipients > DISCUSSION
boosteddirect- Asserted: passes — The authors put it forward as true.
- Checkable: passes — It can be checked against evidence.
- Load-bearing: passes — The paper’s conclusions depend on it.
- Based: passes — The paper gives a reason why it holds.
It may state two separate claims as one.
None of the sources cited for this claim have been checked yet.
In the paper
“ADCC is mainly mediated by the interaction between virus-specific antibodies and Fcγ receptor IIIα (FcγRIIIα, CD16), which is, for example, present on NK cells (61–63).”
§ SARS-CoV-2 variants of concern partially escape humoral but not T cell responses in COVID-19 convalescent donors and vaccine recipients > DISCUSSION
What the sources say
- Not checked yetcites [61] R. D. de Vries, N. J. Nieuwkoop, M. Pronk, E. de Bruin, G. Leroux-Roels, E. G. W. Huijskens, R. S. van Binnendijk, F. Krammer, M. P. G. Koopmans, G. F. Rimmelzwaan, Influenza virus-specific antibody dependent cellular cytoxicity induced by vaccination or natural infection. Vaccine 35, 238– 247 (2017). 27914742 source
- Not checked yetcites [62] R. D. de Vries, N. J. Nieuwkoop, F. R. M. van der Klis, M. P. G. Koopmans, F. Krammer, G. F. Rimmelzwaan, Primary human influenza B virus infection induces cross-lineage hemagglutinin stalk–specific antibodies mediating antibody-dependent cellular cytoxicity. J. Infect. Dis. 217, 3– 11 (2017). 29294018 PMC5853962 source
- Not checked yetcites [63] S. Jegaskanda, K. L. Laurie, T. H. Amarasena, W. R. Winnall, M. Kramski, R. De Rose, I. G. Barr, A. G. Brooks, P. C. Reading, S. J. Kent, Age-associated cross-reactive antibody-dependent cellular cytotoxicity toward 2009 pandemic influenza A virus subtype H1N1. J Infect Dis 208, 1051– 1061 (2013). 23812238 source
plaindirect- Asserted: passes — The authors put it forward as true.
- Checkable: passes — It can be checked against evidence.
- Load-bearing: fails — The paper’s conclusions may not depend on it.
- Based: passes — The paper gives a reason why it holds.
Probably not a substantial claim. The paper’s conclusions may not depend on it.
A conclusion the paper draws from its own results — it cites no other source for it, so there is none to check. The quote shows it is in the paper.
In the paper
“Our study differs from most previously conducted studies because infectious viruses were used to determine neutralizing antibody titers (in contrast to pseudotyped viruses), potentially explaining this observation.”
§ SARS-CoV-2 variants of concern partially escape humoral but not T cell responses in COVID-19 convalescent donors and vaccine recipients > DISCUSSION
hedgedconditional- Asserted: passes — The authors put it forward as true.
- Checkable: passes — It can be checked against evidence.
- Load-bearing: passes — The paper’s conclusions depend on it.
- Based: passes — The paper gives a reason why it holds.
Probably not a substantial claim. It may state two separate claims as one.
In the paper
“NK cells were shown to be decreased in patients with COVID-19 in association with disease severity (64).”
§ SARS-CoV-2 variants of concern partially escape humoral but not T cell responses in COVID-19 convalescent donors and vaccine recipients > DISCUSSION
What the sources say
- Not checked yetcites [64] M. Zheng, Y. Gao, G. Wang, G. Song, S. Liu, D. Sun, Y. Xu, Z. Tian, Functional exhaustion of antiviral lymphocytes in COVID-19 patients. Cell. Mol. Immunol. 17, 533– 535 (2020). 32203188 PMC7091858 source
plaincorrelational- Asserted: passes — The authors put it forward as true.
- Checkable: passes — It can be checked against evidence.
- Load-bearing: fails — The paper’s conclusions may not depend on it.
- Based: passes — The paper gives a reason why it holds.
Probably not a substantial claim. The paper’s conclusions may not depend on it.
In the paper
“A study that followed a sequencing-based approach identified mutations in CD8+ T cell epitopes after sequencing 747 SARS-CoV-2 isolates and showed that tetramer-sorted CD8+ T cell clones responded to mutant peptides in a transcriptionally different manner (70).”
§ SARS-CoV-2 variants of concern partially escape humoral but not T cell responses in COVID-19 convalescent donors and vaccine recipients > DISCUSSION
What the sources say
- Not checked yetcites [70] B. Agerer, M. Koblischke, V. Gudipati, L. F. Montano-Gutierrez, M. Smyth, A. Popa, J. W. Genger, L. Endler, D. M. Florian, V. Muhlgrabner, M. Graninger, S. W. Aberle, A. M. Husa, L. E. Shaw, A. Lercher, P. Gattinger, R. Torralba-Gombau, D. Trapin, T. Penz, D. Barreca, I. Fae, S. Wenda, M. Traugott, G. Walder, W. F. Pickl, V. Thiel, F. Allerberger, H. Stockinger, E. Puchhammer-Stockl, W. Weninger, G. Fischer, W. Hoepler, E. Pawelka, A. Zoufaly, R. Valenta, C. Bock, W. Paster, R. Geyeregger, M. Farlik, F. Halbritter, J. B. Huppa, J. H. Aberle, A. Bergthaler, SARS-CoV-2 mutations in MHC-I-restric source
plaincorrelational- Asserted: passes — The authors put it forward as true.
- Checkable: passes — It can be checked against evidence.
- Load-bearing: fails — The paper’s conclusions may not depend on it.
- Based: passes — The paper gives a reason why it holds.
Probably not a substantial claim. The paper’s conclusions may not depend on it. It may state two separate claims as one.
In the paper
“A small study assessed 45 mutations in the B.1.351 S protein, and found that only 1 mutation overlapped with a low-prevalent CD8+ T cell epitope (69).”
§ SARS-CoV-2 variants of concern partially escape humoral but not T cell responses in COVID-19 convalescent donors and vaccine recipients > DISCUSSION
What the sources say
- Not checked yetcites [69] A. D. Redd, A. Nardin, H. Kared, E. M. Bloch, A. Pekosz, O. Laeyendecker, B. Abel, M. Fehlings, T. C. Quinn, A. A. Tobian, CD8+ T cell responses in COVID-19 convalescent individuals target conserved epitopes from multiple prominent SARS-CoV-2 circulating variants. medRxiv 10.1101/2021.02.11.21251585 (2021). PMC8083629 34322559
plain- Asserted: passes — The authors put it forward as true.
- Checkable: passes — It can be checked against evidence.
- Load-bearing: fails — The paper’s conclusions may not depend on it.
- Based: passes — The paper gives a reason why it holds.
Probably not a substantial claim. The paper’s conclusions may not depend on it.
A conclusion the paper draws from its own results — it cites no other source for it, so there is none to check. The quote shows it is in the paper.
In the paper
“Vaccination-induced antibodies did cross-neutralize the variants B.1.1.7 and B.1.351, but the neutralizing capacity and Fc-mediated functionality against B.1.351 were consistently two- to fourfold lower than those against the homologous virus.”
§ SARS-CoV-2 variants of concern partially escape humoral but not T cell responses in COVID-19 convalescent donors and vaccine recipients > DISCUSSION
plaindirect- Asserted: passes — The authors put it forward as true.
- Checkable: passes — It can be checked against evidence.
- Load-bearing: passes — The paper’s conclusions depend on it.
- Based: passes — The paper gives a reason why it holds.
It may state two separate claims as one.
In the paper
“In hospitalized patients, we have previously shown that a serum neutralizing antibody titer of at least 1:20 was independently associated with the absence of shedding of infectious SARS-CoV-2 (46).”
§ SARS-CoV-2 variants of concern partially escape humoral but not T cell responses in COVID-19 convalescent donors and vaccine recipients > DISCUSSION
What the sources say
- Not checked yetcites [46] J. J. A. van Kampen, D. van de Vijver, P. L. A. Fraaij, B. L. Haagmans, M. M. Lamers, N. Okba, J. P. C. van den Akker, H. Endeman, D. Gommers, J. J. Cornelissen, R. A. S. Hoek, M. M. van der Eerden, D. A. Hesselink, H. J. Metselaar, A. Verbon, J. E. M. de Steenwinkel, G. I. Aron, E. C. M. van Gorp, S. van Boheemen, J. C. Voermans, C. A. B. Boucher, R. Molenkamp, M. P. G. Koopmans, C. Geurtsvankessel, A. A. van der Eijk, Duration and key determinants of infectious virus shedding in hospitalized patients with coronavirus disease-2019 (COVID-19). Nat. Commun. 12, 267 (2021). 33431879 PMC7801729 source
plaincorrelational- Asserted: passes — The authors put it forward as true.
- Checkable: passes — It can be checked against evidence.
- Load-bearing: fails — The paper’s conclusions may not depend on it.
- Based: passes — The paper gives a reason why it holds.
Probably not a substantial claim. The paper’s conclusions may not depend on it.
What the paper did — it cites no source for this, so there is none to check. The quote shows it is in the paper.
In the paper
“Viruses used in the assay were isolated from diagnostic specimen at the Department of Viroscience, Erasmus MC, cultured, and subsequently sequenced to rule out additional mutations in the S protein”
§ SARS-CoV-2 variants of concern partially escape humoral but not T cell responses in COVID-19 convalescent donors and vaccine recipients > MATERIALS AND METHODS > PRN assay
plain- Asserted: passes — The authors put it forward as true.
- Checkable: passes — It can be checked against evidence.
- Load-bearing: passes — The paper’s conclusions depend on it.
- Based: passes — The paper gives a reason why it holds.
Probably not a substantial claim.
None of the sources cited for this claim have been checked yet.
In the paper
“All S constructs were cloned into a pPPI4 expression vector containing a His tag, verified by Sanger sequencing and subsequently produced in human embryonic kidney–293F cells, and purified as previously described (6, 80).”
§ SARS-CoV-2 variants of concern partially escape humoral but not T cell responses in COVID-19 convalescent donors and vaccine recipients > MATERIALS AND METHODS > ADCC assay
What the sources say
- Not checked yetcites [6] P. J. M. Brouwer, T. G. Caniels, K. van der Straten, J. L. Snitselaar, Y. Aldon, S. Bangaru, J. L. Torres, N. M. A. Okba, M. Claireaux, G. Kerster, A. E. H. Bentlage, M. M. van Haaren, D. Guerra, J. A. Burger, E. E. Schermer, K. D. Verheul, N. van der Velde, A. van der Kooi, J. van Schooten, M. J. van Breemen, T. P. L. Bijl, K. Sliepen, A. Aartse, R. Derking, I. Bontjer, N. A. Kootstra, W. J. Wiersinga, G. Vidarsson, B. L. Haagmans, A. B. Ward, G. J. de Bree, R. W. Sanders, M. J. van Gils, Potent neutralizing antibodies from COVID-19 patients define multiple targets of vulnerability. Science 3 source
- Not checked yetcites [80] R. N. Kirchdoerfer, C. A. Cottrell, N. Wang, J. Pallesen, H. M. Yassine, H. L. Turner, K. S. Corbett, B. S. Graham, J. S. McLellan, A. B. Ward, Pre-fusion structure of a human coronavirus spike protein. Nature 531, 118– 121 (2016). 26935699 PMC4860016 source
plain- Asserted: passes — The authors put it forward as true.
- Checkable: passes — It can be checked against evidence.
- Load-bearing: fails — The paper’s conclusions may not depend on it.
- Based: passes — The paper gives a reason why it holds.
Probably not a substantial claim. The paper’s conclusions may not depend on it.
What the paper did — it cites no source for this, so there is none to check. The quote shows it is in the paper.
In the paper
“The sample size for which in-depth T cell profiling was performed was limited to 20 donors”
§ SARS-CoV-2 variants of concern partially escape humoral but not T cell responses in COVID-19 convalescent donors and vaccine recipients > DISCUSSION
plainn = 20- Asserted: passes — The authors put it forward as true.
- Checkable: passes — It can be checked against evidence.
- Load-bearing: fails — The paper’s conclusions may not depend on it.
- Based: passes — The paper gives a reason why it holds.
Probably not a substantial claim. The paper’s conclusions may not depend on it.
None of the sources cited for this claim have been checked yet.
In the paper
“Detection of cross-reactive T cells via the AIM assay was previously described (7, 11, 72).”
§ SARS-CoV-2 variants of concern partially escape humoral but not T cell responses in COVID-19 convalescent donors and vaccine recipients > DISCUSSION
What the sources say
- Not checked yetcites [7] A. Grifoni, D. Weiskopf, S. I. Ramirez, J. Mateus, J. M. Dan, C. R. Moderbacher, S. A. Rawlings, A. Sutherland, L. Premkumar, R. S. Jadi, D. Marrama, A. M. de Silva, A. Frazier, A. F. Carlin, J. A. Greenbaum, B. Peters, F. Krammer, D. M. Smith, S. Crotty, A. Sette, Targets of T cell responses to SARS-CoV-2 coronavirus in humans with COVID-19 disease and unexposed individuals. Cell 181, 1489– 1501.e15 (2020). 32473127 PMC7237901 source
- Not checked yetcites [11] D. Weiskopf, K. S. Schmitz, M. P. Raadsen, A. Grifoni, N. M. A. Okba, H. Endeman, J. P. C. van den Akker, R. Molenkamp, M. P. G. Koopmans, E. C. M. van Gorp, B. L. Haagmans, R. L. de Swart, A. Sette, R. D. de Vries, Phenotype and kinetics of SARS-CoV-2–specific T cells in COVID-19 patients with acute respiratory distress syndrome. Sci. Immunol. 5, eabd2071 (2020). 32591408 PMC7319493 source
- Not checked yetcites [72] J. Mateus, A. Grifoni, A. Tarke, J. Sidney, S. I. Ramirez, J. M. Dan, Z. C. Burger, S. A. Rawlings, D. M. Smith, E. Phillips, S. Mallal, M. Lammers, P. Rubiro, L. Quiambao, A. Sutherland, E. D. Yu, R. da Silva Antunes, J. Greenbaum, A. Frazier, A. J. Markmann, L. Premkumar, A. de Silva, B. Peters, S. Crotty, A. Sette, D. Weiskopf, Selective and cross-reactive SARS-CoV-2 T cell epitopes in unexposed humans. Science 370, 89– 94 (2020). 32753554 PMC7574914 source
plain- Asserted: passes — The authors put it forward as true.
- Checkable: passes — It can be checked against evidence.
- Load-bearing: fails — The paper’s conclusions may not depend on it.
- Based: passes — The paper gives a reason why it holds.
Probably not a substantial claim. The paper’s conclusions may not depend on it.
What the paper did — it cites no source for this, so there is none to check. The quote shows it is in the paper.
In the paper
“We considered a titer >20 to be positive based on assay validation.”
§ SARS-CoV-2 variants of concern partially escape humoral but not T cell responses in COVID-19 convalescent donors and vaccine recipients > MATERIALS AND METHODS > PRN assay
plain- Asserted: passes — The authors put it forward as true.
- Checkable: passes — It can be checked against evidence.
- Load-bearing: passes — The paper’s conclusions depend on it.
- Based: passes — The paper gives a reason why it holds.
Probably not a substantial claim.
What the paper did — it cites no source for this, so there is none to check. The quote shows it is in the paper.
In the paper
“We did not analyze immune responses to the P.1 VOC, originating from Brazil, which also contains mutations in the RBD at positions 417 and 484 (in combination with unique mutations throughout the S protein).”
§ SARS-CoV-2 variants of concern partially escape humoral but not T cell responses in COVID-19 convalescent donors and vaccine recipients > DISCUSSION
plain- Asserted: passes — The authors put it forward as true.
- Checkable: passes — It can be checked against evidence.
- Load-bearing: fails — The paper’s conclusions may not depend on it.
- Based: passes — The paper gives a reason why it holds.
Probably not a substantial claim. The paper’s conclusions may not depend on it.
None of the sources cited for this claim have been checked yet.
In the paper
“Although this variant was not investigated in the current study, previous studies have demonstrated a similar, less pronounced, decrease in neutralization by polyclonal sera after BNT162b2 vaccination (47, 77).”
§ SARS-CoV-2 variants of concern partially escape humoral but not T cell responses in COVID-19 convalescent donors and vaccine recipients > DISCUSSION
What the sources say
- Not checked yetcites [47] Y. Liu, J. Liu, H. Xia, X. Zhang, C. R. Fontes-Garfias, K. A. Swanson, H. Cai, R. Sarkar, W. Chen, M. Cutler, D. Cooper, S. C. Weaver, A. Muik, U. Sahin, K. U. Jansen, X. Xie, P. R. Dormitzer, P. Y. Shi, Neutralizing activity of BNT162b2-elicited serum. N. Engl. J. Med. 384, 1466– 1468 (2021). 33684280 PMC7944950 source
- Not checked yetcites [77] M. Hoffmann, P. Arora, R. Gross, A. Seidel, B. F. Hornich, A. S. Hahn, N. Kruger, L. Graichen, H. Hofmann-Winkler, A. Kempf, M. S. Winkler, S. Schulz, H. M. Jack, B. Jahrsdorfer, H. Schrezenmeier, M. Muller, A. Kleger, J. Munch, S. Pöhlmann, SARS-CoV-2 variants B.1.351 and P.1 escape from neutralizing antibodies. Cell 184, 2384– 2393.e12 (2021). 33794143 PMC7980144 source
boosteddirect- Asserted: passes — The authors put it forward as true.
- Checkable: passes — It can be checked against evidence.
- Load-bearing: fails — The paper’s conclusions may not depend on it.
- Based: passes — The paper gives a reason why it holds.
Probably not a substantial claim. The paper’s conclusions may not depend on it.
What the paper did — it cites no source for this, so there is none to check. The quote shows it is in the paper.
In the paper
“we only focused on S-specific T cells”
§ SARS-CoV-2 variants of concern partially escape humoral but not T cell responses in COVID-19 convalescent donors and vaccine recipients > DISCUSSION
plainn = 20- Asserted: passes — The authors put it forward as true.
- Checkable: passes — It can be checked against evidence.
- Load-bearing: fails — The paper’s conclusions may not depend on it.
- Based: passes — The paper gives a reason why it holds.
Probably not a substantial claim. The paper’s conclusions may not depend on it.
In the paper
“This is in line with one other recently performed study that additionally showed cross-reactivity to the P.1 and CAL.20C (B.1.429) variants (71).”
§ SARS-CoV-2 variants of concern partially escape humoral but not T cell responses in COVID-19 convalescent donors and vaccine recipients > DISCUSSION
What the sources say
- Not checked yetcites [71] A. Tarke, J. Sidney, N. Methot, Y. Zhang, J. M. Dan, B. Goodwin, P. Rubiro, A. Sutherland, R. da Silva Antunes, A. Frazier, S. A. Rawlings, D. M. Smith, B. Peters, R. H. Scheuermann, D. Weiskopf, S. Crotty, A. Grifoni, A. Sette, Negligible impact of SARS-CoV-2 variants on CD4+ and CD8+ T cell reactivity in COVID-19 exposed donors and vaccinees. bioRxiv 10.1101/2021.02.27.433180 (2021). PMC8249675 34230917
plaincorrelationaln = 20- Asserted: passes — The authors put it forward as true.
- Checkable: passes — It can be checked against evidence.
- Load-bearing: fails — The paper’s conclusions may not depend on it.
- Based: passes — The paper gives a reason why it holds.
Probably not a substantial claim. The paper’s conclusions may not depend on it.
In the paper
“The specificity (99.7%) and sensitivity (91.6%) of the assay were determined using a heterogeneous sample set including asymptomatic and mild to severe COVID-19 cases as representative of COVID-19 cases in the general population, as well prepandemic population samples and samples of persons infected with various viruses, including endemic coronaviruses, as negative controls (23).”
§ SARS-CoV-2 variants of concern partially escape humoral but not T cell responses in COVID-19 convalescent donors and vaccine recipients > MATERIALS AND METHODS > Luminex bead assay
What the sources say
- Not checked yetcites [23] G. den Hartog, E. R. A. Vos, L. L. van den Hoogen, M. van Boven, R. M. Schepp, G. Smits, J. van Vliet, L. Woudstra, A. J. Wijmenga-Monsuur, C. C. E. van Hagen, E. A. M. Sanders, H. E. de Melker, F. R. M. van der Klis, R. S. van Binnendijk, Persistence of antibodies to SARS-CoV-2 in relation to symptoms in a nationwide prospective study. Clin. Infect. Dis. 2021, ciab172 (2021). PMC7929058 33624751 source
plain- Asserted: passes — The authors put it forward as true.
- Checkable: passes — It can be checked against evidence.
- Load-bearing: unclear — It is unclear whether the paper’s conclusions depend on it.
- Based: passes — The paper gives a reason why it holds.
It may state two separate claims as one.
What the paper did — it cites no source for this, so there is none to check. The quote shows it is in the paper.
In the paper
“CD16 expression in this cell line was monitored by flow cytometry by staining with anti–CD16-AF647”
§ SARS-CoV-2 variants of concern partially escape humoral but not T cell responses in COVID-19 convalescent donors and vaccine recipients > MATERIALS AND METHODS > PBMCs and NK92.05 cell culture
plain- Asserted: passes — The authors put it forward as true.
- Checkable: passes — It can be checked against evidence.
- Load-bearing: fails — The paper’s conclusions may not depend on it.
- Based: passes — The paper gives a reason why it holds.
Probably not a substantial claim. The paper’s conclusions may not depend on it.
What the paper did — it cites no source for this, so there is none to check. The quote shows it is in the paper.
In the paper
“Low-frequency samples (<10,000 cells in CD4 gate and <5000 cells in CD8 gate) were excluded from analysis.”
§ SARS-CoV-2 variants of concern partially escape humoral but not T cell responses in COVID-19 convalescent donors and vaccine recipients > MATERIALS AND METHODS > AIM detection
plain- Asserted: passes — The authors put it forward as true.
- Checkable: passes — It can be checked against evidence.
- Load-bearing: fails — The paper’s conclusions may not depend on it.
- Based: passes — The paper gives a reason why it holds.
Probably not a substantial claim. The paper’s conclusions may not depend on it.
What the paper did — it cites no source for this, so there is none to check. The quote shows it is in the paper.
In the paper
“Appropriate tests were selected to compare normal or nonnormal distributed values, paired or unpaired samples, and taking into account missing values.”
§ SARS-CoV-2 variants of concern partially escape humoral but not T cell responses in COVID-19 convalescent donors and vaccine recipients > MATERIALS AND METHODS > Statistical analyses
plain- Asserted: passes — The authors put it forward as true.
- Checkable: passes — It can be checked against evidence.
- Load-bearing: fails — The paper’s conclusions may not depend on it.
- Based: passes — The paper gives a reason why it holds.
Probably not a substantial claim. The paper’s conclusions may not depend on it.
What the paper did — it cites no source for this, so there is none to check. The quote shows it is in the paper.
In the paper
“For N = 11 of 20 donors assessed, SARS-CoV-2 specificity in the CD4+ subset was confirmed by gating CD137+OX40+ cells.”
§ SARS-CoV-2 variants of concern partially escape humoral but not T cell responses in COVID-19 convalescent donors and vaccine recipients > MATERIALS AND METHODS > AIM detection
plainn = 11- Asserted: passes — The authors put it forward as true.
- Checkable: passes — It can be checked against evidence.
- Load-bearing: fails — The paper’s conclusions may not depend on it.
- Based: passes — The paper gives a reason why it holds.
Probably not a substantial claim. The paper’s conclusions may not depend on it.
In the paper
“ADCC assay was performed as previously described (61).”
§ SARS-CoV-2 variants of concern partially escape humoral but not T cell responses in COVID-19 convalescent donors and vaccine recipients > MATERIALS AND METHODS > ADCC assay
What the sources say
- Not checked yetcites [61] R. D. de Vries, N. J. Nieuwkoop, M. Pronk, E. de Bruin, G. Leroux-Roels, E. G. W. Huijskens, R. S. van Binnendijk, F. Krammer, M. P. G. Koopmans, G. F. Rimmelzwaan, Influenza virus-specific antibody dependent cellular cytoxicity induced by vaccination or natural infection. Vaccine 35, 238– 247 (2017). 27914742 source
plain- Asserted: passes — The authors put it forward as true.
- Checkable: passes — It can be checked against evidence.
- Load-bearing: fails — The paper’s conclusions may not depend on it.
- Based: passes — The paper gives a reason why it holds.
Probably not a substantial claim. The paper’s conclusions may not depend on it.
The paper relies on this without support.
Little is known about T cell cross-reactivity with SARS-CoV-2 variants of concern.
“Although several studies have demonstrated that some VOCs may be capable of evading infection or vaccination-induced neutralizing antibodies, little is known about T cell cross-reactivity with VOCs.”
The paper relies on this without support.
The B.1.1.7 and B.1.351 variants both contain the N501Y mutation.
“The B.1.1.7 and B.1.351 variants both contain the signature mutation N501Y”
The paper relies on this without support.
The N501Y mutation is associated with increased affinity for the ACE2 receptor.
“associated with increased affinity for the ACE2 (angiotensin converting enzyme 2) receptor.”
Claims other papers make about this one
Each is checked against this paper’s own text: does it say what the citing paper says it does?
In the citing paper
“Memory T cell responses have also been shown to be less affected by VOCs than humoral immune responses (21, 50).”
From mRNA vaccines induce durable immune memory to SARS-CoV-2 and variants of concern (2021) · cites this paper as [50]
Self-check
Percentages, sums and reported differences re-computed from the paper’s own numbers.
Each contradiction between two passages listed here was confirmed by an independent check.
Rated minor: it would not touch a result — a value no result rests on, a p-value that stays on the same side of the significance level, or a conflict that is clerical, resolved elsewhere in the paper, or outside its own findings.
In the paper
“| 30–60 days | | 12 (52.2%) | | 10 (85.6%) | |”
§ SARS-CoV-2 variants of concern partially escape humoral but not T cell responses in COVID-19 convalescent donors and vaccine recipients > RESULTS > COVID-19–naive and –recovered vaccination cohort
Reported 85.6 · recomputed 76.923077
Rated minor: it would not touch a result — a value no result rests on, a p-value that stays on the same side of the significance level, or a conflict that is clerical, resolved elsewhere in the paper, or outside its own findings.
In the paper
“| Male | 39 (32.2%) | 6 (26.1%) | 33 (35.6%) | 3 (23%) | 1 (8.3%) |”
§ SARS-CoV-2 variants of concern partially escape humoral but not T cell responses in COVID-19 convalescent donors and vaccine recipients > RESULTS > COVID-19–naive and –recovered vaccination cohort
Reported 35.6 · recomputed 33.673469
Rated minor: it would not touch a result — a value no result rests on, a p-value that stays on the same side of the significance level, or a conflict that is clerical, resolved elsewhere in the paper, or outside its own findings.
In the paper
§ SARS-CoV-2 variants of concern partially escape humoral but not T cell responses in COVID-19 convalescent donors and vaccine recipients > RESULTS > COVID-19–naive and –recovered vaccination cohort
“The median age of study participants was 41 years”
§ SARS-CoV-2 variants of concern partially escape humoral but not T cell responses in COVID-19 convalescent donors and vaccine recipients > RESULTS > COVID-19–naive and –recovered vaccination cohort
“| Age | 40 | 42 | 38.5 | 42 | 47 |”
Rated minor: it would not touch a result — a value no result rests on, a p-value that stays on the same side of the significance level, or a conflict that is clerical, resolved elsewhere in the paper, or outside its own findings.
In the paper
§ SARS-CoV-2 variants of concern partially escape humoral but not T cell responses in COVID-19 convalescent donors and vaccine recipients > RESULTS > Rapid boosting of S-specific antibodies in COVID-19–recovered donors
“after the first (μ = 20.3 days and SD = 3.2 days) and second vaccine dose (μ = 26.5 days and SD = 5.9 days)”
§ SARS-CoV-2 variants of concern partially escape humoral but not T cell responses in COVID-19 convalescent donors and vaccine recipients > MATERIALS AND METHODS > Study design
“Follow-up samples were collected 14 to 21 days after the first dose and 21 to 28 days after the second dose.”
Citations
Cites
Clinical features of patients infected with 2019 novel coronavirus in Wuhan, China
Huang, C., Wang, Y., Li, X., Ren, L., Zhao, J., Hu, Y., Zhang, L., Fan, G., Xu, J., Gu, X., et al. (2020) · The Lancet · doi:10.1016/s0140-6736(20)30183-5 · Cited by 48,884
Safety and Efficacy of the BNT162b2 mRNA Covid-19 Vaccine
Polack, F. P., Thomas, S. J., Kitchin, N., Absalon, J., Gurtman, A., Lockhart, S., Perez, J. L., Pérez Marc, G., Moreira, E. D., Zerbini, C., et al. (2020) · New England Journal of Medicine · doi:10.1056/nejmoa2034577 · Cited by 14,592
Efficacy and Safety of the mRNA-1273 SARS-CoV-2 Vaccine
Baden, L. R., El Sahly, H. M., Essink, B., Kotloff, K., Frey, S., Novak, R., Diemert, D., Spector, S. A., Rouphael, N., Creech, C. B., et al. (2021) · New England Journal of Medicine · doi:10.1056/nejmoa2035389 · Cited by 10,119
Voysey, M., Clemens, S. A. C., Madhi, S. A., Weckx, L. Y., Folegatti, P. M., Aley, P. K., Angus, B., Baillie, V. L., Barnabas, S. L., Bhorat, Q. E., et al. (2021) · The Lancet · doi:10.1016/s0140-6736(20)32661-1 · Cited by 4,616
A global panel database of pandemic policies (Oxford COVID-19 Government Response Tracker)
Hale, T., Angrist, N., Goldszmidt, R., Kira, B., Petherick, A., Phillips, T., Webster, S., Cameron-Blake, E., Hallas, L., Majumdar, S., et al. (2021) · Nature Human Behaviour · doi:10.1038/s41562-021-01079-8 · Cited by 4,578
Grifoni, A., Weiskopf, D., Ramirez, S. I., Mateus, J., Dan, J. M., Moderbacher, C. R., Rawlings, S. A., Sutherland, A., Premkumar, L., Jadi, R. S., et al. (2020) · Cell · doi:10.1016/j.cell.2020.05.015 · Cited by 3,595
Immunological memory to SARS-CoV-2 assessed for up to 8 months after infection.
Dan, J. M., Mateus, J., Kato, Y., Hastie, K. M., Yu, E. D., Faliti, C. E., Grifoni, A., Ramirez, S. I., Haupt, S., Frazier, A., et al. (2021) · Science · doi:10.1126/science.abf4063 · Cited by 2,656
Pierce, M., Hope, H., Ford, T., Hatch, S., Hotopf, M., John, A., Kontopantelis, E., Webb, R., Wessely, S., McManus, S., et al. (2020) · The Lancet Psychiatry · doi:10.1016/s2215-0366(20)30308-4 · Cited by 2,621
Detection of a SARS-CoV-2 variant of concern in South Africa
Tegally, H., Wilkinson, E., Giovanetti, M., Iranzadeh, A., Fonseca, V., Giandhari, J., Doolabh, D., Pillay, S., San, E. J., Msomi, N., et al. (2021) · Nature · doi:10.1038/s41586-021-03402-9 · Cited by 2,510
Antibody resistance of SARS-CoV-2 variants B.1.351 and B.1.1.7
Wang, P., Nair, M. S., Liu, L., Iketani, S., Luo, Y., Guo, Y., Wang, M., Yu, J., Zhang, B., Kwong, P. D., et al. (2021) · Nature · doi:10.1038/s41586-021-03398-2 · Cited by 2,312
Research works printed but not linked: 3
- N. Zucman, F. Uhel, D. Descamps, D. Roux, J. D. Ricard, Severe reinfection with South African SARS-CoV-2 variant 501Y.V2: A case report. Clin. Infect. Dis. 2021, ciab014 (2021).
- X. Xie, J. Zou, C. R. Fontes-Garfias, H. Xia, K. A. Swanson, M. Cutler, D. Cooper, V. D. Menachery, S. Weaver, P. R. Dormitzer, P. Y. Shi, Neutralization of N501Y mutant SARS-CoV-2 by BNT162b2 vaccine-elicited sera. bioRxiv 10.1101/2021.01.07.425740 (2021). · DOI · Paper page
- M. McCallum, J. Bassi, A. Marco, A. Chen, A. C. Walls, J. D. Iulio, M. A. Tortorici, M. J. Navarro, C. Silacci-Fregni, C. Saliba, M. Agostini, D. Pinto, K. Culap, S. Bianchi, S. Jaconi, E. Cameroni, J. E. Bowen, S. W. Tilles, M. S. Pizzuto, S. B. Guastalla, G. Bona, A. F. Pellanda, C. Garzoni, W. C. Van Voorhis, L. E. Rosen, G. Snell, A. Telenti, H. W. Virgin, L. Piccoli, D. Corti, D. Veesler, SARS-CoV-2 immune evasion by variant B.1.427/B.1.429. bioRxiv 10.1101/2021.03.31.437925 (2021). · DOI
Cited by
Sorted by citations
mRNA vaccines induce durable immune memory to SARS-CoV-2 and variants of concern
Goel, R. R., Painter, M. M., Apostolidis, S. A., Mathew, D., Meng, W., Rosenfeld, A. M., Lundgreen, K. A., Reynaldi, A., Khoury, D. S., Pattekar, A., et al. (2021) · Science · doi:10.1126/science.abm0829 · Cited by 873
“Memory T cell responses have also been shown to be less affected by variants of concern than humoral immune responses ( 21 , 50 ).”
BackgroundTarke, A., Coelho, C. H., Zhang, Z., Dan, J. M., Yu, E. D., Methot, N., Bloom, N. I., Goodwin, B., Phillips, E., Mallal, S., et al. (2022) · Cell · doi:10.1016/j.cell.2022.01.015 · Cited by 858
Munro, A. P. S., Janani, L., Cornelius, V. R., Aley, P. K., Babbage, G., Baxter, D. N., Bula, M., Cathie, K., Chatterjee, K., Dodd, K., et al. (2021) · The Lancet · doi:10.1016/s0140-6736(21)02717-3 · Cited by 656
Apostolidis, S. A., Kakara, M., Painter, M. M., Goel, R. R., Mathew, D., Lenzi, K., Rezk, A., Patterson, K. R., Espinoza, D. A., Kadri, J. C., et al. (2021) · Nature Medicine · doi:10.1038/s41591-021-01507-2 · Cited by 506
Divergent SARS-CoV-2 Omicron–reactive T and B cell responses in COVID-19 vaccine recipients
GeurtsvanKessel, C. H., Geers, D., Schmitz, K. S., Mykytyn, A. Z., Lamers, M. M., Bogers, S., Scherbeijn, S. M. J., Gommers, L., Sablerolles, R. S. G., Nieuwkoop, N. N., et al. (2022) · Science Immunology · doi:10.1126/sciimmunol.abo2202 · Cited by 406
Self-citationShrestha, L. B., Foster, C. S. P., Rawlinson, W. D., Tedla, N. T., & Bull, R. A. (2022) · Reviews in Medical Virology · doi:10.1002/rmv.2381 · Cited by 483
T cell reactivity to the SARS-CoV-2 Omicron variant is preserved in most but not all individuals
Naranbhai, V., Nathan, A., Kaseke, C., Berrios, C., Khatri, A., Choi, S., Getz, M. A., Tano-Menka, R., Ofoman, O., Gayton, A. C., et al. (2022) · Cell · doi:10.1016/j.cell.2022.01.029 · Cited by 231
“While these assays are sensitive for functionally relevant T-cell responses (Goonetilleke et al., 2006; Karlsson et al., 2003), further interrogation of the phenotype and function of responding cells could also be pursued.”
Immunological memory to SARS‐CoV ‐2 infection and COVID ‐19 vaccines
Sette, A., & Crotty, S. (2022) · Immunological Reviews · doi:10.1111/imr.13089 · Cited by 270
SARS-COV-2 Variants: Differences and Potential of Immune Evasion
Hirabara, S. M., Serdan, T. D. A., Gorjão, R., Masi, L. N., Pithon‐Curi, T. C., Covas, D. T., Curi, R., & Durigon, E. L. (2022) · Frontiers in Cellular and Infection Microbiology · doi:10.3389/fcimb.2021.781429 · Cited by 220
Stuart, A. S. V., Shaw, R. H., Liu, X., Greenland, M., Aley, P. K., Andrews, N. J., Cameron, J. C., Charlton, S., Clutterbuck, E., Collins, A. M., et al. (2021) · The Lancet · doi:10.1016/s0140-6736(21)02718-5 · Cited by 217
“40 26 Together, these findings support use of the mixed schedules studied here in rapid and flexible global deployment of COVID-19 vaccines.”
COVID-19 vaccines in patients with cancer: immunogenicity, efficacy and safety
Fendler, A., de Vries, E. G. E., GeurtsvanKessel, C. H., Haanen, J. B. A. G., Wormann, B. J., Turajlic, S., & von Lilienfeld‐Toal, M. (2022) · Nature Reviews Clinical Oncology · doi:10.1038/s41571-022-00610-8 · Cited by 211
Self-citationThe next phase of SARS-CoV-2 surveillance: real-time molecular epidemiology
Munnink, B. B. O., Worp, N., Nieuwenhuijse, D. F., Sikkema, R. S., Haagmans, B. L., Fouchier, R. A. M., & Koopmans, M. (2021) · Nature Medicine · doi:10.1038/s41591-021-01472-w · Cited by 238
Self-citationSanders, J., Bemelman, F. J., Messchendorp, A. L., Baan, C. C., van Baarle, D., van Binnendijk, R. S., Diavatopoulos, D. A., Frölke, S. C., Geers, D., GeurtsvanKessel, C. H., et al. (2021) · Transplantation · doi:10.1097/tp.0000000000003983 · Cited by 182
“Participants were classified as responder or nonresponder based on seroconversion with a threshold for seropositivity based on receiver operator curve analysis set at S1-specific IgG antibody concentration ≥10 BAU/mL.12,13”
MethodSelf-citationSARS-CoV-2 antigen exposure history shapes phenotypes and specificity of memory CD8+ T cells
Minervina, A. A., Pogorelyy, M. V., Kirk, A. M., Crawford, J. C., Allen, E. K., Chou, C., Mettelman, R. C., Allison, K., Lin, C.-Y., Brice, D. C., et al. (2022) · Nature Immunology · doi:10.1038/s41590-022-01184-4 · Cited by 221
The Impact of Evolving SARS-CoV-2 Mutations and Variants on COVID-19 Vaccines
McLean, G. R., Kamil, J. P., Lee, B., Moore, P. L., Schulz, T. F., Muik, A., Şahin, U., Türeci, Ö., & Pather, S. (2022) · mBio · doi:10.1128/mbio.02979-21 · Cited by 195
Emerging SARS-CoV-2 Variants: A Review of Its Mutations, Its Implications and Vaccine Efficacy
Ramesh, S., Govindarajulu, M., Parise, R. S., Neel, L. T., Shankar, T., Patel, S., Lowery, P., Smith, F., Dhanasekaran, M., & Moore, T. (2021) · Vaccines · doi:10.3390/vaccines9101195 · Cited by 157
Comparison of the immunogenicity of BNT162b2 and CoronaVac COVID ‐19 vaccines in Hong Kong
Mok, C. K. P., Cohen, C. A., Cheng, S. M. S., Chen, C., Kwok, K., Yiu, K., Chan, T., Bull, M., Ling, K. C., Dai, Z., et al. (2022) · Respirology · doi:10.1111/resp.14191 · Cited by 162
“In animal models of re-infection, spike-specific CD8 T-cell responses can compensate for inadequate antibody responses(24) and are also highly cross-reactive to different variants of concern.(32) Therefore, SARS-CoV-2-specific T cells may provide an additional contribution to the immune correlate of protection.”
SARS-CoV-2-specific T cells in infection and vaccination
Bertoletti, A., Le Bert, N., Qui, M., & Tan, A. T. (2021) · Cellular & Molecular Immunology · doi:10.1038/s41423-021-00743-3 · Cited by 159
“CD4 and CD8 T cells seem to be present in roughly equivalent numbers [72], although initial data suggested that CD4 T cells were predominant [67, 68, 71].”
ResultOosting, S. F., van der Veldt, A. A. M., GeurtsvanKessel, C. H., Fehrmann, R. S. N., van Binnendijk, R. S., Dingemans, A. C., Smit, E. F., Hiltermann, T. J. N., den Hartog, G., Jalving, M., et al. (2021) · The Lancet Oncology · doi:10.1016/s1470-2045(21)00574-x · Cited by 150
Self-citationGut microbiota composition is associated with SARS-CoV-2 vaccine immunogenicity and adverse events
Ng, S. C., Peng, Y., Zhang, L., Mok, C. K. P., Zhao, S., Li, A., Ching, J. Y. L., Liu, Y., Yan, S., Chan, D. L. S., et al. (2022) · Gut · doi:10.1136/gutjnl-2021-326563 · Cited by 186
Molecular characteristics, immune evasion, and impact of SARS-CoV-2 variants
Sun, C., Xie, C., Bu, G., Zhong, L., & Zeng, M. (2022) · Signal Transduction and Targeted Therapy · doi:10.1038/s41392-022-01039-2 · Cited by 149
Does infection with or vaccination against SARS-CoV-2 lead to lasting immunity?
Milne, G., Hames, T., Scotton, C. J., Gent, N., Johnsen, A., Anderson, R. M., & Ward, T. (2021) · The Lancet Respiratory Medicine · doi:10.1016/s2213-2600(21)00407-0 · Cited by 123
Chakraborty, C., Sharma, A. R., Bhattacharya, M., & Lee, S. (2022) · Frontiers in Immunology · doi:10.3389/fimmu.2022.801522 · Cited by 154
SARS-CoV-2 Mutations and Their Impact on Diagnostics, Therapeutics and Vaccines
Thakur, S., Sasi, S., Pillai, S. G., Nag, A., Shukla, D., Singhal, R., Phalke, S., & Velu, G. S. K. (2022) · Frontiers in Medicine · doi:10.3389/fmed.2022.815389 · Cited by 167
“Increasing data suggest that variants with antibody-escape spike mutations do not evade T-cell response (35, 36).”
BackgroundAdaptive Immune Responses and Immunity to SARS-CoV-2
Primorac, D., Vrdoljak, K., Brlek, P., Pavelić, E., Molnar, V., Matišić, V., Ivkošić, I. E., & Parčina, M. (2022) · Frontiers in Immunology · doi:10.3389/fimmu.2022.848582 · Cited by 162
“There is also an indication that the key to understanding protection against these VOCs may be hidden in cross-reactive SARS-CoV-2-specific T cell-mediated immunity (33).”
BackgroundCOVID-19 vaccines: Keeping pace with SARS-CoV-2 variants
Çevik, M., Grubaugh, N. D., Iwasaki, A., & Openshaw, P. (2021) · Cell · doi:10.1016/j.cell.2021.09.010 · Cited by 122
Durability of Vaccine-Induced and Natural Immunity Against COVID-19: A Narrative Review
Pooley, N., Karim, S. S. A., Combadière, B., Ooi, E. E., Harris, R. C., Guerche‐Séblain, C. E., Kisomi, M., & Shaikh, N. (2023) · Infectious Diseases and Therapy · doi:10.1007/s40121-022-00753-2 · Cited by 95
van Gils, M. J., Lavell, A. H. A., van der Straten, K., Appelman, B., Bontjer, I., Poniman, M., Burger, J. A., Oomen, M., Bouhuijs, J. H., van Vught, L. A., et al. (2022) · PLoS Medicine · doi:10.1371/journal.pmed.1003991 · Cited by 104
Self-citationDalvie, N. C., Rodriguez‐Aponte, S. A., Hartwell, B. L., Tostanoski, L. H., Biedermann, A. M., Crowell, L. E., Kaur, K., Kumru, O. S., Carter, L. P., Yu, J., et al. (2021) · Proceedings of the National Academy of Sciences · doi:10.1073/pnas.2106845118 · Cited by 84
“Such adaptations by the virus could reduce the effectiveness of interventions like monoclonal antibodies and current vaccines based on the original Wuhan-Hu-1 strain (44, 45).”
BackgroundPersistence of neutralizing antibodies a year after SARS‐CoV‐2 infection in humans
Haveri, A., Ekström, N., Solastie, A., Virta, C., Österlund, P., Isosaari, E., Nohynek, H., PALMU, A. A. I., & Melin, M. M. (2021) · European Journal of Immunology · doi:10.1002/eji.202149535 · Cited by 92
“reinfection is possible, cellular immunity is not similarly affected by mutations in the RBD site (16) and is likely to provide long-term protection against severe disease.”
BackgroundThiruvengadam, R., Awasthi, A., Medigeshi, G., Bhattacharya, S., Mani, S., Sivasubbu, S., Shrivastava, T., Samal, S., Rathna Murugesan, D., Koundinya Desiraju, B., et al. (2022) · The Lancet Infectious Diseases · doi:10.1016/s1473-3099(21)00680-0 · Cited by 96
Riou, C., Keeton, R., Moyo-Gwete, T., Hermanus, T., Kgagudi, P., Baguma, R., Valley‐Omar, Z., Smith, M., Tegally, H., Doolabh, D., et al. (2022) · Science Translational Medicine · doi:10.1126/scitranslmed.abj6824 · Cited by 104
A self-amplifying RNA vaccine against COVID-19 with long-term room-temperature stability
Voigt, E. A., Gerhardt, A., Hanson, D., Jennewein, M. F., Battisti, P., Reed, S., Singh, J., Mohamath, R., Bakken, J., Beaver, S., et al. (2022) · npj Vaccines · doi:10.1038/s41541-022-00549-y · Cited by 89
T cell reactivity to the SARS-CoV-2 Omicron variant is preserved in most but not all individuals
Naranbhai, V., Nathan, A., Kaseke, C., Berrios, C., Khatri, A., Choi, S., Getz, M. A., Tano-Menka, R., Ofoman, O., Gayton, A., et al. (2022) · Cell · doi:10.1016/j.cell.2022.03.022 · Cited by 88
Impact of antigenic evolution and original antigenic sin on SARS-CoV-2 immunity
Aguilar-Bretones, M., Fouchier, R. A. M., Koopmans, M., & van Nierop, G. P. (2023) · Journal of Clinical Investigation · doi:10.1172/jci162192 · Cited by 108
Self-citationChen, Y., Yin, S., Tong, X., Tao, Y., Ni, J., Pan, J., Li, M., Wan, Y., Mao, M., Xiong, Y., et al. (2021) · Clinical Microbiology and Infection · doi:10.1016/j.cmi.2021.10.006 · Cited by 98
“Besides, the alternative function of vaccineelicited antibody such as antibody-dependent cell-mediated cytotoxicity (ADCC) [27] were not evaluated.”
Gagné, M., Corbett, K. S., Flynn, B. J., Foulds, K. E., Wagner, D. A., Andrew, S. F., Todd, J.-P. M., Honeycutt, C. C., McCormick, L., Nurmukhambetova, S. T., et al. (2021) · Cell · doi:10.1016/j.cell.2021.12.002 · Cited by 71
“351), as this variant has the greatest impact on reducing neutralization by vaccinee and convalescent sera (Geers et al., 2021; Tada et al., 2021; Wang et al., 2021c) and was associated with reduced vaccine efficacy (Madhi et al.”
BackgroundInfluentialEvaluation of COVID-19 vaccine response in patients with cancer: An interim analysis
Tran, S., Truong, T. H., & Narendran, A. (2021) · European Journal of Cancer · doi:10.1016/j.ejca.2021.10.013 · Cited by 72
“Fourth, efficacy data of COVID-19 vaccines in patients with cancer against emerging variants of concern are limited, and partial immunogenic escape of SARS-CoV2 variants of concern has been observed in vaccinated individuals [72].”
Immunogenicity of COVID-19 vaccines in patients with diabetes mellitus: A systematic review
Boroumand, A. B., Forouhi, M., Karimi, F., Moghadam, A. S., Naeini, L. G., Kokabian, P., & Naderi, D. (2022) · Frontiers in Immunology · doi:10.3389/fimmu.2022.940357 · Cited by 71
“While, cellular immunity is also involved in immunization after COVID-19 vaccination (77).”
BackgroundTarke, A., Coelho, C. H., Zhang, Z., Dan, J. M., Yu, E. D., Methot, N., Bloom, N. I., Goodwin, B., Phillips, E. J., Mallal, S. A., et al. (2021) · bioRxiv (Cold Spring Harbor Laboratory) · doi:10.1101/2021.12.28.474333 · Cited by 42
“Our data demonstrate that the vast majority of T cell epitopes are fully conserved, not only in the “early” variants previously analyzed (Collier et al., 2021; Geers et al., 2021; Keeton et al., 2021; Melo-Gonzalez et al., 2021; Riou et al., 2021; Tarke et al., 2021b), but also in newer variants, suggesting that the c…”
BackgroundInfluentialNoori, M., Nejadghaderi, S. A., Arshi, S., Carson‐Chahhoud, K., Ansarin, K., Kolahi, A., & Safiri, S. (2021) · Reviews in Medical Virology · doi:10.1002/rmv.2277 · Cited by 64
“However, recent studies have suggested that T cell responses raised to early SARS‐CoV‐2 strains might be minimally impacted by emerging variants.(66,113,114) 4.”
BackgroundSARS-CoV-2 Beta variant infection elicits potent lineage-specific and cross-reactive antibodies
Reincke, S. M., Yuan, M., Kornau, H., Corman, V. M., van Hoof, S., Sánchez-Sendín, E., Ramberger, M., Yu, W., Hua, Y., Tien, H. J., et al. (2022) · Science · doi:10.1126/science.abm5835 · Cited by 75
“reduced neutralizing activity of sera from vaccinated and convalescent individuals against this VOC ( 1 – 6 , 11 , 12 ).”
Defending against SARS-CoV-2: The T cell perspective
Almendro-Vázquez, P., Laguna‐Goya, R., & Paz‐Artal, E. (2023) · Frontiers in Immunology · doi:10.3389/fimmu.2023.1107803 · Cited by 67
“This indicates that individuals with breakthrough infection do not have a preferential bias toward spike responses, which is especially important given the continued emergence of VoCs and the current increase in the rate of breakthrough infection (131, 226).”
BackgroundAntibody Responses to Natural SARS-CoV-2 Infection or after COVID-19 Vaccination
Altawalah, H. (2021) · Vaccines · doi:10.3390/vaccines9080910 · Cited by 74
Valyi-Nagy, I. T., Matula, Z., Gönczi, M., Tasnády, S., Bekő, G., Réti, M., Ajzner, É., & Uher, F. (2021) · GeroScience · doi:10.1007/s11357-021-00471-6 · Cited by 80
Lim, J. M. E., Hang, S. K., Hariharaputran, S., Chia, A., Tan, N., Lee, E. S., Chng, E., Lim, P. L., Young, B. E., Lye, D. C., et al. (2022) · Cell Reports Medicine · doi:10.1016/j.xcrm.2022.100793 · Cited by 73
Instructing durable humoral immunity for COVID-19 and other vaccinable diseases
Bhattacharya, D. (2022) · Immunity · doi:10.1016/j.immuni.2022.05.004 · Cited by 64
“While a complete loss of pre-existing neutralizing antibodies is unlikely to be fully compensated by other mechanisms, partial losses likely can be mitigated by non-neutralizing antibodies, memory B cell responses, and memory T cells, all of which resist viral mutations and persist for far longer than neutralizing ant…”
Influentialvan den Hoogen, L. L., Smits, G. P., van Hagen, C. C. E., Wong, D., Vos, E. R. A., van Boven, M., de Melker, H. E., van Vliet, J., Kuijer, M., Woudstra, L., et al. (2022) · Vaccine · doi:10.1016/j.vaccine.2022.03.009 · Cited by 58
“Lotus L. van den Hoogen a,⇑, Gaby Smits a, Cheyenne C.E. van Hagen b, Denise Wong b, Eric R.A. Vos b, Michiel van Boven b, Hester E. de Melker b, Jeffrey van Vliet a, Marjan Kuijer a, Linde Woudstra a, Alienke J. Wijmenga-Monsuur a, Corine H. GeurtsvanKessel c, Susanne P. Stoof d, Daphne Reukers e, Lisa A. Wijsman e,…”
InfluentialSelf-citationMaringer, Y., Nelde, A., Schroeder, S. M., Schuhmacher, J., Hörber, S., Peter, A., Karbach, J., Jäger, E., & Walz, J. S. (2022) · Science Immunology · doi:10.1126/sciimmunol.add3899 · Cited by 62
Ahmed, S. F., Quadeer, A. A., & McKay, M. R. (2022) · Viruses · doi:10.3390/v14010079 · Cited by 81
“SARS-CoV-2 T cell responses induced by either natural infection or vaccines have been linked to rapid viral clearance and reduced disease severity [6–8], even when the neutralizing antibody response is reduced [9] or absent [10].”
BackgroundJaganathan, S., Stieber, F., Rao, S. N., Nikolayevskyy, V., Manissero, D., Allen, N. P. C., Boyle, J., & Howard, J. (2021) · Infectious Diseases and Therapy · doi:10.1007/s40121-021-00521-8 · Cited by 74
Goel, R. R., Painter, M. M., Apostolidis, S. A., Mathew, D., Meng, W., Rosenfeld, A. M., Lundgreen, K. A., Reynaldi, A., Khoury, D. S., Pattekar, A., et al. (2021) · bioRxiv (Cold Spring Harbor Laboratory) · doi:10.1101/2021.08.23.457229 · Cited by 59
Virological characteristics of SARS-CoV-2 vaccine breakthrough infections in health care workers
Shamier, M. C., Tostmann, A., Bogers, S., de Wilde, J., IJpelaar, J., van der Kleij, W. A., de Jager, H., Haagmans, B. L., Molenkamp, R., Oude Munnink, B. B., et al. (2021) · doi:10.1101/2021.08.20.21262158 · Cited by 56
Self-citationImmunocompromised Patients with Protracted COVID-19: a Review of “Long Persisters”
Dioverti, M. V., Salto‐Alejandre, S., & Haidar, G. (2022) · Current Transplantation Reports · doi:10.1007/s40472-022-00385-y · Cited by 79
Chiuppesi, F., Nguyen, V. H., Park, Y., Contreras, H., Karpinski, V., Faircloth, K., Nguyen, J., Kha, M., Johnson, D., Martinez, J., et al. (2022) · npj Vaccines · doi:10.1038/s41541-022-00436-6 · Cited by 61
An ACE2 Triple Decoy that neutralizes SARS-CoV-2 shows enhanced affinity for virus variants
Tanaka, S., Nelson, G., Olson, C. A., Buzko, O. V., Higashide, W., Shin, A., Gonzalez, M. R., Taft, J. D., Patel, R. S., Buta, S., et al. (2021) · Scientific Reports · doi:10.1038/s41598-021-91809-9 · Cited by 65
Almendro-Vázquez, P., Laguna‐Goya, R., Ruiz‐Ruigómez, M., Utrero‐Rico, A., Lalueza, A., de la Calle, G. M., Delgado, P., Ordoño, L. P., Muro, E., Vila, J. J., et al. (2021) · PLoS Pathogens · doi:10.1371/journal.ppat.1010211 · Cited by 60
Low, J. G., de Alwis, R., Chen, S., Kalimuddin, S., Leong, Y. S., Mah, T. K. L., Yuen, N., Tan, H. C., Zhang, S. L., Sim, J. X. Y., et al. (2022) · npj Vaccines · doi:10.1038/s41541-022-00590-x · Cited by 61
mRNA vaccines: a new opportunity for malaria, tuberculosis and HIV
Matarazzo, L., & Bettencourt, P. J. G. (2023) · Frontiers in Immunology · doi:10.3389/fimmu.2023.1172691 · Cited by 68
“Interestingly, some observations suggest that memory T cells are less affected by immune escape observed with mutation variants of the virus than antibody-mediated responses and may thus be important for protection against SARS-CoV-2 variants (95, 96).”
BackgroundImmunogenicity Rates After SARS-CoV-2 Vaccination in People With End-stage Kidney Disease
Chen, J.-J., Lee, T.-H., Tian, Y.-C., et al. (2021) · JAMA Network Open · doi:10.1001/jamanetworkopen.2021.31749 · Cited by 62
Kho, M. M. L., Messchendorp, A. L., Frölke, S. C., Imhof, C., Koomen, V., Malahe, S. R. K., Vart, P., Geers, D., de Vries, R. D., GeurtsvanKessel, C. H., et al. (2022) · The Lancet Infectious Diseases · doi:10.1016/s1473-3099(22)00650-8 · Cited by 72
Self-citationSingle-cell profiling of the antigen-specific response to BNT162b2 SARS-CoV-2 RNA vaccine
Kramer, K. J., Wilfong, E. M., Voss, K., Barone, S. M., Shiakolas, A. R., Raju, N., Roe, C. E., Suryadevara, N., Walker, L. M., Wall, S. C., et al. (2022) · Nature Communications · doi:10.1038/s41467-022-31142-5 · Cited by 59
An mRNA-based T-cell-inducing antigen strengthens COVID-19 vaccine against SARS-CoV-2 variants
Tai, W., Feng, S., Chai, B., Lu, S., Zhao, G., Chen, D., Yu, W., Ren, L., Shi, H., Lü, J., et al. (2023) · Nature Communications · doi:10.1038/s41467-023-38751-8 · Cited by 58
Assawakosri, S., Kanokudom, S., Suntronwong, N., et al. (2022) · medRxiv · doi:10.1101/2022.01.28.22269986 · Cited by 59
Role of T cells in severe COVID-19 disease, protection, and long term immunity
Hermens, J. M., & Keşmir, C. (2023) · Immunogenetics · doi:10.1007/s00251-023-01294-9 · Cited by 57
The ins and outs of SARS-CoV-2 variants of concern (VOCs)
Salehi-Vaziri, ., Fazlalipour, M., Khorrami, S. M. S., Azadmanesh, K., Pouriayevali, M. H., Jalali, T., Shoja, Z., & Maleki, A. (2022) · Archives of Virology · doi:10.1007/s00705-022-05365-2 · Cited by 61
An Il12 mRNA-LNP adjuvant enhances mRNA vaccine–induced CD8 T cell responses
Aunins, E., Phan, A. T., Alameh, M., Dwivedi, G., Cruz-Morales, E., Christian, D. A., Tam, Y. K., Bunkofske, M. E., Zabala-Peñafiel, A., O’Dea, K. M., et al. (2025) · Science Immunology · doi:10.1126/sciimmunol.ads1328 · Cited by 75
Carmen, J. M., Shrivastava, S., Lu, Z., Anderson, A., Morrison, E. B., Sankhala, R. S., Chen, W., Chang, W. C., Bolton, J. S., Matyas, G. R., et al. (2021) · npj Vaccines · doi:10.1038/s41541-021-00414-4 · Cited by 77
The Robustness of Cellular Immunity Determines the Fate of SARS-CoV-2 Infection
Moga, E., Lynton‐Pons, E., & Domingo, P. (2022) · Frontiers in Immunology · doi:10.3389/fimmu.2022.904686 · Cited by 48
Multiple Sclerosis and SARS-CoV-2: Has the Interplay Started?
Bellucci, G., Rinaldi, V., Buscarinu, M. C., Reniè, R., Bigi, R., Pellicciari, G., Morena, E., Romano, C., Marrone, A., Mechelli, R., et al. (2021) · Frontiers in Immunology · doi:10.3389/fimmu.2021.755333 · Cited by 59
Achiron, A., Mandel, M., Gurevich, M., et al. (2022) · Journal of Neurology · doi:10.1007/s00415-022-11030-0 · Cited by 52
BNT162b2-induced memory T cells respond to the Omicron variant with preserved polyfunctionality
Jung, M. K., Jeong, S. D., Noh, J. Y., Kim, D.-U., Jung, S., Song, J. Y., Jeong, H. W., Park, S., & Shin, E. (2022) · Nature Microbiology · doi:10.1038/s41564-022-01123-x · Cited by 54
Fumagalli, V., Ravà, M., Marotta, D., Lucia, P. D., Bono, E. B., Giustini, L., Leo, F. D., Casalgrandi, M., Monteleone, E., Mouro, V., et al. (2024) · Nature Immunology · doi:10.1038/s41590-024-01787-z · Cited by 61
“Additionally, T cells recognize a broad epitopic landscape largely conserved despite mutations in emergent SARS-CoV-2 variants 46,47 .”
COVID ‐19 and plasma cells: Is there long‐lived protection?*
Nguyen, D. C., Lamothe, P. A., Woodruff, M. C., Saini, A. S., Faliti, C. E., Sanz, I., & Lee, F. E.-H. (2022) · Immunological Reviews · doi:10.1111/imr.13115 · Cited by 48
Hallam, J. E., Jones, T. C., Alley, J., & Kohut, M. L. (2022) · Brain Behavior and Immunity · doi:10.1016/j.bbi.2022.02.005 · Cited by 68
Kwok, S. L. L., Cheng, S. M. S., Leung, J. N., Leung, K. S. M., Lee, C. K., Peiris, M. J. S., & Wu, J. T. K. (2022) · Eurosurveillance · doi:10.2807/1560-7917.es.2022.27.2.2101197 · Cited by 44
Vignier, N., Bérot, V., Bonnave, N., Peugny, S., Ballet, M., Jacoud, E., Michaud, C., Gaillet, M., Djossou, F., Blanchet, D., et al. (2021) · Emerging infectious diseases · doi:10.3201/eid2710.211427 · Cited by 44
Simón, D., Taşçılar, K., Fagni, F., Schmidt, K. G., Krönke, G., Kleyer, A., Ramming, A., Schönau, V., Bohr, D., Knitza, J., et al. (2021) · Annals of the Rheumatic Diseases · doi:10.1136/annrheumdis-2021-221554 · Cited by 50
B Cell Depletion and SARS‐CoV ‐2 Vaccine Responses in Neuroimmunologic Patients
Kornek, B., Leutmezer, F., Rommer, P. S., Koblischke, M., Schneider, L., Haslacher, H., Thalhammer, R., Zimprich, F., Zulehner, G., Bsteh, G., et al. (2021) · Annals of Neurology · doi:10.1002/ana.26309 · Cited by 48
“Although most vaccine efforts have focused on the generation of humoral immune responses, T cell-mediated immunity also contributes to vaccine efficacy in healthy controls(17,18) and may be important for the protection against mutant SARS-CoV-2 variants.(19) Moreover, recent data indicate that T cell responses may red…”
BackgroundYing, B., Darling, T. L., Desai, P., Liang, C.-Y., Dmitriev, I. P., Soudani, N., Bricker, T. L., Kashentseva, E. A., Harastani, H., Raju, S., et al. (2024) · Nature Immunology · doi:10.1038/s41590-024-01743-x · Cited by 49
Horiuchi, S., Oishi, K., Carrau, L., Frere, J. J., Møller, R., Panis, M., & tenOever, B. R. (2021) · Science Immunology · doi:10.1126/sciimmunol.abm3131 · Cited by 45
Rappaport, A., Hong, S., Scallan, C. D., Gitlin, L., Akoopie, A., Boucher, G. R., Egorova, M., Espinosa, J. A., Fidanza, M., Kachura, M. A., et al. (2022) · Nature Communications · doi:10.1038/s41467-022-31005-z · Cited by 57
Ngonghala, C. N., Taboe, H. B., Safdar, S., & Gumel, A. B. (2022) · Applied Mathematical Modelling · doi:10.1016/j.apm.2022.09.017 · Cited by 53
García-Valtanen, P., Hope, C. M., Masavuli, M. G., Yeow, A. E. L., Balachandran, H., Mekonnen, Z. A., Al-Delfi, Z., Abayasingam, A., Agapiou, D., Stella, A. O., et al. (2022) · Cell Reports Medicine · doi:10.1016/j.xcrm.2022.100651 · Cited by 43
“25,26 For the context of this experiment and its results, it is important to note that our cohort was infected in early 2020 in Australia, where SARS-CoV-2 with unmutated spike amino-acid sequences was prevalent (Figure 6A).”
InfluentialAchtnichts, L., Jakopp, B., Oberle, M., Nedeltchev, K., Fux, C. A., Sellner, J., & Findling, O. (2021) · Vaccines · doi:10.3390/vaccines9121470 · Cited by 40
Guo, L., Zhang, Q., Gu, X., Ren, L., Huang, T., Li, Y., Zhang, H., Liu, Y., Zhong, J., Wang, X., et al. (2023) · The Lancet Microbe · doi:10.1016/s2666-5247(23)00255-0 · Cited by 59
Mak, W. A., Koeleman, J. G. M., van der Vliet, M., Keuren, F., & Ong, D. S. Y. (2021) · Journal of Infection · doi:10.1016/j.jinf.2021.12.003 · Cited by 37
Sanders, J., Messchendorp, A. L., de Vries, R. D., Baan, C. C., van Baarle, D., van Binnendijk, R. S., Diavatopoulos, D. A., Geers, D., Schmitz, K. S., GeurtsvanKessel, C. H., et al. (2022) · Clinical Infectious Diseases · doi:10.1093/cid/ciac557 · Cited by 51
“BAU/mL, binding antibody units per milliliter. aP < .001. e194 • CID 2023:76 (1 February) • Sanders et al COVID-19 Vaccination in Kidney Patients • CID 2023:76 (1 February) • e195 second vaccination, especially in KTRs, the levels of neutralizing antibodies against the ancestral and emerging variants as well as T-cell…”
InfluentialSelf-citationPeculiarities of the T Cell Immune Response in COVID-19
Kudlay, D. A., Кофиади, И. А., & Khaitov, M. R. (2022) · Vaccines · doi:10.3390/vaccines10020242 · Cited by 43
Variations within the Glycan Shield of SARS-CoV-2 Impact Viral Spike Dynamics
Newby, M. L., Fogarty, C. A., Allen, J. D., Butler, J., Fadda, E., & Crispin, M. (2022) · Journal of Molecular Biology · doi:10.1016/j.jmb.2022.167928 · Cited by 49
Wild, K., Smits, M., Killmer, S., Strohmeier, S., Neumann‐Haefelin, C., Bengsch, B., Krammer, F., Schwemmle, M., Hofmann, M., Thimme, R., et al. (2021) · Nature Communications · doi:10.1038/s41467-021-27064-3 · Cited by 50
Clark, J. J., Hoxie, I., Adelsberg, D. C., Sapse, I. A., Andreata‐Santos, R., Yong, J. S., Amanat, F., Tcheou, J., Raskin, A. J., Singh, G., et al. (2024) · Cell Reports · doi:10.1016/j.celrep.2024.114922 · Cited by 43
Rzymski, P., Pazgan−Simon, M., Simon, K. A., Łapiński, T. W., Zarębska‐Michaluk, D., Szczepańska, B., Chojnicki, M., Mozer‐Lisewska, I., & Flisiak, R. (2021) · Vaccines · doi:10.3390/vaccines9070781 · Cited by 42
“351, do not escape the T-cell-mediated immunity that is elicited through vaccination [32].”
BackgroundCOVID-19: From emerging variants to vaccination
Senevirathne, T. H., Wekking, D., Swain, J. W. R., Solinas, C., & Silva, P. D. (2023) · Cytokine & Growth Factor Reviews · doi:10.1016/j.cytogfr.2023.11.005 · Cited by 45
Dulfer, E. A., Geckin, B., Taks, E., GeurtsvanKessel, C. H., Dijkstra, H., van Emst, L., Jongh, C. E. V. D. G., van Mourik, D., Koopmans, P. C., Domínguez‐Andrés, J., et al. (2023) · The Lancet Regional Health - Europe · doi:10.1016/j.lanepe.2023.100628 · Cited by 33
Self-citationDurability of ChAdOx1 nCoV-19 vaccination in people living with HIV
Ogbe, A., Pace, M. J., Bittaye, M., Tipoe, T., Adele, S., Alagaratnam, J., Aley, P. K., Ansari, M. A., Bara, A., Broadhead, S., et al. (2022) · JCI Insight · doi:10.1172/jci.insight.157031 · Cited by 44
“One 400 study assessing T cell responses between 21 – 28 days after full BNT162b2 401 vaccination found no differences between WT and VOC CD4 responses [66].”
Tan, N. H., Geers, D., Sablerolles, R. S. G., Rietdijk, W. J. R., Goorhuis, A., Postma, D. F., Visser, L. G., Bogers, S., van Dijk, L. L. A., Gommers, L., et al. (2023) · The Lancet Infectious Diseases · doi:10.1016/s1473-3099(23)00140-8 · Cited by 37
Self-citationMazzoni, A., Vanni, A., Spinicci, M., Capone, M., Lamacchia, G., Salvati, L., Coppi, M., Antonelli, A., Carnasciali, A., Farahvachi, P., et al. (2022) · Frontiers in Immunology · doi:10.3389/fimmu.2022.801431 · Cited by 44
COVID-19 vaccines: Immune correlates and clinical outcomes
Mahrokhian, S. H., Tostanoski, L. H., Vidal, S. J., & Barouch, D. H. (2024) · Human Vaccines & Immunotherapeutics · doi:10.1080/21645515.2024.2324549 · Cited by 43
Neidleman, J. A., Luo, X., McGregor, M. M., Xie, G., Murray, V., Greene, W. C., Lee, S. A., & Roan, N. R. (2021) · eLife · doi:10.7554/elife.72619 · Cited by 89
Metadata
- Authors
- Geers, D., Shamier, M. C., Bogers, S., den Hartog, G., Gommers, L., Nieuwkoop, N. N., Schmitz, K. S., Rijsbergen, L. C., van Osch, J. A. T., Dijkhuizen, E., Smits, G., Comvalius, A., van Mourik, D., Caniels, T. G., van Gils, M. J., Sanders, R. W., Oude Munnink, B. B., Molenkamp, R., de Jager, H. J., Haagmans, B. L., de Swart, R. L., Koopmans, M. P. G., van Binnendijk, R. S., de Vries, R. D., & GeurtsvanKessel, C. H.
- Affiliations
- Erasmus MC (NL)
- National Institute for Public Health and the Environment (NL)
- Amsterdam University Medical Centers (NL)
- Cornell University (US)
- Department of Viroscience, Erasmus MC, Rotterdam, Netherlands.
- Centre for Immunology of Infectious Diseases and Vaccines, National Institute for Public Health and the Environment, Bilthoven, Netherlands.
- Corresponding author
- Geers, Daryl
- Shamier, Marc C.
- de Vries, Rory D.
- GeurtsvanKessel, Corine H.
- ORCID
- Geers, Daryl
- Shamier, Marc C.
- Bogers, Susanne
- den Hartog, Gerco
- Gommers, Lennert
- Schmitz, Katharina S.
- Rijsbergen, Laurine C.
- Smits, Gaby
- Caniels, Tom G.
- van Gils, Marit J.
- Sanders, Rogier W.
- Oude Munnink, Bas B.
- Molenkamp, Richard
- de Jager, Herbert J.
- Haagmans, Bart L.
- de Swart, Rik L.
- Koopmans, Marion P. G.
- van Binnendijk, Robert S.
- de Vries, Rory D.
- GeurtsvanKessel, Corine H.
- Venue
- Science Immunology
- Published
- 2021-05-28
- Volume
- 6
- Issue
- 59
- ISSN
- 2470-9468 (ISSN-L)
- PMC
- PMC9268159
- OpenAlex
- W3165367963
- Cited by
- 529
- References
- 83
- Citations by year
- 2026: 15 · 2025: 40 · 2024: 75 · 2023: 94 · 2022: 204 · 2021: 101
- FWCI
- 37.69
- Type
- journal article
- Language
- en
- Open access
- hybrid
- doi.org
- Licence
- Locations
- Science Immunology (publishedVersion, cc-by)
- PubMed Central (publishedVersion, cc-by)
- PubMed (publishedVersion)
- EUR Research Repository (Erasmus University Rotterdam) (publishedVersion, cc-by)
- Pure Amsterdam UMC (submittedVersion, cc-by)
- Data Archiving and Networked Services (DANS) (submittedVersion, other-oa)
- EUR Research Repository (Erasmus University Rotterdam) (submittedVersion, cc-by)
- Rivm Repository (Netherlands National Institute for Public Health and the Environment) (submittedVersion)
- Rivm (National Institute for Public Health and the Environment) (submittedVersion)
- Funders
- Bill and Melinda Gates Foundation (INV-002022)
- Netherlands Organization for Scientific Research (VICI)
- ZonMW (10150062010005)
- Amsterdam UMC (AMC Fellowship)
- Top Sector Life Sciences Health; Health~Holland (EMCLHS20017)
- European Union’s Horizon 2020 RECoVER (101003589)
- Topics
- Health Sciences › Medicine › Infectious Diseases › SARS-CoV-2 and COVID-19 Research
- Life Sciences › Biochemistry, Genetics and Molecular Biology › Molecular Biology › vaccines and immunoinformatics approaches
- Health Sciences › Medicine › Infectious Diseases › COVID-19 Clinical Research Studies
- Keywords
- SARS-CoV-2, variants of concern, spike protein mutations, CD4+ T cells, humoral immunity, T cell response, vaccine recipients, immune evasion, SARS-CoV-2 spike protein
- MeSH terms
- COVID-19, SARS-CoV-2, COVID-19 Vaccines, Antibodies, Viral, Cell Line, Cross Reactions, Humans, Immunologic Memory, Vaccination, CD4-Positive T-Lymphocytes, CD8-Positive T-Lymphocytes, Spike Glycoprotein, Coronavirus
About these checks
Registry, retraction, Cites and statistics results are computed, not judged, with one exception: a printed reference that no index lists is read once by a model before it counts as a citation error. Claims are extracted by a model and kept only when their quote appears verbatim in the text; each cited source is then checked, with a model’s help, for whether it says what the claim relies on. Those verdicts can be wrong — read the claim’s quote and the cited source before relying on one.
A language model drew the claims from the paper on 2026-10-06, under version 3 of the claim definition (model deepseek-v4.1-flash, prompt extract-v3).
A second model labelled each claim on 2026-10-06 (model jev-1.13-20260917, definition revision gold-guideline-v0.2).
Cited sources are checked with a language model’s help (gpt-6-sol).
Statistics and arithmetic are recomputed, not judged.
Confidence bands are shown only for fields calibrated on our annotated test set. None is calibrated yet, so no band is shown.
What counts as a claim ›How we measure confidence ›How we check this ›
Are you an author, or do you see a problem with this page? Request a review
