

The DOI matches its Crossref record; 39 of the 39 references it cites were found in a registry or an index.
RSEM: accurate transcript quantification from RNA-Seq data with or without a reference genome
Open accessAbstract
Background: RNA-Seq is revolutionizing the way transcript abundances are measured. A key challenge in transcript quantification from RNA-Seq data is the handling of reads that map to multiple genes or isoforms. This issue is particularly important for quantification with de novo transcriptome assemblies in the absence of sequenced genomes, as it is difficult to determine which transcripts are isoforms of the same gene. A second significant issue is the design of RNA-Seq experiments, in terms of the number of reads, read length, and whether reads come from one or both ends of cDNA fragments. Results: We present RSEM, an user-friendly software package for quantifying gene and isoform abundances from single-end or paired-end RNA-Seq data. RSEM outputs abundance estimates, 95% credibility intervals, and visualization files and can also simulate RNA-Seq data. In contrast to other existing tools, the software does not require a reference genome. Thus, in combination with a de novo transcriptome assembler, RSEM enables accurate transcript quantification for species without sequenced genomes. On simulated and real data sets, RSEM has superior or comparable performance to quantification methods that rely on a reference genome. Taking advantage of RSEM's ability to effectively use ambiguously-mapping reads, we show that accurate gene-level abundance estimates are best obtained with large numbers of short single-end reads. On the other hand, estimates of the relative frequencies of isoforms within single genes may be improved through the use of paired-end reads, depending on the number of possible splice forms for each gene. Conclusions: RSEM is an accurate and user-friendly software tool for quantifying transcript abundances from RNA-Seq data. As it does not rely on the existence of a reference genome, it is particularly useful for quantification with de novo transcriptome assemblies. In addition, RSEM has enabled valuable guidance for cost-efficient design of quantification experiments with RNA-Seq, which is currently relatively expensive.
Overview
The claims and statistics of this paper haven’t been checked yet.
Run the check — free, no account needed. It reads the open-access text and checks the sources it cites.
Integrity signals
Registry
Cites
Statistics
Figures
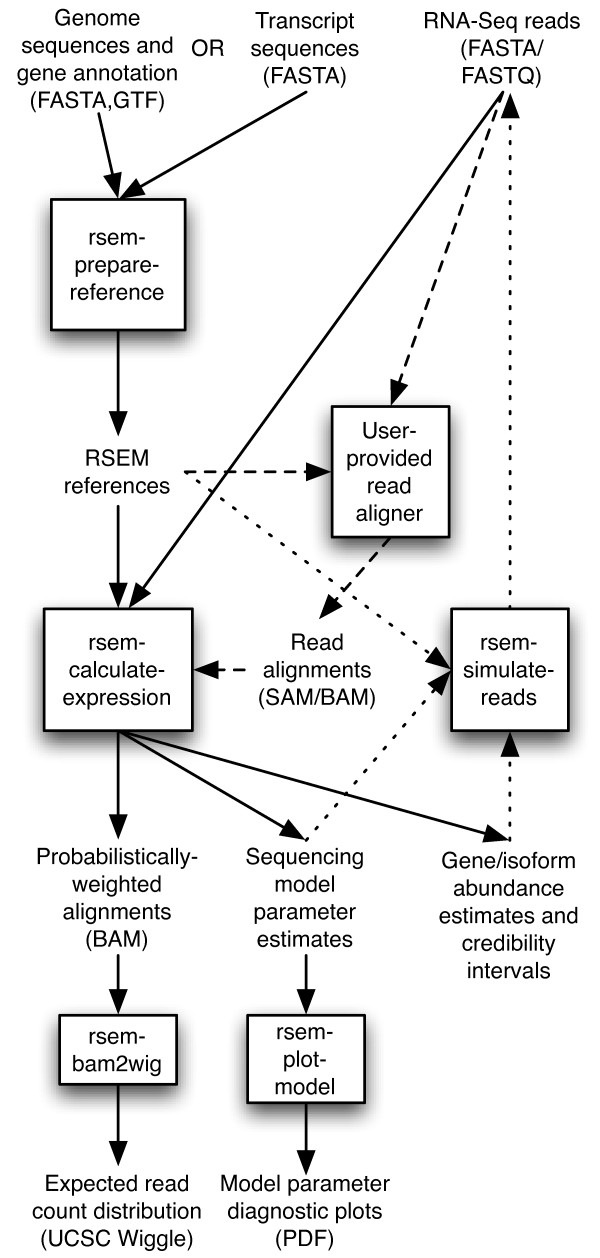
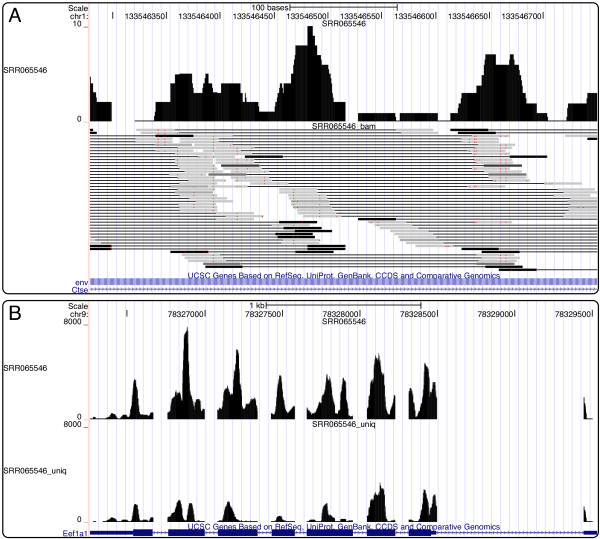
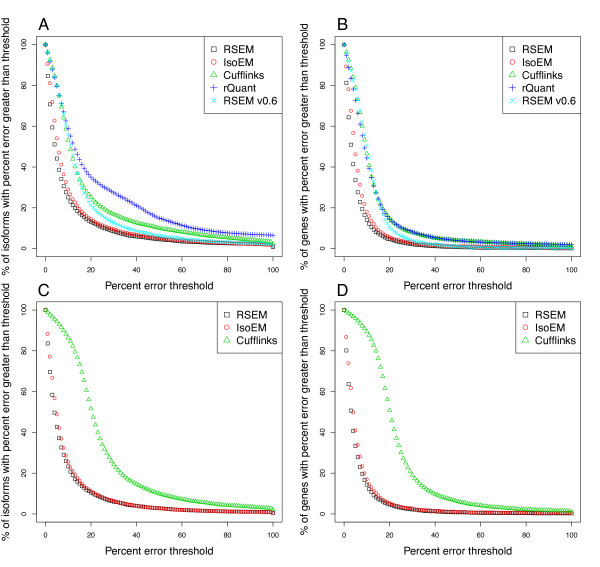
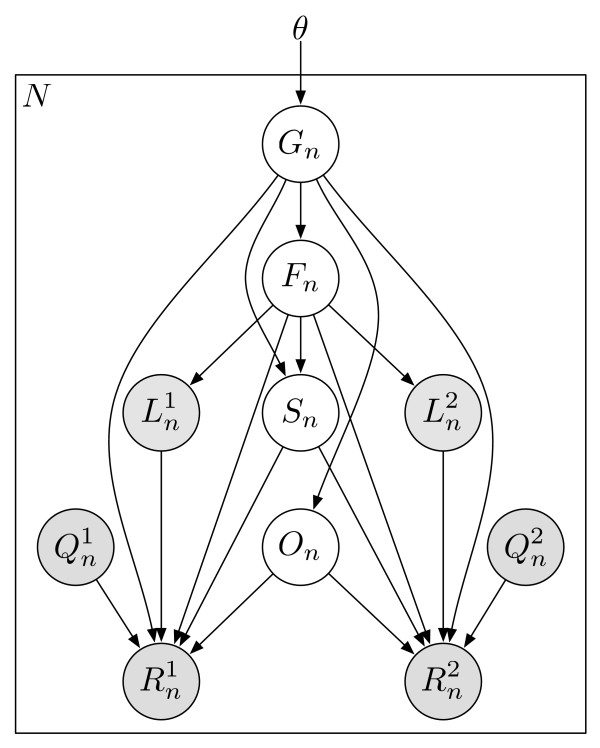
Verification
Claims the paper makes
The claims and statistics of this paper haven’t been checked yet.
Run the check — free, no account needed. It reads the open-access text and checks the sources it cites.
Claims other papers make about this one
Each is checked against this paper’s own text: does it say what the citing paper says it does?
The source backs part of the claim, not all of it — or backs it for a different population, condition or comparison.
In the citing paper
“Raw read counts are assembled outside limma using tools such as featureCounts (29), HTSeq-counts (30) or RSEM (31).”
From limma powers differential expression analyses for RNA-sequencing and microarray studies (2015) · cites this paper as [31]
Experimental — accuracy not yet measuredThe source backs part of the claim, not all of it — or backs it for a different population, condition or comparison.
In the citing paper
“Transcriptome alignment substantially reduces target complexity by limiting it to known transcripts, including all possible splice isoforms (Li and Dewey 2011).”
From RNA-Seq Alignment to Individualized Genomes Improves Transcript Abundance Estimates in Multiparent Populations (2014) · cites this paper as Li and Dewey 2011
Experimental — accuracy not yet measuredThe source backs part of the claim, not all of it — or backs it for a different population, condition or comparison.
In the citing paper
“our results confirm published reports that relative gene abundance estimates based solely on unique read counts are biased—genes composed primarily of unique sequence are overestimated while genes with closely related pseudogenes or family members are underestimated (Mortazavi et al. 2008; Li and Dewey 2011).”
From RNA-Seq Alignment to Individualized Genomes Improves Transcript Abundance Estimates in Multiparent Populations (2014) · cites this paper as Li and Dewey 2011
Experimental — accuracy not yet measuredThe cited source says what the claim attributes to it.
In the citing paper
“Additionally, the RSEM algorithm uses an expectation maximization approach that returns TPM values [40].”
From A survey of best practices for RNA-seq data analysis (2016) · cites this paper as [40]
The cited source says what the claim attributes to it.
In the citing paper
“The inclusion of multireads adds complexity to the abundance estimation problem but EM algorithms are well suited to this task (Li and Dewey 2011; Nicolae et al. 2011; Turro et al. 2011; Roberts and Pachter 2013).”
From RNA-Seq Alignment to Individualized Genomes Improves Transcript Abundance Estimates in Multiparent Populations (2014) · cites this paper as Li and Dewey 2011
Self-check
Percentages, sums and reported differences re-computed from the paper’s own numbers.
The self-check needs the paper’s full text.
Citations
Cites
The Sequence Alignment/Map format and SAMtools
Li, H., Handsaker, B., Wysoker, A., Fennell, T., Ruan, J., Homer, N., Marth, G., Abecasis, G., Durbin, R., & 1000 Genome Project Data Processing Subgroup (2009) · Bioinformatics · doi:10.1093/bioinformatics/btp352 · Cited by 62,041
Robinson, M. D., McCarthy, D. J., & Smyth, G. K. (2010) · Bioinformatics · doi:10.1093/bioinformatics/btp616 · Cited by 41,364
Ultrafast and memory-efficient alignment of short DNA sequences to the human genome.
Langmead, B., Trapnell, C., Pop, M., & Salzberg, S. L. (2009) · Genome Biology · doi:10.1186/gb-2009-10-3-r25 · Cited by 21,849
Full-length transcriptome assembly from RNA-Seq data without a reference genome
Grabherr, M. G., Haas, B. J., Yassour, M., Levin, J. Z., Thompson, D. A., Amit, I., Adiconis, X., Fan, L., Raychowdhury, R., Zeng, Q., et al. (2011) · Nature Biotechnology · doi:10.1038/nbt.1883 · Cited by 21,201
Differential expression analysis for sequence count data
Anders, S., & Huber, W. (2010) · Genome Biology · doi:10.1186/gb-2010-11-10-r106 · Cited by 15,581
Trapnell, C., Williams, B. A., Pertea, G., Mortazavi, A., Kwan, G., van Baren, M. J., Salzberg, S. L., Wold, B. J., & Pachter, L. (2010) · Nature Biotechnology · doi:10.1038/nbt.1621 · Cited by 15,556
Mapping and quantifying mammalian transcriptomes by RNA-Seq
Mortazavi, A., Williams, B. A., McCue, K., Schaeffer, L., & Wold, B. (2008) · Nature Methods · doi:10.1038/nmeth.1226 · Cited by 13,696
RNA-Seq: a revolutionary tool for transcriptomics
Wang, Z., Gerstein, M., & Snyder, M. (2009) · Nature Reviews Genetics · doi:10.1038/nrg2484 · Cited by 13,174
TopHat: discovering splice junctions with RNA-Seq
Trapnell, C., Pachter, L. S., & Salzberg, S. L. (2009) · Bioinformatics · doi:10.1093/bioinformatics/btp120 · Cited by 11,682
The Human Genome Browser at UCSC
Kent, W. J., Sugnet, C. W., Furey, T. S., Roskin, K. M., Pringle, T. H., Zahler, A. M., & Haussler, A. D. (2002) · Genome Research · doi:10.1101/gr.229102 · Cited by 10,400
Research works printed but not linked: 2
- Nicolae M, Mangul S, Măndoiu I, Zelikovsky A: Estimation of alternative splicing isoform frequencies from RNA-Seq data. In Algorithms in Bioinformatics, Lecture Notes in Computer Science. Edited by: Moulton V, Singh M. Liverpool, UK: Springer Berlin/Heidelberg; 2010:202–214. · DOI
- Taub M, Lipson D, Speed TP: Methods for allocating ambiguous short-reads. Communications in Information and Systems 2010, 10(2):69–82. · DOI
Cited by
Sorted by citations
Items 201–300 of 337
Cell types and neuronal circuitry underlying female aggression in Drosophila
Schretter, C. E., Aso, Y., Robie, A. A., Dreher, M., Dolan, M.-J., Chen, N., Ito, M., Yang, T., Parekh, R., Branson, K. M., et al. (2020) · eLife · doi:10.7554/elife.58942 · Cited by 125
Jamialahmadi, O., Mancina, R. M., Ciociola, E., Tavaglione, F., Luukkonen, P. K., Baselli, G., Malvestiti, F., Thuillier, D., Raverdy, V., Männistö, V., et al. (2021) · Gastroenterology · doi:10.1053/j.gastro.2020.12.023 · Cited by 148
Humphrey, J., Venkatesh, S., Hasan, R., Herb, J. T., de Paiva Lopes, K., Küçükali, F., Byrska-Bishop, M., Evani, U. S., Narzisi, G., Fagegaltier, D., et al. (2023) · Nature Neuroscience · doi:10.1038/s41593-022-01205-3 · Cited by 138
Leininger, S., Adamski, M., Bergum, B., Guder, C., Liu, J., Laplante, M., Bråte, J., Hoffmann, F., Fortunato, S., Jordal, S., et al. (2014) · Nature Communications · doi:10.1038/ncomms4905 · Cited by 136
Deveson, I. W., Holleley, C. E., Blackburn, J., Marshall Graves, J. A., Mattick, J. S., Waters, P. D., & Georges, A. (2017) · Science Advances · doi:10.1126/sciadv.1700731 · Cited by 132
“Weused a STAR-RSEM(40, 41)workflowwith the following STAR-mapping parameters: –outSAMstrandField intronMotif, –outFilterIntronMotifs RemoveNoncanonicalUnannotated, –outReadsUnmapped None, –alignMatesGapMax 200000, and alignIntronMax 5000000.”
InfluentialHe, L., Pratt, H., Gao, M., Wei, F., Weng, Z., & Struhl, K. (2021) · eLife · doi:10.7554/elife.67312 · Cited by 122
Aso, Y., Ray, R. P., Long, X., Bushey, D., Cichewicz, K., Ngo, T.-T., Sharp, B., Christoforou, C., Hu, A., Lemire, A. L., et al. (2019) · eLife · doi:10.7554/elife.49257 · Cited by 141
SCAF4 and SCAF8, mRNA Anti-Terminator Proteins
Gregersen, L. H., Mitter, R., Ugalde, A. P., Nojima, T., Proudfoot, N. J., Agami, R., Stewart, A., & Svejstrup, J. Q. (2019) · Cell · doi:10.1016/j.cell.2019.04.038 · Cited by 140
APOE Stabilization by Exercise Prevents Aging Neurovascular Dysfunction and Complement Induction
Soto, I., Graham, L. C., Richter, H. J., Simeone, S. N., Radell, J. E., Grabowska, W., Funkhouser, W. K., Howell, M. C., & Howell, G. R. (2015) · PLOS Biology · doi:10.1371/journal.pbio.1002279 · Cited by 140
Liguori, M., Nuzziello, N., Introna, A., Consiglio, A., Licciulli, F., D’Errico, E., Scarafino, A., Distaso, E., & Simone, I. L. (2018) · Frontiers in Molecular Neuroscience · doi:10.3389/fnmol.2018.00288 · Cited by 131
Representation and relative abundance of cell-type selective markers in whole-kidney RNA-Seq data
Clark, J. Z., Chen, L., Chou, C.-L., Jung, H. J., Lee, J. W., & Knepper, M. A. (2019) · Kidney International · doi:10.1016/j.kint.2018.11.028 · Cited by 136
Cherubini, A., Ostadreza, M., Jamialahmadi, O., Pelusi, S., Rrapaj, E., Casirati, E., Passignani, G., Norouziesfahani, M., Sinopoli, E., Baselli, G., et al. (2023) · Nature Medicine · doi:10.1038/s41591-023-02553-8 · Cited by 136
Early stem cell aging in the mature brain
Ibrayeva, A., Bay, M., Pu, E., Jörg, D. J., Peng, L., Jun, H., Zhang, N., Aaron, D., Lin, C., Resler, G., et al. (2021) · Cell Stem Cell · doi:10.1016/j.stem.2021.03.018 · Cited by 137
Ribosome stalling during selenoprotein translation exposes a ferroptosis vulnerability
Li, Z., Ferguson, L., Deol, K. K., Roberts, M. A., Magtanong, L., Hendricks, J. M., Mousa, G. A., Kilinc, S., Schaefer, K., Wells, J. A., et al. (2022) · Nature Chemical Biology · doi:10.1038/s41589-022-01033-3 · Cited by 134
Youlten, S. E., Kemp, J. P., Logan, J. G., Ghirardello, E. J., Sergio, C. M., Dack, M. R. G., Guilfoyle, S. E., Leitch, V. D., Butterfield, N. C., Komla-Ebri, D., et al. (2021) · Nature Communications · doi:10.1038/s41467-021-22517-1 · Cited by 133
A unique role for DNA (hydroxy)methylation in epigenetic regulation of human inhibitory neurons
Kozlenkov, A., Li, J., Apontes, P., Hurd, Y. L., Byne, W. M., Koonin, E. V., Wegner, M., Mukamel, E. A., & Dracheva, S. (2018) · Science Advances · doi:10.1126/sciadv.aau6190 · Cited by 103
Discovery and mass spectrometric analysis of novel splice-junction peptides using RNA-Seq
Sheynkman, G. M., Shortreed, M. R., Frey, B. L., & Smith, L. M. (2013) · Molecular & Cellular Proteomics · doi:10.1074/mcp.o113.028142 · Cited by 128
Resolving organoid brain region identities by mapping single-cell genomic data to reference atlases
Fleck, J. S., Sanchís-Calleja, F., He, Z., Santel, M., Boyle, M. J., Camp, J. G., & Treutlein, B. (2021) · Cell Stem Cell · doi:10.1016/j.stem.2021.02.015 · Cited by 118
A quantitative framework for characterizing the evolutionary history of mammalian gene expression
Chen, J., Swofford, R., Johnson, J., Cummings, B. B., Rogel, N., Lindblad-Toh, K., Haerty, W., Palma, F. D., & Regev, A. (2019) · Genome Research · doi:10.1101/gr.237636.118 · Cited by 128
Endogenous rRNA Sequence Variation Can Regulate Stress Response Gene Expression and Phenotype
Kurylo, C. M., Parks, M. M., Juette, M. F., Zinshteyn, B., Altman, R. B., Thibado, J. K., Vincent, C. T., & Blanchard, S. C. (2018) · Cell Reports · doi:10.1016/j.celrep.2018.08.093 · Cited by 117
Molecular characterization of colorectal cancer related peritoneal metastatic disease
Lenos, K. J., Bach, S., Ferreira Moreno, L., ten Hoorn, S., Sluiter, N. R., Bootsma, S., Vieira Braga, F. A., Nijman, L. E., van den Bosch, T., Miedema, D. M., et al. (2022) · Nature Communications · doi:10.1038/s41467-022-32198-z · Cited by 125
Chen, T.-W., Lee, C.-C., Liu, H., Wu, C.-S., Pickering, C. R., Huang, P.-J., Wang, J., Chang, I. Y.-F., Yeh, Y.-M., Chen, C.-D., et al. (2017) · Nature Communications · doi:10.1038/s41467-017-00493-9 · Cited by 115
Natural hybridization reveals incompatible alleles that cause melanoma in swordtail fish
Powell, D. L., García-Olazábal, M., Keegan, M., Reilly, P., Du, K., Díaz-Loyo, A. P., Banerjee, S., Blakkan, D., Reich, D., Andolfatto, P., et al. (2020) · Science · doi:10.1126/science.aba5216 · Cited by 124
Hosokawa, H., Ungerbäck, J., Wang, X., Matsumoto, M., Nakayama, K. I., Cohen, S. M., Tanaka, T., & Rothenberg, E. V. (2018) · Immunity · doi:10.1016/j.immuni.2018.04.024 · Cited by 116
Mosquera, J. V., Auguste, G., Wong, D., Turner, A. W., Hodonsky, C. J., Alvarez-Yela, A. C., Song, Y., Cheng, Q., Lino Cardenas, C. L., Theofilatos, K., et al. (2023) · Cell Reports · doi:10.1016/j.celrep.2023.113380 · Cited by 123
Zatreanu, D., Han, Z., Mitter, R., Tumini, E., Williams, H., Gregersen, L., Dirac-Svejstrup, A. B., Roma, S., Stewart, A., Aguilera, A., et al. (2019) · Molecular Cell · doi:10.1016/j.molcel.2019.07.037 · Cited by 124
Mastio, J., Condamine, T., Dominguez, G., Kossenkov, A. V., Donthireddy, L., Veglia, F., Lin, C., Wang, F., Fu, S., Zhou, J., et al. (2019) · Journal of Experimental Medicine · doi:10.1084/jem.20181952 · Cited by 115
Kaymaz, Y., Oduor, C. I., Yu, H., Otieno, J. A., Ong'echa, J. M., Moormann, A. M., & Bailey, J. A. (2017) · Molecular Cancer Research · doi:10.1158/1541-7786.mcr-16-0305 · Cited by 120
Mehta, S. R., Tom, C. M., Wang, Y., Bresee, C., Rushton, D., Mathkar, P. P., Tang, J., & Mattis, V. B. (2018) · Cell Reports · doi:10.1016/j.celrep.2018.09.076 · Cited by 112
Kriegsman, B. A., Vangala, P., Chen, B. J., Meraner, P., Brass, A. L., Garber, M., & Rock, K. L. (2019) · The Journal of Immunology · doi:10.4049/jimmunol.1900475 · Cited by 114
Yu, L., Li, Z., Mei, H., Li, W., Chen, D., Liu, L., Zhang, Z., Sun, Y., Song, F., Chen, W., et al. (2021) · Clinical & Translational Immunology · doi:10.1002/cti2.1248 · Cited by 113
Ramaswami, G., Won, H., Gandal, M. J., Haney, J., Wang, J. C., Wong, C. C. Y., Sun, W., Prabhakar, S., Mill, J., & Geschwind, D. H. (2020) · Nature Communications · doi:10.1038/s41467-020-18526-1 · Cited by 113
A limited capacity for microglial repopulation in the adult brain
Najafi, A. R., Crapser, J., Jiang, S., Ng, W., Mortazavi, A., West, B. L., & Green, K. N. (2018) · Glia · doi:10.1002/glia.23477 · Cited by 99
A multicenter study benchmarking single-cell RNA sequencing technologies using reference samples
Chen, W., Zhao, Y., Chen, X., Yang, Z., Xu, X., Bi, Y., Chen, V., Li, J., Choi, H., Ernest, B., et al. (2021) · Nature Biotechnology · doi:10.1038/s41587-020-00748-9 · Cited by 114
Differential transcriptome analysis of glandular and filamentous trichomes in Artemisia annua
Soetaert, S. S., Van Neste, C. M., Vandewoestyne, M. L., Head, S. R., Goossens, A., Van Nieuwerburgh, F. C., & Deforce, D. L. (2013) · BMC Plant Biology · doi:10.1186/1471-2229-13-220 · Cited by 109
Stopfer, L. E., Mesfin, J. M., Joughin, B. A., Lauffenburger, D. A., & White, F. M. (2020) · Nature Communications · doi:10.1038/s41467-020-16588-9 · Cited by 109
Hayer, K. E., Pizarro, A., Lahens, N. F., Hogenesch, J. B., & Grant, G. R. (2015) · Bioinformatics · doi:10.1093/bioinformatics/btv488 · Cited by 93
“, 2015), RSEM (Li and Dewey, 2011) and IsoEM (Nicolae et al.”
BackgroundTranscriptome assembly and isoform expression level estimation from biased RNA-Seq reads
Li, W., & Jiang, T. (2012) · Bioinformatics · doi:10.1093/bioinformatics/bts559 · Cited by 97
Brown, D. M., Hixon, A. M., Oldfield, L. M., Zhang, Y., Novotny, M., Wang, W., Das, S. R., Shabman, R. S., Tyler, K. L., & Scheuermann, R. H. (2018) · mBio · doi:10.1128/mbio.01954-18 · Cited by 105
Cx3cr1- deficient microglia exhibit a premature aging transcriptome
Gyoneva, S., Hosur, R., Gosselin, D., Zhang, B., Ouyang, Z., Cotleur, A. C., Peterson, M., Allaire, N., Challa, R., Cullen, P., et al. (2019) · Life Science Alliance · doi:10.26508/lsa.201900453 · Cited by 103
Group lasso regularized deep learning for cancer prognosis from multi-omics and clinical features
Xie, G., Dong, C., Kong, Y., Zhong, J. F., Li, M., & Wang, K. (2019) · Genes · doi:10.3390/genes10030240 · Cited by 102
Shigemizu, D., Mori, T., Akiyama, S., Higaki, S., Watanabe, H., Sakurai, T., Niida, S., & Ozaki, K. (2020) · Alzheimer's Research & Therapy · doi:10.1186/s13195-020-00654-x · Cited by 103
RNA‐seq Data: Challenges in and Recommendations for Experimental Design and Analysis
Williams, A. G., Thomas, S., Wyman, S. K., & Holloway, A. K. (2014) · Current Protocols in Human Genetics · doi:10.1002/0471142905.hg1113s83 · Cited by 93
Karakaslar, E. O., Katiyar, N., Hasham, M., Youn, A., Sharma, S., Chung, C., Marches, R., Korstanje, R., Banchereau, J., & Ucar, D. (2023) · Aging Cell · doi:10.1111/acel.13792 · Cited by 98
Lo, J. A., Kawakubo, M., Juneja, V. R., Su, M. Y., Erlich, T. H., LaFleur, M. W., Kemeny, L. V., Rashid, M., Malehmir, M., Rabi, S. A., et al. (2021) · Science Translational Medicine · doi:10.1126/scitranslmed.abd8636 · Cited by 97
Wang, L., Sfakianos, J. P., Beaumont, K. G., Akturk, G., Horowitz, A., Sebra, R. P., Farkas, A. M., Gnjatic, S., Hake, A., Izadmehr, S., et al. (2021) · Clinical Cancer Research · doi:10.1158/1078-0432.ccr-20-4574 · Cited by 97
Enhancing face validity of mouse models of Alzheimer’s disease with natural genetic variation
Onos, K. D., Uyar, A., Keezer, K. J., Jackson, H. M., Preuss, C., Acklin, C. J., O’Rourke, R., Buchanan, R., Cossette, T. L., Sukoff Rizzo, S. J., et al. (2019) · PLOS Genetics · doi:10.1371/journal.pgen.1008155 · Cited by 93
Jiang, S., Maphis, N. M., Binder, J., Chisholm, D., Weston, L., Duran, W., Peterson, C., Zimmerman, A., Mandell, M. A., Jett, S. D., et al. (2021) · Cell Reports · doi:10.1016/j.celrep.2021.109720 · Cited by 92
Zhang, H., Du, H., & Xu, Y. (2021) · Applied and Environmental Microbiology · doi:10.1128/aem.02992-20 · Cited by 92
Muñoz, J. F., Delorey, T., Ford, C. B., Li, B. Y., Thompson, D. A., Rao, R. P., & Cuomo, C. A. (2019) · Nature Communications · doi:10.1038/s41467-019-09599-8 · Cited by 89
Self-citationZhang, H., Madi, A., Yosef, N., Chihara, N., Awasthi, A., Pot, C., Lambden, C., Srivastava, A., Burkett, P. R., Nyman, J., et al. (2020) · Cell Reports · doi:10.1016/j.celrep.2020.108433 · Cited by 91
Acute microglia ablation induces neurodegeneration in the somatosensory system
Rubino, S. J., Mayo, L., Wimmer, I., Siedler, V., Brunner, F., Hametner, S., Madi, A., Lanser, A., Moreira, T., Donnelly, D., et al. (2018) · Nature Communications · doi:10.1038/s41467-018-05929-4 · Cited by 91
Veatch, J. R., Jesernig, B. L., Kargl, J., Fitzgibbon, M., Lee, S. M., Baik, C., Martins, R., Houghton, A. M., & Riddell, S. R. (2019) · Cancer Immunology Research · doi:10.1158/2326-6066.cir-18-0402 · Cited by 89
Rosebrock, D., Arora, S., Mutukula, N., Volkman, R., Gralinska, E., Balaskas, A., Aragonés Hernández, A., Buschow, R., Brändl, B., Müller, F.-J., et al. (2022) · Nature Cell Biology · doi:10.1038/s41556-022-00929-5 · Cited by 89
Fan, J., Lu, F., Qin, T., Peng, W., Zhuang, X., Li, Y., Hou, X., Fang, Z., Yang, Y., Guo, E., et al. (2023) · Nature Genetics · doi:10.1038/s41588-023-01570-0 · Cited by 93
Haplotype-aware pantranscriptome analyses using spliced pangenome graphs
Sibbesen, J. A., Eizenga, J. M., Novak, A. M., Sirén, J., Chang, X., Garrison, E., & Paten, B. (2023) · Nature Methods · doi:10.1038/s41592-022-01731-9 · Cited by 83
Munger, S. C., Raghupathy, N., Choi, K., Simons, A. K., Gatti, D. M., Hinerfeld, D. A., Svenson, K. L., Keller, M. P., Attie, A. D., Hibbs, M. A., et al. (2014) · Genetics · doi:10.1534/genetics.114.165886 · Cited by 85
Yang, B., Li, X., Zhang, W., Fan, J., Zhou, Y., Li, W., Yin, J., Yang, X., Guo, E., Li, X., et al. (2022) · Cell Reports Medicine · doi:10.1016/j.xcrm.2022.100856 · Cited by 84
Generation of human adult hepatocyte organoids with metabolic functions
Igarashi, R., Oda, M., Okada, R., Yano, T., Takahashi, S., Pastuhov, S., Matano, M., Masuda, N., Togasaki, K., Ohta, Y., et al. (2025) · Nature · doi:10.1038/s41586-025-08861-y · Cited by 85
Changes in nucleosome occupancy associated with metabolic alterations in aged mammalian liver
Bochkis, I. M., Przybylski, D., Chen, J., & Regev, A. (2014) · Cell Reports · doi:10.1016/j.celrep.2014.09.048 · Cited by 78
Dissecting Murine Muscle Stem Cell Aging through Regeneration Using Integrative Genomic Analysis
Shcherbina, A., Larouche, J., Fraczek, P., Yang, B. A., Brown, L. A., Markworth, J. F., Chung, C. H., Khaliq, M., de Silva, K., Choi, J. J., et al. (2020) · Cell Reports · doi:10.1016/j.celrep.2020.107964 · Cited by 76
Exploiting single-cell expression to characterize co-expression replicability
Crow, M., Paul, A., Ballouz, S., Huang, Z. J., & Gillis, J. (2016) · Genome Biology · doi:10.1186/s13059-016-0964-6 · Cited by 76
Repression of p63 and induction of EMT by mutant Ras in mammary epithelial cells
Yoh, K. E., Regunath, K., Guzman, A., Lee, S.-M., Pfister, N. T., Akanni, O., Kaufman, L. J., Prives, C., & Prywes, R. (2016) · Proceedings of the National Academy of Sciences · doi:10.1073/pnas.1613417113 · Cited by 75
Thongkorn, S., Kanlayaprasit, S., Jindatip, D., Tencomnao, T., Hu, V. W., & Sarachana, T. (2019) · Scientific Reports · doi:10.1038/s41598-019-39386-w · Cited by 66
Srinivasan, N., Gordon, O., Ahrens, S., Franz, A., Deddouche, S., Chakravarty, P., Phillips, D., Yunus, A. A., Rosen, M. K., Valente, R. S., et al. (2016) · eLife · doi:10.7554/elife.19662 · Cited by 69
Suphavilai, C., Chia, S., Sharma, A., Tu, L., Da Silva, R. P., Mongia, A., DasGupta, R., & Nagarajan, N. (2021) · Genome Medicine · doi:10.1186/s13073-021-01000-y · Cited by 58
UBR5 forms ligand-dependent complexes on chromatin to regulate nuclear hormone receptor stability
Tsai, J. M., Aguirre, J. D., Li, Y.-D., Brown, J., Focht, V., Kater, L., Kempf, G., Sandoval, B., Schmitt, S., Rutter, J. C., et al. (2023) · Molecular Cell · doi:10.1016/j.molcel.2023.06.028 · Cited by 68
Deconstructing Stepwise Fate Conversion of Human Fibroblasts to Neurons by MicroRNAs
Cates, K., McCoy, M. J., Kwon, J.-S., Liu, Y., Abernathy, D. G., Zhang, B., Liu, S., Gontarz, P., Kim, W. K., Chen, S., et al. (2021) · Cell Stem Cell · doi:10.1016/j.stem.2020.08.015 · Cited by 67
Linnstaedt, S. D., Riker, K. D., Rueckeis, C. A., Kutchko, K. M., Lackey, L., McCarthy, K. R., Tsai, Y.-H., Parker, J. S., Kurz, M. C., Hendry, P. L., et al. (2018) · The Journal of Neuroscience · doi:10.1523/jneurosci.3458-17.2018 · Cited by 66
Voigt, O., Adamski, M., Sluzek, K., & Adamska, M. (2014) · BMC Evolutionary Biology · doi:10.1186/s12862-014-0230-z · Cited by 63
Zhou, J., Chen, S., Wu, Y., Li, H., Zhang, B., Zhou, L., Hu, Y., Xiang, Z., Li, Z., Chen, N., et al. (2024) · Science Advances · doi:10.1126/sciadv.adh8601 · Cited by 63
TIGAR2: sensitive and accurate estimation of transcript isoform expression with longer RNA-Seq reads
Nariai, N., Kojima, K., Mimori, T., Sato, Y., Kawai, Y., Yamaguchi-Kabata, Y., & Nagasaki, M. (2014) · BMC Genomics · doi:10.1186/1471-2164-15-s10-s5 · Cited by 51
Mahalingam, R., Duhan, N., Kaundal, R., Smertenko, A., Nazarov, T., & Bregitzer, P. (2022) · Frontiers in Plant Science · doi:10.3389/fpls.2022.1066421 · Cited by 53
Tidal and diel orchestration of behaviour and gene expression in an intertidal mollusc
Schnytzer, Y., Simon-Blecher, N., Li, J., Waldman Ben-Asher, H., Salmon-Divon, M., Achituv, Y., Hughes, M. E., & Levy, O. (2018) · Scientific Reports · doi:10.1038/s41598-018-23167-y · Cited by 58
Han, H., Li, S., Chen, T., Fitzgerald, M., Liu, S., Peng, C., Tang, K. H., Cao, S., Chouitar, J., Wu, J., et al. (2021) · Cancer Research · doi:10.1158/0008-5472.can-21-1526 · Cited by 57
High-fat high-sugar diet induces polycystic ovary syndrome in a rodent model†
Roberts, J. S., Perets, R. A., Sarfert, K. S., Bowman, J. J., Ozark, P. A., Whitworth, G. B., Blythe, S. N., & Toporikova, N. (2017) · Biology of Reproduction · doi:10.1095/biolreprod.116.142786 · Cited by 58
Iwasaki, O., Tanizawa, H., Kim, K.-D., Kossenkov, A., Nacarelli, T., Tashiro, S., Majumdar, S., Showe, L. C., Zhang, R., & Noma, K.-I. (2019) · Nature Communications · doi:10.1038/s41467-019-13604-5 · Cited by 58
Taguchi, J., Shibata, H., Kabata, M., Kato, M., Fukuda, K., Tanaka, A., Ohta, S., Ukai, T., Mitsunaga, K., Yamada, Y., et al. (2021) · Nature Communications · doi:10.1038/s41467-021-25249-4 · Cited by 46
Genome-guided transcript assembly by integrative analysis of RNA sequence data
Boley, N., Stoiber, M. H., Booth, B. W., Wan, K. H., Hoskins, R. A., Bickel, P. J., Celniker, S. E., & Brown, J. B. (2014) · Nature Biotechnology · doi:10.1038/nbt.2850 · Cited by 48
Pemberton, H., Anderton, E., Patel, H., Brookes, S., Chandler, H., Palermo, R., Stock, J., Rodriguez-Niedenführ, M., Racek, T., de Breed, L., et al. (2014) · Genome Biology · doi:10.1186/gb-2014-15-2-r23 · Cited by 50
Missing Data and Technical Variability in Single-Cell RNA-Sequencing Experiments
Hicks, S. C., Townes, F. W., Teng, M., & Irizarry, R. A. (2015) · doi:10.1101/025528 · Cited by 625
Sexually dimorphic estrogen sensing in skeletal stem cells controls skeletal regeneration
Andrew, T. W., Koepke, L. S., Wang, Y., Lopez, M., Steininger, H., Struck, D., Boyko, T., Ambrosi, T. H., Tong, X., Sun, Y., et al. (2022) · Nature Communications · doi:10.1038/s41467-022-34063-5 · Cited by 51
Zeng, B., Glicksberg, B. S., Newbury, P., Chekalin, E., Xing, J., Liu, K., Wen, A., Chow, C., & Chen, B. (2021) · Nature Protocols · doi:10.1038/s41596-020-00430-z · Cited by 48
Yin, S., Wang, Y., Liu, N., Yang, M., Hu, Y., Li, X., Fu, Y., Luo, M., Sun, J., & Yang, X. (2019) · Biomedicine & Pharmacotherapy · doi:10.1016/j.biopha.2019.109535 · Cited by 51
Induction of a colitogenic phenotype in Th1-like cells depends on interleukin-23 receptor signaling
Pawlak, M., DeTomaso, D., Schnell, A., Meyer zu Horste, G., Lee, Y., Nyman, J., Dionne, D., Regan, B. M. L., Singh, V., Delorey, T., et al. (2022) · Immunity · doi:10.1016/j.immuni.2022.08.007 · Cited by 49
Origin and diversification of the plasminogen activation system among chordates
Chana-Muñoz, A., Jendroszek, A., Sønnichsen, M., Wang, T., Ploug, M., Jensen, J. K., Andreasen, P. A., Bendixen, C., & Panitz, F. (2019) · BMC Evolutionary Biology · doi:10.1186/s12862-019-1353-z · Cited by 48
Li, Z., Yu, Z., Gao, P., & Yin, D. (2020) · Science of The Total Environment · doi:10.1016/j.scitotenv.2019.134762 · Cited by 46
Red fox viromes in urban and rural landscapes
Campbell, S. J., Ashley, W., Gil-Fernandez, M., Newsome, T. M., Di Giallonardo, F., Ortiz-Baez, A. S., Mahar, J. E., Towerton, A. L., Gillings, M., Holmes, E. C., et al. (2020) · Virus Evolution · doi:10.1093/ve/veaa065 · Cited by 47
TREM2 splice isoforms generate soluble TREM2 species that disrupt long-term potentiation
Moutinho, M., Coronel, I., Tsai, A. P., Di Prisco, G. V., Pennington, T., Atwood, B. K., Puntambekar, S. S., Smith, D. C., Martinez, P., Han, S., et al. (2023) · Genome Medicine · doi:10.1186/s13073-023-01160-z · Cited by 42
“In the MSBB, RNA-Seq data were generated from the parahippocampal gyrus, inferior frontal gyrus, superior temporal gyrus, and frontal pole.”
MethodInfluentialAssessing Transcriptome Quality in Patch-Seq Datasets
Tripathy, S. J., Toker, L., Bomkamp, C., Mancarci, B. O., Belmadani, M., & Pavlidis, P. (2018) · Frontiers in Molecular Neuroscience · doi:10.3389/fnmol.2018.00363 · Cited by 39
The NuRD complex cooperates with SALL4 to orchestrate reprogramming
Wang, B., Li, C., Ming, J., Wu, L., Fang, S., Huang, Y., Lin, L., Liu, H., Kuang, J., Zhao, C., et al. (2023) · Nature Communications · doi:10.1038/s41467-023-38543-0 · Cited by 39
Alternative Splicing of NOX4 in the Failing Human Heart
Varga, Z. V., Pipicz, M., Baán, J. A., Baranyai, T., Koncsos, G., Leszek, P., Kuśmierczyk, M., Sánchez-Cabo, F., García-Pavía, P., Brenner, G. J., et al. (2017) · Frontiers in Physiology · doi:10.3389/fphys.2017.00935 · Cited by 43
Reininger, D., Fundel‐Clemens, K., Mayr, C. H., Wollin, L., Laemmle, B., Quast, K., Nickolaus, P., & Herrmann, F. E. (2024) · British Journal of Pharmacology · doi:10.1111/bph.17303 · Cited by 48
“3.0) (Li & Dewey, 2011) and featureCounts (v1.”
InfluentialZhang, Q., Linke, V., Overmyer, K. A., Traeger, L. L., Kasahara, K., Miller, I. J., Manson, D. E., Polaske, T. J., Kerby, R. L., Kemis, J. H., et al. (2023) · Nature Microbiology · doi:10.1038/s41564-023-01326-w · Cited by 43
Pandey, R. S., Graham, L., Uyar, A., Preuss, C., Howell, G. R., & Carter, G. W. (2019) · Molecular Neurodegeneration · doi:10.1186/s13024-019-0351-3 · Cited by 37
Loss of hepatocyte cell division leads to liver inflammation and fibrosis
Dewhurst, M. R., Ow, J. R., Zafer, G., van Hul, N. K. M., Wollmann, H., Bisteau, X., Brough, D., Choi, H., & Kaldis, P. (2020) · PLOS Genetics · doi:10.1371/journal.pgen.1009084 · Cited by 42
Mercado-Evans, V., Mejia, M. E., Zulk, J. J., Ottinger, S., Hameed, Z. A., Serchejian, C., Marunde, M. G., Robertson, C. M., Ballard, M. B., Ruano, S. H., et al. (2024) · Nature Communications · doi:10.1038/s41467-024-45336-6 · Cited by 40
Therapeutic blockade of ER stress and inflammation prevents NASH and progression to HCC
Boslem, E., Reibe, S., Carlessi, R., Smeuninx, B., Tegegne, S., Egan, C. L., McLennan, E., Terry, L. V., Nobis, M., Mu, A., et al. (2023) · Science Advances · doi:10.1126/sciadv.adh0831 · Cited by 39
Wang, J., Gao, J., Zheng, L., Fu, Y., Ji, L., Wang, C., Yuan, S., Yang, J., Liu, J., Li, G., et al. (2023) · Journal of Hazardous Materials · doi:10.1016/j.jhazmat.2023.130947 · Cited by 37
Nicosia, L., Boffo, F. L., Ceccacci, E., Conforti, F., Pallavicini, I., Bedin, F., Ravasio, R., Massignani, E., Somervaille, T. C. P., Minucci, S., et al. (2022) · Oncogene · doi:10.1038/s41388-021-02123-7 · Cited by 31
Metadata
- Authors
- Li, B., & Dewey, C. N.
- Affiliations
- University of Wisconsin–Madison (US)
- Corresponding author
- Dewey, Colin N
- ORCID
- Venue
- BMC Bioinformatics
- Published
- 2011-08-04
- Volume
- 12
- Issue
- 1
- Pages
- 323-323
- ISSN
- 1471-2105 (ISSN-L)
- PMC
- PMC3163565
- OpenAlex
- W1999574084
- Cited by
- 22,179
- References
- 39
- Citations by year
- 2026: 1650 · 2025: 2387 · 2024: 2647 · 2023: 2517 · 2022: 2448 · 2021: 2588 · 2020: 2146 · 2019: 1674 · 2018: 1311 · 2017: 1062 · 2016: 794 · 2015: 487 · 2014: 279 · 2013: 134 · 2012: 28
- FWCI
- 57.58
- Type
- journal article
- Language
- en
- Open access
- gold
- doi.org
- Locations
- BMC Bioinformatics (publishedVersion, cc-by)
- Europe PMC (PubMed Central) (publishedVersion, cc-by)
- PubMed Central (publishedVersion, cc-by)
- PubMed (publishedVersion)
- DOAJ (DOAJ: Directory of Open Access Journals) (submittedVersion, cc-by-sa)
- Funders
- National Institutes of Health
- National Human Genome Research Institute (R01HG005232)
- Topics
- Life Sciences › Biochemistry, Genetics and Molecular Biology › Molecular Biology › Genomics and Phylogenetic Studies
- Life Sciences › Biochemistry, Genetics and Molecular Biology › Molecular Biology › Single-cell and spatial transcriptomics
- Life Sciences › Biochemistry, Genetics and Molecular Biology › Molecular Biology › Gene expression and cancer classification
- Keywords
- RSEM, transcript quantification, RNA-seq, isoform abundance, gene expression, de novo transcriptome assembly, paired-end reads, single-end reads, credibility intervals
- MeSH terms
- Animals, Computer Simulation, Humans, RNA, Software, Sequence Analysis, RNA, Protein Isoforms, Gene Expression Profiling, Mice
About these checks
Registry, retraction, Cites and statistics results are computed, not judged, with one exception: a printed reference that no index lists is read once by a model before it counts as a citation error. Claims are extracted by a model and kept only when their quote appears verbatim in the text; each cited source is then checked, with a model’s help, for whether it says what the claim relies on. Those verdicts can be wrong — read the claim’s quote and the cited source before relying on one.
Statistics and arithmetic are recomputed, not judged.
Confidence bands are shown only for fields calibrated on our annotated test set. None is calibrated yet, so no band is shown.
What counts as a claim ›How we measure confidence ›How we check this ›
Are you an author, or do you see a problem with this page? Request a review
