

Binodal, wireless epidermal electronic systems with in-sensor analytics for neonatal intensive care
Open accessThe DOI matches its Crossref record; 44 of the 44 references it cites were found in a registry or an index; 12 of the 42 sources its claims cite were checked for support.
Abstract
Sensitive sensing Neonatal care, particularly for premature babies, is complicated by the infants' fragility and by the need for a large number of tethered sensors to be attached to their tiny bodies. Chung et al. developed a pair of sensors that only require water to adhere to the skin and allow for untethered monitoring of key vital signs (see the Perspective by Guinsburg). On-board data processing allowed for efficient wireless near-field communication using standard protocols. The absence of cables makes it easier to handle the infants and allows for skin-to-skin contact between the babies and their parents or caregivers. Science , this issue p. eaau0780 ; see also p. 924
Overview
CoChat Summary
TL;DR
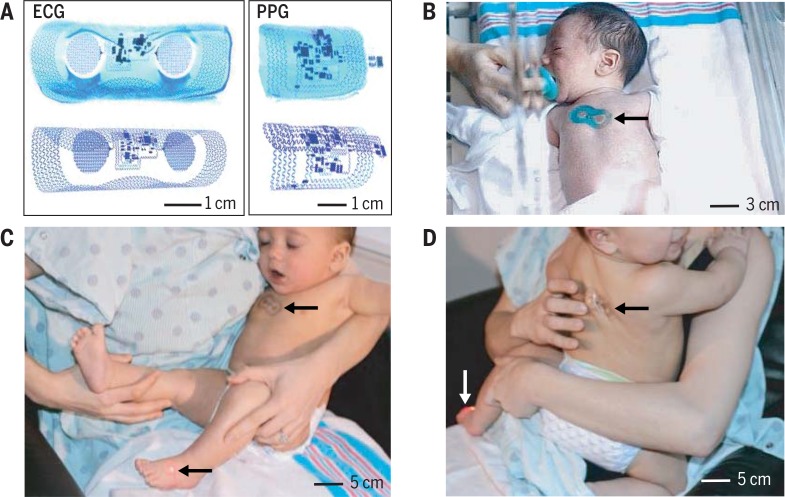
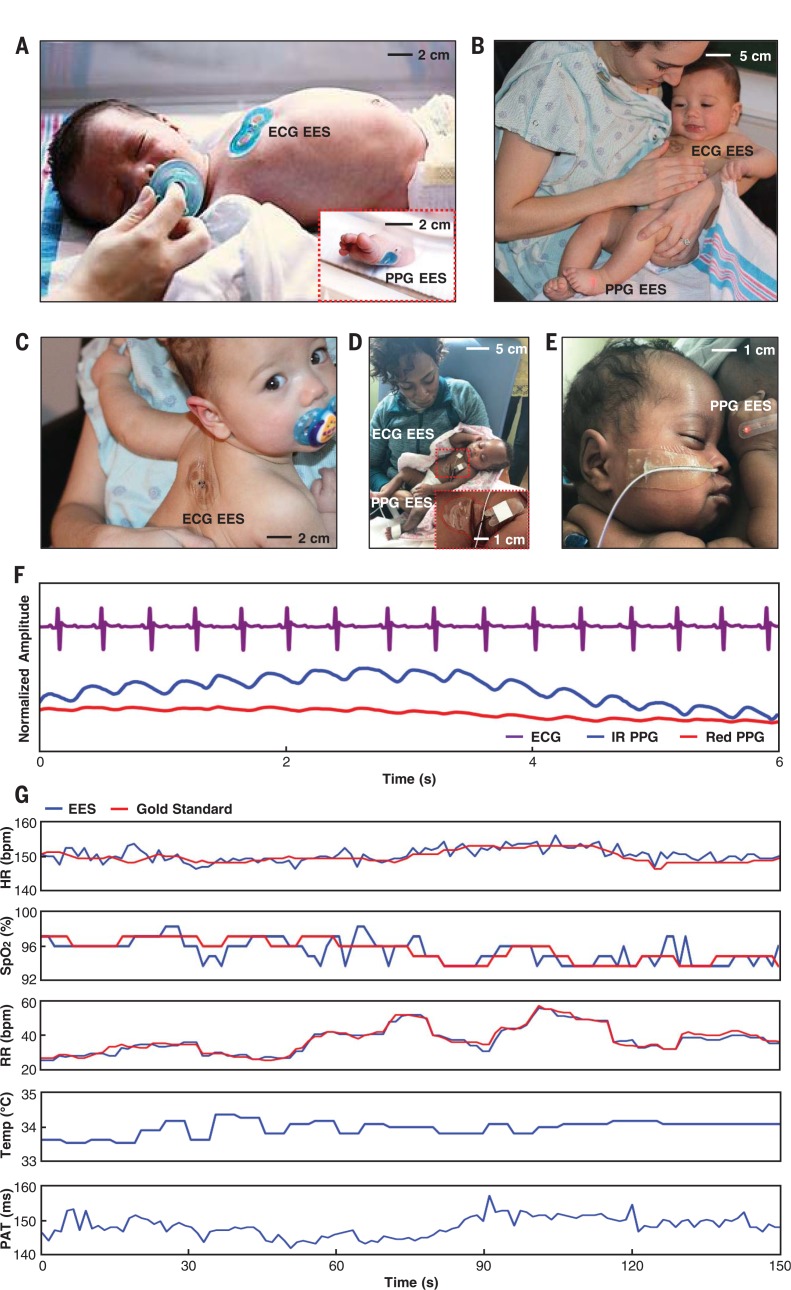
The paper introduces a pair of ultrathin, wireless, battery-free epidermal electronic systems (EES) for neonatal intensive care: one chest-mounted ECG device and one foot-mounted PPG device. Pilot studies in neonates show clinical-grade agreement for heart rate, respiratory rate, and SpO₂, plus added capabilities for skin temperature and pulse arrival time as a systolic blood pressure surrogate.
Key findings
- The binodal EES continuously streams ECG, PPG, and skin temperature data, yielding HR, HRV, RR, SpO₂, and PAT; wireless data rates reach up to 800 bytes/s with dual channels, NFC operation works up to 25 cm through NICU materials, and BLE range reaches up to 20 m.
- The devices have effective moduli of 200 to 300 kPa, adhere via van der Waals forces, and show peel forces about a factor of ~10 lower than conventional NICU adhesives, with maximum von Mises stress on skin reduced by a factor of 4.3; the microfluidic channel reduces interfacial stresses by up to a factor of 2.5, and adhesion energy is G = 16 N/m.
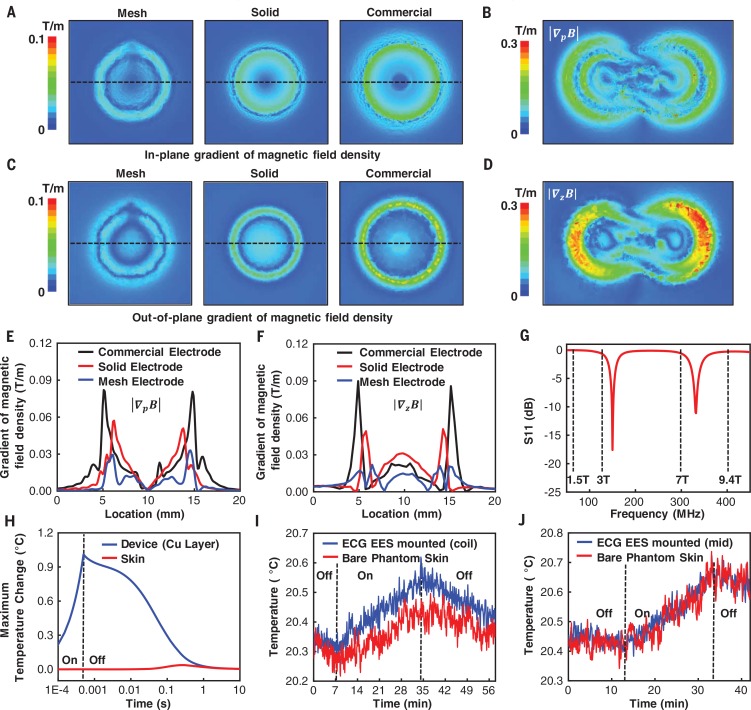
- For MRI compatibility, mesh electrodes reduce the in-plane magnetic field gradient by a factor of ~3 and the out-of-plane gradient by a factor of 4 versus commercial electrodes; simulated copper heating is 1°C with maximum skin temperature change of 0.04°C, and experimental 3-T MRI measurements show ~0.1°C temperature difference, meeting FDA “MRI-safe” requirements.
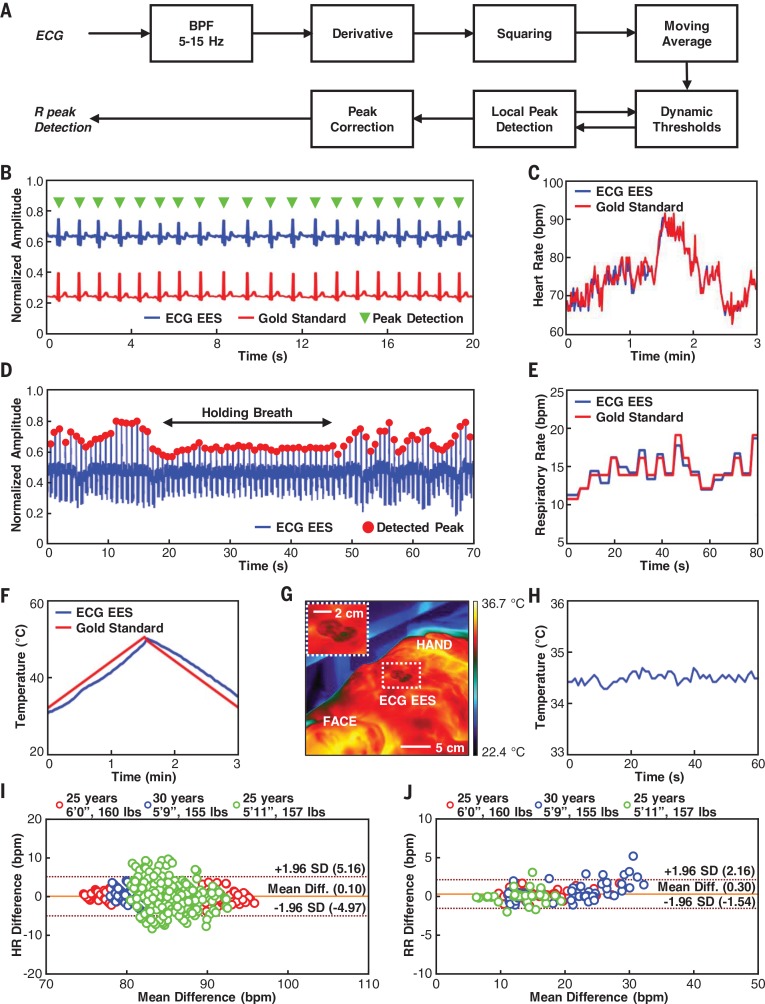
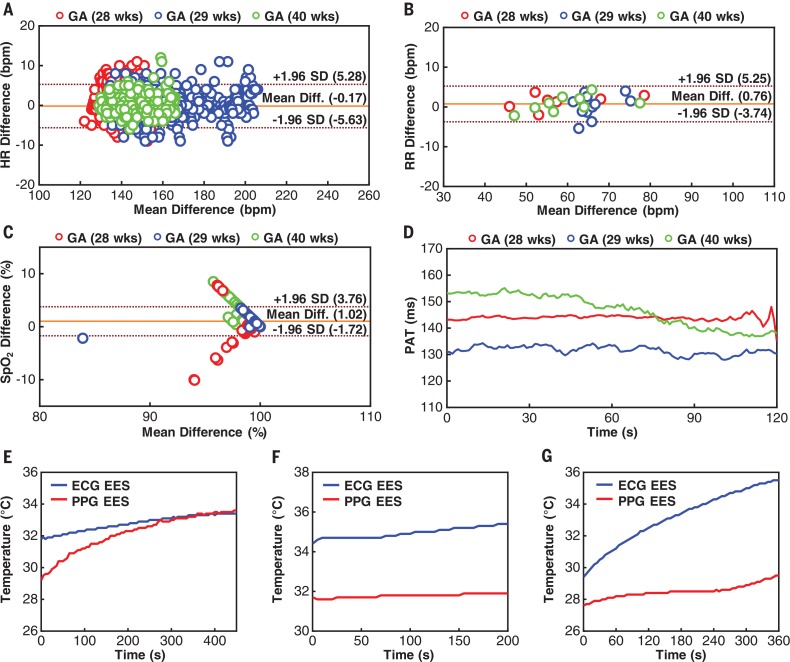
- In neonates (n = 3, gestational age 28 to 40 weeks), mean differences versus standard-of-care monitors were –0.17 beats per minute for HR, 0.76 breaths per minute for RR, and 1.02% for SpO₂; additional studies in n = 18 neonates with gestational ages as low as 28 weeks and weights as low as 1470 g showed similar performance, and scaled production cost is estimated at less than $20 USD per unit.
Methods
- Fabrication used semiconductor processing, lamination, transfer printing, chip placement, and solder bonding; each EES includes serpentine Cu traces, chip-scale ICs, fractal mesh electrodes, an ionic-liquid microfluidic chamber, silicone encapsulation, and an NFC loop antenna for simultaneous wireless power and data.
- In-sensor analytics include a streamlined Pan-Tompkins algorithm for real-time QRS detection to yield HR and HRV, dynamic baseline control and SpO₂ calculation for PPG, and time-synchronized ECG/PPG processing for PAT.
- Validation included healthy adult volunteers (n = 3) against FDA-cleared monitoring equipment, and neonates in two tertiary-level NICUs: n = 3 with synchronous standard-of-care measurements and n = 18 using related device platforms with onboard power supplies; the protocol was IRB-approved and registered on ClinicalTrials.gov (NCT02865070).
Limitations
- The paper states that results are preliminary feasibility testing and validation; comprehensive clinical studies are ongoing to verify measurements across increased age groups and ethnic backgrounds, and remaining challenges include nursing acceptance, compatibility with legacy monitoring systems, and device sterilization for reuse.
- The paper notes that additional testing is needed for altered skin barrier function, such as burn victims or patients with epidermolysis bullosa.
- Evident from the text: the neonatal validation cohorts are small (n = 3 with synchronous standard-of-care comparisons; n = 18 using related platforms with onboard power supplies), adult validation is n = 3, and temperature and PAT data in neonates are shown without reference comparators because conventional devices acquire these only periodically.
Model-written summary. Check it against the paper before relying on it.
Integrity signals
Registry
Cites
Statistics
Figures




Verification
Claims the paper makes
6 Valid · 2 Not valid · 18 Not checked · 82 Own results and interpretations
The cited sources support only part of this claim — read each source’s verdict below.
In the paper
“A key example is the measurement of pulse arrival time (PAT), defined by the time lapse between the maximum fiducial point in the ECG signal (R peak) and the corresponding minimal fiducial point in the PPG signal at valley as in Fig. 6H, as a direct correlate to systolic blood pressure (29 , 30).”
§ Binodal, wireless epidermal electronic systems with in-sensor analytics for neonatal intensive care > Real-time measurements, in-sensor analytics, and data transmission
What the sources say
- Partly supportedcites [29] Kim J. S., Chee Y. J., Park J. W., Choi J. W., Park K. S., A new approach for non-intrusive monitoring of blood pressure on a toilet seat. Physiol. Meas. 27, 203– 211 (2006). doi: 10.1088/0967-3334/27/2/010; pmid: 16400206 sourceExperimental — accuracy not yet measured
Section 4.1 reports that PAT was significantly, but moderately, correlated with systolic blood pressure. Section 2.2 defines the study’s PAT using the ECG R-peak and the PPG’s maximum first-derivative point, not the PPG valley; it says the minimum point was unclear in its signal. The claimed correlation is supported, but the attributed measurement definition is not. (LLM, conf=0.87)
- Not checked — no full text of the sourcecites [30] Geddes L. A., Voelz M. H., Babbs C. F., Bourland J. D., Tacker W. A., Pulse transit time as an indicator of arterial blood pressure. Psychophysiology 18, 71– 74 (1981). doi: 10.1111/j.1469-8986.1981.tb01545.x; pmid: 7465731 source
plainstates an association- Asserted: passes — The authors put it forward as true.
- Checkable: passes — It can be checked against evidence.
- Load-bearing: passes — The paper’s conclusions depend on it.
- Based: passes — The paper gives a reason why it holds.
- Partly supported
A result the paper reports from its own data — it cites no other source for it, so there is none to check. The quote shows it is in the paper.
In the paper
“The inherently thin, soft mechanical properties of the sensors (Fig. 1A) reported here allow for adhesion via van derWaals forces alone.”
§ Binodal, wireless epidermal electronic systems with in-sensor analytics for neonatal intensive care > Low-modulus mechanics, soft interface adhesion, and implications for neonatal skin safety
plainstates a cause- Asserted: passes — The authors put it forward as true.
- Checkable: passes — It can be checked against evidence.
- Load-bearing: passes — The paper’s conclusions depend on it.
- Based: passes — The paper gives a reason why it holds.
A result the paper reports from its own data — it cites no other source for it, so there is none to check. The quote shows it is in the paper.
In the paper
“The mechanical decoupling afforded by the microfluidic channel decreases these stresses by up to a factor of 2.5 (Fig. 2B) relative to otherwise similar designs without the microfluidics.”
§ Binodal, wireless epidermal electronic systems with in-sensor analytics for neonatal intensive care > Low-modulus mechanics, soft interface adhesion, and implications for neonatal skin safety
plainstates a cause- Asserted: passes — The authors put it forward as true.
- Checkable: passes — It can be checked against evidence.
- Load-bearing: passes — The paper’s conclusions depend on it.
- Based: passes — The paper gives a reason why it holds.
A result the paper reports from its own data — it cites no other source for it, so there is none to check. The quote shows it is in the paper.
In the paper
“Oscillations in the force only appear for holes larger than the characteristic size of the cohesive zone (~500 mm, as in Fig. 2I).”
§ Binodal, wireless epidermal electronic systems with in-sensor analytics for neonatal intensive care > Low-modulus mechanics, soft interface adhesion, and implications for neonatal skin safety
plainstates a cause- Asserted: passes — The authors put it forward as true.
- Checkable: passes — It can be checked against evidence.
- Load-bearing: unclear — It is unclear whether the paper’s conclusions depend on it.
- Based: passes — The paper gives a reason why it holds.
A result the paper reports from its own data — it cites no other source for it, so there is none to check. The quote shows it is in the paper.
In the paper
“Specifically, the interface starts to delaminate when the normal stress reaches ~20 kPa (Fig. 2G, inset).”
§ Binodal, wireless epidermal electronic systems with in-sensor analytics for neonatal intensive care > Low-modulus mechanics, soft interface adhesion, and implications for neonatal skin safety
plainstates a cause- Asserted: passes — The authors put it forward as true.
- Checkable: passes — It can be checked against evidence.
- Load-bearing: passes — The paper’s conclusions depend on it.
- Based: passes — The paper gives a reason why it holds.
61 more claims
Create a free account to see all 108 claims and to verify the 1 reference still open.
- Probably not a substantial claim. 14
- It may state two separate claims as one. 33
- The quote only partly states this claim. 2
Claims other papers make about this one
Each is checked against this paper’s own text: does it say what the citing paper says it does?
The source backs part of the claim, not all of it — or backs it for a different population, condition or comparison.
In the citing paper
“Researchers have developed various versatile epidermal electrodes with high performance that can universally measure EEG, EMG, EOG, and ECG through placing electrodes on different areas of the skin.[25,414]”
From Flexible Electronics and Devices as Human–Machine Interfaces for Medical Robotics (2022) · cites this paper as [414]
Experimental — accuracy not yet measuredThe source backs part of the claim, not all of it — or backs it for a different population, condition or comparison.
In the citing paper
“Previous reports validated the performance of an FDA-cleared physiological monitoring system against gold standard monitoring platforms [18–23].”
From Pregnancy outcomes in infertility patients diagnosed with sleep disordered breathing with wireless wearable sensors (2022) · cites this paper as [18]
Experimental — accuracy not yet measuredThe source backs part of the claim, not all of it — or backs it for a different population, condition or comparison.
In the citing paper
“In previous work, we demonstrate the ability for the chest- and finger-mounted sensors to monitor vital signs in both children and adults; the abdominal sensor allows for maternal–fetal monitoring of pregnant women in both high- and low-resource settings as well as the clinical and home settings (22, 23).”
From Comprehensive pregnancy monitoring with a network of wireless, soft, and flexible sensors in high- and low-resource health settings (2021) · cites this paper as [23]
Experimental — accuracy not yet measuredThe source backs part of the claim, not all of it — or backs it for a different population, condition or comparison.
In the citing paper
“and have been used in neonatal and pediatric intensive care units. 4,5”
From Advanced wireless monitoring for children in the cardiac perioperative setting (2023) · cites this paper as [4]
Experimental — accuracy not yet measuredThe source backs part of the claim, not all of it — or backs it for a different population, condition or comparison.
In the citing paper
“However, this system is limited by (1) the modest maximum operating distances (~30 cm) supported by near-field communication (NFC) protocols used for power transfer and data communication, (2) the mechanically fragile nature of the ultrathin, compliant mechanics designs, (3) the sufficient, but constrained range of measurement capabilities, and (4) the demand for highly advanced device configur”
From Skin-interfaced biosensors for advanced wireless physiological monitoring in neonatal and pediatric intensive-care units (2020) · cites this paper as [9]
Experimental — accuracy not yet measured
5 more claims about this paper
Create a free account to see every claim other papers make about this one.
Self-check
Percentages, sums and reported differences re-computed from the paper’s own numbers.
Each contradiction between two passages listed here was confirmed by an independent check.
Rated minor: it would not touch a result — a value no result rests on, a p-value that stays on the same side of the significance level, or a conflict that is clerical, resolved elsewhere in the paper, or outside its own findings.
In the paper
§ Binodal, wireless epidermal electronic systems with in-sensor analytics for neonatal intensive care > Compatibility with medical imaging techniques used in the NICU
“eliminating any parasitic heating from magnetically induced eddy currents.”
§ Binodal, wireless epidermal electronic systems with in-sensor analytics for neonatal intensive care > Compatibility with medical imaging techniques used in the NICU
“Full three-dimensional multi-physicsmodeling shows that, at the end of a single scan for 0.5 ms, the copper layer of an ECG EES undergoes heating by only 1°C (Fig. 3H).”
Citations
Cites
A Real-Time QRS Detection Algorithm
Pan, J., & Tompkins, W. J. (1985) · IEEE Transactions on Biomedical Engineering · doi:10.1109/tbme.1985.325532 · Cited by 7,855
Fully integrated wearable sensor arrays for multiplexed in situ perspiration analysis
Gao, W., Emaminejad, S., Nyein, H. Y. Y., Challa, S., Chen, K., Peck, A., Fahad, H. M., Ota, H., Shiraki, H., Kiriya, D., et al. (2016) · Nature · doi:10.1038/nature16521 · Cited by 5,087
Kim, D.-H., Lu, N., Ma, R., Kim, Y.-S., Kim, R.-H., Wang, S., Wu, J., Won, S. M., Tao, H., Islam, A., et al. (2011) · Science · doi:10.1126/science.1206157 · Cited by 4,836
Self-citationWearable Sensors for Remote Health Monitoring
Majumder, S., Mondal, T., & Deen, M. (2017) · Sensors · doi:10.3390/s17010130 · Cited by 1,375
Kiserud, T., Piaggio, G., Carroli, G., Widmer, M., Carvalho, J., Neerup Jensen, L., Giordano, D., Cecatti, J. G., Abdel Aleem, H., Talegawkar, S. A., et al. (2017) · PLOS Medicine · doi:10.1371/journal.pmed.1002220 · Cited by 729
Thermochemistry of ionic liquid heat-transfer fluids
Valkenburg, M. E. V., Vaughn, R. L., Williams, M., & Wilkes, J. S. (2005) · Thermochimica Acta · doi:10.1016/j.tca.2004.11.013 · Cited by 595
Halcox, J. P. J., Wareham, K., Cardew, A., Gilmore, M., Barry, J. P., Phillips, C., & Gravenor, M. B. (2017) · Circulation · doi:10.1161/circulationaha.117.030583 · Cited by 580
Self-assembled three dimensional network designs for soft electronics
Jang, K.-I., Li, K., Chung, H. U., Xu, S., Jung, H. N., Yang, Y., Kwak, J. W., Jung, H. H., Song, J., Yang, C., et al. (2017) · Nature Communications · doi:10.1038/ncomms15894 · Cited by 445
Self-citationChen, W., Kobayashi, T., Ichikawa, S., Takeuchi, Y., & Togawa, T. (2000) · Medical & Biological Engineering & Computing · doi:10.1007/bf02345755 · Cited by 425
Harris, K. D., Elias, A. L., & Chung, H.-J. (2016) · Journal of Materials Science · doi:10.1007/s10853-015-9643-3 · Cited by 403
Self-citation
Research works printed but not linked: 2
- O. Sharma, S. N. Lewis, U. Telang, L. D’Almeida, L. E. S. Lewis, Design of a Bluetooth Enabled Health Monitoring System for Infants Using Wearable Technology. J. Adv. Res. Dyn. Contrl. Syst. 15, 887–894 (2017). http://jardcs.org/papers/v9/sp/20181075.pdf
- C. H. Lund J. A. Tucker in Neonatal Skin: Structure and Function S. B. Hoath H. I. Maibach Eds. (Dekker ed. 2 2003) pp. 299–324.
Cited by
Technology Roadmap for Flexible Sensors
Luo, Y., Abidian, M. R., Ahn, J.-H., Akinwande, D., Andrews, A. M., Antonietti, M., Bao, Z., Berggren, M., Berkey, C. A., Bettinger, C. J., et al. (2023) · ACS Nano · doi:10.1021/acsnano.2c12606 · Cited by 1,383
Self-citationSkin-integrated wireless haptic interfaces for virtual and augmented reality
Yu, X., Xie, Z., Yu, Y., Lee, J., Vazquez-Guardado, A., Luan, H., Ruban, J., Ning, X., Akhtar, A., Li, D., et al. (2019) · Nature · doi:10.1038/s41586-019-1687-0 · Cited by 1,025
Self-citationA New Frontier of Printed Electronics: Flexible Hybrid Electronics
Khan, Y., Thielens, A., Muin, S., Ting, J., Baumbauer, C., & Arias, A. C. (2020) · Advanced Materials · doi:10.1002/adma.201905279 · Cited by 891
Sign-to-speech translation using machine-learning-assisted stretchable sensor arrays
Zhou, Z., Chen, K., Li, X., Zhang, S., Wu, Y., Zhou, Y., Meng, K., Sun, C., He, Q., Fan, W., et al. (2020) · Nature Electronics · doi:10.1038/s41928-020-0428-6 · Cited by 841
Skin-Interfaced Wearable Sweat Sensors for Precision Medicine
Min, J., Tu, J., Xu, C., Lukas, H., Shin, S., Yang, Y., Solomon, S. A., Mukasa, D., & Gao, W. (2023) · Chemical Reviews · doi:10.1021/acs.chemrev.2c00823 · Cited by 712
Hydrogel interfaces for merging humans and machines
Yuk, H., Wu, J., & Zhao, X. (2022) · Nature Reviews Materials · doi:10.1038/s41578-022-00483-4 · Cited by 661
Shi, Q., Dong, B., He, T., Sun, Z., Zhu, J., Zhang, Z., & Lee, C. (2020) · InfoMat · doi:10.1002/inf2.12122 · Cited by 661
“Wearable electronics/photonics are rapidly emerging in diversified research areas for their promising future in broad applications, for example, robotics, 62-64 medical devices, 65,66 environmental monitoring, 67 human-machine interfaces (HMIs), 51,68 healthcare, 69 and so on.”
BackgroundSelf-citationAn epidermal patch for the simultaneous monitoring of haemodynamic and metabolic biomarkers
Sempionatto, J. R., Lin, M., Yin, L., De la paz, E., Pei, K., Sonsa-ard, T., de Loyola Silva, A. N., Khorshed, A. A., Zhang, F., Tostado, N., et al. (2021) · Nature Biomedical Engineering · doi:10.1038/s41551-021-00685-1 · Cited by 658
Self-citationPyo, S., Lee, J., Bae, K., Sim, S., & Kim, J. (2021) · Advanced Materials · doi:10.1002/adma.202005902 · Cited by 631
Self-citationArtificial multimodal receptors based on ion relaxation dynamics
You, I., Mackanic, D. G., Matsuhisa, N., Kang, J., Kwon, J., Beker, L., Mun, J., Suh, W., Kim, T. Y., Tok, J. B.-H., et al. (2020) · Science · doi:10.1126/science.aba5132 · Cited by 632
Flexible Hybrid Electronics for Digital Healthcare
Ma, Y., Zhang, Y., Cai, S., Han, Z., Liu, X., Wang, F., Cao, Y., Wang, Z., Li, H., Chen, Y., et al. (2020) · Advanced Materials · doi:10.1002/adma.201902062 · Cited by 620
Self-citationFlexible Electronics and Devices as Human–Machine Interfaces for Medical Robotics
Heng, W., Solomon, S., & Gao, W. (2022) · Advanced Materials · doi:10.1002/adma.202107902 · Cited by 609
Wen, F., Zhang, Z., He, T., & Lee, C. (2021) · Nature Communications · doi:10.1038/s41467-021-25637-w · Cited by 494
Self-citationStretchable distributed fiber-optic sensors
Bai, H., Li, S., Barreiros, J., Tu, Y., Pollock, C. R., & Shepherd, R. F. (2020) · Science · doi:10.1126/science.aba5504 · Cited by 490
Disruptive, Soft, Wearable Sensors
Ling, Y., An, T., Yap, L. W., Zhu, B., Gong, S., & Cheng, W. (2020) · Advanced Materials · doi:10.1002/adma.201904664 · Cited by 480
Chung, H. U., Rwei, A. Y., Hourlier-Fargette, A., Xu, S., Lee, K., Dunne, E. C., Xie, Z., Liu, C., Carlini, A., Kim, D. H., et al. (2020) · Nature Medicine · doi:10.1038/s41591-020-0792-9 · Cited by 482
Self-citationWang, M., Luo, Y., Wang, T., Wan, C., Pan, L., Pan, S., He, K., Neo, A., & Chen, X. (2021) · Advanced Materials · doi:10.1002/adma.202003014 · Cited by 451
Piezoelectric nanogenerators for personalized healthcare
Deng, W., Zhou, Y., Libanori, A., Chen, G., Yang, W., & Chen, J. (2022) · Chemical Society Reviews · doi:10.1039/d1cs00858g · Cited by 434
High-speed and large-scale intrinsically stretchable integrated circuits
Zhong, D., Wu, C., Jiang, Y., Yuan, Y., Kim, M.-G., Nishio, Y., Shih, C.-C., Wang, W., Lai, J.-C., Ji, X., et al. (2024) · Nature · doi:10.1038/s41586-024-07096-7 · Cited by 429
A three-dimensional liquid diode for soft, integrated permeable electronics
Zhang, B., Li, J., Zhou, J., Chow, L., Zhao, G., Huang, Y., Ma, Z., Zhang, Q., Yang, Y., Yiu, C. K., et al. (2024) · Nature · doi:10.1038/s41586-024-07161-1 · Cited by 417
Self-citationA three-dimensionally architected electronic skin mimicking human mechanosensation
Liu, Z., Hu, X., Bo, R., Yang, Y., Cheng, X., Pang, W., Liu, Q., Wang, Y., Wang, S., Xu, S., et al. (2024) · Science · doi:10.1126/science.adk5556 · Cited by 411
Self-citationSkin-inspired soft bioelectronic materials, devices and systems
Zhao, C., Park, J., Root, S. E., & Bao, Z. (2024) · Nature Reviews Bioengineering · doi:10.1038/s44222-024-00194-1 · Cited by 408
Self-citationHybrid multimodal wearable sensors for comprehensive health monitoring
Mahato, K., Saha, T., Ding, S., Sandhu, S. S., Chang, A.-Y., & Wang, J. (2024) · Nature Electronics · doi:10.1038/s41928-024-01247-4 · Cited by 404
Wu, H., Yang, G., Zhu, K., Liu, S., Guo, W., Jiang, Z., & Li, Z. (2021) · Advanced Science · doi:10.1002/advs.202001938 · Cited by 395
Reviews of wearable healthcare systems: Materials, devices and system integration
Lou, Z., Wang, L., Jiang, K., Wei, Z., & Shen, G. (2020) · Materials Science and Engineering: R: Reports · doi:10.1016/j.mser.2019.100523 · Cited by 385
Progress in TENG technology—A journey from energy harvesting to nanoenergy and nanosystem
Zhu, J., Zhu, M., Shi, Q., Wen, F., Liu, L., Dong, B., Haroun, A., Yang, Y., Vachon, P., Guo, X., et al. (2020) · EcoMat · doi:10.1002/eom2.12058 · Cited by 370
“Beyond the energy harvesting and the self-powered sensing by individual TENG, NENS in the concept of integrated systems are rapidly emerging in various research areas for their promising future in diversified applications, that is, blue energy, wearable electronics/HMI, neural interface/implanted device, and optical i…”
BackgroundSelf-citationRen, W., Sun, Y., Zhao, D., Aili, A., Zhang, S., Shi, C., Zhang, J., Geng, H., Zhang, J., Zhang, L., et al. (2021) · Science Advances · doi:10.1126/sciadv.abe0586 · Cited by 367
Yin, L., Cao, M., Kim, K. N., Lin, M., Moon, J.-M., Sempionatto, J. R., Yu, J., Liu, R., Wicker, C., Trifonov, A., et al. (2022) · Nature Electronics · doi:10.1038/s41928-022-00843-6 · Cited by 358
Self-citationStrain-insensitive intrinsically stretchable transistors and circuits
Wang, W., Wang, S., Rastak, R., Ochiai, Y., Niu, S., Jiang, Y., Arunachala, P. K., Zheng, Y., Xu, J., Matsuhisa, N., et al. (2021) · Nature Electronics · doi:10.1038/s41928-020-00525-1 · Cited by 360
Wireless and battery-free technologies for neuroengineering
Won, S. M., Cai, L., Gutruf, P., & Rogers, J. A. (2021) · Nature Biomedical Engineering · doi:10.1038/s41551-021-00683-3 · Cited by 360
Self-citationWireless battery-free body sensor networks using near-field-enabled clothing
Lin, R., Kim, H.-J., Achavananthadith, S., Kurt, S. A., Tan, S. C. C., Yao, H., Tee, B. C. K., Lee, J. K. W., & Ho, J. S. (2020) · Nature Communications · doi:10.1038/s41467-020-14311-2 · Cited by 331
Self-citationHan, M., Chen, L., Aras, K., Liang, C., Chen, X., Zhao, H., Li, K., Faye, N. R., Sun, B., Kim, J.-H., et al. (2020) · Nature Biomedical Engineering · doi:10.1038/s41551-020-00604-w · Cited by 324
Self-citationSkin bioelectronics towards long-term, continuous health monitoring
Wang, Y., Haick, H., Guo, S., Wang, C., Lee, S., Yokota, T., & Someya, T. (2022) · Chemical Society Reviews · doi:10.1039/d2cs00207h · Cited by 318
Self-citationWearable Sensing and Telehealth Technology with Potential Applications in the Coronavirus Pandemic
Ding, X., Clifton, D., Ji, N., Lovell, N. H., Bonato, P., Chen, W., Yu, X., Xue, Z., Xiang, T., Long, X., et al. (2021) · IEEE Reviews in Biomedical Engineering · doi:10.1109/rbme.2020.2992838 · Cited by 281
“Flexible ECG technologies: (a) an e-tattoo ECG [86], (b) a multiparametric epidermal sensor [87], (c) a graphene e-tattoo ECG [88], and (d) an epidermal sensing system with in-sensor analytics [89].”
MethodSelf-citationChip-less wireless electronic skins by remote epitaxial freestanding compound semiconductors
Kim, Y., Suh, J. M., Shin, J., Liu, Y., Yeon, H., Qiao, K., Kum, H. S., Kim, C., Lee, H. E., Choi, C., et al. (2022) · Science · doi:10.1126/science.abn7325 · Cited by 285
Self-citationContinuous monitoring of deep-tissue haemodynamics with stretchable ultrasonic phased arrays
Wang, C., Qi, B., Lin, M., Zhang, Z., Makihata, M., Liu, B., Zhou, S., Huang, Y.-H., Hu, H., Gu, Y., et al. (2021) · Nature Biomedical Engineering · doi:10.1038/s41551-021-00763-4 · Cited by 274
Self-citationMultifaceted Design and Emerging Applications of Tissue Adhesives
Ma, Z., Bao, G., & Li, J. (2021) · Advanced Materials · doi:10.1002/adma.202007663 · Cited by 269
A transient, closed-loop network of wireless, body-integrated devices for autonomous electrotherapy
Choi, Y. S., Jeong, H., Yin, R. T., Avila, R., Pfenniger, A., Yoo, J., Lee, J. Y., Tzavelis, A., Lee, Y. J., Chen, S. W., et al. (2022) · Science · doi:10.1126/science.abm1703 · Cited by 267
Self-citationFlexible and Stretchable Antennas for Biointegrated Electronics
Xie, Z., Avila, R., Huang, Y., & Rogers, J. A. (2020) · Advanced Materials · doi:10.1002/adma.201902767 · Cited by 262
Self-citationSelf‐Healing Hydrogel Bioelectronics
Li, Z., Lu, J., Ji, T., Xue, Y., Zhao, L., Zhao, K., Jia, B., Wang, B., Wang, J., Zhang, S., et al. (2024) · Advanced Materials · doi:10.1002/adma.202306350 · Cited by 257
Li, W., Ke, K., Jia, J., Pu, J., Zhao, X., Bao, R., Liu, Z., Bai, L., Zhang, K., Yang, M., et al. (2022) · Small · doi:10.1002/smll.202103734 · Cited by 251
Self-citationLi, S., Wang, H., Ma, W., Qiu, L., Xia, K., Zhang, Y., Lu, H., Zhu, M., Liang, X., Wu, X.-E., et al. (2023) · Science Advances · doi:10.1126/sciadv.adh0615 · Cited by 252
Self-citationJiang, Y., Dong, K., Li, X., An, J., Wu, D., Peng, X., Yi, J., Ning, C., Cheng, R., Yu, P., et al. (2021) · Advanced Functional Materials · doi:10.1002/adfm.202005584 · Cited by 246
Three-dimensional electronic microfliers inspired by wind-dispersed seeds
Kim, B. H., Li, K., Kim, J.-T., Park, Y., Jang, H., Wang, X., Xie, Z., Won, S. M., Yoon, H.-J., Lee, G., et al. (2021) · Nature · doi:10.1038/s41586-021-03847-y · Cited by 242
Self-citationWater‐Resistant Conformal Hybrid Electrodes for Aquatic Endurable Electrocardiographic Monitoring
Ji, S., Wan, C., Wang, T., Li, Q., Chen, G., Wang, J., Liu, Z., Yang, H., Liu, X., & Chen, X. (2020) · Advanced Materials · doi:10.1002/adma.202001496 · Cited by 235
Self-citationWearable and Implantable Electronics: Moving toward Precision Therapy
Song, Y., Min, J., & Gao, W. (2019) · ACS Nano · doi:10.1021/acsnano.9b08323 · Cited by 232
Flexible 3D Architectured Piezo/Thermoelectric Bimodal Tactile Sensor Array for E‐Skin Application
Zhu, P., Wang, Y., Wang, Y., Mao, H., Zhang, Q., & Deng, Y. (2020) · Advanced Energy Materials · doi:10.1002/aenm.202001945 · Cited by 229
Self-citationSelf-Powered Wearable Biosensors
Song, Y., Mukasa, D., Zhang, H., & Gao, W. (2021) · Accounts of Materials Research · doi:10.1021/accountsmr.1c00002 · Cited by 237
Wearable Chemical Sensors: Emerging Systems for On-Body Analytical Chemistry
Sempionatto, J. R., Jeerapan, I., Krishnan, S., & Wang, J. (2020) · Analytical Chemistry · doi:10.1021/acs.analchem.9b04668 · Cited by 229
Xu, Y., Sun, B., Ling, Y., Fei, Q., Chen, Z., Li, X., Guo, P., Jeon, N., Goswami, S., Liao, Y., et al. (2020) · Proceedings of the National Academy of Sciences · doi:10.1073/pnas.1917762116 · Cited by 230
“S11, adhesion peel test indicates porous SEBS exhibits a significantly higher skin adhesion force than that of its nonporous counterpart with the same thickness, which is comparable to the data measured from ultrathin epidermal electronic systems (49).”
ResultSelf-citationPacifier Biosensor: Toward Noninvasive Saliva Biomarker Monitoring
García-Carmona, L., Martín, A., Sempionatto, J. R., Moreto, J. R., González, M. C., Wang, J., & Escarpa, A. (2019) · Analytical Chemistry · doi:10.1021/acs.analchem.9b03379 · Cited by 230
Li, H., Ma, Y., & Huang, Y. (2021) · Materials Horizons · doi:10.1039/d0mh00483a · Cited by 221
Self-citationZhuang, Q., Yao, K., Zhang, C., Song, X., Zhou, J., Zhang, Y., Huang, Q., Zhou, Y., Yu, X., & Zheng, Z. (2024) · Nature Electronics · doi:10.1038/s41928-024-01189-x · Cited by 220
Self-citationWearable triboelectric sensors for biomedical monitoring and human-machine interface
Pu, X., An, S., Tang, Q., Guo, H., & Hu, C. (2021) · iScience · doi:10.1016/j.isci.2020.102027 · Cited by 218
Bioadhesive Technology Platforms
Wu, S. J., & Zhao, X. (2023) · Chemical Reviews · doi:10.1021/acs.chemrev.3c00380 · Cited by 218
Skin sensors are the future of health care
Xu, S., Jayaraman, A., & Rogers, J. A. (2019) · Nature · doi:10.1038/d41586-019-02143-0 · Cited by 214
Self-citationSong, H., Luo, G., Ji, Z., Bo, R., Xue, Z., Yan, D., Zhang, F., Bai, K., Liu, J., Cheng, X., et al. (2022) · Science Advances · doi:10.1126/sciadv.abm3785 · Cited by 211
Self-citationA Wearable Body Condition Sensor System with Wireless Feedback Alarm Functions
Xu, K., Fujita, Y., Lu, Y., Honda, S., Shiomi, M., Arie, T., Akita, S., & Takei, K. (2021) · Advanced Materials · doi:10.1002/adma.202008701 · Cited by 207
Controllable Graphene Wrinkle for a High-Performance Flexible Pressure Sensor
Tang, X., Yang, W., Yin, S., Tai, G., Su, M., Yang, J., Shi, H., Wei, D., & Yang, J. (2021) · ACS Applied Materials & Interfaces · doi:10.1021/acsami.0c22784 · Cited by 202
Oh, Y. S., Kim, J.-H., Xie, Z., Cho, S., Han, H., Jeon, S. W., Park, M., Namkoong, M., Avila, R., Song, Z., et al. (2021) · Nature Communications · doi:10.1038/s41467-021-25324-w · Cited by 204
Self-citationGraphene-based stretchable/wearable self-powered touch sensor
Lee, Y., Kim, J., Jang, B., Kim, S., Sharma, B. K., Kim, J.-H., & Ahn, J.-H. (2019) · Nano Energy · doi:10.1016/j.nanoen.2019.05.039 · Cited by 189
Self-citationLong-term reliable physical health monitoring by sweat pore–inspired perforated electronic skins
Yeon, H., Lee, H., Kim, Y., Lee, D., Lee, Y., Lee, J.-S., Shin, J., Choi, C., Kang, J.-H., Suh, J. M., et al. (2021) · Science Advances · doi:10.1126/sciadv.abg8459 · Cited by 190
Self-citationYang, H., Ji, S., Chaturvedi, I., Xia, H., Wang, T., Chen, G., Pan, L., Wan, C., Qi, D., Ong, Y.-S., et al. (2020) · ACS Materials Letters · doi:10.1021/acsmaterialslett.0c00085 · Cited by 189
Wang, M., Ma, C., Uzabakiriho, P. C., Chen, X., Chen, Z., Cheng, Y., Wang, Z., & Zhao, G. (2021) · ACS Nano · doi:10.1021/acsnano.1c05762 · Cited by 186
Recent progress in self‐powered multifunctional e‐skin for advanced applications
Chen, Y., Gao, Z., Zhang, F., Wen, Z., & Sun, X. (2022) · Exploration · doi:10.1002/exp.20210112 · Cited by 186
A wireless and battery-free wound infection sensor based on DNA hydrogel
Xiong, Z., Achavananthadith, S., Lian, S., Madden, L. E., Ong, Z. X., Chua, W., Kalidasan, V., Li, Z., Liu, Z., Singh, P., et al. (2021) · Science Advances · doi:10.1126/sciadv.abj1617 · Cited by 186
Self-citationGraphene-enabled wearable sensors for healthcare monitoring
Zhang, H., He, R., Niu, Y., Han, F., Li, J., Zhang, X., & Xu, F. (2022) · Biosensors and Bioelectronics · doi:10.1016/j.bios.2021.113777 · Cited by 184
Pencil–paper on-skin electronics
Xu, Y., Zhao, G., Zhu, L., Fei, Q., Zhang, Z., Chen, Z., An, F., Chen, Y., Ling, Y., Guo, P., et al. (2020) · Proceedings of the National Academy of Sciences · doi:10.1073/pnas.2008422117 · Cited by 182
“Such excellent electromechanical performances are sufficient for a broad range of on-skin bioelectronic applications considering relatively small natural deformations of human skins (bending: >∼140 mm for chest and >∼50 mm for foot; stretching: up to 50–80%) (10, 24).”
BackgroundSelf-citationLiu, G., Lv, Z., Batool, S., Li, M., Zhao, P., Guo, L., Wang, Y., Zhou, Y., & Han, S. (2023) · Small · doi:10.1002/smll.202207879 · Cited by 182
Han, Z., Li, H., Xiao, J., Song, H., Li, B., Cai, S., Chen, Y., Ma, Y., & Feng, X. (2019) · ACS Applied Materials & Interfaces · doi:10.1021/acsami.9b12929 · Cited by 177
Self-citationElectronic Skin for Health Monitoring Systems: Properties, Functions, and Applications
Yang, X., Chen, W., Fan, Q., Chen, J., Chen, Y., Lai, F., & Liu, H. (2024) · Advanced Materials · doi:10.1002/adma.202402542 · Cited by 175
Arami, H., Kananian, S., Khalifehzadeh, L., Patel, C. B., Chang, E., Tanabe, Y., Zeng, Y., Madsen, S. J., Mandella, M. J., Natarajan, A., et al. (2022) · Nature Nanotechnology · doi:10.1038/s41565-022-01189-y · Cited by 171
Li, Q., Chen, G., Cui, Y., Ji, S., Liu, Z., Wan, C., Liu, Y., Lu, Y., Wang, C., Zhang, N., et al. (2021) · ACS Nano · doi:10.1021/acsnano.1c01431 · Cited by 167
Self-citationNanoscale physical unclonable function labels based on block copolymer self-assembly
Kim, J. H., Jeon, S., In, J. H., Nam, S., Jin, H. M., Han, K. H., Yang, G. G., Choi, H. J., Kim, K. M., Shin, J., et al. (2022) · Nature Electronics · doi:10.1038/s41928-022-00788-w · Cited by 167
“For the given data with length of N, U = [u(1) u(2).”
BackgroundSelf-citationAdvances in flexible sensors for intelligent perception system enhanced by artificial intelligence
Niu, H., Yin, F., Kim, E., Wang, W., Yoon, D., Wang, C., Liang, J., Li, Y., & Kim, N. (2023) · InfoMat · doi:10.1002/inf2.12412 · Cited by 165
Mechanically-Guided 3D Assembly for Architected Flexible Electronics
Bo, R., Xu, S., Yang, Y., & Zhang, Y. (2023) · Chemical Reviews · doi:10.1021/acs.chemrev.3c00335 · Cited by 164
Self-citationCohabiting Plant‐Wearable Sensor In Situ Monitors Water Transport in Plant
Chai, Y., Chen, C., Luo, X., Zhan, S., Kim, J., Luo, J., Wang, X., Hu, Z., Ying, Y., & Liu, X. (2021) · Advanced Science · doi:10.1002/advs.202003642 · Cited by 163
Self-citationFusing Stretchable Sensing Technology with Machine Learning for Human–Machine Interfaces
Wang, M., Wang, T., Luo, Y., He, K., Pan, L., Li, Z., Cui, Z., Liu, Z., Tu, J., & Chen, X. (2021) · Advanced Functional Materials · doi:10.1002/adfm.202008807 · Cited by 164
Self-citationSoft Wearable Healthcare Materials and Devices
Lyu, Q., Gong, S., Yin, J., Dyson, J. M., & Cheng, W. (2021) · Advanced Healthcare Materials · doi:10.1002/adhm.202100577 · Cited by 160
Surface Wettability for Skin‐Interfaced Sensors and Devices
Wang, X., Liu, Y., Cheng, H., & Ouyang, X. (2022) · Advanced Functional Materials · doi:10.1002/adfm.202200260 · Cited by 169
Ultra‐Thin Flexible Encapsulating Materials for Soft Bio‐Integrated Electronics
Sang, M., Kim, K., Shin, J., & Yu, K. J. (2022) · Advanced Science · doi:10.1002/advs.202202980 · Cited by 161
Zhang, M., Wang, X., Feng, H., Huang, Q., Xiao, X., & Zhang, X. (2021) · Journal of Cleaner Production · doi:10.1016/j.jclepro.2021.127712 · Cited by 159
Metasurfaces for bioelectronics and healthcare
Li, Z., Tian, X., Qiu, C.-W., & Ho, J. S. (2021) · Nature Electronics · doi:10.1038/s41928-021-00589-7 · Cited by 159
Ultra-stretchable and biodegradable elastomers for soft, transient electronics
Han, W. B., Ko, G.-J., Lee, K.-G., Kim, D., Lee, J. H., Yang, S. M., Kim, D.-J., Shin, J.-W., Jang, T.-M., Han, S., et al. (2023) · Nature Communications · doi:10.1038/s41467-023-38040-4 · Cited by 159
Self-citationSmart Insole for Robust Wearable Biomechanical Energy Harvesting in Harsh Environments
Zhou, Z., Weng, L., Tat, T., Libanori, A., Lin, Z., Ge, L., Yang, J., & Chen, J. (2020) · ACS Nano · doi:10.1021/acsnano.0c06949 · Cited by 160
Graphene-based wearable sensors
Qiao, Y., Li, X., Hirtz, T., Deng, G., Wei, Y., Li, M., Ji, S., Wu, Q., Jian, J., Wu, F., et al. (2019) · Nanoscale · doi:10.1039/c9nr05532k · Cited by 158
Recent Progress in Wireless Sensors for Wearable Electronics
Park, Y., Lee, S.-I., & Park, J. (2019) · Sensors · doi:10.3390/s19204353 · Cited by 169
“[132].”
BackgroundMethodInfluentialSelf-citationSub-thermionic, ultra-high-gain organic transistors and circuits
Luo, Z., Peng, B., Zeng, J., Yu, Z., Zhao, Y., Xie, J., Lan, R., Ma, Z., Pan, L., Cao, K., et al. (2021) · Nature Communications · doi:10.1038/s41467-021-22192-2 · Cited by 160
Self-citationA flexible, stretchable system for simultaneous acoustic energy transfer and communication
Jin, P., Fu, J. S., Wang, F., Zhang, Y., Wang, P., Liu, X., Jiao, Y., Li, H., Chen, Y., Ma, Y., et al. (2021) · Science Advances · doi:10.1126/sciadv.abg2507 · Cited by 166
Self-citationWearable sensors and devices for real-time cardiovascular disease monitoring
Lin, J., Fu, R., Zhong, X., Yu, P., Tan, G., Li, W., Zhang, H., Li, Y., Zhou, L., & Ning, C. (2021) · Cell Reports Physical Science · doi:10.1016/j.xcrp.2021.100541 · Cited by 124
Flexible Hybrid Sensor Systems with Feedback Functions
Xu, K., Lu, Y., & Takei, K. (2020) · Advanced Functional Materials · doi:10.1002/adfm.202007436 · Cited by 160
Ultra‐Adaptable and Wearable Photonic Skin Based on a Shape‐Memory, Responsive Cellulose Derivative
Yi, H., Lee, S., Ko, H., Lee, D., Bae, W., Kim, T., Hwang, D. S., & Jeong, H. E. (2019) · Advanced Functional Materials · doi:10.1002/adfm.201902720 · Cited by 164
Self-citationDeep Learning Assisted Body Area Triboelectric Hydrogel Sensor Network for Infant Care
Guo, R., Fang, Y., Wang, Z., Libanori, A., Xiao, X., Wan, D., Cui, X., Sang, S., Zhang, W., Zhang, H., et al. (2022) · Advanced Functional Materials · doi:10.1002/adfm.202204803 · Cited by 151
A microscale soft ionic power source modulates neuronal network activity
Zhang, Y., Riexinger, J., Yang, X., Mikhailova, E., Jin, Y., Zhou, L., & Bayley, H. (2023) · Nature · doi:10.1038/s41586-023-06295-y · Cited by 167
Self-citationPrinting Flexible and Hybrid Electronics for Human Skin and Eye‐Interfaced Health Monitoring Systems
Kim, K., Kim, B., & Lee, C. H. (2019) · Advanced Materials · doi:10.1002/adma.201902051 · Cited by 153
Self-citationHuman motion-driven self-powered stretchable sensing platform based on laser-induced graphene foams
Zhang, C., Chen, H., Ding, X., Lorestani, F., Huang, C., Zhang, B., Zheng, B., Wang, J., Cheng, H., & Xu, Y. F. (2022) · Applied Physics Reviews · doi:10.1063/5.0077667 · Cited by 152
Self-citationXu, Y., Su, Y., Xu, X., Arends, B., Zhao, G., Ackerman, D. N., Huang, H., Reid, S. P., Santarpia, J. L., Kim, C., et al. (2023) · Science Advances · doi:10.1126/sciadv.adf0575 · Cited by 162
Self-citationA wearable freestanding electrochemical sensing system
Zhao, Y., Wang, B., Hojaiji, H., Wang, Z., Lin, S., Yeung, C. J., Lin, H., Nguyen, P., Chiu, K., Salahi, K., et al. (2020) · Science Advances · doi:10.1126/sciadv.aaz0007 · Cited by 150
Recent Progress in Wearable Biosensors: From Healthcare Monitoring to Sports Analytics
Ye, S., Feng, S., Huang, L. J., & Bian, S. (2020) · Biosensors · doi:10.3390/bios10120205 · Cited by 161
“A majority of wearable biosensing devices rely on the external power supply [14,26,88,90,153], which causes numerous technical difficulties in the field tests.”
BackgroundLi, H., Ma, Y., Liang, Z., Wang, Z., Cao, Y. K., Xu, Y., Zhou, H., Lu, B., Chen, Y., Han, Z., et al. (2020) · National Science Review · doi:10.1093/nsr/nwaa022 · Cited by 144
“Skin-like devices(26-35), which can be firmly mounted on and deformed with the skin, offer an alternative solution for long-term vital signs in daily use(36-38).”
BackgroundSelf-citation
Metadata
- Authors
- Chung, H. U., Kim, B. H., Lee, J. Y., Lee, J., Xie, Z., Ibler, E. M., Lee, K., Banks, A., Jeong, J. Y., Kim, J., Ogle, C., Grande, D., Yu, Y., Jang, H., Assem, P., Ryu, D., Kwak, J. W., Namkoong, M., Park, J. B., Lee, Y., Kim, D. H., Ryu, A., Jeong, J., You, K., Ji, B., Liu, Z., Huo, Q., Feng, X., Deng, Y., Xu, Y., Jang, K.-I., Kim, J., Zhang, Y., Ghaffari, R., Rand, C. M., Schau, M., Hamvas, A., Weese-Mayer, D. E., Huang, Y., Lee, S. M., Lee, C. H., Shanbhag, N. R., Paller, A. S., Xu, S., & Rogers, J. A.
- Affiliations
- Northwestern University (US)
- University of Illinois Urbana-Champaign (US)
- Department of Materials Science and Engineering, Northwestern University, Evanston, IL 60208, USA.
- Agency for Science, Technology and Research (SG)
- Tsinghua University (CN)
- Daegu Gyeongbuk Institute of Science and Technology (KR)
- Lurie Children's Hospital (US)
- Center for Autonomic Medicine, Department of Pediatrics, Ann & Robert H. Lurie Children’s Hospital of Chicago, Chicago, IL 60611, USA.
- Kookmin University (KR)
- Purdue University West Lafayette (US)
- Corresponding author
- Chung, Ha Uk
- Kim, Bong Hoon
- Lee, Jong Yoon
- Lee, Jungyup
- Xie, Zhaoqian
- Paller, Amy S.
- Xu, Shuai
- Rogers, John A.
- ORCID
- Chung, Ha Uk
- Kim, Bong Hoon
- Lee, Jong Yoon
- Lee, Jungyup
- Xie, Zhaoqian
- Lee, KunHyuck
- Banks, Anthony
- Jeong, Ji Yoon
- Kim, Jongwon
- Grande, Dominic
- Yu, Yongjoon
- Jang, Hokyung
- Assem, Pourya
- Kwak, Jean Won
- Namkoong, Myeong
- Park, Jun Bin
- Lee, Yechan
- Kim, Do Hoon
- Ryu, Arin
- You, Kevin
- Ji, Bowen
- Liu, Zhuangjian
- Huo, Qingze
- Feng, Xue
- Deng, Yujun
- Xu, Yeshou
- Jang, Kyung-In
- Kim, Jeonghyun
- Zhang, Yihui
- Ghaffari, Roozbeh
- Rand, Casey M.
- Hamvas, Aaron
- Huang, Yonggang
- Lee, Seung Min
- Lee, Chi Hwan
- Shanbhag, Naresh R.
- Paller, Amy S.
- Xu, Shuai
- Rogers, John A.
- Venue
- Science
- Published
- 2019-03
- Volume
- 363
- Issue
- 6430
- ISSN
- 0036-8075 (ISSN-L)
- 1095-9203
- PMC
- PMC6510306
- OpenAlex
- W2916533817
- Semantic Scholar
- b0511afac0cc252946aa8f08a078b12e48030581
- Cited by
- 807
- References
- 43
- Citations by year
- 2026: 72 · 2025: 112 · 2024: 103 · 2023: 121 · 2022: 124 · 2021: 131 · 2020: 97 · 2019: 47
- FWCI
- 35.10
- Type
- journal article
- Language
- en
- Open access
- hybrid
- doi.org
- Licence
- cc-by
- Locations
- Science (publishedVersion, cc-by)
- PubMed Central (publishedVersion, cc-by)
- PubMed (publishedVersion)
- Funders
- Bill and Melinda Gates Foundation (OPP1182909)
- Topics
- Physical Sciences › Engineering › Biomedical Engineering › Advanced Sensor and Energy Harvesting Materials
- Physical Sciences › Engineering › Biomedical Engineering › Non-Invasive Vital Sign Monitoring
- Physical Sciences › Engineering › Biomedical Engineering › Wireless Body Area Networks
- Keywords
- epidermal electronics, neonatal intensive care, battery-free operation, neonatal monitoring
- MeSH terms
- Diagnostic Imaging, Electronics, Equipment Design, Humans, Infant, Newborn, Monitoring, Physiologic, Skin, Intensive Care, Neonatal, Vital Signs, Lab-On-A-Chip Devices, Wireless Technology
About these checks
Registry, retraction, Cites and statistics results are computed, not judged, with one exception: a printed reference that no index lists is read once by a model before it counts as a citation error. Claims are extracted by a model and kept only when their quote appears verbatim in the text; each cited source is then checked, with a model’s help, for whether it says what the claim relies on. Those verdicts can be wrong — read the claim’s quote and the cited source before relying on one.
The claim verdicts this report counts are experimental: their accuracy is not yet measured.
A language model drew the claims from the paper on 2026-10-10, under version 3 of the claim definition (model deepseek-v4.1-flash, prompt extract-v3).
A second model labelled each claim on 2026-10-10 (model jev-1.13-20260917, definition revision gold-guideline-v0.2).
Cited sources are checked with a language model’s help (gpt-6-sol).
Statistics and arithmetic are recomputed, not judged.
Confidence bands are shown only for fields calibrated on our annotated test set. None is calibrated yet, so no band is shown.
What counts as a claim ›How we measure confidence ›How we check this ›
Are you an author, or do you see a problem with this page? Request a review
Data sources
Bibliographic data: Semantic Scholar, OpenAlex, Crossref.
Contains information from the Semantic Scholar Academic Graph Datasets, made available under the ODC Attribution License (ODC-BY 1.0).
Semantic Scholar’s data is described in: Kinney, R., et al. (2023). The Semantic Scholar Open Data Platform. arXiv:2301.10140.
