

The DOI matches its Crossref record; 9 of the 9 references it cites were found in a registry or an index.
The Gut Microbiome Modulates Colon Tumorigenesis
Abstract
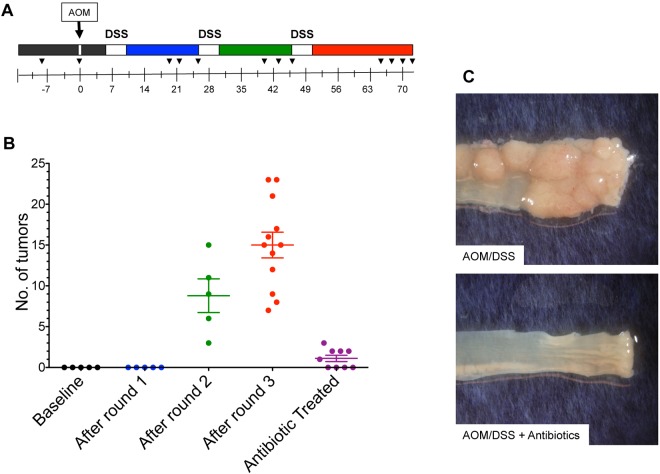
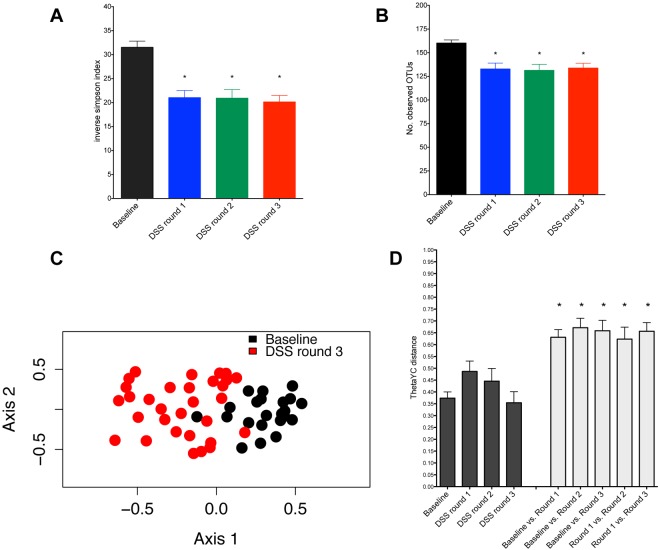
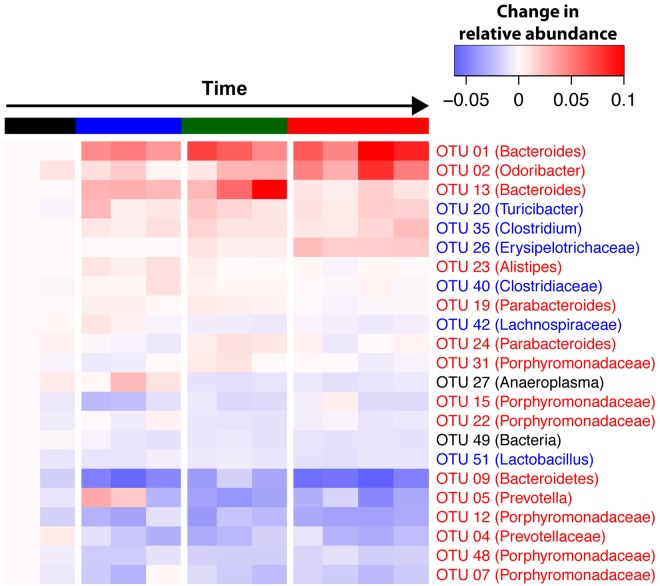
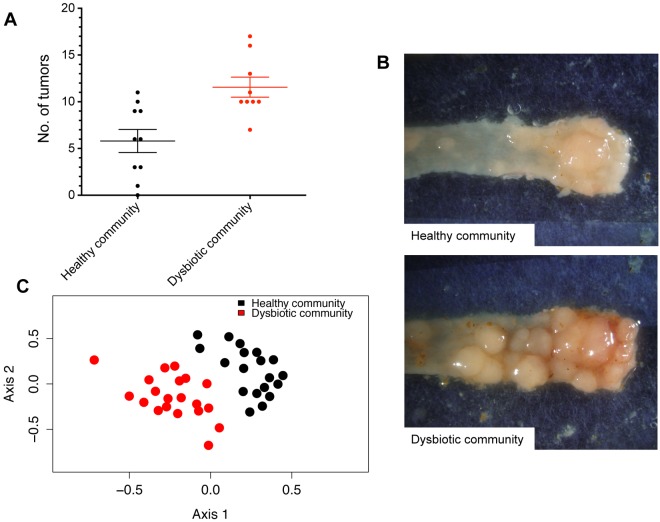
Recent studies have shown that individuals with colorectal cancer have an altered gut microbiome compared to healthy controls. It remains unclear whether these differences are a response to tumorigenesis or actively drive tumorigenesis. To determine the role of the gut microbiome in the development of colorectal cancer, we characterized the gut microbiome in a murine model of inflammation-associated colorectal cancer that mirrors what is seen in humans. We followed the development of an abnormal microbial community structure associated with inflammation and tumorigenesis in the colon. Tumor-bearing mice showed enrichment in operational taxonomic units (OTUs) affiliated with members of the Bacteroides , Odoribacter , and Akkermansia genera and decreases in OTUs affiliated with members of the Prevotellaceae and Porphyromonadaceae families. Conventionalization of germfree mice with microbiota from tumor-bearing mice significantly increased tumorigenesis in the colon compared to that for animals colonized with a healthy gut microbiome from untreated mice. Furthermore, at the end of the model, germfree mice colonized with microbiota from tumor-bearing mice harbored a higher relative abundance of populations associated with tumor formation in conventional animals. Manipulation of the gut microbiome with antibiotics resulted in a dramatic decrease in both the number and size of tumors. Our results demonstrate that changes in the gut microbiome associated with inflammation and tumorigenesis directly contribute to tumorigenesis and suggest that interventions affecting the composition of the microbiome may be a strategy to prevent the development of colon cancer. IMPORTANCE The trillions of bacteria that live in the gut, known collectively as the gut microbiome, are important for normal functioning of the intestine. There is now growing evidence that disruptive changes in the gut microbiome are strongly associated with the development colorectal cancer. However, how the gut microbiome changes with time during tumorigenesis and whether these changes directly contribute to disease have not been determined. We demonstrate using a mouse model of inflammation-driven colon cancer that there are dramatic, continual alterations in the microbiome during the development of tumors, which are directly responsible for tumor development. Our results suggest that interventions that target these changes in the microbiome may be an effective strategy for preventing the development of colorectal cancer.
Overview
The claims and statistics of this paper haven’t been checked yet.
Run the check — free, no account needed. It reads the open-access text and checks the sources it cites.
Integrity signals
Registry
Cites
Statistics
Figures
Verification
Claims the paper makes
The claims and statistics of this paper haven’t been checked yet.
Run the check — free, no account needed. It reads the open-access text and checks the sources it cites.
Claims other papers make about this one
Each is checked against this paper’s own text: does it say what the citing paper says it does?
In the citing paper
“Cap used alone increased the levels of Turicibacter, Rikenella, Enterorhabdus, and Odoribacter, which are associated with intestinal inflammation and dysbiosis45–49.”
From Combining gut microbiota modulation and chemotherapy by capecitabine-loaded prebiotic nanoparticle improves colorectal cancer therapy (2023) · cites this paper as [49]
Self-check
Percentages, sums and reported differences re-computed from the paper’s own numbers.
The self-check needs the paper’s full text.
Citations
Cites
Controlling the False Discovery Rate: A Practical and Powerful Approach to Multiple Testing
Benjamini, Y., & Hochberg, Y. (1995) · Journal of the Royal Statistical Society Series B: Statistical Methodology · doi:10.1111/j.2517-6161.1995.tb02031.x · Cited by 109,482
UniFrac: a New Phylogenetic Method for Comparing Microbial Communities
Lozupone, C., & Knight, R. (2005) · Applied and Environmental Microbiology · doi:10.1128/aem.71.12.8228-8235.2005 · Cited by 8,227
The Effect of Diet on the Human Gut Microbiome: A Metagenomic Analysis in Humanized Gnotobiotic Mice
Turnbaugh, P. J., Ridaura, V. K., Faith, J. J., Rey, F. E., Knight, R., & Gordon, J. I. (2009) · Science Translational Medicine · doi:10.1126/scitranslmed.3000322 · Cited by 3,058 · cited 1×
“All bacterial phyla and 90% (62 of 69) of genuslevel taxa detected in donor samples were detected within the recipient germfree mice (see Table S3 in the supplemental material), which is higher than has been previously reported (28, 29).”
ResultIntestinal inflammation targets cancer-inducing activity of the microbiota
Arthur, J. C., Perez-Chanona, E., Mühlbauer, M., Tomkovich, S., Uronis, J. M., Fan, T.-J., Campbell, B. J., Abujamel, T., Dogan, B., Rogers, A. B., et al. (2012) · Science · doi:10.1126/science.1224820 · Cited by 2,263
Reducing the Effects of PCR Amplification and Sequencing Artifacts on 16S rRNA-Based Studies
Schloss, P. D., Gevers, D., & Westcott, S. L. (2011) · PLoS ONE · doi:10.1371/journal.pone.0027310 · Cited by 2,112
Self-citationA cytokine-mediated link between innate immunity, inflammation, and cancer
Lin, W.-W., & Karin, M. (2007) · Journal of Clinical Investigation · doi:10.1172/jci31537 · Cited by 1,940
Structural segregation of gut microbiota between colorectal cancer patients and healthy volunteers
Wang, T., Cai, G., Qiu, Y., Fei, N., Zhang, M., Pang, X., Jia, W., Cai, S., & Zhao, L. (2012) · The ISME Journal · doi:10.1038/ismej.2011.109 · Cited by 1,287
Gut Microbiomes of Malawian Twin Pairs Discordant for Kwashiorkor
Smith, M. I., Yatsunenko, T., Manary, M. J., Trehan, I., Mkakosya, R., Cheng, J., Kau, A. L., Rich, S. S., Concannon, P., Mychaleckyj, J. C., et al. (2013) · Science · doi:10.1126/science.1229000 · Cited by 1,173
The innate immune receptor Nod1 protects the intestine from inflammation-induced tumorigenesis
Chen, G. Y., Shaw, M. H., Redondo, G., & Núñez, G. (2008) · Cancer Research · doi:10.1158/0008-5472.can-08-2061 · Cited by 261
Self-citation
Research works printed but not linked: 41
- 10.3322/canjclin.55.2.74 · DOI
- 10.1002/bjs.5106 · DOI
- 10.1002/ijc.24343 · DOI
- 10.1002/ijc.20658 · DOI
- SlatteryML . 2000. Diet, lifestyle, and colon cancer. Semin. Gastrointest. Dis. 11:142–146.
- 10.1073/pnas.1000072107 · DOI
- 10.1207/S15327914NC422_6 · DOI
- 10.1073/pnas.202604299 · DOI
- 10.1126/science.1140488 · DOI
- 10.3945/ajcn.112.046607 · DOI · Paper page
- 10.1371/journal.pone.0039743 · DOI
- 10.1101/gr.126573.111 · DOI · Paper page
- 10.1186/1757-4749-5-2 · DOI
- 10.4161/gmic.1.3.12360 · DOI · Paper page
- 10.1371/journal.pone.0016393 · DOI
- 10.1038/nm.2015 · DOI · Paper page
- 10.1002/ijc.2910600322 · DOI
- 10.1136/gut.52.1.94 · DOI
- 10.1053/j.gastro.2011.01.057 · DOI
- 10.1046/j.1365-2036.2000.00698.x · DOI
- 10.4161/gmic.24220 · DOI
- 10.4103/1477-3163.78279 · DOI
- 10.1111/j.1349-7006.2003.tb01386.x · DOI
- Couturier-MaillardA SecherT RehmanA NormandS De ArcangelisA HaeslerR HuotL GrandjeanT BressenotA Delanoye-CrespinA GaillotO SchreiberS LemoineY RyffelB HotD NùñezG ChenG RosenstielP ChamaillardM . 2013. NOD2-mediated dysbiosis predisposes mice to transmissible colitis and colorectal cancer. J. Clin. Invest. 123:700–711.
- 10.1086/591130 · DOI
- 10.1136/gut.47.3.397 · DOI
- 10.1136/bmj.d6617 · DOI · Paper page
- 10.3945/jn.109.104380 · DOI
- 10.4161/gmic.21008 · DOI
- 10.1128/AEM.01541-09 · DOI · Paper page
- 10.1038/nmeth.1361 · DOI
- 10.1093/nar/gkm864 · DOI
- 10.1128/AEM.00062-07 · DOI
- 10.1007/978-94-015-7358-0 · DOI
- 10.1080/STA-200066418 · DOI
- 10.1093/bioinformatics/btl478 · DOI
- 10.1128/AEM.68.8.3673-3682.2002 · DOI
- LiawA WienerM . 2002. Classification and regression by randomForest. R News 2:18–22.
- 10.1111/j.1541-0420.2005.00489.x · DOI
- 10.1126/science.1209791 · DOI · Paper page
- 10.1093/bioinformatics/btr381 · DOI · Paper page
Cited by
Sorted by citations
Garrett, W. S. (2015) · Science · doi:10.1126/science.aaa4972 · Cited by 1,404
Disease-Specific Alterations in the Enteric Virome in Inflammatory Bowel Disease
Norman, J. M., Handley, S. A., Baldridge, M. T., Droit, L., Liu, C. Y., Keller, B. C., Kambal, A., Monaco, C. L., Zhao, G., Fleshner, P., et al. (2015) · Cell · doi:10.1016/j.cell.2015.01.002 · Cited by 1,285
Current Understanding of Dysbiosis in Disease in Human and Animal Models
DeGruttola, A. K., Low, D., Mizoguchi, A., & Mizoguchi, E. (2016) · Inflammatory Bowel Diseases · doi:10.1097/mib.0000000000000750 · Cited by 1,122
Diet, microorganisms and their metabolites, and colon cancer
O'Keefe, S. J. D. (2016) · Nature Reviews Gastroenterology & Hepatology · doi:10.1038/nrgastro.2016.165 · Cited by 1,100
Tumor-resident intracellular microbiota promotes metastatic colonization in breast cancer
Fu, A., Yao, B., Dong, T., Chen, Y., Yao, J., Liu, Y., Li, H., Bai, H., Liu, X., Zhang, Y., et al. (2022) · Cell · doi:10.1016/j.cell.2022.02.027 · Cited by 981
Wild Mouse Gut Microbiota Promotes Host Fitness and Improves Disease Resistance
Rosshart, S. P., Vassallo, B. G., Angeletti, D., Hutchinson, D. S., Morgan, A. P., Takeda, K., Hickman, H. D., McCulloch, J. A., Badger, J. H., Ajami, N. J., et al. (2017) · Cell · doi:10.1016/j.cell.2017.09.016 · Cited by 862
Akkermansia muciniphila is a promising probiotic
Zhang, T., Li, Q., Cheng, L., Buch, H., & Zhang, F. (2019) · Microbial Biotechnology · doi:10.1111/1751-7915.13410 · Cited by 708
Nutrients, foods, and colorectal cancer prevention
Song, M., Garrett, W. S., & Chan, A. T. (2015) · Gastroenterology · doi:10.1053/j.gastro.2014.12.035 · Cited by 700
The Microbiota of Breast Tissue and Its Association with Breast Cancer
Urbaniak, C., Gloor, G. B., Brackstone, M., Scott, L., Tangney, M., & Reid, G. (2016) · Applied and Environmental Microbiology · doi:10.1128/aem.01235-16 · Cited by 625
Peptostreptococcus anaerobius promotes colorectal carcinogenesis and modulates tumour immunity
Long, X., Wong, C. C., Tong, L., Chu, E. S. H., Ho Szeto, C., Go, M. Y. Y., Coker, O. O., Chan, A. W. H., Chan, F. K. L., Sung, J. J. Y., et al. (2019) · Nature Microbiology · doi:10.1038/s41564-019-0541-3 · Cited by 557
The human gut microbiome as a screening tool for colorectal cancer
Zackular, J. P., Rogers, M. A. M., Ruffin, M. T., & Schloss, P. D. (2014) · Cancer Prevention Research · doi:10.1158/1940-6207.capr-14-0129 · Cited by 551
Self-citationSpecialized metabolites from the microbiome in health and disease
Sharon, G., Garg, N., Debelius, J., Knight, R., Dorrestein, P. C., & Mazmanian, S. K. (2014) · Cell Metabolism · doi:10.1016/j.cmet.2014.10.016 · Cited by 544
Fermented Foods, Health and the Gut Microbiome
Leeuwendaal, N. K., Stanton, C., O’Toole, P. W., & Beresford, T. P. (2022) · Nutrients · doi:10.3390/nu14071527 · Cited by 496
Cancer and the gut microbiota: An unexpected link
Zitvogel, L., Galluzzi, L., Viaud, S., Vétizou, M., Daillère, R., Merad, M., & Kroemer, G. (2015) · Science Translational Medicine · doi:10.1126/scitranslmed.3010473 · Cited by 465
Host–microbiota maladaptation in colorectal cancer
Janney, A., Powrie, F., & Mann, E. H. (2020) · Nature · doi:10.1038/s41586-020-2729-3 · Cited by 445
Gut microbiota-mediated inflammation in obesity: a link with gastrointestinal cancer
Cani, P. D., & Jordan, B. F. (2018) · Nature Reviews Gastroenterology & Hepatology · doi:10.1038/s41575-018-0025-6 · Cited by 383
Arthur, J. C., Gharaibeh, R. Z., Mühlbauer, M., Perez-Chanona, E., Uronis, J. M., McCafferty, J., Fodor, A. A., & Jobin, C. (2014) · Nature Communications · doi:10.1038/ncomms5724 · Cited by 392
The Oral Microbiome and Cancer
Irfan, M., Delgado, R. Z. R., & Frias-Lopez, J. (2020) · Frontiers in Immunology · doi:10.3389/fimmu.2020.591088 · Cited by 341
Baxter, N. T., Ruffin, M. T., Rogers, M. A. M., & Schloss, P. D. (2016) · Genome Medicine · doi:10.1186/s13073-016-0290-3 · Cited by 354
Self-citationTaurocholic acid metabolism by gut microbes and colon cancer
Ridlon, J. M., Wolf, P. G., & Gaskins, H. R. (2016) · Gut Microbes · doi:10.1080/19490976.2016.1150414 · Cited by 327
Gut microbiome, big data and machine learning to promote precision medicine for cancer
Cammarota, G., Ianiro, G., Ahern, A., Carbone, C., Temko, A., Claesson, M. J., Gasbarrini, A., & Tortora, G. (2020) · Nature Reviews Gastroenterology & Hepatology · doi:10.1038/s41575-020-0327-3 · Cited by 324
Overacre-Delgoffe, A. E., Bumgarner, H. J., Cillo, A. R., Burr, A. H. P., Tometich, J. T., Bhattacharjee, A., Bruno, T. C., Vignali, D. A. A., & Hand, T. W. (2021) · Immunity · doi:10.1016/j.immuni.2021.11.003 · Cited by 318
The Role of the Microbiota in Inflammation, Carcinogenesis, and Cancer Therapy
Dzutsev, A., Goldszmid, R. S., Viaud, S., Zitvogel, L., & Trinchieri, G. (2015) · European Journal of Immunology · doi:10.1002/eji.201444972 · Cited by 300
Gut microbiota diversity across ethnicities in the United States
Brooks, A. W., Priya, S., Blekhman, R., & Bordenstein, S. R. (2018) · PLOS Biology · doi:10.1371/journal.pbio.2006842 · Cited by 304
Cancer-promoting effects of microbial dysbiosis
Sheflin, A. M., Whitney, A. K., & Weir, T. L. (2014) · Current Oncology Reports · doi:10.1007/s11912-014-0406-0 · Cited by 301
Baxter, N. T., Zackular, J. P., Chen, G. Y., & Schloss, P. D. (2014) · Microbiome · doi:10.1186/2049-2618-2-20 · Cited by 299
Self-citationDzutsev, A., Badger, J. H., Perez-Chanona, E., Roy, S., Salcedo, R., Smith, C. K., & Trinchieri, G. (2017) · Annual Review of Immunology · doi:10.1146/annurev-immunol-051116-052133 · Cited by 302
Aging progression of human gut microbiota
Xu, C., Zhu, H., & Qiu, P. (2019) · BMC Microbiology · doi:10.1186/s12866-019-1616-2 · Cited by 258
Locoregional Effects of Microbiota in a Preclinical Model of Colon Carcinogenesis
Tomkovich, S., Yang, Y., Winglee, K., Gauthier, J., Mühlbauer, M., Sun, X., Mohamadzadeh, M., Liu, X., Martin, P., Wang, G. P., et al. (2017) · Cancer Research · doi:10.1158/0008-5472.can-16-3472 · Cited by 252
Gut microbiota and colorectal cancer
Gao, R., Gao, Z., Huang, L., & Qin, H. (2017) · European Journal of Clinical Microbiology & Infectious Diseases · doi:10.1007/s10096-016-2881-8 · Cited by 205
Drago, L. (2019) · Microorganisms · doi:10.3390/microorganisms7030066 · Cited by 171
Tukenmez, U., Aktas, B., Aslim, B., & Yavuz, S. (2019) · Scientific Reports · doi:10.1038/s41598-019-44753-8 · Cited by 167
The microbiome and the hallmarks of cancer
Fulbright, L. E., Ellermann, M., & Arthur, J. C. (2017) · PLOS Pathogens · doi:10.1371/journal.ppat.1006480 · Cited by 164
Javurek, A. B., Spollen, W. G., Johnson, S. A., Bivens, N. J., Bromert, K. H., Givan, S. A., & Rosenfeld, C. S. (2016) · Gut Microbes · doi:10.1080/19490976.2016.1234657 · Cited by 160
Bioactive molecules of probiotic bacteria and their mechanism of action: A review
Indira, M., Venkateswarulu, T. C., Abraham Peele, K., Nazneen Bobby, M., & Krupanidhi, S. (2019) · 3 Biotech · doi:10.1007/s13205-019-1841-2 · Cited by 147
Yost, S., Stashenko, P., Choi, Y., Kukuruzinska, M., Genco, C. A., Salama, A., Weinberg, E. O., Kramer, C. D., & Frias-Lopez, J. (2018) · International Journal of Oral Science · doi:10.1038/s41368-018-0037-7 · Cited by 144
Carcinogenesis and therapeutics: the microbiota perspective
Tsilimigras, M. C. B., Fodor, A., & Jobin, C. (2017) · Nature Microbiology · doi:10.1038/nmicrobiol.2017.8 · Cited by 144
Lang, T., Zhu, R., Zhu, X., Yan, W., Li, Y., Zhai, Y., Wu, T., Huang, X., Yin, Q., & Li, Y. (2023) · Nature Communications · doi:10.1038/s41467-023-40439-y · Cited by 133
Deng, X., Li, Z., Li, G., Li, B., Jin, X., & Lyu, G. (2018) · Frontiers in Microbiology · doi:10.3389/fmicb.2018.01607 · Cited by 114
Association of dietary fibre intake and gut microbiota in adults
Lin, D., Peters, B. A., Friedlander, C., Freiman, H. J., Goedert, J. J., Sinha, R., Miller, G., Bernstein, M. A., Hayes, R. B., & Ahn, J. (2018) · British Journal of Nutrition · doi:10.1017/s0007114518002465 · Cited by 109
Raisch, J., Rolhion, N., Dubois, A., Darfeuille-Michaud, A., & Bringer, M.-A. (2015) · Laboratory Investigation · doi:10.1038/labinvest.2014.161 · Cited by 100
Gutiérrez‐Repiso, C., Hernández‐García, C., García‐Almeida, J. M., Bellido, D., Martín‐Núñez, G. M., Sánchez‐Alcoholado, L., Alcaide‐Torres, J., Sajoux, I., Tinahones, F. J., & Moreno‐Indias, I. (2019) · Molecular Nutrition & Food Research · doi:10.1002/mnfr.201900167 · Cited by 80
van der Lugt, B., Rusli, F., Lute, C., Lamprakis, A., Salazar, E., Boekschoten, M. V., Hooiveld, G. J., Müller, M., Vervoort, J., Kersten, S., et al. (2018) · Aging · doi:10.18632/aging.101439 · Cited by 72
The role of the gut microbiome in colorectal cancer: Where are we? Where are we going?
Wieczorska, K., Stolarek, M., & Stec, R. (2020) · Clinical Colorectal Cancer · doi:10.1016/j.clcc.2019.07.006 · Cited by 50
Jeraldo, P., Hernandez, A., Nielsen, H. B., Chen, X., White, B. A., Goldenfeld, N., Nelson, H., Alhquist, D., Boardman, L., & Chia, N. (2016) · Frontiers in Microbiology · doi:10.3389/fmicb.2016.00783 · Cited by 38
Greathouse, K. L., White, J. R., Padgett, R. N., Perrotta, B. G., Jenkins, G. D., Chia, N., & Chen, J. (2019) · BMJ Open Gastroenterology · doi:10.1136/bmjgast-2018-000247 · Cited by 35
Ni, Y., Wong, V. H. Y., Tai, W. C. S., Li, J., Wong, W. Y., Lee, M. M. L., Fong, F. L. Y., El-Nezami, H., & Panagiotou, G. (2017) · Journal of Applied Microbiology · doi:10.1111/jam.13386 · Cited by 29
Funayama, E., Hosonuma, M., Tajima, K., Isobe, J., Baba, Y., Murayama, M., Narikawa, Y., Toyoda, H., Tsurui, T., Maruyama, Y., et al. (2025) · Biomedicine & Pharmacotherapy · doi:10.1016/j.biopha.2024.117749 · Cited by 9
Metadata
- Authors
- Zackular, J. P., Baxter, N. T., Iverson, K. D., Sadler, W. D., Petrosino, J. F., Chen, G. Y., & Schloss, P. D.
- Venue
- mBio
- Publisher
- American Society for Microbiology
- Published
- 2013-12-31
- Volume
- 4
- Issue
- 6
- ISSN
- 2161-2129
- 2150-7511
- PMC
- PMC3892781
- Cited by
- 629
- References
- 9
- Language
- en
About these checks
Registry, retraction, Cites and statistics results are computed, not judged, with one exception: a printed reference that no index lists is read once by a model before it counts as a citation error. Claims are extracted by a model and kept only when their quote appears verbatim in the text; each cited source is then checked, with a model’s help, for whether it says what the claim relies on. Those verdicts can be wrong — read the claim’s quote and the cited source before relying on one.
Statistics and arithmetic are recomputed, not judged.
Confidence bands are shown only for fields calibrated on our annotated test set. None is calibrated yet, so no band is shown.
What counts as a claim ›How we measure confidence ›How we check this ›
Are you an author, or do you see a problem with this page? Request a review
