

The Archean atmosphere
Open accessThe DOI matches its Crossref record; 286 of the 286 references it cites were found in a registry or an index; 98 of the 330 sources its claims cite were checked for support.
Abstract
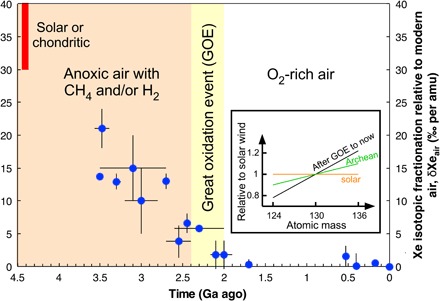
times modern amounts, respectively. The greenhouse gas concentrations were sufficient to offset a fainter Sun. Climate moderation by the carbon cycle suggests average surface temperatures between 0° and 40°C, consistent with occasional glaciations. Isotopic mass fractionation of atmospheric xenon through the Archean until atmospheric oxygenation is best explained by drag of xenon ions by hydrogen escaping rapidly into space. These data imply that substantial loss of hydrogen oxidized the Earth. Despite these advances, detailed understanding of the coevolving solid Earth, biosphere, and atmosphere remains elusive, however.
Overview
CoChat Summary
TL;DR
This review synthesizes proxies and models for the Archean atmosphere (4–2.5 Ga), concluding it was anoxic with negligible O2 and likely enriched in CO2 and CH4, with N2 as a bulk gas and a mostly moderate climate. It highlights major uncertainties in gas levels and the role of life, especially oxygenic photosynthesis and the later Great Oxidation Event.
Key findings
- O2 was extremely low: sulfur mass-independent fractionation indicates ground-level O2 <10−6 PAL (<0.2 ppmv for 1-bar air) before 2.4 Ga, while local “oxygen oases” are estimated at 0.001–0.017 mM O2 (0.4–7% of present).
- N2 and pressure were likely not much higher than today: fluid inclusions give pN2 <1.0 bar at 3.3 Ga and <1.1 bar at 3.5–3.0 Ga; vesicles imply 0.23 ± 0.23 bar at 2.7 Ga; raindrop imprints give a probable limit of <0.52–1.2 bar.
- CO2 and CH4 were important greenhouse gases: paleosol estimates include 0.03–0.15 bar CO2 at 2.77 Ga, 0.02–0.75 bar at 2.75 Ga, and 0.05–0.15 bar at 2.46 Ga; CH4 >20 ppmv is required for S-MIF, and xenon isotopes suggest >~5000 ppmv at ~3.5 Ga.
- Climate was probably mostly moderate: with a Sun 25–30% fainter at 4 Ga, carbonate-silicate models give 0–40°C and seawater pH 6.4–7.4; glacial rocks at 3.5, 2.9, and 2.7 Ga argue against a persistently hot Archean.
Methods
- This is a review/synthesis, not a primary study; it covers the Archean eon from 4 to 2.5 Ga and draws on proxies from rocks, minerals, fluid inclusions, paleosols, raindrop imprints, vesicles, and isotopic records including S-MIF, Xe, N, and C.
- The paper compiles constraints in Table 1 and figures, compares proxy estimates with photochemical, climate, and carbon-cycle models, and discusses the Hadean context and the Great Oxidation Event.
Limitations
- The paper states that limited proxy data leave major uncertainties about exact atmospheric gas levels over time; direct evidence for Archean CO2 remains scanty; when and whether an organic haze formed is uncertain; and knowledge of Archean climatic variability is meager.
- Several proxies are debated: raindrop paleopressure has been criticized but defended; putative Archean biomarkers suffer contamination; some O2 “whiffs” are disputed as post-GOE alteration; siderite is omitted as a pCO2 proxy because it appears diagenetic; and an alternative Xe explanation via organic hazes is considered problematic.
- Evident from the text: as a review, its conclusions depend on cited studies and models, and many constraints are indirect, model-dependent, or permissive rather than definitive.
Model-written summary. Check it against the paper before relying on it.
Integrity signals
Registry
Cites
Statistics
Figures



Verification
Claims the paper makes
78 Valid · 10 Not valid · 121 Not checked · 87 Own results and interpretations
Some cited sources support this claim and some don’t — read each source’s verdict below.
In the paper
“However, observations are unsupportive: Fast mass loss only happens in the first ~200 Ma after Sun-like stars form (207, 208).”
§ The Archean atmosphere > THE ARCHEAN CLIMATE > The Faint Young Sun problem
What the sources say
- Disputedcites [207] Wood B. E., Muller H. R., Zank G. P., Linsky J. L., Redfield S., New mass-loss measurements from astrospheric Lyman-alpha absorption. Astrophys. J. 628, L143– L146 (2005). sourceExperimental — accuracy not yet measured
Figure 3(b) and its accompanying discussion (page not provided) place the inferred weakening of the solar wind at about 0.7 Gyr when looking back toward younger ages. The paper therefore does not confine strong mass loss to the first ~200 million years; it suggests a different age pattern, with especially active, younger stars having weaker winds than the trend would predict. (LLM, conf=0.86)
Checked by a reasoning model — may be wrong.
- Partly supportedcites [208] Minton D. A., Malhotra R., Assessing the massive young sun hypothesis to solve the warm young Earth puzzle. Astrophys. J. 660, 1700– 1706 (2007). sourceExperimental — accuracy not yet measured
Section 3 (Stellar Winds of Sun-like Stars; page unavailable) says observations indicate that stellar-wind flux decreases on a timescale of order 10^8 years and do not support the prolonged mass loss required by the hypothesis. It does not establish a cutoff at approximately 200 million years or say that fast mass loss happens only before then; the Introduction also cautions that the observations cannot rule out a different history for the Sun. (LLM, conf=0.86)
plain- Asserted: passes — The authors put it forward as true.
- Checkable: passes — It can be checked against evidence.
- Load-bearing: passes — The paper’s conclusions depend on it.
- Based: passes — The paper gives a reason why it holds.
- Disputed
The sources with a verdict support this claim; the rest weren’t checked yet, have no full text we could read, or their verdicts aren’t rated yet.
In the paper
“At 4 Ga ago, solar luminosity was 25 to 30% lower than today (12, 13)”
§ The Archean atmosphere > INTRODUCTION: BACKGROUND TO ARCHEAN EARTH
What the sources say
- Not checked — no full text of the sourcecites [12] Gough D. O., Solar interior structure and luminosity variations. Sol. Phys. 74, 21– 34 (1981). source
- Supportedcites [13] Bahcall J. N., Pinsonneault M. H., Basu S., Solar models: Current epoch and time dependences, neutrinos, and helioseismological properties. Astrophys. J. 555, 990– 1012 (2001). source
Table 2 (§3.1) gives the Sun’s present age as 4.57 billion years and its luminosity at solar age 0.6 billion years as 0.744 of today’s. Four billion years ago corresponds to solar age about 0.57 billion years, when luminosity was therefore about 26% lower than today. (LLM, conf=0.94)
plain- Asserted: passes — The authors put it forward as true.
- Checkable: passes — It can be checked against evidence.
- Load-bearing: passes — The paper’s conclusions depend on it.
- Based: passes — The paper gives a reason why it holds.
The sources with a verdict support this claim; the rest weren’t checked yet, have no full text we could read, or their verdicts aren’t rated yet.
In the paper
“Liquid water under a fainter Sun likely implies more abundant greenhouse gases than today (14, 15).”
§ The Archean atmosphere > INTRODUCTION: BACKGROUND TO ARCHEAN EARTH
What the sources say
- Not checked — no full text of the sourcecites [14] Sagan C., Mullen G., Earth and Mars: Evolution of atmospheres and surface temperatures. Science 177, 52– 56 (1972). 17756316 source
- Supportedcites [15] Feulner G., The faint young Sun problem. Rev. Geophys. 50, RG2006 (2012). source
Section 5.5, paragraph 102 (page unavailable), calls an enhanced greenhouse effect the most likely solution to the faint young Sun problem, while acknowledging uncertainty about the gases involved. Section 2.2 discusses the cooling expected under a fainter Sun. Together, these support the claim’s qualified inference that liquid water on early Earth likely required more greenhouse warming than today. (LLM, conf=0.90)
hedgedstates a possible cause- Asserted: passes — The authors put it forward as true.
- Checkable: passes — It can be checked against evidence.
- Load-bearing: passes — The paper’s conclusions depend on it.
- Based: passes — The paper gives a reason why it holds.
Every source the paper cites for this claim was checked and supports it.
In the paper
“Iron formations (IFs), which are marine chemical sedimentary rocks rich in iron and silica [15 to 40 weight % (wt %) Fe and 40 to 60 wt % SiO2], indicate that the deep Archean ocean contained Fe2+(aq) and so was anoxic [e.g., (72)].”
§ The Archean atmosphere > WHAT WAS THE ARCHEAN ATMOSPHERE MADE OF? > Negligible Archean O2 but oxygen oases after oxygenic photosynthesis evolved
What the sources say
- Supportedcites [72] Konhauser K. O., Planavsky N. J., Hardisty D. S., Robbins L. J., Warchola T. J., Haugaard R., Lalonde S. V., Partin C. A., Oonk P. B. H., Tsikos H., Lyons T. W., Bekker A., Johnson C. M., Iron formations: A global record of neoarchaean to palaeoproterozoic environmental history. Earth Sci. Rev. 172, 140– 177 (2017). source
Section 2.1 links Archaean iron-formation deposition to the transport of dissolved Fe(II) under less oxidising conditions. Section 2.6 states that deep waters remained anoxic during iron-formation deposition, and Section 4 calls the Archaean deep-ocean state ferruginous (anoxic). Page numbers are unavailable in our copy. (LLM, conf=0.92)
hedgedstates a cause- Asserted: passes — The authors put it forward as true.
- Checkable: passes — It can be checked against evidence.
- Load-bearing: passes — The paper’s conclusions depend on it.
- Based: passes — The paper gives a reason why it holds.
- Supported
The cited sources support only part of this claim — read each source’s verdict below.
In the paper
“However, consumption of CO2 in the weathering of impact ejecta by carbonic acid suggests a cool early Hadean surface near 0°C under the faint Sun (35, 36).”
§ The Archean atmosphere > A BRIEF OVERVIEW OF THE ENVIRONMENT BEFORE THE ARCHEAN
What the sources say
- Not checked — no full text of the sourcecites [35] Sleep N. H., Zahnle K., Carbon dioxide cycling and implications for climate on ancient Earth. J. Geophys. Res. 106, 1373– 1399 (2001). source
- Partly supportedcites [36] Kadoya S., Krissansen-Totton J., Catling D. C., Probable cold and alkaline surface environment of the Hadean earth caused by impact ejecta weathering. Geochem. Geophys. Geosyst. 21, e2019GC008734 (2019). sourceExperimental — accuracy not yet measured
The Introduction says carbonic-acid weathering of impact ejecta lowers atmospheric CO₂, and Results §4.1 links that consumption to a probably cold climate at 4.3 Ga. The specific temperature is less well supported: the Conclusions give a modeled value of 259.2 K (about −14°C), with substantial uncertainty, rather than a temperature near 0°C. No page numbers are available in our copy. (LLM, conf=0.83)
hedgedstates a cause- Asserted: passes — The authors put it forward as true.
- Checkable: passes — It can be checked against evidence.
- Load-bearing: unclear — It is unclear whether the paper’s conclusions depend on it.
- Based: passes — The paper gives a reason why it holds.
182 more claims · 47 with their cited sources checked
Create a free account to see all 296 claims and to verify the 3 references still open.
- It may state two separate claims as one. 65
- Probably not a substantial claim. 62
- The quote only partly states this claim. 1
Claims other papers make about this one
Each is checked against this paper’s own text: does it say what the citing paper says it does?
The cited source says what the claim attributes to it.
In the citing paper
“liquid water was already present at the surface during the Hadean (4.56 Ga to ≈ 4.0 Ga 1 ) and Archean eons ( ≈ 4.0 Ga to 2.4 Ga)”
From The young Sun's XUV-activity as a constraint for lower CO2-limits in the Earth's Archean atmosphere (2021) · cites this paper as Catling and Zahnle, 2020
Self-check
Percentages, sums and reported differences re-computed from the paper’s own numbers.
Each contradiction between two passages listed here was confirmed by an independent check.
Rated minor: it would not touch a result — a value no result rests on, a p-value that stays on the same side of the significance level, or a conflict that is clerical, resolved elsewhere in the paper, or outside its own findings.
In the paper
§ The Archean atmosphere > CONCLUSIONS AND OUTLOOK
“The secular decline of CO2 is a feedback effect in the geological carbon cycle induced by decreasing solar luminosity.”
§ The Archean atmosphere > INTRODUCTION: BACKGROUND TO ARCHEAN EARTH
“In addition to a gradual increase in solar luminosity, slow changes in the solid Earth over time provided boundary conditions for atmospheric evolution.”
Rated minor: it would not touch a result — a value no result rests on, a p-value that stays on the same side of the significance level, or a conflict that is clerical, resolved elsewhere in the paper, or outside its own findings.
In the paper
§ The Archean atmosphere > WHAT WAS THE ARCHEAN ATMOSPHERE MADE OF?
“Surface barometric pressure | <0.52–1.1 bar | 2.7 Ga | Maximum fossil raindrop imprint size (57)”
§ The Archean atmosphere > WHAT WAS THE ARCHEAN ATMOSPHERE MADE OF? > Nitrogen gases in the Archean
“the largest size of 2.7-Ga-old fossil raindrop imprints provides a conservative limit of paleopressure of <2.1 bar and a probable limit of <0.52 to 1.2 bar (57).”
Citations
Cites
An early Cenozoic perspective on greenhouse warming and carbon-cycle dynamics
Zachos, J. C., Dickens, G. R., & Zeebe, R. E. (2008) · Nature · doi:10.1038/nature06588 · Cited by 3,550 · cited 1×
“In the Archean, any indication of polar environments from glacial rocks would suggest a relatively cool world given that since ~34Ma, a climate with poles covered in ice has required average global temperatures below ~20°C (223).”
BackgroundThe rise of oxygen in Earth's early ocean and atmosphere
Lyons, T. W., Reinhard, C. T., & Planavsky, N. J. (2014) · Nature · doi:10.1038/nature13068 · Cited by 2,810
A negative feedback mechanism for the long‐term stabilization of Earth's surface temperature
Walker, J. C. G., Hays, P. B., & Kasting, J. F. (1981) · Journal of Geophysical Research: Oceans · doi:10.1029/jc086ic10p09776 · Cited by 2,310
The Chemical Evolution of the Atmosphere and Oceans
Holland, H. D. (1984) · doi:10.1515/9780691220239 · Cited by 1,836
Atmospheric Influence of Earth's Earliest Sulfur Cycle
Farquhar, J., Bao, H., & Thiemens, M. (2000) · Science · doi:10.1126/science.289.5480.756 · Cited by 1,805
Wilde, S. A., Valley, J. W., Peck, W. H., & Graham, C. M. (2001) · Nature · doi:10.1038/35051550 · Cited by 1,744 · cited 1×
“3-Ga-old zircons was possibly inherited from (18)O-enriched, weathered surface rocks thatwere later buried and melted, which implies the presence of surficial liquid water and even land (17, 18).”
BackgroundThe Redox State of Earth's Mantle
Frost, D. J., & McCammon, C. A. (2008) · Annual Review of Earth and Planetary Sciences · doi:10.1146/annurev.earth.36.031207.124322 · Cited by 1,134 · cited 1×
“Therefore, the Hadean atmosphere and mantle were probably initially highly reducing, before subsequent oxidation either by hydrogen escape (29) or disproportionation of mantle FeO accompanied by Fe loss to the core (30, 31).”
BackgroundGEOCARBSULF: A combined model for Phanerozoic atmospheric O2 and CO2
Berner, R. A. (2006) · Geochimica et Cosmochimica Acta · doi:10.1016/j.gca.2005.11.032 · Cited by 1,120 · cited 1×
“The post-Devonian black line for O2 evolution approximately represents curves from calculations of C and S isotopic mass balance (254, 255).”
BackgroundTracing the stepwise oxygenation of the Proterozoic ocean
Scott, C., Lyons, T. W., Bekker, A., Shen, Y., Poulton, S. W., Chu, X., & Anbar, A. D. (2008) · Nature · doi:10.1038/nature06811 · Cited by 1,098
A Whiff of Oxygen Before the Great Oxidation Event?
Anbar, A. D., Duan, Y., Lyons, T. W., Arnold, G. L., Kendall, B., Creaser, R. A., Kaufman, A. J., Gordon, G. W., Scott, C., Garvin, J., et al. (2007) · Science · doi:10.1126/science.1140325 · Cited by 1,024
The origins and concentrations of water, carbon, nitrogen and noble gases on Earth
Marty, B. (2012) · Earth and Planetary Science Letters · doi:10.1016/j.epsl.2011.10.040 · Cited by 1,012 · cited 1×
“However, lowN/C in today’smid-ocean ridge source basalts (144) suggests considerableN2 degassing once the uppermantle became oxidized because then nitrogen became insoluble in magmas and upper mantle fluids (145).”
BackgroundEarth and Mars: evolution of atmospheres and surface temperatures
Sagan, C., & Mullen, G. (1972) · Science · doi:10.1126/science.177.4043.52 · Cited by 942 · cited 11×
“2020;6 : eaax1420 26 February 2020 Ammonia (NH3) levels of 10 to 100 ppmv would provide a greenhouse effect to counteract the faint young Sun (FYS) (14), but these levels ofNH3 cannot be sustained againstUVphotolysis (161).”
BackgroundInfluentialVolcanic gases, black smokers, and the great oxidation event
Holland, H. D. (2002) · Geochimica et Cosmochimica Acta · doi:10.1016/s0016-7037(02)00950-x · Cited by 920 · cited 2×
“These O2 levels would have only been attained when the O2 flux from the burial of organic carbon exceeded the kinetically efficient sink fromO2-consuming gases (CO, H2, H2S, and SO2) from volcanism and metamorphism plus fluxes of reducing cations such as Fe from seafloor vents (9, 120, 121, 123, 124).”
BackgroundPavlov, A. A., & Kasting, J. F. (2002) · Astrobiology · doi:10.1089/153110702753621321 · Cited by 912
Solar Models: Current Epoch and Time Dependences, Neutrinos, and Helioseismological Properties
Bahcall, J. N., Pinsonneault, M. H., & Basu, S. (2001) · The Astrophysical Journal · doi:10.1086/321493 · Cited by 885
Oxygen-isotope evidence from ancient zircons for liquid water at the Earth's surface 4,300 Myr ago
Mojzsis, S. J., Harrison, T. M., & Pidgeon, R. T. (2001) · Nature · doi:10.1038/35051557 · Cited by 863 · cited 1×
“3-Ga-old zircons was possibly inherited from (18)O-enriched, weathered surface rocks thatwere later buried and melted, which implies the presence of surficial liquid water and even land (17, 18).”
BackgroundSolar interior structure and luminosity variations
Gough, D. O. (1981) · Solar Physics · doi:10.1007/bf00151270 · Cited by 798 · cited 2×
“Solar evolution models show that the Sun was 25 to 30% fainter at 4 Ga ago (12, 13, 15).”
BackgroundSedimentary nitrogen isotopic ratio as a recorder for surface ocean nitrate utilization
Altabet, M. A., & Francois, R. (1994) · Global Biogeochemical Cycles · doi:10.1029/93gb03396 · Cited by 792 · cited 1×
“Sedimentary organics have d(15)N = 7 ± 1‰ compared to 0‰ in N2 in modern and ancient air and − 5 ± 2‰ in the mantle (151, 152).”
BackgroundFuture climate forcing potentially without precedent in the last 420 million years
Foster, G. L., Royer, D. L., & Lunt, D. J. (2017) · Nature Communications · doi:10.1038/ncomms14845 · Cited by 774
Calibration of Sulfate Levels in the Archean Ocean
Habicht, K. S., Gade, M., Thamdrup, B., Berg, P., & Canfield, D. E. (2002) · Science · doi:10.1126/science.1078265 · Cited by 756
Snowball Earth climate dynamics and Cryogenian geology-geobiology
Hoffman, P. F., Abbot, D. S., Ashkenazy, Y., Benn, D. I., Brocks, J. J., Cohen, P. A., Cox, G. M., Creveling, J. R., Donnadieu, Y., Erwin, D. H., et al. (2017) · Science Advances · doi:10.1126/sciadv.1600983 · Cited by 726
13 C-Depleted Carbon Microparticles in >3700-Ma Sea-Floor Sedimentary Rocks from West Greenland
Rosing, M. T. (1999) · Science · doi:10.1126/science.283.5402.674 · Cited by 699
Fluctuations in Precambrian atmospheric oxygenation recorded by chromium isotopes
Frei, R., Gaucher, C., Poulton, S. W., & Canfield, D. E. (2009) · Nature · doi:10.1038/nature08266 · Cited by 653
Atmospheric oxygenation three billion years ago
Crowe, S. A., Døssing, L. N., Beukes, N. J., Bau, M., Kruger, S. J., Frei, R., & Canfield, D. E. (2013) · Nature · doi:10.1038/nature12426 · Cited by 640
Evidence for oxygenic photosynthesis half a billion years before the Great Oxidation Event
Planavsky, N. J., Asael, D., Hofmann, A., Reinhard, C. T., Lalonde, S. V., Knudsen, A., Wang, X., Ossa Ossa, F., Pecoits, E., Smith, A. J. B., et al. (2014) · Nature Geoscience · doi:10.1038/ngeo2122 · Cited by 615
Calibration of Sulfate Levels in the Archean Ocean
Gao, X., Thiemens, M. H., Farquhar, J. D., Jackson, T. L., Savarino, J., Airieau, S., Albarède, F., van der Hilst, R. D., & Kárason, H. (2002) · Cited by 607
COPSE: A new model of biogeochemical cycling over Phanerozoic time
Bergman, N. M. (2004) · American Journal of Science · doi:10.2475/ajs.304.5.397 · Cited by 599
Noble Gases and Volatile Recycling at Subduction Zones
Hilton, D. R., Fischer, T. P., & Marty, B. (2002) · Reviews in Mineralogy and Geochemistry · doi:10.2138/rmg.2002.47.9 · Cited by 595
Carbon dioxide cycling and implications for climate on ancient Earth
Sleep, N. H., & Zahnle, K. (2001) · Journal of Geophysical Research: Planets · doi:10.1029/2000je001247 · Cited by 592 · cited 20×
“I. J. Sackmann, A. I. Boothroyd, Our Sun.”
BackgroundInfluentialSelf-citationThe Proterozoic biosphere: a multidisciplinary study
Schopf, D. J. W. (1988) · Lethaia · doi:10.1111/j.1502-3931.1988.tb02083.x · Cited by 588
Annihilation of ecosystems by large asteroid impacts on the early Earth
Sleep, N. H., Zahnle, K. J., Kasting, J. F., & Morowitz, H. J. (1989) · Nature · doi:10.1038/342139a0 · Cited by 574 · cited 1×
“Regardless, an LHB would likely not sterilize Earth (26); any microbial life would have rebounded (27).”
BackgroundSelf-citationEvidence from fluid inclusions for microbial methanogenesis in the early Archaean era
Ueno, Y., Yamada, K., Yoshida, N., Maruyama, S., & Isozaki, Y. (2006) · Nature · doi:10.1038/nature04584 · Cited by 572 · cited 2×
“Hydrogen abundance The Archean lower atmosphere is unlikely to have been H2-rich given the antiquity of methanogens (23, 51, 197), some of which convert H2 into methane through a net reaction”
BackgroundSolar Models: current epoch and time dependences, neutrinos, and helioseismological properties
Bahcall, J. N., Pinsonneault, M. H., & Basu, S. (2001) · CERN Document Server (European Organization for Nuclear Research) · Cited by 561
Trace element content of sedimentary pyrite as a new proxy for deep-time ocean–atmosphere evolution
Large, R. R., Halpin, J. A., Danyushevsky, L. V., Maslennikov, V. V., Bull, S. W., Long, J. A., Gregory, D. D., Lounejeva, E., Lyons, T. W., Sack, P. J., et al. (2014) · Earth and Planetary Science Letters · doi:10.1016/j.epsl.2013.12.020 · Cited by 545
Iron formations: A global record of Neoarchaean to Palaeoproterozoic environmental history
Konhauser, K. O., Planavsky, N. J., Hardisty, D. S., Robbins, L. J., Warchola, T. J., Haugaard, R., Lalonde, S. V., Partin, C. A., Oonk, P. B. H., Tsikos, H., et al. (2017) · Earth-Science Reviews · doi:10.1016/j.earscirev.2017.06.012 · Cited by 537
Iron Isotope Constraints on the Archean and Paleoproterozoic Ocean Redox State
Rouxel, O. J., Bekker, A., & Edwards, K. J. (2005) · Science · doi:10.1126/science.1105692 · Cited by 533
Theoretical constraints on oxygen and carbon dioxide concentrations in the Precambrian atmosphere
Kasting, J. F. (1987) · Precambrian Research · doi:10.1016/0301-9268(87)90001-5 · Cited by 530
Timing and tempo of the great oxidation event
Gumsley, A. P., Chamberlain, K. R., Bleeker, W., Söderlund, U., de Kock, M. O., Larsson, E. R., & Bekker, A. (2017) · Proceedings of the National Academy of Sciences · doi:10.1073/pnas.1608824114 · Cited by 527
Paleosols and the evolution of atmospheric oxygen; a critical review
Rye, R., & Holland, H. D. (1998) · American Journal of Science · doi:10.2475/ajs.298.8.621 · Cited by 524
Farquhar, J., Savarino, J., Airieau, S., & Thiemens, M. H. (2001) · Journal of Geophysical Research: Planets · doi:10.1029/2000je001437 · Cited by 518
A palaeotemperature curve for the Precambrian oceans based on silicon isotopes in cherts
Robert, F., & Chaussidon, M. (2006) · Nature · doi:10.1038/nature05239 · Cited by 510 · cited 1×
“The same issue applies for silicon isotopes in Archean cherts, which have been used to infer hot surface temperatures (238).”
BackgroundBiogenic Methane, Hydrogen Escape, and the Irreversible Oxidation of Early Earth
Catling, D. C., Zahnle, K. J., & McKay, C. P. (2001) · Science · doi:10.1126/science.1061976 · Cited by 507 · cited 3×
“Some emphasize the role of hydrogen escape to space in oxidizing solid Earth, lowering Earth’s capacity to release O2-consuming reductants (121, 135, 136).”
BackgroundSelf-citationOn the Early Chemical History of the Earth and the Origin of Life
Urey, H. C. (1952) · Proceedings of the National Academy of Sciences · doi:10.1073/pnas.38.4.351 · Cited by 498 · cited 1×
“In any case, iron-cored impactors would reduce seawater to hydrogen and create transient, highly reducing atmospheres that may have been important for the origin of life (32, 33).”
BackgroundThe carbon cycle and associated redox processes through time
Hayes, J. M., & Waldbauer, J. R. (2006) · Philosophical Transactions of the Royal Society B: Biological Sciences · doi:10.1098/rstb.2006.1840 · Cited by 482
Potentially biogenic carbon preserved in a 4.1 billion-year-old zircon
Bell, E. A., Boehnke, P., Harrison, T. M., & Mao, W. L. (2015) · Proceedings of the National Academy of Sciences · doi:10.1073/pnas.1517557112 · Cited by 474 · cited 1×
“has a biogenic-like d(13)C of−24 permil (‰) (19), although lack of contextmeans that an abiotic origin cannot be eliminated.”
BackgroundOcean productivity before about 1.9 Gyr ago limited by phosphorus adsorption onto iron oxides
Bjerrum, C. J., & Canfield, D. E. (2002) · Nature · doi:10.1038/417159a · Cited by 468
New Mass-Loss Measurements from Astrospheric Lyα Absorption
Wood, B. E., Müller, H.-R., Zank, G. P., Linsky, J. L., & Redfield, S. (2005) · The Astrophysical Journal · doi:10.1086/432716 · Cited by 467
Knauth, L. P. (2005) · Palaeogeography, Palaeoclimatology, Palaeoecology · doi:10.1016/j.palaeo.2004.10.014 · Cited by 450 · cited 1×
“These ratios decline with increasing age, which, at face value, suggests Archean ocean temperatures of 50° to 85°C (227).”
BackgroundThe isotopic nature of the Earth’s accreting material through time
Dauphas, N. (2017) · Nature · doi:10.1038/nature20830 · Cited by 450 · cited 1×
“2020;6 : eaax1420 26 February 2020 that this highly reducingmeteoriticmaterial was delivered late in Earth’s accretion (28).”
BackgroundEvolution of Oxygenic Photosynthesis
Fischer, W. W., Hemp, J., & Johnson, J. E. (2016) · Annual Review of Earth and Planetary Sciences · doi:10.1146/annurev-earth-060313-054810 · Cited by 436
Formation of supercontinents linked to increases in atmospheric oxygen
Campbell, I. H., & Allen, C. M. (2008) · Nature Geoscience · doi:10.1038/ngeo259 · Cited by 432
Atmospheric carbon dioxide concentrations before 2.2 billion years ago
Rye, R., Kuo, P. H., & Holland, H. D. (1995) · Nature · doi:10.1038/378603a0 · Cited by 431
Canfield, D. E., Rosing, M. T., & Bjerrum, C. (2006) · Philosophical Transactions of the Royal Society B: Biological Sciences · doi:10.1098/rstb.2006.1906 · Cited by 417
Increased subaerial volcanism and the rise of atmospheric oxygen 2.5 billion years ago
Kump, L. R., & Barley, M. E. (2007) · Nature · doi:10.1038/nature06058 · Cited by 403
Jaffrés, J. B. D., Shields, G. A., & Wallmann, K. (2007) · Earth-Science Reviews · doi:10.1016/j.earscirev.2007.04.002 · Cited by 398
The Early Faint Sun Paradox: Organic Shielding of Ultraviolet-Labile Greenhouse Gases
Sagan, C., & Chyba, C. (1997) · Science · doi:10.1126/science.276.5316.1217 · Cited by 396 · cited 2×
“Earlier, we noted that an organic haze might protect tropospheric ammonia from UV (162), but whether NH3 was a viable greenhouse gas is unclear.”
BackgroundPalaeotemperature trend for Precambrian life inferred from resurrected proteins
Gaucher, E. A., Govindarajan, S., & Ganesh, O. K. (2008) · Nature · doi:10.1038/nature06510 · Cited by 394
How Earth's atmosphere evolved to an oxic state: A status report
Catling, D. C., & Claire, M. W. (2005) · Earth and Planetary Science Letters · doi:10.1016/j.epsl.2005.06.013 · Cited by 376
Self-citationLate Archean Biospheric Oxygenation and Atmospheric Evolution
Kaufman, A. J., Johnston, D. T., Farquhar, J., Masterson, A. L., Lyons, T. W., Bates, S., Anbar, A. D., Arnold, G. L., Garvin, J., & Buick, R. (2007) · Science · doi:10.1126/science.1138700 · Cited by 374
Rapid oxygenation of Earth’s atmosphere 2.33 billion years ago
Luo, G., Ono, S., Beukes, N. J., Wang, D. T., Xie, S., & Summons, R. E. (2016) · Science Advances · doi:10.1126/sciadv.1600134 · Cited by 371 · cited 1×
“3Ga,with the transitionmarked in the rocks by the sudden disappearance of mass-independent fractionation (MIF) of sulfur isotopes (discussed in detail later) (7, 8).”
BackgroundPhanerozoic concentrations of atmospheric oxygen reconstructed from sedimentary charcoal
Glasspool, I. J., & Scott, A. C. (2010) · Nature Geoscience · doi:10.1038/ngeo923 · Cited by 363
Buick, R. (1992) · Science · doi:10.1126/science.11536492 · Cited by 361
A Revised, Hazy Methane Greenhouse for the Archean Earth
Haqq-Misra, J. D., Domagal-Goldman, S. D., Kasting, P. J., & Kasting, J. F. (2008) · Astrobiology · doi:10.1089/ast.2007.0197 · Cited by 357
Geological constraints on the Precambrian history of Earth's rotation and the Moon's orbit
Williams, G. E. (2000) · Reviews of Geophysics · doi:10.1029/1999rg900016 · Cited by 349 · cited 1×
“45-Ga-old banded iron Weeli Wolli Formation, Australia indicate a ~17-hour day (247).”
BackgroundConstraining the climate and ocean pH of the early Earth with a geological carbon cycle model
Krissansen-Totton, J., Arney, G. N., & Catling, D. C. (2018) · Proceedings of the National Academy of Sciences · doi:10.1073/pnas.1721296115 · Cited by 348 · cited 8×
“5 Ga 9 5% confidence ranges from a carbon cycle model with 10(4)-ppmv Archean CH4 (34).”
BackgroundMethodInfluentialSelf-citationAtmospheric Evolution on Inhabited and Lifeless Worlds
Catling, D. C., & Kasting, J. F. (2017) · doi:10.1017/9781139020558 · Cited by 342 · cited 4×
“For a description of other events, see (64) and references therein.”
BackgroundInfluentialSelf-citationA working model of the primitive Earth
Cloud, P. (1972) · American Journal of Science · doi:10.2475/ajs.272.6.537 · Cited by 341 · cited 1×
“The Archean was originally conceived to span the time from after the origin of life to the advent of freeO2 (5).”
BackgroundFeulner, G. (2012) · Reviews of Geophysics · doi:10.1029/2011rg000375 · Cited by 338 · cited 2×
“Solar evolution models show that the Sun was 25 to 30% fainter at 4 Ga ago (12, 13, 15).”
BackgroundTHE STABLE ISOTOPE GEOCHEMISTRY OF MOLYBDENUM
Kendall, B., Dahl, T. W., & Anbar, A. D. (2017) · Reviews in Mineralogy and Geochemistry · doi:10.2138/rmg.2017.82.16 · Cited by 333
Sulfate was a trace constituent of Archean seawater
Crowe, S. A., Paris, G., Katsev, S., Jones, C., Kim, S.-T., Zerkle, A. L., Nomosatryo, S., Fowle, D. A., Adkins, J. F., Sessions, A. L., et al. (2014) · Science · doi:10.1126/science.1258966 · Cited by 328
The Pale Orange Dot: The Spectrum and Habitability of Hazy Archean Earth
Arney, G., Domagal-Goldman, S. D., Meadows, V. S., Wolf, E. T., Schwieterman, E., Charnay, B., Claire, M., Hébrard, E., & Trainer, M. G. (2016) · Astrobiology · doi:10.1089/ast.2015.1422 · Cited by 327 · cited 3×
“Thus, attenuation of sunlight saturates (1, 163).”
BackgroundA coupled atmosphere–ecosystem model of the early Archean Earth
KHARECHA, P., KASTING, J., & SIEFERT, J. (2005) · Geobiology · doi:10.1111/j.1472-4669.2005.00049.x · Cited by 321 · cited 5×
“(250)] Limit if transfer of gas through the atmosphere-ocean interface restricts CO consumption (183).”
BackgroundInfluentialZAHNLE, K., CLAIRE, M., & CATLING, D. (2006) · Geobiology · doi:10.1111/j.1472-4669.2006.00085.x · Cited by 315 · cited 21×
“For a wide range of Archean atmospheric redox conditions, both types of aerosol should form and precipitate (44).”
BackgroundInfluentialSelf-citationReappraisal of hydrocarbon biomarkers in Archean rocks
French, K. L., Hallmann, C., Hope, J. M., Schoon, P. L., Zumberge, J. A., Hoshino, Y., Peters, C. A., George, S. C., Love, G. D., Brocks, J. J., et al. (2015) · Proceedings of the National Academy of Sciences · doi:10.1073/pnas.1419563112 · Cited by 307
Catling, D. C., Glein, C. R., Zahnle, K. J., & McKay, C. P. (2005) · Astrobiology · doi:10.1089/ast.2005.5.415 · Cited by 307
Self-citationReverse weathering as a long-term stabilizer of marine pH and planetary climate
Isson, T. T., & Planavsky, N. J. (2018) · Nature · doi:10.1038/s41586-018-0408-4 · Cited by 306
Cyanobacteria and the Great Oxidation Event: evidence from genes and fossils
Schirrmeister, B. E., Gugger, M., & Donoghue, P. C. J. (2015) · Palaeontology · doi:10.1111/pala.12178 · Cited by 304
(1967) · American Mineralogist · Cited by 300
Bistability of atmospheric oxygen and the Great Oxidation
Goldblatt, C., Lenton, T. M., & Watson, A. J. (2006) · Nature · doi:10.1038/nature05169 · Cited by 297 · cited 1×
“2020;6 : eaax1420 26 February 2020 sphericO2 that otherwise occurswhen an incipient ozone column is still transparent to far UV (44, 121, 122).”
BackgroundPrecambrian paleosols and atmospheric CO2 levels
Sheldon, N. D. (2006) · Precambrian Research · doi:10.1016/j.precamres.2006.02.004 · Cited by 296
Nitrogen-enhanced greenhouse warming on early Earth
Goldblatt, C., Claire, M. W., Lenton, T. M., Matthews, A. J., Watson, A. J., & Zahnle, K. J. (2009) · Nature Geoscience · doi:10.1038/ngeo692 · Cited by 291
Self-citationA Late Archean Sulfidic Sea Stimulated by Early Oxidative Weathering of the Continents
Reinhard, C. T., Raiswell, R., Scott, C., Anbar, A. D., & Lyons, T. W. (2009) · Science · doi:10.1126/science.1176711 · Cited by 287
Silicate weathering in anoxic marine sediments
Wallmann, K., Aloisi, G., Haeckel, M., Tishchenko, P., Pavlova, G., Greinert, J., Kutterolf, S., & Eisenhauer, A. (2008) · Geochimica et Cosmochimica Acta · doi:10.1016/j.gca.2008.03.026 · Cited by 286
Organic haze on Titan and the early Earth
Trainer, M. G., Pavlov, A. A., DeWitt, H. L., Jimenez, J. L., McKay, C. P., Toon, O. B., & Tolbert, M. A. (2006) · Proceedings of the National Academy of Sciences · doi:10.1073/pnas.0608561103 · Cited by 280
Widespread mixing and burial of Earth’s Hadean crust by asteroid impacts
Marchi, S., Bottke, W. F., Elkins-Tanton, L. T., Bierhaus, M., Wuennemann, K., Morbidelli, A., & Kring, D. A. (2014) · Nature · doi:10.1038/nature13539 · Cited by 277
Knoll, A. H., & Nowak, M. A. (2017) · Science Advances · doi:10.1126/sciadv.1603076 · Cited by 277
Zahnle, K. J. (1986) · Journal of Geophysical Research: Atmospheres · doi:10.1029/jd091id02p02819 · Cited by 276 · cited 7×
“In particular, N atoms fromN2 photolysis in the upper atmosphere can mix to lower levels and react with CH4 photolysis products to make HCN (166, 167).”
BackgroundInfluentialSelf-citationEvaporitic sediments of Early Archaean age from the Warrawoona Group, North Pole, Western Australia
BUICK, R., & DUNLOP, J. S. R. (1990) · Sedimentology · doi:10.1111/j.1365-3091.1990.tb00958.x · Cited by 273 · cited 2×
“However, three-dimensional universal stage petrography found interfacial angles diagnostic of gypsum at the original crystal faces (244), which are partially replaced by quartz and draped by quartz, so cannot show up in x-ray density contrasts.”
BackgroundA possible nitrogen crisis for Archaean life due to reduced nitrogen fixation by lightning
Navarro-González, R., McKay, C. P., & Mvondo, D. N. (2001) · Nature · doi:10.1038/35083537 · Cited by 272
Bottke, W. F., & Norman, M. D. (2017) · Annual Review of Earth and Planetary Sciences · doi:10.1146/annurev-earth-063016-020131 · Cited by 271 · cited 1×
“5 Ga ago, based on the ages of lunar rocks and meteorite shocks (24), althoughmany dispute that the LHBwas a discrete event (25).”
BackgroundMicrobial habitability of the Hadean Earth during the late heavy bombardment
Abramov, O., & Mojzsis, S. J. (2009) · Nature · doi:10.1038/nature08015 · Cited by 269
Isotopic Evidence for an Aerobic Nitrogen Cycle in the Latest Archean
Garvin, J., Buick, R., Anbar, A. D., Arnold, G. L., & Kaufman, A. J. (2009) · Science · doi:10.1126/science.1165675 · Cited by 260
No climate paradox under the faint early Sun
Rosing, M. T., Bird, D. K., Sleep, N. H., & Bjerrum, C. J. (2010) · Nature · doi:10.1038/nature08955 · Cited by 258
Anicich, V. G., & Huntress, W. T., Jr. (1986) · The Astrophysical Journal Supplement Series · doi:10.1086/191151 · Cited by 251
Paleoclimates, ocean depth, and the oxygen isotopic composition of seawater
Kasting, J. F., Howard, M. T., Wallmann, K., Veizer, J., Shields, G., & Jaffrés, J. (2006) · Earth and Planetary Science Letters · doi:10.1016/j.epsl.2006.09.029 · Cited by 248
The cycling and redox state of nitrogen in the Archaean ocean
Godfrey, L. V., & Falkowski, P. G. (2009) · Nature Geoscience · doi:10.1038/ngeo633 · Cited by 243
The nitrogen record of crust–mantle interaction and mantle convection from Archean to Present
Marty, B., & Dauphas, N. (2003) · Earth and Planetary Science Letters · doi:10.1016/s0012-821x(02)01108-1 · Cited by 242
Parallel adaptations to high temperatures in the Archaean eon
Boussau, B., Blanquart, S., Necsulea, A., Lartillot, N., & Gouy, M. (2008) · Nature · doi:10.1038/nature07393 · Cited by 242 · cited 1×
“However, other more convincing reconstructions and biochemical considerations suggest a mesophilic (<50°C) common ancestor (242, 243).”
BackgroundQuantifying the areal extent and dissolved oxygen concentrations of Archean oxygen oases
Olson, S. L., Kump, L. R., & Kasting, J. F. (2013) · Chemical Geology · doi:10.1016/j.chemgeo.2013.08.012 · Cited by 239
A bistable organic-rich atmosphere on the Neoarchaean Earth
Zerkle, A. L., Claire, M. W., Domagal-Goldman, S. D., Farquhar, J., & Poulton, S. W. (2012) · Nature Geoscience · doi:10.1038/ngeo1425 · Cited by 239
Rasmussen, B., & Buick, R. (1999) · Geology · doi:10.1130/0091-7613(1999)027<0115:rsotaa>2.3.co;2 · Cited by 238
Phosphate oxygen isotopic evidence for a temperate and biologically active Archaean ocean
Blake, R. E., Chang, S. J., & Lepland, A. (2010) · Nature · doi:10.1038/nature08952 · Cited by 230
Fluxes of volatiles (H2O, CO2, N2, Cl, F) from arc volcanoes
FISCHER, T. P. (2008) · GEOCHEMICAL JOURNAL · doi:10.2343/geochemj.42.21 · Cited by 227
Two-step rise of atmospheric oxygen linked to the growth of continents
Lee, C.-T. A., Yeung, L. Y., McKenzie, N. R., Yokoyama, Y., Ozaki, K., & Lenardic, A. (2016) · Nature Geoscience · doi:10.1038/ngeo2707 · Cited by 227
Adam, P. S., Borrel, G., & Gribaldo, S. (2018) · Proceedings of the National Academy of Sciences · doi:10.1073/pnas.1716667115 · Cited by 226
Benthic perspective on Earth’s oldest evidence for oxygenic photosynthesis
Lalonde, S. V., & Konhauser, K. O. (2015) · Proceedings of the National Academy of Sciences · doi:10.1073/pnas.1415718112 · Cited by 224
Evidence from massive siderite beds for a CO2-rich atmosphere before ~ 1.8 billion years ago
Ohmoto, H., Watanabe, Y., & Kumazawa, K. (2004) · Nature · doi:10.1038/nature02573 · Cited by 224
Johnson, B., & Goldblatt, C. (2015) · Earth-Science Reviews · doi:10.1016/j.earscirev.2015.05.006 · Cited by 224 · cited 1×
“Estimates of nitrogen bound in today’s solid Earth range a few to ~40 bar equivalent (37, 38), which allows for considerable N2 in the Hadean atmosphere unless N was incorporated into a reducing, deep layer of magma—a magma ocean—formed after the Moon-forming impact ~4.”
BackgroundAndersen, M. B., Stirling, C. H., & Weyer, S. (2017) · Reviews in Mineralogy and Geochemistry · doi:10.2138/rmg.2017.82.19 · Cited by 218
Nitrogen Isotopic Composition and Density of the Archean Atmosphere
Marty, B., Zimmermann, L., Pujol, M., Burgess, R., & Philippot, P. (2013) · Science · doi:10.1126/science.1240971 · Cited by 215
Hydrogen-Nitrogen Greenhouse Warming in Earth's Early Atmosphere
Wordsworth, R., & Pierrehumbert, R. (2013) · Science · doi:10.1126/science.1225759 · Cited by 207
Som, S. M., Catling, D. C., Harnmeijer, J. P., Polivka, P. M., & Buick, R. (2012) · Nature · doi:10.1038/nature10890 · Cited by 207 · cited 3×
“(B) Constraints on surface atmospheric pressure (red) (56, 57) and the partial pressure of nitrogen, pN2 (blue) (48, 49, 140).”
BackgroundSelf-citationThe Greenhouse and Antigreenhouse Effects on Titan
McKay, C. P., Pollack, J. B., & Courtin, R. (1991) · Science · doi:10.1126/science.11538492 · Cited by 206 · cited 1×
“However, too much CH4 relative to CO2 would create the highaltitude organic haze mentioned earlier, which may cool Earth by up to ~20 K (1, 215) by absorbing incoming solar radiation and radiating energy back to space in a so-called “anti-greenhouse effect” (216).”
BackgroundOrganic haze, glaciations and multiple sulfur isotopes in the Mid-Archean Era
Domagal-Goldman, S. D., Kasting, J. F., Johnston, D. T., & Farquhar, J. (2008) · Earth and Planetary Science Letters · doi:10.1016/j.epsl.2008.01.040 · Cited by 204 · cited 1×
“gases persisted and polymerized into S8 (44, 60).”
BackgroundOhmoto, H., Rasmussen, B., Buick, R., & Holland, H. D. (1999) · Geology · doi:10.1130/0091-7613(1999)027<1151:rsotaa>2.3.co;2 · Cited by 200
Biogeochemical modelling of the rise in atmospheric oxygen
CLAIRE, M. W., CATLING, D. C., & ZAHNLE, K. J. (2006) · Geobiology · doi:10.1111/j.1472-4669.2006.00084.x · Cited by 200 · cited 4×
“Some emphasize the role of hydrogen escape to space in oxidizing solid Earth, lowering Earth’s capacity to release O2-consuming reductants (121, 135, 136).”
BackgroundMethodInfluentialSelf-citationDeep magma ocean formation set the oxidation state of Earth’s mantle
Armstrong, K., Frost, D. J., McCammon, C. A., Rubie, D. C., & Boffa Ballaran, T. (2019) · Science · doi:10.1126/science.aax8376 · Cited by 197
Cartigny, P., & Marty, B. (2013) · Elements · doi:10.2113/gselements.9.5.359 · Cited by 192 · cited 1×
“Sedimentary organics have d(15)N = 7 ± 1‰ compared to 0‰ in N2 in modern and ancient air and − 5 ± 2‰ in the mantle (151, 152).”
BackgroundWhy the atmosphere became oxygenated: A proposal
Holland, H. D. (2009) · Geochimica et Cosmochimica Acta · doi:10.1016/j.gca.2009.05.070 · Cited by 191
Young, G. M., Brunn, V. V., Gold, D. J. C., & Minter, W. E. L. (1998) · The Journal of Geology · doi:10.1086/516039 · Cited by 189
Evidence for biogenic graphite in early Archaean Isua metasedimentary rocks
Ohtomo, Y., Kakegawa, T., Ishida, A., Nagase, T., & Rosing, M. T. (2014) · Nature Geoscience · doi:10.1038/ngeo2025 · Cited by 187 · cited 1×
“7-Ga-old outcrop of sedimentary rock is (12)C-enriched in amounts typical of photosynthetic microbes (88, 89).”
BackgroundOxygen and hydrogen isotope evidence for a temperate climate 3.42 billion years ago
Hren, M. T., Tice, M. M., & Chamberlain, C. P. (2009) · Nature · doi:10.1038/nature08518 · Cited by 186 · cited 1×
“CombinedO andH isotope ratios have suggested surface temperatures <40°C (52), while O isotopes in Archean phosphates have produced 26° to 35°C upper limits (53).”
BackgroundNitrogen speciation in upper mantle fluids and the origin of Earth's nitrogen-rich atmosphere
Mikhail, S., & Sverjensky, D. A. (2014) · Nature Geoscience · doi:10.1038/ngeo2271 · Cited by 185
Krissansen-Totton, J., Buick, R., & Catling, D. C. (2015) · American Journal of Science · doi:10.2475/04.2015.01 · Cited by 180 · cited 15×
“C. Scott, T. W. Lyons, A. Bekker, Y. Shen, S. W. Poulton, X. Chu, A. D. Anbar, Tracing the stepwise oxygenation of the Proterozoic ocean.”
BackgroundInfluentialSelf-citationDisequilibrium biosignatures over Earth history and implications for detecting exoplanet life
Krissansen-Totton, J., Olson, S., & Catling, D. C. (2018) · Science Advances · doi:10.1126/sciadv.aao5747 · Cited by 177 · cited 1×
“So, determiningwhat theArchean atmosphere was made of, and the influence of life, could help us distinguish biogenic gases in exoplanet atmospheres and so find life elsewhere (2, 250).”
BackgroundSelf-citationStrange messenger: a new history of hydrogen on Earth, as told by xenon
Zahnle, K. J., Gacesa, M., & Catling, D. C. (2019) · Geochimica et Cosmochimica Acta · doi:10.1016/j.gca.2018.09.017 · Cited by 175
Self-citationEarth's air pressure 2.7 billion years ago constrained to less than half of modern levels
Som, S. M., Buick, R., Hagadorn, J. W., Blake, T. S., Perreault, J. M., Harnmeijer, J. P., & Catling, D. C. (2016) · Nature Geoscience · doi:10.1038/ngeo2713 · Cited by 173
Self-citationFractal Organic Hazes Provided an Ultraviolet Shield for Early Earth
Wolf, E. T., & Toon, O. B. (2010) · Science · doi:10.1126/science.1183260 · Cited by 172
Morphological record of oxygenic photosynthesis in conical stromatolites
Bosak, T., Liang, B., Sim, M. S., & Petroff, A. P. (2009) · Proceedings of the National Academy of Sciences · doi:10.1073/pnas.0900885106 · Cited by 166
Daines, S. J., Mills, B. J. W., & Lenton, T. M. (2017) · Nature Communications · doi:10.1038/ncomms14379 · Cited by 166
Sulfur, ultraviolet radiation, and the early evolution of life
Kasting, J. F., Zahnle, K. J., Pinto, J. P., & Young, A. T. (1989) · Origins of life and evolution of the biosphere · doi:10.1007/bf01808144 · Cited by 164
Self-citationMesoproterozoic carbon dioxide levels inferred from calcified cyanobacteria
Kah, L. C., & Riding, R. (2007) · Geology · doi:10.1130/g23680a.1 · Cited by 163
Isotope composition and volume of Earth’s early oceans
Pope, E. C., Bird, D. K., & Rosing, M. T. (2012) · Proceedings of the National Academy of Sciences · doi:10.1073/pnas.1115705109 · Cited by 160
Horizontal gene transfer constrains the timing of methanogen evolution
Wolfe, J. M., & Fournier, G. P. (2018) · Nature Ecology & Evolution · doi:10.1038/s41559-018-0513-7 · Cited by 160 · cited 1×
“Hydrogen abundance The Archean lower atmosphere is unlikely to have been H2-rich given the antiquity of methanogens (23, 51, 197), some of which convert H2 into methane through a net reaction”
BackgroundMicrobial life and biogeochemical cycling on land 3,220 million years ago
Homann, M., Sansjofre, P., Van Zuilen, M., Heubeck, C., Gong, J., Killingsworth, B., Foster, I. S., Airo, A., Van Kranendonk, M. J., Ader, M., et al. (2018) · Nature Geoscience · doi:10.1038/s41561-018-0190-9 · Cited by 159
Marin-Carbonne, J., Robert, F., & Chaussidon, M. (2014) · Precambrian Research · doi:10.1016/j.precamres.2014.03.016 · Cited by 157
Driese, S. G., Jirsa, M. A., Ren, M., Brantley, S. L., Sheldon, N. D., Parker, D., & Schmitz, M. (2011) · Precambrian Research · doi:10.1016/j.precamres.2011.04.003 · Cited by 155
O2constraints from Paleoproterozoic detrital pyrite and uraninite
Johnson, J. E., Gerpheide, A., Lamb, M. P., & Fischer, W. W. (2014) · Geological Society of America Bulletin · doi:10.1130/b30949.1 · Cited by 154
A redox-stratified ocean 3.2 billion years ago
Satkoski, A. M., Beukes, N. J., Li, W., Beard, B. L., & Johnson, C. M. (2015) · Earth and Planetary Science Letters · doi:10.1016/j.epsl.2015.08.007 · Cited by 152
Chemical effects of large impacts on the Earth's primitive atmosphere
Fegley, B., Prinn, R. G., Hartman, H., & Watkins, G. H. (1986) · Nature · doi:10.1038/319305a0 · Cited by 152
Photochemistry of methane in the Earth's early atmosphere
Kasting, J. F., Zahnle, K. J., & Walker, J. C. G. (1983) · Precambrian Research · doi:10.1016/0301-9268(83)90069-4 · Cited by 150
Self-citationAn iodine record of Paleoproterozoic surface ocean oxygenation
Hardisty, D. S., Lu, Z., Planavsky, N. J., Bekker, A., Philippot, P., Zhou, X., & Lyons, T. W. (2014) · Geology · doi:10.1130/g35439.1 · Cited by 150
A lower limit for atmospheric carbon dioxide levels 3.2 billion years ago
Hessler, A. M., Lowe, D. R., Jones, R. L., & Bird, D. K. (2004) · Nature · doi:10.1038/nature02471 · Cited by 148
A hydrogen-based oxidation mechanism relevant to planetary formation
Sharp, Z. D., McCubbin, F. M., & Shearer, C. K. (2013) · Earth and Planetary Science Letters · doi:10.1016/j.epsl.2013.08.015 · Cited by 147 · cited 1×
“Therefore, the Hadean atmosphere and mantle were probably initially highly reducing, before subsequent oxidation either by hydrogen escape (29) or disproportionation of mantle FeO accompanied by Fe loss to the core (30, 31).”
BackgroundImpact spherules as a record of an ancient heavy bombardment of Earth
Johnson, B. C., & Melosh, H. J. (2012) · Nature · doi:10.1038/nature10982 · Cited by 147 · cited 1×
“The lunar record implies a decay of terrestrial impact bombardment extending into the Archean (20, 21).”
BackgroundKrissansen-Totton, J., Garland, R., Irwin, P., & Catling, D. C. (2018) · The Astronomical Journal · doi:10.3847/1538-3881/aad564 · Cited by 145
Self-citationWhat caused the rise of atmospheric O2?
Kasting, J. F. (2013) · Chemical Geology · doi:10.1016/j.chemgeo.2013.05.039 · Cited by 144
Ueno, Y., Johnson, M. S., Danielache, S. O., Eskebjerg, C., Pandey, A., & Yoshida, N. (2009) · Proceedings of the National Academy of Sciences · doi:10.1073/pnas.0903518106 · Cited by 144
Exploring the faint young Sun problem and the possible climates of the Archean Earth with a 3‐D GCM
Charnay, B., Forget, F., Wordsworth, R., Leconte, J., Millour, E., Codron, F., & Spiga, A. (2013) · Journal of Geophysical Research: Atmospheres · doi:10.1002/jgrd.50808 · Cited by 144
Cataclysm No More: New Views on the Timing and Delivery of Lunar Impactors
Zellner, N. E. B. (2017) · Origins of Life and Evolution of Biospheres · doi:10.1007/s11084-017-9536-3 · Cited by 144
Early Archean origin of Photosystem II
Cardona, T., Sánchez‐Baracaldo, P., Rutherford, A. W., & Larkum, A. W. (2019) · Geobiology · doi:10.1111/gbi.12322 · Cited by 144
Hospitable Archean Climates Simulated by a General Circulation Model
Wolf, E. T., & Toon, O. B. (2013) · Astrobiology · doi:10.1089/ast.2012.0936 · Cited by 143 · cited 2×
“In general, a fasterArchean rotation rate reduces heat transport from equator to pole (212, 213), particularly if the atmosphere had less mass (248).”
BackgroundRevisiting HCN formation in Earth's early atmosphere
Tian, F., Kasting, J. F., & Zahnle, K. (2011) · Earth and Planetary Science Letters · doi:10.1016/j.epsl.2011.06.011 · Cited by 143
Self-citationHomann, M., Heubeck, C., Airo, A., & Tice, M. M. (2015) · Precambrian Research · doi:10.1016/j.precamres.2015.04.018 · Cited by 141
Nakamura, K., & Kato, Y. (2004) · Geochimica et Cosmochimica Acta · doi:10.1016/j.gca.2004.05.023 · Cited by 141
Stability of ammonia in the primitive terrestrial atmosphere
Kasting, J. F. (1982) · Journal of Geophysical Research: Oceans · doi:10.1029/jc087ic04p03091 · Cited by 140 · cited 1×
“2020;6 : eaax1420 26 February 2020 Ammonia (NH3) levels of 10 to 100 ppmv would provide a greenhouse effect to counteract the faint young Sun (FYS) (14), but these levels ofNH3 cannot be sustained againstUVphotolysis (161).”
BackgroundContributions to late Archaean sulphur cycling by life on land
Stüeken, E. E., Catling, D. C., & Buick, R. (2012) · Nature Geoscience · doi:10.1038/ngeo1585 · Cited by 137
Self-citationEvolution of atmospheric xenon and other noble gases inferred from Archean to Paleoproterozoic rocks
Avice, G., Marty, B., Burgess, R., Hofmann, A., Philippot, P., Zahnle, K., & Zakharov, D. (2018) · Geochimica et Cosmochimica Acta · doi:10.1016/j.gca.2018.04.018 · Cited by 136 · cited 15×
“Negligible Archean O2 but oxygen oases after oxygenic photosynthesis evolved The strongest constraint on Archean atmospheric composition is that the ground-level mixing ratio of O2 was 10 −6 PAL (present atmospheric level) or 0.2–parts per million by volume (ppmv) O2 for air of 1 bar, indicated by the presence of sulf…”
BackgroundMethodInfluentialSelf-citationSolar Interior Structure and Luminosity Variations
Gough, D. O. (1981) · Springer eBooks · doi:10.1007/978-94-010-9633-1_4 · Cited by 134
Identification of an Archean marine oxygen oasis
Riding, R., Fralick, P., & Liang, L. (2014) · Precambrian Research · doi:10.1016/j.precamres.2014.06.017 · Cited by 132 · cited 1×
“52 Ga ago onward [(98) and references therein].”
BackgroundEarly Archaean tectonics and mantle redox recorded in Witwatersrand diamonds
Smart, K. A., Tappe, S., Stern, R. A., Webb, S. J., & Ashwal, L. D. (2016) · Nature Geoscience · doi:10.1038/ngeo2628 · Cited by 131 · cited 1×
“5 Ga-old mantle-derived diamonds may be a sedimentary component (153).”
BackgroundLow-Temperature Alteration of the Seafloor: Impacts on Ocean Chemistry
Coogan, L. A., & Gillis, K. M. (2018) · Annual Review of Earth and Planetary Sciences · doi:10.1146/annurev-earth-082517-010027 · Cited by 129
Oxygen isotope composition of the Phanerozoic ocean and a possible solution to the dolomite problem
Ryb, U., & Eiler, J. M. (2018) · Proceedings of the National Academy of Sciences · doi:10.1073/pnas.1719681115 · Cited by 129
The geologic history of seawater oxygen isotopes from marine iron oxides
Galili, N., Shemesh, A., Yam, R., Brailovsky, I., Sela-Adler, M., Schuster, E. M., Collom, C., Bekker, A., Planavsky, N., Macdonald, F. A., et al. (2019) · Science · doi:10.1126/science.aaw9247 · Cited by 128
Cather, S. M., Dunbar, N., McDowell, F. W., McIntosh, W. C., & Scholle, P. A. (2009) · Geosphere · doi:10.1130/ges00188.1 · Cited by 125
Oxidant abundances in rainwater and the evolution of atmospheric oxygen
Kasting, J. F., Holland, H. D., & Pinto, J. P. (1985) · Journal of Geophysical Research Atmospheres · doi:10.1029/jd090id06p10497 · Cited by 123
Cu isotopes in marine black shales record the Great Oxidation Event
Chi Fru, E., Rodríguez, N. P., Partin, C. A., Lalonde, S. V., Andersson, P., Weiss, D. J., El Albani, A., Rodushkin, I., & Konhauser, K. O. (2016) · Proceedings of the National Academy of Sciences · doi:10.1073/pnas.1523544113 · Cited by 123
Isotopic evidence for oxygenated Mesoarchaean shallow oceans
Eickmann, B., Hofmann, A., Wille, M., Bui, T. H., Wing, B. A., & Schoenberg, R. (2018) · Nature Geoscience · doi:10.1038/s41561-017-0036-x · Cited by 123
Planets and life : the emerging science of astrobiology
Sullivan, W. T., & Baross, J. A. (2007) · Cited by 122
Timescales of Oxygenation Following the Evolution of Oxygenic Photosynthesis
Ward, L. M., Kirschvink, J. L., & Fischer, W. W. (2015) · Origins of Life and Evolution of Biospheres · doi:10.1007/s11084-015-9460-3 · Cited by 119
Ono, S. (2017) · Annual Review of Earth and Planetary Sciences · doi:10.1146/annurev-earth-060115-012324 · Cited by 119 · cited 2×
“2020;6 : eaax1420 26 February 2020 that dominantly imparted S-MIF are debated: They include polysulfur formation (61), SO2 photolysis, and other reactions (46, 59).”
BackgroundEhlert, C., Doering, K., Wallmann, K., Scholz, F., Sommer, S., Grasse, P., Geilert, S., & Frank, M. (2016) · Geochimica et Cosmochimica Acta · doi:10.1016/j.gca.2016.07.022 · Cited by 118 · cited 1×
“Estimates of today’s RW flux (mol Si/year) vary an order of magnitude (177, 178), the rate coefficient for RW reactions varies by many orders of magnitude (179, 180), and the solubility of authigenic phyllosilicates (needed to calculate RW) varies by over an order of magnitude.”
BackgroundThe Pale Orange Dot: The Spectrum and Habitability of Hazy Archean Earth
Arney, G., Domagal-Goldman, S. D., Meadows, V., Wolf, E. T., Schwieterman, E. W., Charnay, B., Claire, M. W., Hébrard, É., & Trainer, M. G. (2025) · Figshare · Cited by 117
Hoffman, P. F. (2013) · Chemical Geology · doi:10.1016/j.chemgeo.2013.04.018 · Cited by 116 · cited 1×
“, (188)] provide circumstantial evidence for high Archean CH4.”
Background9. Noble Gases and Volatile Recycling at Subduction Zones
Hilton, D. R., Fischer, T. P., & Marty, B. M. (2002) · De Gruyter eBooks · doi:10.1515/9781501509056-011 · Cited by 114
Archean tufted microbial mats and the Great Oxidation Event: new insights into an ancient problem
Flannery, D. T., & Walter, M. R. (2012) · Australian Journal of Earth Sciences · doi:10.1080/08120099.2011.607849 · Cited by 113
Sackmann, I. ‐., & Boothroyd, A. I. (2003) · The Astrophysical Journal · doi:10.1086/345408 · Cited by 113
Extinction of Cloudina and Namacalathus at the Precambrian-Cambrian boundary in Oman
(2003) · doi:10.1130/0091-7613(2003)031 · Cited by 113
Anicich, V. G. (1993) · The Astrophysical Journal Supplement Series · doi:10.1086/191752 · Cited by 112
The regulation of carbon dioxide and climate: Gaia or geochemistry
Lovelock, J. E., & Watson, A. J. (1982) · Planetary and Space Science · doi:10.1016/0032-0633(82)90112-x · Cited by 109
A Coupled Ecosystem-Climate Model for Predicting the Methane Concentration in the Archean Atmosphere
Kasting, J. F., Pavlov, A. A., & Siefert, J. L. (2001) · Origins of Life and Evolution of Biospheres · doi:10.1023/a:1010600401718 · Cited by 108
Geochemical Weathering in Glacial and Proglacial Environments
Tranter, M., & Wadham, J. L. (2013) · Elsevier eBooks · doi:10.1016/b978-0-08-095975-7.00505-2 · Cited by 108
Modeling the signature of sulfur mass-independent fractionation produced in the Archean atmosphere
Claire, M. W., Kasting, J. F., Domagal-Goldman, S. D., Stüeken, E. E., Buick, R., & Meadows, V. S. (2014) · Geochimica et Cosmochimica Acta · doi:10.1016/j.gca.2014.06.032 · Cited by 108 · cited 2×
“However, in the absence of an ozone shield, OCS is susceptible to photolysis and cannot build up significantly (46).”
BackgroundThe Missing Silica Sink: Revisiting the Marine Sedimentary Si Cycle Using Cosmogenic 32 Si
Rahman, S., Aller, R. C., & Cochran, J. K. (2017) · Global Biogeochemical Cycles · doi:10.1002/2017gb005746 · Cited by 108
Hydrogen Consumption by Methanogens on the Early Earth
Kral, T. A., Brink, K. M., Miller, S. L., & McKay, C. P. (1998) · Origins of life and evolution of the biosphere · doi:10.1023/a:1006552412928 · Cited by 107
Sackmann, I. ‐., & Boothroyd, A. I. (2002) · NASA Technical Reports Server (NASA) · Cited by 107
Estimates of atmospheric CO2 in the Neoarchean–Paleoproterozoic from paleosols
Kanzaki, Y., & Murakami, T. (2015) · Geochimica et Cosmochimica Acta · doi:10.1016/j.gca.2015.03.011 · Cited by 106
Limited role for methane in the mid-Proterozoic greenhouse
Olson, S. L., Reinhard, C. T., & Lyons, T. W. (2016) · Proceedings of the National Academy of Sciences · doi:10.1073/pnas.1608549113 · Cited by 103
Albut, G., Babechuk, M. G., Kleinhanns, I. C., Benger, M., Beukes, N. J., Steinhilber, B., Smith, A. J. B., Kruger, S. J., & Schoenberg, R. (2018) · Geochimica et Cosmochimica Acta · doi:10.1016/j.gca.2018.02.034 · Cited by 103
The terrestrial late veneer from core disruption of a lunar-sized impactor
Genda, H., Brasser, R., & Mojzsis, S. J. (2017) · Earth and Planetary Science Letters · doi:10.1016/j.epsl.2017.09.041 · Cited by 102 · cited 1×
“In any case, iron-cored impactors would reduce seawater to hydrogen and create transient, highly reducing atmospheres that may have been important for the origin of life (32, 33).”
BackgroundMultiple oscillations in Neoarchaean atmospheric chemistry
Izon, G., Zerkle, A. L., Zhelezinskaia, I., Farquhar, J., Newton, R. J., Poulton, S. W., Eigenbrode, J. L., & Claire, M. W. (2015) · Earth and Planetary Science Letters · doi:10.1016/j.epsl.2015.09.018 · Cited by 99
Exploring the faint young Sun problem and the possible climates of the Archean Earth with a 3-D GCMPreprint
Charnay, B., Forget, F., Wordsworth, R., Leconte, J., Millour, E., Codron, F., & Spiga, A. (2013) · Cited by 99
Harrison, T. M., Bell, E. A., & Boehnke, P. (2017) · Reviews in Mineralogy and Geochemistry · doi:10.2138/rmg.2017.83.11 · Cited by 97
Papineau, D., Mojzsis, S. J., Karhu, J. A., & Marty, B. (2005) · Chemical Geology · doi:10.1016/j.chemgeo.2004.10.009 · Cited by 95
Methane and the CH4 related greenhouse effect over the past 400 million years
Beerling, D. J., Berner, R. A., Mackenzie, F. T., Harfoot, M., & Pyle, J. A. (2009) · American Journal of Science · doi:10.2475/02.2009.01 · Cited by 95
A theory of atmospheric oxygen
Laakso, T. A., & Schrag, D. P. (2017) · Geobiology · doi:10.1111/gbi.12230 · Cited by 93 · cited 1×
“Briefly, ideas favoring increased O2 fluxes from organic burial appeal to more continental shelf area available for burial (126), more phosphorus to stimulate photosynthesis (127, 128), or subduction of organic carbon relative to ferric iron (129).”
BackgroundShibuya, T., Yoshizaki, M., Masaki, Y., Suzuki, K., Takai, K., & Russell, M. J. (2013) · Chemical Geology · doi:10.1016/j.chemgeo.2013.08.044 · Cited by 91 · cited 1×
“Gases reacted with the seafloor or land, leaving chemical traces in seafloor minerals (40, 41) or in soils that became paleosols (42, 43).”
BackgroundSelenium isotopes support free O2 in the latest Archean
Stüeken, E. E., Buick, R., & Anbar, A. D. (2015) · Geology · doi:10.1130/g36218.1 · Cited by 90
Gaschnig, R. M., Rudnick, R. L., McDonough, W. F., Kaufman, A. J., Hu, Z., & Gao, S. (2014) · Earth and Planetary Science Letters · doi:10.1016/j.epsl.2014.10.002 · Cited by 89
Halevy, I. (2013) · Proceedings of the National Academy of Sciences · doi:10.1073/pnas.1213148110 · Cited by 89 · cited 1×
“In any case, when S8 particles fell to Earth’s surface, their S-MIF isotopic composition complemented that of sulfate particles, allowing preservation of different S-MIF signs in these phases as sedimentary pyrite (FeS2) and barite (BaSO4) (62).”
Background
Research works printed but not linked: 8
- D. C. Catling in Treatise on Geochemistry H. D. Holland K. K. Turekian Eds. (Elsevier 2014) vol. 8 pp. 191–233.
- K. J. Zahnle D. C. Catling in Special Paper 504: Early Earth's Atmosphere and Surface Environment G. H. Shaw Ed. (Geological Soc. of America 2014) pp. 37–48.
- J. F. Kasting in Special Paper 504: Early Earth’s Atmosphere and Surface Environment G. H. Shaw Ed. (Geological Society of America 2014) pp. 19–28.
- N. J. Page in Earth’s Pre-Pleistocene Glacial Record M. J. Hambrey N. B. Harland Eds. (Cambridge Univ. Press 1981) pp. 821–823.
- R. T. Gregory in Stable Isotope Geochemistry: A Tribute to Samuel Epstein H. P. Taylor J. R. O'Neil I. R. Kaplan Eds. (Min. Soc. America 1991) pp. 65–76.
- A. Knoll in The Cyanobacteria: Molecular Biology Genetics and Evolution A. Herrero E. Flores Eds. (Caister Academic Press 2008) pp. 1–19.
- D. C. Catling, K. J. Zahnle, C. P. McKay, What caused the second rise of O2 in the late Proterozoic? Methane, sulfate. and irreversible oxidation. Astrobiology 2, 569 (2002).
- J. W. Murray K. Stewart S. Kassakian M. Krynytzky D. DiJulio in The Black Sea Flood Question: Changes in Coastline Climate and Human Settlement V. Yanko-Hombach A. S. Gilbert N. Panin P. M. Dolukhanov Eds. (Springer Netherlands 2007) pp. 1–21.
Cited by
Secular Evolution of Continents and the Earth System
Cawood, P. A., Chowdhury, P., Mulder, J. A., Hawkesworth, C. J., Capitanio, F. A., Gunawardana, P. M., & Nebel, O. (2022) · Reviews of Geophysics · doi:10.1029/2022rg000789 · Cited by 265
Solar energy conversion by photosystem II: principles and structures
Shevela, D., Kern, J. F., Govindjee, G., & Messinger, J. (2023) · Photosynthesis Research · doi:10.1007/s11120-022-00991-y · Cited by 194
“Current estimates range from ~ 3.5 billion years ago (or even earlier) to the time points close to the GOE (Farquhar et al.”
BackgroundInfluentialSignatures of early microbial life from the Archean (4 to 2.5 Ga) eon
Lepot, K. (2020) · Earth-Science Reviews · doi:10.1016/j.earscirev.2020.103296 · Cited by 179
“…activity through hydrothermal fluid and volcanic emissions and their transformation products, as well as the alteration of the early crust (or proto-crust) before and during the Archean (Huston and Logan, 2004; Kump and Barley, 2007; Arndt and Nisbet, 2012; Kasting, 2019; Catling and Zahnle, 2020).”
InfluentialThe Great Oxidation Event preceded a Paleoproterozoic “snowball Earth”
Warke, M. R., Di Rocco, T., Zerkle, A. L., Lepland, A., Prave, A. R., Martin, A. P., Ueno, Y., Condon, D. J., & Claire, M. W. (2020) · Proceedings of the National Academy of Sciences · doi:10.1073/pnas.2003090117 · Cited by 159
Day–night cloud asymmetry prevents early oceans on Venus but not on Earth
Turbet, M., Bolmont, É., Chaverot, G., Ehrenreich, D., Leconte, J., & Marcq, E. (2021) · Nature · doi:10.1038/s41586-021-03873-w · Cited by 176
Metadata
- Authors
- Catling, D. C., & Zahnle, K. J.
- Affiliations
- University of Washington (US)
- Ames Research Center (US)
- Corresponding author
- Catling, David C.
- Venue
- Science Advances
- Published
- 2020-02-28
- Volume
- 6
- Issue
- 9
- Pages
- eaax1420-eaax1420
- ISSN
- 2375-2548 (ISSN-L)
- PMC
- PMC7043912
- OpenAlex
- W3007909729
- Cited by
- 568
- References
- 278
- Citations by year
- 2026: 98 · 2025: 104 · 2024: 95 · 2023: 96 · 2022: 84 · 2021: 59 · 2020: 32
- FWCI
- 8.70
- Type
- journal article
- Language
- en
- Open access
- gold
- doi.org
- Licence
- cc-by
- Locations
- Science Advances (publishedVersion, cc-by)
- Europe PMC (PubMed Central) (publishedVersion, cc-by)
- PubMed Central (publishedVersion, cc-by)
- PubMed (publishedVersion)
- Funders
- National Science Foundation (1338810)
- Simons Foundation (511570)
- NASA Astrobiology Institute (NNA13AA93A, 80NSSC18K0829)
- Leverhulme Trust (VP2-2016-041)
- NASA Exobiology (NNX15AL23G)
- Topics
- Physical Sciences › Earth and Planetary Sciences › Paleontology › Paleontology and Stratigraphy of Fossils
- Physical Sciences › Earth and Planetary Sciences › Geochemistry and Petrology › Geological and Geochemical Analysis
- Physical Sciences › Earth and Planetary Sciences › Space and Planetary Science › Astro and Planetary Science
- Keywords
- Archean atmosphere, greenhouse gases, carbon cycle, surface temperature, glaciation, atmospheric xenon, hydrogen escape, atmospheric oxygenation, early Earth climate
About these checks
Registry, retraction, Cites and statistics results are computed, not judged, with one exception: a printed reference that no index lists is read once by a model before it counts as a citation error. Claims are extracted by a model and kept only when their quote appears verbatim in the text; each cited source is then checked, with a model’s help, for whether it says what the claim relies on. Those verdicts can be wrong — read the claim’s quote and the cited source before relying on one.
The claim verdicts this report counts are experimental: their accuracy is not yet measured.
A language model drew the claims from the paper on 2026-10-10, under version 3 of the claim definition (model deepseek-v4.1-flash, prompt extract-v3).
A second model labelled each claim on 2026-10-10 (model jev-1.13-20260917, definition revision gold-guideline-v0.2).
Cited sources are checked with a language model’s help (gpt-6-sol).
Statistics and arithmetic are recomputed, not judged.
Confidence bands are shown only for fields calibrated on our annotated test set. None is calibrated yet, so no band is shown.
What counts as a claim ›How we measure confidence ›How we check this ›
Are you an author, or do you see a problem with this page? Request a review
Data sources
Bibliographic data: Semantic Scholar, OpenAlex, Crossref.
Contains information from the Semantic Scholar Academic Graph Datasets, made available under the ODC Attribution License (ODC-BY 1.0).
Semantic Scholar’s data is described in: Kinney, R., et al. (2023). The Semantic Scholar Open Data Platform. arXiv:2301.10140.
