

The DOI matches its Crossref record; 1,858 of the 1,862 references it cites were found in a registry or an index.
Recent advances in 2D and 3D in vitro systems using primary hepatocytes, alternative hepatocyte sources and non-parenchymal liver cells and their use in investigating mechanisms of hepatotoxicity, cell signaling and ADME
Open accessAbstract
This review encompasses the most important advances in liver functions and hepatotoxicity and analyzes which mechanisms can be studied in vitro. In a complex architecture of nested, zonated lobules, the liver consists of approximately 80 % hepatocytes and 20 % non-parenchymal cells, the latter being involved in a secondary phase that may dramatically aggravate the initial damage. Hepatotoxicity, as well as hepatic metabolism, is controlled by a set of nuclear receptors (including PXR, CAR, HNF-4α, FXR, LXR, SHP, VDR and PPAR) and signaling pathways. When isolating liver cells, some pathways are activated, e.g., the RAS/MEK/ERK pathway, whereas others are silenced (e.g. HNF-4α), resulting in up- and downregulation of hundreds of genes. An understanding of these changes is crucial for a correct interpretation of in vitro data. The possibilities and limitations of the most useful liver in vitro systems are summarized, including three-dimensional culture techniques, co-cultures with non-parenchymal cells, hepatospheres, precision cut liver slices and the isolated perfused liver. Also discussed is how closely hepatoma, stem cell and iPS cell-derived hepatocyte-like-cells resemble real hepatocytes. Finally, a summary is given of the state of the art of liver in vitro and mathematical modeling systems that are currently used in the pharmaceutical industry with an emphasis on drug metabolism, prediction of clearance, drug interaction, transporter studies and hepatotoxicity. One key message is that despite our enthusiasm for in vitro systems, we must never lose sight of the in vivo situation. Although hepatocytes have been isolated for decades, the hunt for relevant alternative systems has only just begun.
Overview
The claims and statistics of this paper haven’t been checked yet.
Run the check — free, no account needed. It reads the open-access text and checks the sources it cites.
Integrity signals
Registry
Cites
Statistics
Figures
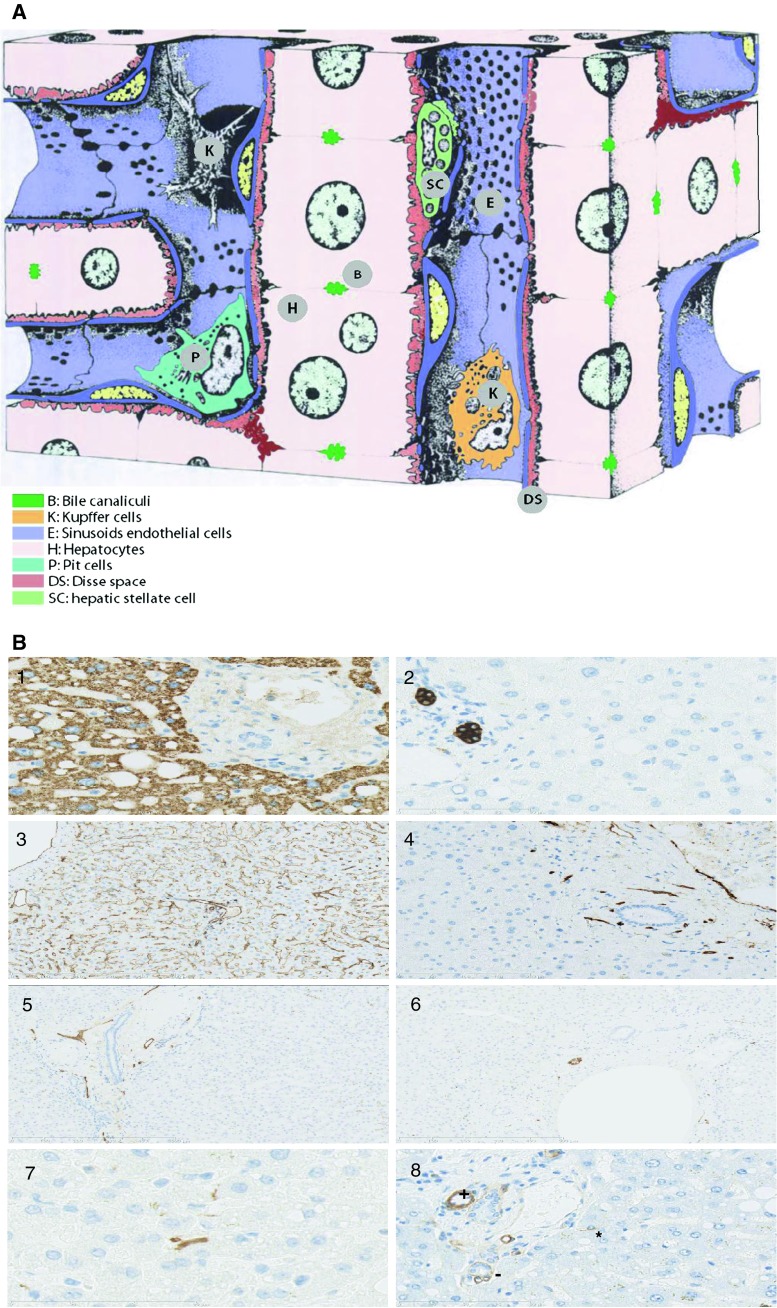
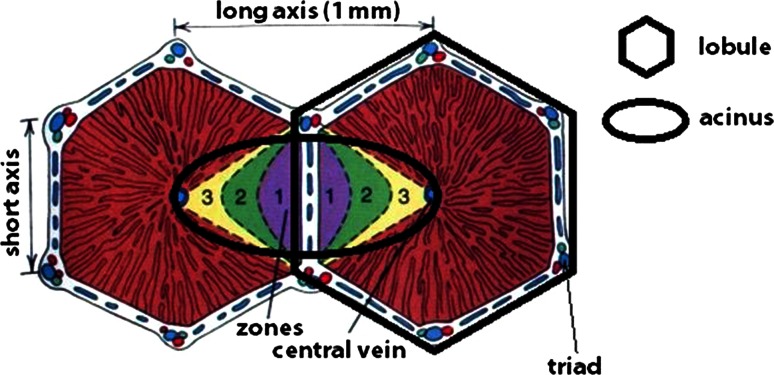
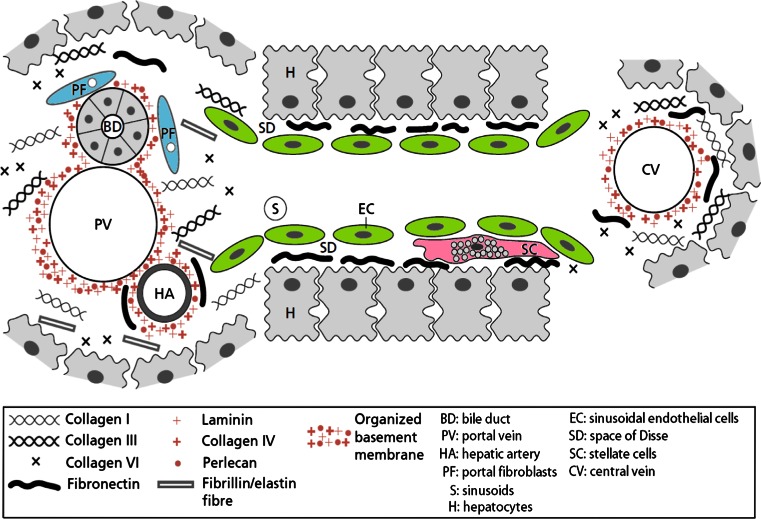
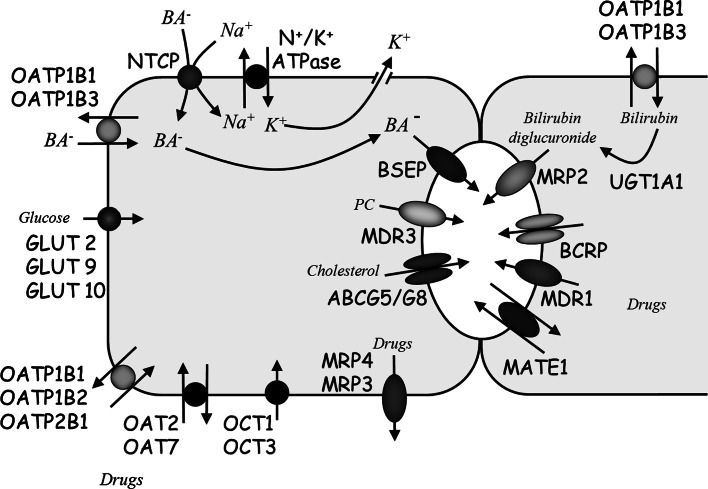
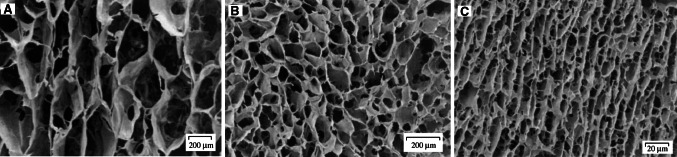
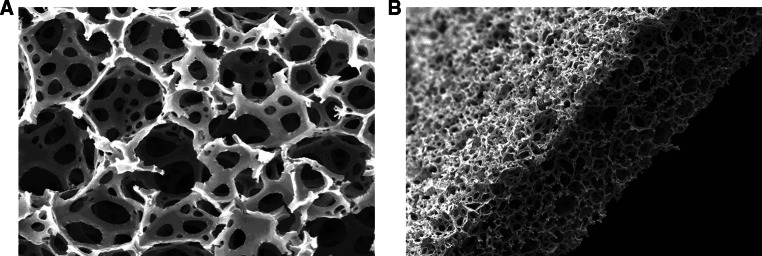
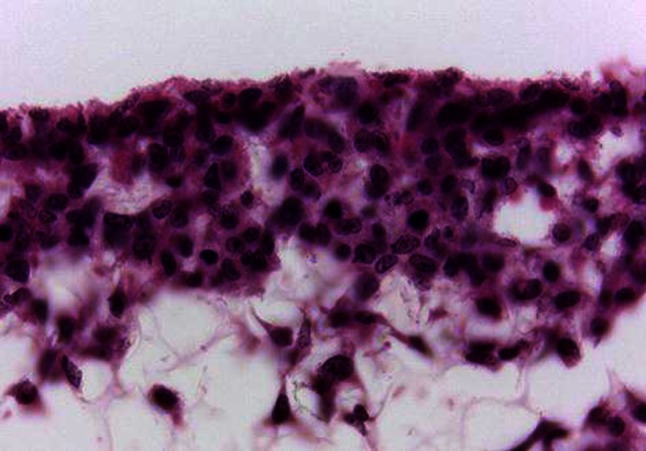
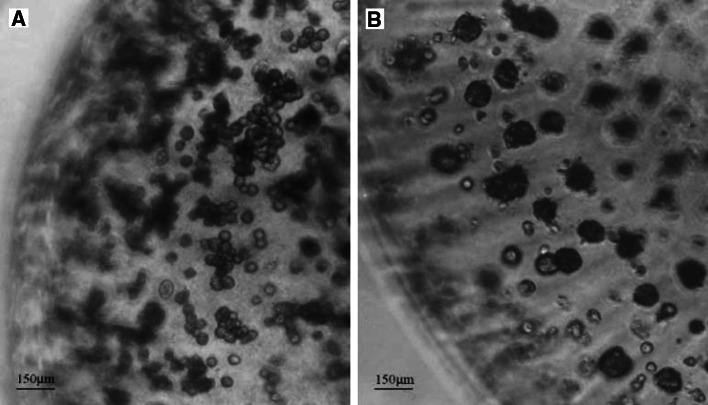
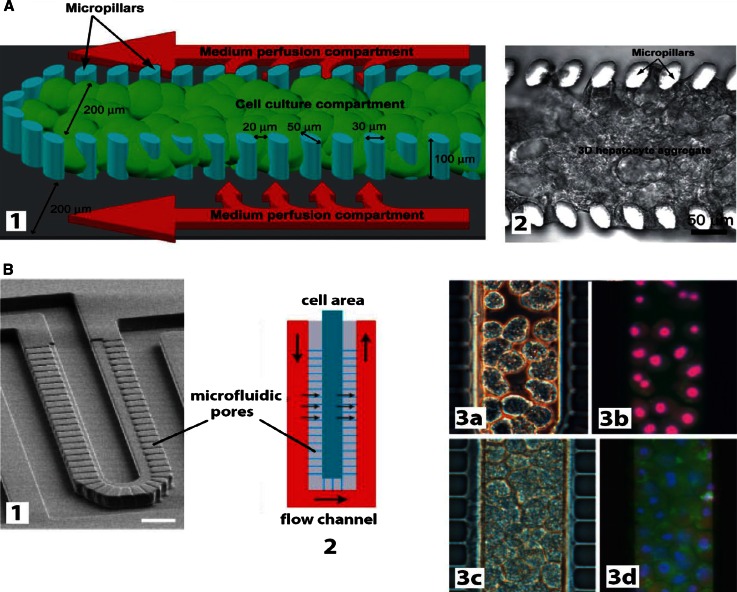
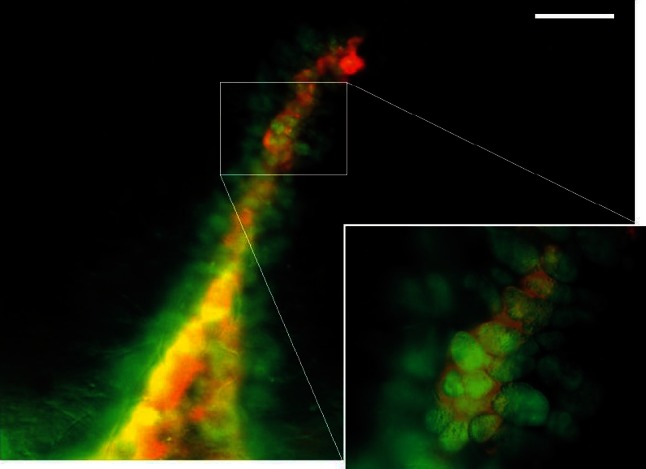
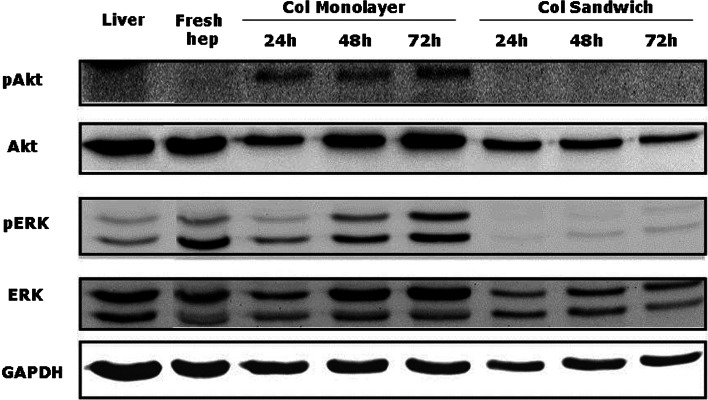
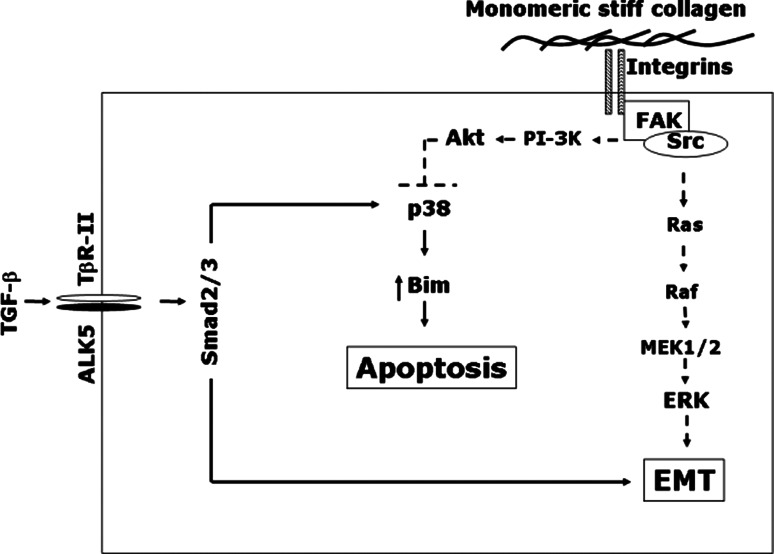
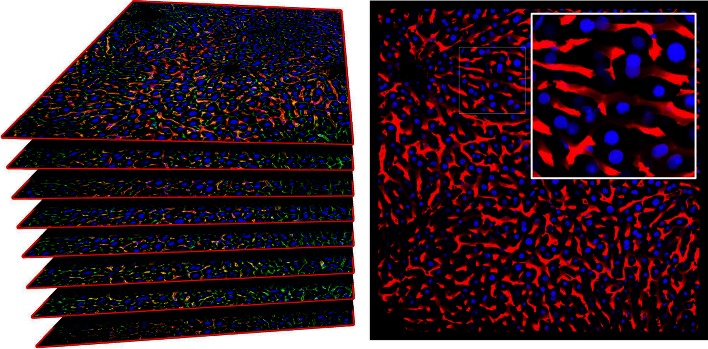
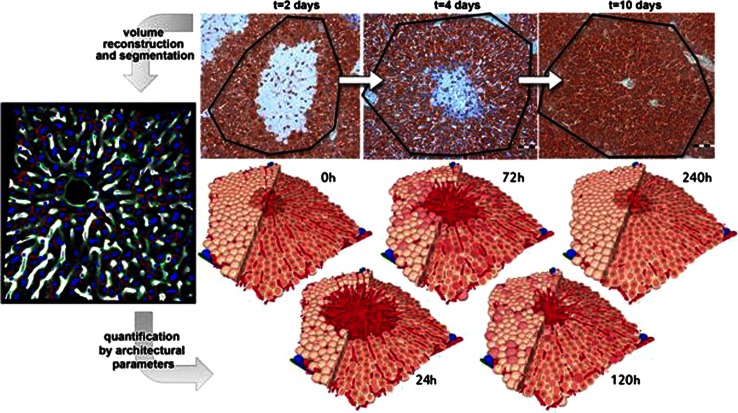
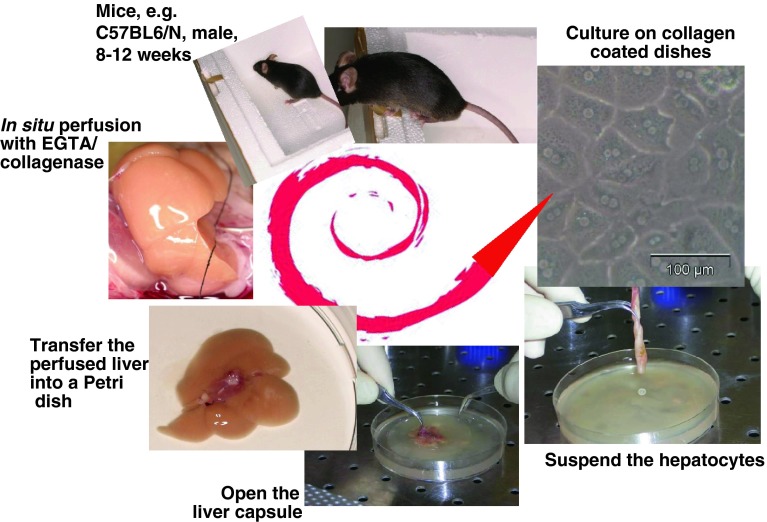
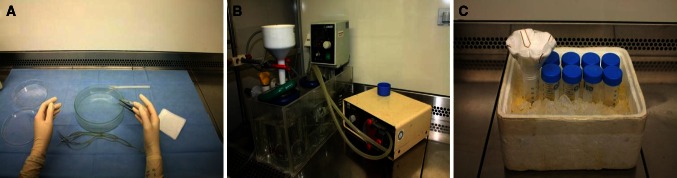
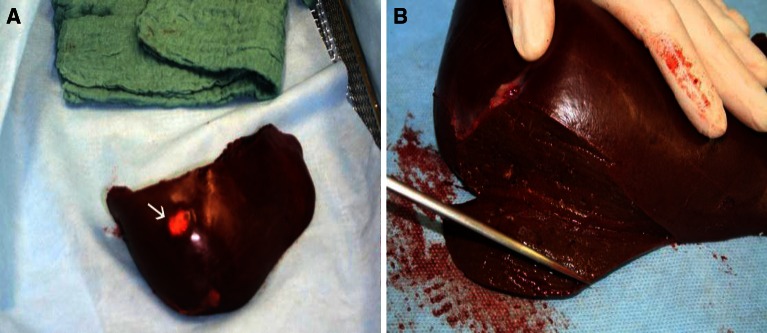
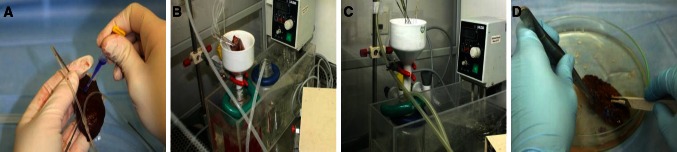
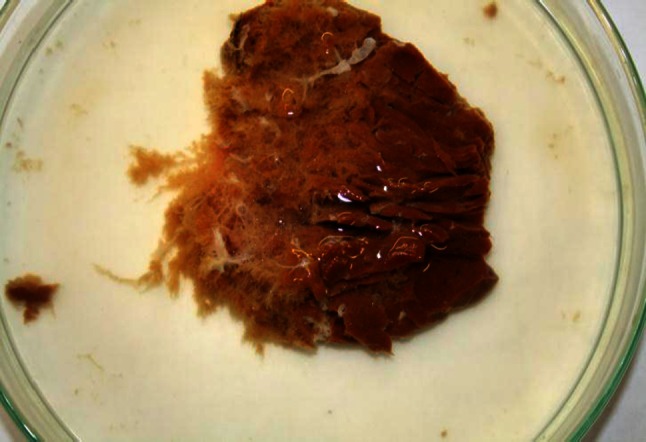
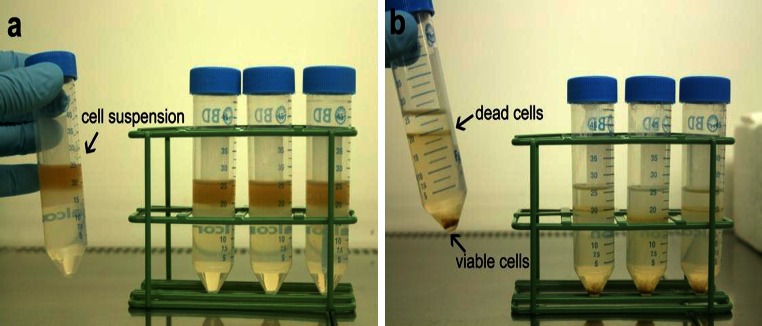
Verification
Claims the paper makes
The claims and statistics of this paper haven’t been checked yet.
Run the check — free, no account needed. It reads the open-access text and checks the sources it cites.
Claims other papers make about this one
Each is checked against this paper’s own text: does it say what the citing paper says it does?
The source backs part of the claim, not all of it — or backs it for a different population, condition or comparison.
In the citing paper
“Already in the first few days of cultivation, a reduction of hepatic functions can be observed, e.g. production of plasma proteins, drug metabolizing enzyme activities, glucose metabolism and urea synthesis (Godoy et al., 2013[15]).”
From Optimization of extracellular matrix for primary human hepatocyte cultures using mixed collagen-matrigel matrices (2023) · cites this paper as Godoy et al., 2013[15]
Experimental — accuracy not yet measuredThe source backs part of the claim, not all of it — or backs it for a different population, condition or comparison.
In the citing paper
“Primary human hepatocytes (PHHs) are an important tool for studying human liver disease and drug-induced liver injury (DILI), with other models, such as rat hepatocytes, hepatic cell lines and stem cell-derived hepatocyte-like cells failing to offer metabolically competent and species-relevant alternatives (Godoy et al. 2013).”
From Mechanistic evaluation of primary human hepatocyte culture using global proteomic analysis reveals a selective dedifferentiation profile (2017) · cites this paper as Godoy et al. 2013
Experimental — accuracy not yet measuredThe source backs part of the claim, not all of it — or backs it for a different population, condition or comparison.
In the citing paper
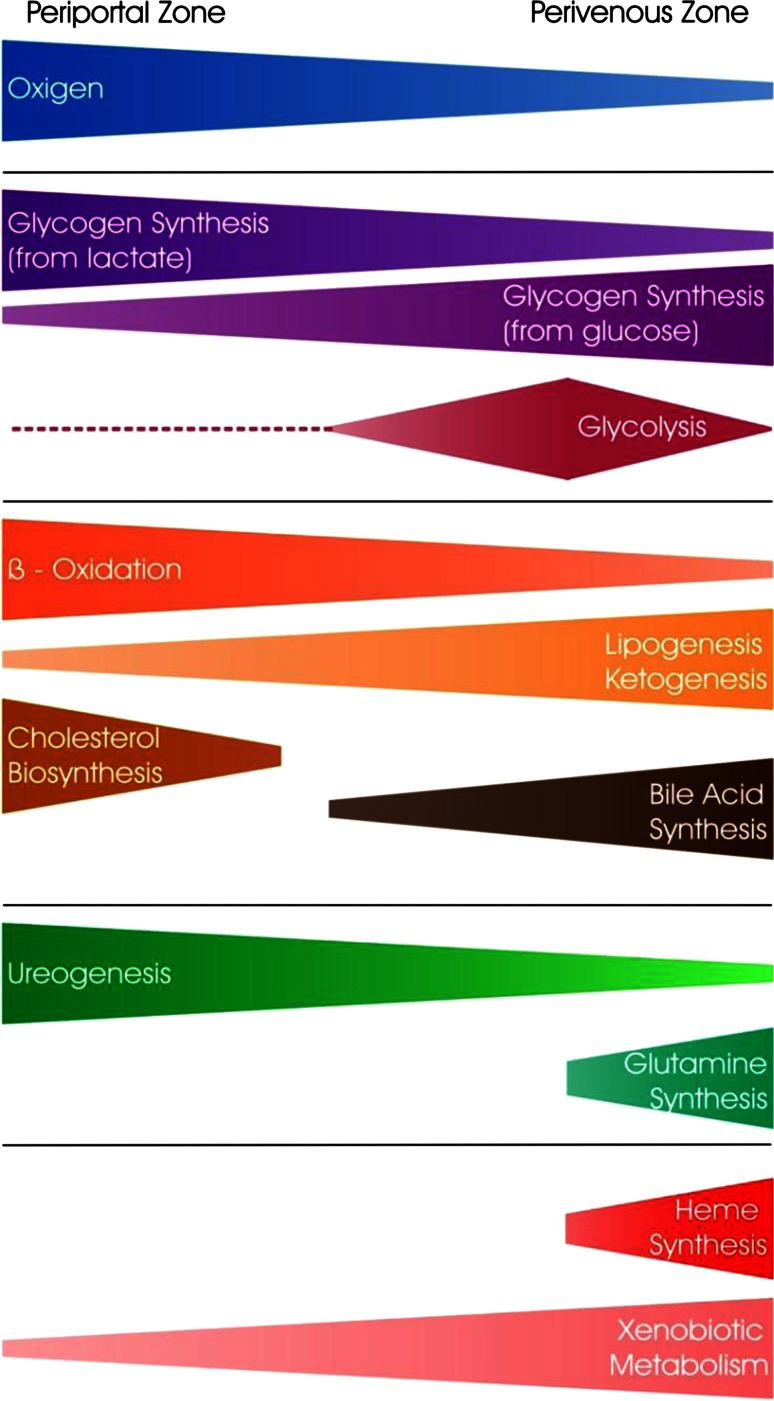
“In fact, zonation appears to be a large influencing factor on variation during culture as our pathway analysis of the most variable proteins revealed significant association with ketogenesis, cholesterol biosynthesis, fatty acid β oxidation and glutamine synthesis (table S4), all of these are related to the portocentral axis gradient of the lobule (Godoy et al. 2013).”
From Mechanistic evaluation of primary human hepatocyte culture using global proteomic analysis reveals a selective dedifferentiation profile (2017) · cites this paper as Godoy et al. 2013
Experimental — accuracy not yet measuredThe cited source says what the claim attributes to it.
In the citing paper
“although cytotoxicity measures are fundamental in the assessment of a drug’s potential for hepatotoxicity in vitro33,34, gene expression and various phenotypic changes can occur at much lower concentrations35,36.”
From Performance assessment and economic analysis of a human Liver-Chip for predictive toxicology (2022) · cites this paper as [34]
The cited source says what the claim attributes to it.
In the citing paper
“The apical membrane is equipped with transport proteins that eliminate bile acids and xenobiotics from the cell, like multidrug resistance-associated protein 2 (MRP2) (Godoy et al., 2013[15]; Ito et al., 2005[20]).”
From Optimization of extracellular matrix for primary human hepatocyte cultures using mixed collagen-matrigel matrices (2023) · cites this paper as Godoy et al., 2013[15]
The cited source says what the claim attributes to it.
In the citing paper
“The hepatocyte's basal membrane faces the sinusoid. It expresses several transmembrane transporters that manage the exchange of substances with the sinusoidal blood stream (Godoy et al., 2013[15]).”
From Optimization of extracellular matrix for primary human hepatocyte cultures using mixed collagen-matrigel matrices (2023) · cites this paper as Godoy et al., 2013[15]
The cited source says what the claim attributes to it.
In the citing paper
“In vivo, the distribution of ECM components varies between the different parts of the liver acinus, the smallest organizational unit of the liver (Godoy et al., 2013[15]; Martinez-Hernandez and Amenta, 1993[26]).”
From Optimization of extracellular matrix for primary human hepatocyte cultures using mixed collagen-matrigel matrices (2023) · cites this paper as Godoy et al., 2013[15]
The cited source says what the claim attributes to it.
In the citing paper
“The application of primary human hepatocytes following isolation from human tissue is well accepted to be compromised by the process of dedifferentiation.”
From Mechanistic evaluation of primary human hepatocyte culture using global proteomic analysis reveals a selective dedifferentiation profile (2017) · cites this paper as Godoy et al. 2013
The check wasn’t confident either way, so it gives no verdict — never disputed.
In the citing paper
“In practice, strategies for optimizing HepG2 can be divided into several approaches. The first approach is based on genetic modification of cells to express key biotransformation enzymes, in particular cytochrome P450 isoforms [109]. The second approach involves epigenetic and cultural maturation of cells, which allows for increased expression of nuclear receptors and, consequently, of xenobiotic”
From The HepG2 Cell Line as a Model for Studying Metabolic Dysfunction-Associated Steatotic Liver Disease (2026) · cites this paper as [163]
Experimental — accuracy not yet measured
Self-check
Percentages, sums and reported differences re-computed from the paper’s own numbers.
The self-check needs the paper’s full text.
Citations
Cites
1 retracted
Items 601–800 of 1,859
Hepatic Uptake of Bile Acids in Man
Angelin, B., Björkhem, I., Einarsson, K., & Ewerth, S. (1982) · Journal of Clinical Investigation · doi:10.1172/jci110668 · Cited by 227
Biliary excretion in primary rat hepatocytes cultured in a collagen-sandwich configuration
Liu, X., LeCluyse, E. L., Brouwer, K. R., Gan, L.-S. L., Lemasters, J. J., Stieger, B., Meier, P. J., & Brouwer, K. L. R. (1999) · American Journal of Physiology-Gastrointestinal and Liver Physiology · doi:10.1152/ajpgi.1999.277.1.g12 · Cited by 226
Self-citationInnate and adaptive immune responses to cell death
Rock, K. L., Lai, J., & Kono, H. (2011) · Immunological Reviews · doi:10.1111/j.1600-065x.2011.01040.x · Cited by 226
Lübberstedt, M., Müller‐Vieira, U., Mayer, M., Biemel, K. M., Knöspel, F., Knobeloch, D., Nussler, A. K., Gerlach, J. C., & Zeilinger, K. (2010) · Journal of Pharmacological and Toxicological Methods · doi:10.1016/j.vascn.2010.04.013 · Cited by 226
Self-citationBokhari, M., Carnachan, R. J., Cameron, N. R., & Przyborski, S. A. (2007) · Journal of Anatomy · doi:10.1111/j.1469-7580.2007.00778.x · Cited by 226
Self-citationSpray, D. C., Fujita, M., Sáez, J. C., Choi, H., Watanabe, T., Hertzberg, E. L., Rosenberg, L. C., & Reid, L. M. (1987) · The Journal of Cell Biology · doi:10.1083/jcb.105.1.541 · Cited by 226
Wan, Y. Y., An, D., Cai, Y., Repa, J. J., Chen, T. H.-P., Flores, M., Postic, C., Magnuson, M. A., Chen, J., Chien, K. R., et al. (2000) · Molecular and Cellular Biology · doi:10.1128/mcb.20.12.4436-4444.2000 · Cited by 226
Ito, K., & Houston, J. B. (2004) · Pharmaceutical Research · doi:10.1023/b:pham.0000026429.12114.7d · Cited by 225
Self-citationMacé, K. (1997) · Carcinogenesis · doi:10.1093/carcin/18.7.1291 · Cited by 225
d'Aldebert, E., Mve, M.-J. B. B., Mergey, M., Wendum, D., Firrincieli, D., Coilly, A., Fouassier, L., Corpechot, C., Poupon, R. Y., Housset, C., et al. (2008) · Gastroenterology · doi:10.1053/j.gastro.2008.12.040 · Cited by 225
Meier, Y., Pauli‐Magnus, C., Zanger, U. M., Klein, K., Schaeffeler, E., Nussler, A. K., Nüssler, N. C., Eichelbaum, M. F., Meier, P. J., & Stieger, B. (2006) · Hepatology · doi:10.1002/hep.21214 · Cited by 224
Self-citationCD133+ hepatic stellate cells are progenitor cells
Kordes, C., Sawitza, I., Müller-Marbach, A., Ale‐Agha, N., Keitel, V., Klonowski-Stumpe, H., & Häussinger, D. (2006) · Biochemical and Biophysical Research Communications · doi:10.1016/j.bbrc.2006.11.029 · Cited by 224
Self-citationHepaRG Cells as an in Vitro Model for Evaluation of Cytochrome P450 Induction in Humans
Kanebratt, K. P., & Andersson, T. B. (2007) · Drug Metabolism and Disposition · doi:10.1124/dmd.107.017418 · Cited by 224
Johnson-Kendall-Roberts Theory Applied to Living Cells
Chu, Y., Dufour, S., Thiery, J. P., Perez, É., & Pincet, F. (2005) · Physical Review Letters · doi:10.1103/physrevlett.94.028102 · Cited by 224
Sies, H. (1978) · Methods in enzymology on CD-ROM/Methods in enzymology · doi:10.1016/s0076-6879(78)52005-3 · Cited by 224
Prediction of in vivo drug clearance from in vitro data. I: Impact of inter-individual variability
Howgate, E. M., Rowland Yeo, K., Proctor, N. J., Tucker, G. T., & Rostami-Hodjegan, A. (2006) · Xenobiotica · doi:10.1080/00498250600683197 · Cited by 223
Evers, R., de Haas, M., Sparidans, R. W., Beijnen, J. H., Wielinga, P. R., Lankelma, J., & Borst, P. (2000) · British Journal of Cancer · doi:10.1054/bjoc.2000.1262 · Cited by 223
Oatp2 Mediates Bidirectional Organic Solute Transport: A Role for Intracellular Glutathione
Li, L., Meier, P. J., & Ballatori, N. (2000) · Molecular Pharmacology · doi:10.1124/mol.58.2.335 · Cited by 222
de la Rosa, L. C., Schoemaker, M. H., Vrenken, T. E., Buist‐Homan, M., Havinga, R., Jansen, P. L. M., & Moshage, H. J. (2005) · Journal of Hepatology · doi:10.1016/j.jhep.2005.07.034 · Cited by 222
Biochemistry of bile secretion
COLEMAN, R. (1987) · Biochemical Journal · doi:10.1042/bj2440249 · Cited by 222
Dependence of Liver-Specific Transcription on Tissue Organization
Clayton, D. F., Harrelson, A. L., & Darnell, J. E., Jr. (1985) · Molecular and Cellular Biology · doi:10.1128/mcb.5.10.2623 · Cited by 222
van de Steeg, E., Wagenaar, E., van der Kruijssen, C. M. M., Burggraaff, J. E. C., de Waart, D. R., Elferink, R. P. J. O., Kenworthy, K. E., & Schinkel, A. H. (2010) · Journal of Clinical Investigation · doi:10.1172/jci42168 · Cited by 222
Wullaert, A., Loo, G., Heyninck, K., & Beyaert, R. (2007) · Endocrine Reviews · doi:10.1210/er.2006-0031 · Cited by 221
Landrier, J., Eloranta, J. J., Vavricka, S. R., & Kullak-Ublick, G. A. (2005) · American Journal of Physiology-Gastrointestinal and Liver Physiology · doi:10.1152/ajpgi.00430.2005 · Cited by 221
Self-citationIn vitro-in vivo Extrapolation of Transporter-mediated Clearance in the Liver and Kidney
Kusuhara, H., & Sugiyama, Y. (2009) · Drug Metabolism and Pharmacokinetics · doi:10.2133/dmpk.24.37 · Cited by 221
Self-citationReconstruction of Hepatic Organoid by Rat Small Hepatocytes and Hepatic Nonparenchymal Cells
Mitaka, T., Sato, F., Mizuguchi, T., Yokono, T., & Mochizuki, Y. (1999) · Hepatology · doi:10.1002/hep.510290103 · Cited by 221
Endotoxin administration to humans inhibits hepatic cytochrome P450-mediated drug metabolism.
Shedlofsky, S. I., Israel, B. C., McClain, C. J., Hill, D. B., & Blouin, R. A. (1994) · Journal of Clinical Investigation · doi:10.1172/jci117582 · Cited by 220
Hepatocyte cell lines: their use, scope and limitations in drug metabolism studies
Castell, J. V., Jover, R., Martinez‐Jimenez, C. P., & G�mez-Lech�n, M. J. (2006) · Expert Opinion on Drug Metabolism & Toxicology · doi:10.1517/17425255.2.2.183 · Cited by 219
Self-citationPPARα in atherosclerosis and inflammation
Zandbergen, F. J., & Plutzky, J. (2007) · Biochimica et Biophysica Acta (BBA) - Molecular and Cell Biology of Lipids · doi:10.1016/j.bbalip.2007.04.021 · Cited by 219
Huisman, M. T., Smit, J. W., Crommentuyn, K. M. L., Zelcer, N., WILTSHIRE, H. R., Beijnen, J. H., & Schinkel, A. H. (2002) · AIDS · doi:10.1097/00002030-200211220-00009 · Cited by 219
Riboflavin kinase couples TNF receptor 1 to NADPH oxidase
Yazdanpanah, B., Wiegmann, K., Tchikov, V., Krut, O., Pongratz, C., Schramm, M., Kleinridders, A., Wunderlich, T., Kashkar, H., Utermöhlen, O., et al. (2009) · Nature · doi:10.1038/nature08206 · Cited by 218
In situ localization of the hepatocytic na+/taurocholate cotransporting polypeptide in rat liver
Stieger, B., Hagenbuch, B., Landmann, L., Höchli, M., Schroeder, A. L., & Meier, P. J. (1994) · Gastroenterology · doi:10.1016/0016-5085(94)90821-4 · Cited by 218
Self-citationEllinger-Ziegelbauer, H. C., Gmuender, H., Bandenburg, A., & Ahr, H. J. (2007) · Mutation research. Fundamental and molecular mechanisms of mutagenesis · doi:10.1016/j.mrfmmm.2007.06.010 · Cited by 217
Use of Cryopreserved Human Hepatocytes in Sandwich Culture to Measure Hepatobiliary Transport
Bi, Y.-A., Kazolias, D., & Duignan, D. B. (2006) · Drug Metabolism and Disposition · doi:10.1124/dmd.105.009118 · Cited by 216
Aithal, G. P., Ramsay, L., Daly, A. K., Sonchit, N., Leathart, J. B. S., Alexander, G., Kenna, J. G., Caldwell, J., & Day, C. P. (2004) · Hepatology · doi:10.1002/hep.20205 · Cited by 216
Oberst, A., Pop, C., Tremblay, A. G., Blais, V., Denault, J.-B., Salvesen, G. S., & Green, D. R. (2010) · Journal of Biological Chemistry · doi:10.1074/jbc.m109.095083 · Cited by 214
Barbier, O., Pineda‐Torra, I., Sirvent, A., Claudel, T., Blanquart, C., Durán-Sandoval, D., Kuipers, F., Kosykh, V., Fruchart, J., & Staels, B. (2003) · Gastroenterology · doi:10.1016/s0016-5085(03)00388-3 · Cited by 214
Wu, J., Meng, Z., Jiang, M., Zhang, E., Trippler, M., Broering, R., Bucchi, A., Krux, F., Dittmer, U., Yang, D., et al. (2009) · Immunology · doi:10.1111/j.1365-2567.2009.03179.x · Cited by 213
A microfluidic hepatic coculture platform for cell-based drug metabolism studies
Novik, E., Maguire, T. J., Chao, P., Cheng, K.-C., & Yarmush, M. L. (2009) · Biochemical Pharmacology · doi:10.1016/j.bcp.2009.11.010 · Cited by 213
Stem cells in liver regeneration, fibrosis and cancer: the good, the bad and the ugly
Alison, M. R., Islam, S., & Lim, S. G. (2008) · The Journal of Pathology · doi:10.1002/path.2453 · Cited by 213
Fahmi, O. A., Hurst, S. I., Plowchalk, D. R., Cook, J., Guo, F., Youdim, K. A., Dickins, M., Phipps, A., Darekar, A., Hyland, R., et al. (2009) · Drug Metabolism and Disposition · doi:10.1124/dmd.108.026252 · Cited by 212
Brown, H. S., Griffin, M., & Houston, J. B. (2006) · Drug Metabolism and Disposition · doi:10.1124/dmd.106.011569 · Cited by 212
Self-citationHuang, Y., Su, W., Huang, Y., Chen, C., Chang, F.-Y., Lin, H., & Lee, S. (2007) · Journal of Hepatology · doi:10.1016/j.jhep.2007.02.009 · Cited by 212
Huisman, M. T., Chhatta, A. A., van Tellingen, O., Beijnen, J. H., & Schinkel, A. H. (2005) · International Journal of Cancer · doi:10.1002/ijc.21013 · Cited by 212
Li, T., & Chiang, J. Y. L. (2004) · American Journal of Physiology-Gastrointestinal and Liver Physiology · doi:10.1152/ajpgi.00258.2004 · Cited by 212
Free fatty acids sensitise hepatocytes to TRAIL mediated cytotoxicity
Malhi, H., Barreyro, F. J., Isomoto, H., Bronk, S. F., & Gores, G. J. (2007) · Gut · doi:10.1136/gut.2006.118059 · Cited by 212
Diseases in a dish: modeling human genetic disorders using induced pluripotent cells
Tiscórnia, G., Lorenzo-Vivas, E., & Belmonte, J. C. I. (2011) · Nature Medicine · doi:10.1038/nm.2504 · Cited by 211
Maeda, K., Ikeda, Y., Fujita, T., Yoshida, K. J., Azuma, Y., Haruyama, Y., Yamane, N., Kumagai, Y., & Sugiyama, Y. (2011) · Clinical Pharmacology & Therapeutics · doi:10.1038/clpt.2011.142 · Cited by 211
Self-citationIeiri, I., Higuchi, S., & Sugiyama, Y. (2009) · Expert Opinion on Drug Metabolism & Toxicology · doi:10.1517/17425250902976854 · Cited by 211
Self-citationMicroRNA regulates human vitamin D receptor
Mohri, T., Nakajima, M., Takagi, S., Komagata, S., & Yokoi, T. (2009) · International Journal of Cancer · doi:10.1002/ijc.24459 · Cited by 211
Localization and function of the organic anion–transporting polypeptide Oatp2 in rat liver
Reichel, C., Gao, B., van Montfoort, J. E., Cattori, V., Rahner, C., Hagenbuch, B., Stieger, B., Kamisako, T., & Meier, P. J. (1999) · Gastroenterology · doi:10.1016/s0016-5085(99)70463-4 · Cited by 210
Self-citationKinetics of drug-drug interactions
Rowland, M., & Matin, S. B. (1973) · Journal of Pharmacokinetics and Biopharmaceutics · doi:10.1007/bf01059791 · Cited by 210
Micrornas Control Hepatocyte Proliferation During Liver Regeneration
Song, G., Sharma, A. D., Roll, G. R., Ng, R., Lee, A. Y., Blelloch, R. H., Frandsen, N. M., & Willenbring, H. (2010) · Hepatology · doi:10.1002/hep.23547 · Cited by 209
Stender, J. D., Kim, K., Charn, T. H., Komm, B. S., Chang, K. C. N., Kraus, W. L., Benner, C. W., Glass, C. K., & Katzenellenbogen, B. S. (2010) · Molecular and Cellular Biology · doi:10.1128/mcb.00118-10 · Cited by 208
Digitonin-collagenase perfusion for efficient separation of periportal or perivenous hepatocytes
Lindros, K. O., & Penttilä, K. E. (1985) · Biochemical Journal · doi:10.1042/bj2280757 · Cited by 208
Duan, Y., Catana, A. M., Meng, Y., Yamamoto, N., He, S., Gupta, S. K., Gambhir, S. S., & Zern, M. Α. (2007) · Stem Cells · doi:10.1634/stemcells.2007-0291 · Cited by 208
Cholangiocyte proliferation and liver fibrosis
Glaser, S. S., Gaudio, E., Miller, T. J., Alvaro, D., & Alpini, G. D. (2009) · Expert Reviews in Molecular Medicine · doi:10.1017/s1462399409000994 · Cited by 207
Ring, B. J., Chien, J. Y., Adkison, K. K., Jones, H. M., Rowland, M., Jones, R. D., Yates, J. W. T., Ku, M. S., Gibson, C. R., He, H., et al. (2011) · Journal of Pharmaceutical Sciences · doi:10.1002/jps.22552 · Cited by 206
Fate-Mapping Evidence That Hepatic Stellate Cells Are Epithelial Progenitors in Adult Mouse Livers
Yang, L., Jung, Y., Omenetti, A., Witek, R. P., Choi, S. S., VanDongen, H. M. A., Huang, J., Alpini, G. D., & Diehl, A. M. (2008) · Stem Cells · doi:10.1634/stemcells.2008-0115 · Cited by 205
Brendel, C., Schoonjans, K., Botrugno, O. A., Treuter, E., & Auwerx, J. H. (2002) · Molecular Endocrinology · doi:10.1210/me.2001-0194 · Cited by 204
Judson, R., Kavlock, R. J., Setzer, R. W., Hubal, E. A. C., Martin, M. T., Knudsen, T. B., Houck, K. A., Thomas, R. S., Wetmore, B. A., & Dix, D. J. (2011) · Chemical Research in Toxicology · doi:10.1021/tx100428e · Cited by 204
van Midwoud, P. M., Merema, M. T., Verpoorte, E., & Groothuis, G. M. M. (2010) · Lab on a Chip · doi:10.1039/c0lc00043d · Cited by 203
Self-citationHeparin-based hydrogel as a matrix for encapsulation and cultivation of primary hepatocytes
Kim, M.-H., Lee, J. Y., Jones, C. N., Revzin, A., & Tae, G. (2010) · Biomaterials · doi:10.1016/j.biomaterials.2010.01.068 · Cited by 203
P-glycoprotein: Tissue Distribution, Substrates, and Functional Consequences of Genetic Variations
Cascorbi, I. (2010) · Handbook of experimental pharmacology · doi:10.1007/978-3-642-14541-4_6 · Cited by 203
Selzner, N., Selzner, M., Odermatt, B., Tian, Y., van Rooijen, N., & Clavien, P. (2003) · Gastroenterology · doi:10.1053/gast.2003.50098 · Cited by 201
Jossé, R., Aninat, C., Glaise, D., Dumont, J., Fessard, V., Morel, F., Poul, J., Guguen‐Guillouzo, C., & Guillouzo, A. (2008) · Drug Metabolism and Disposition · doi:10.1124/dmd.107.019901 · Cited by 201
The hepatic extracellular matrix: I. Components and distribution in normal liver
Martinez-Hernandez, A., & Amenta, P. S. (1993) · Virchows Archiv A Pathological Anatomy and Histopathology · doi:10.1007/bf01606425 · Cited by 200
High yield preparation of isolated human adult hepatocytes by enzymatic perfusion of the liver
Guguen‐Guillouzo, C., Campion, J. P., Brissot, P., Glaise, D., Launois, B., Bourel, M., & Guillouzo, A. (1982) · Cell Biology International Reports · doi:10.1016/0309-1651(82)90187-4 · Cited by 199
In Vitro and In Vivo Evidence of the Importance of Organic Anion Transporters (OATs) in Drug Therapy
Burckhardt, G., & Burckhardt, B. C. (2010) · Handbook of experimental pharmacology · doi:10.1007/978-3-642-14541-4_2 · Cited by 199
Hepatic stellate cell (vitamin A‐storing cell) and its relative – past, present and future
Senoo, H., Yoshikawa, K., Morii, M., Miura, M., Imai, K., & Mezaki, Y. (2010) · Cell Biology International · doi:10.1042/cbi20100321 · Cited by 198
Fas-Mediated Apoptosis in Primary Cultured Mouse Hepatocytes
Ni, R., Tomita, Y., Matsuda, K., Ichihara, A., Ishimura, K., Ogasawara, J., & Nagata, S. (1994) · Experimental Cell Research · doi:10.1006/excr.1994.1349 · Cited by 198
Phay, J. E., Hussain, H. B., & Moley, J. F. (2000) · Genomics · doi:10.1006/geno.2000.6195 · Cited by 198
Goodwin, B. J., Gauthier, K. C., Umetani, M., Watson, M. A., Lochansky, M. I., Collins, J. L., Leitersdorf, E., Mangelsdorf, D. J., Kliewer, S. A., & Repa, J. J. (2002) · Proceedings of the National Academy of Sciences · doi:10.1073/pnas.0237082100 · Cited by 198
Miao, J., Fang, S., Bae, Y., & Kemper, J. K. (2006) · Journal of Biological Chemistry · doi:10.1074/jbc.m510713200 · Cited by 197
Hallifax, D., Foster, J. A., & Houston, J. B. (2010) · Pharmaceutical Research · doi:10.1007/s11095-010-0218-3 · Cited by 196
Self-citationLong-term culture of adult rat hepatocyte spheroids
Tong, J. Z., Lagausie, P. P. D., Furlan, V., Cresteil, T., Bernard, O., & Álvarez, F. (1992) · Experimental Cell Research · doi:10.1016/0014-4827(92)90179-c · Cited by 196
Nagaoka, M., Si‐Tayeb, K., Akaike, T., & Duncan, S. A. (2010) · BMC Developmental Biology · doi:10.1186/1471-213x-10-60 · Cited by 196
Role of Lipid Peroxidation as a Mechanism of Liver Injury after Acetaminophen Overdose in Mice
Knight, T. R. (2003) · Toxicological Sciences · doi:10.1093/toxsci/kfg220 · Cited by 196
Ruhnke, M., Ungefroren, H., Nussler, A. K., Martı́n, F., Brulport, M., Schormann, W., Hengstler, J. G., Klapper, W., Ulrichs, K. F. A., Hutchinson, J. A., et al. (2005) · Gastroenterology · doi:10.1053/j.gastro.2005.03.029 · Cited by 196
Self-citationDeLeve, L. D. (1996) · Hepatology · doi:10.1002/hep.510240414 · Cited by 196
Liver sinusoidal endothelial cell progenitor cells promote liver regeneration in rats
Wang, L., Wang, X., Xie, G., Wang, L., Hill, C. K., & DeLeve, L. D. (2012) · Journal of Clinical Investigation · doi:10.1172/jci58789 · Cited by 194
Ethanol Cytotoxicity to a Transfected HepG2 Cell Line Expressing Human Cytochrome P4502E1
Wu, D., & Cederbaum, A. I. (1996) · Journal of Biological Chemistry · doi:10.1074/jbc.271.39.23914 · Cited by 194
Pitot, H. C., Goldsworthy, T. L., Moran, S. M., Kennan, W. S., Glauert, H. P., Maronpot, R. R., & Campbell, H. A. (1987) · Carcinogenesis · doi:10.1093/carcin/8.10.1491 · Cited by 194
Potential role of activated macrophages in acetaminophen hepatotoxicity
Laskin, D. L., & Pilaro, A. M. (1986) · Toxicology and Applied Pharmacology · doi:10.1016/0041-008x(86)90051-7 · Cited by 194
Cellular Sources of Extracellular Matrix in Hepatic Fibrosis
Wells, R. G. (2008) · Clinics in Liver Disease · doi:10.1016/j.cld.2008.07.008 · Cited by 193
Death receptor-mediated apoptosis and the liver
Yoon, J., & Gores, G. J. (2002) · Journal of Hepatology · doi:10.1016/s0168-8278(02)00209-x · Cited by 193
Tailoring the morphology of emulsion-templated porous polymers
Carnachan, R. J., Bokhari, M., Przyborski, S. A., & Cameron, N. R. (2006) · Soft Matter · doi:10.1039/b603211g · Cited by 193
Self-citationMeijer, C., Wiezer, M. J., Diehl, A. M., Yang, S., Schouten, H. J., Meijer, S., van Rooijen, N., van Lambalgen, A. A., Dijkstra, C. D., & van Leeuwen, P. A. M. (2000) · Liver International · doi:10.1034/j.1600-0676.2000.020001066.x · Cited by 192
Coon, J., Hamilton, G. A., Jolley, S. L., Gilbert, D., Barros, S. A., & LeCluyse, E. L. (2001) · Cell and Tissue Research · doi:10.1007/s004410100429 · Cited by 192
Self-citationDrug metabolism in hepatocyte sandwich cultures of rats and humans
Kern, A., Bader, A., Pichlmayr, R., & Sewing, K. ‐. (1997) · Biochemical Pharmacology · doi:10.1016/s0006-2952(97)00204-9 · Cited by 192
The Organic Anion Transporter (OATP) Family
Mikkaichi, T., Suzuki, T., Tanemoto, M., Ito, S., & Abe, T. (2004) · Drug Metabolism and Pharmacokinetics · doi:10.2133/dmpk.19.171 · Cited by 192
Hepatocyte Nuclear Factor 1α: A Key Mediator of the Effect of Bile Acids on Gene Expression
Jung, D., & Kullak-Ublick, G. A. (2003) · Hepatology · doi:10.1053/jhep.2003.50100 · Cited by 192
Self-citationMechanisms of pH-gradient driven transport mediated by organic anion polypeptide transporters
Leuthold, S., Hagenbuch, B., Mohebbi, N., Wagner, C. A., Meier, P. J., & Stieger, B. (2009) · American Journal of Physiology-Cell Physiology · doi:10.1152/ajpcell.00436.2008 · Cited by 192
Self-citationBiodegradable sponges for hepatocyte transplantation
Mooney, D. J., Park, S., Kaufmann, P. M., Sano, K., McNamara, K., Vacanti, J. P., & Langer, R. (1995) · Journal of Biomedical Materials Research · doi:10.1002/jbm.820290807 · Cited by 192
Textbook of hepatology : from basic science to clinical practice
Rodés, J. (2007) · Cited by 192
Hamada, A., Sissung, T. M., Price, D. K., Danesi, R., Chau, C. H., Sharifi, N., Venzon, D. J., Maeda, K., Nagao, K., Sparreboom, A., et al. (2008) · Clinical Cancer Research · doi:10.1158/1078-0432.ccr-07-4118 · Cited by 191
Bajt, M. L., Farhood, A. I., Lemasters, J. J., & Jaeschke, H. (2007) · Journal of Pharmacology and Experimental Therapeutics · doi:10.1124/jpet.107.129445 · Cited by 190
Self-citationJones, H. M., & Houston, J. B. (2004) · Drug Metabolism and Disposition · doi:10.1124/dmd.104.000125 · Cited by 190
Self-citationCarbohydrate Recognition Systems for Receptor-Mediated Pinocytosis
Neufeld, E. F., & Ashwell, G. (1980) · Springer eBooks · doi:10.1007/978-1-4684-1006-8_6 · Cited by 190
Naritomi, Y., Terashita, S., Kagayama, A., & Sugiyama, Y. (2003) · Drug Metabolism and Disposition · doi:10.1124/dmd.31.5.580 · Cited by 189
Self-citationJohansson, L., Thomsen, J. S., Damdimopoulos, A. E., Spyrou, G., Gustafsson, J.-Α., & Treuter, E. (1999) · Journal of Biological Chemistry · doi:10.1074/jbc.274.1.345 · Cited by 188
Yeo, K. R., Jamei, M., Yang, J., Tucker, G. T., & Rostami‐Hodjegan, A. (2009) · European Journal of Pharmaceutical Sciences · doi:10.1016/j.ejps.2009.12.002 · Cited by 187
Ranucci, C. S., Kumar, A., Batra, S. P., & Moghe, P. V. (2000) · Biomaterials · doi:10.1016/s0142-9612(99)00238-0 · Cited by 187
Precision-cut liver slices: characteristics and use for in vitro pharmaco-toxicology
Lerche-Langrand, C., & Toutain, H. J. (2000) · Toxicology · doi:10.1016/s0300-483x(00)00316-4 · Cited by 187
A regulatory viewpoint on transporter-based drug interactions
Zhang, L., Zhang, Y. (. )., Strong, J. M., Reynolds, K. S., & Huang, S. M. (2008) · Xenobiotica · doi:10.1080/00498250802017715 · Cited by 187
Nagai, H., Matsumaru, K., Feng, G., & Kaplowitz, N. (2002) · Hepatology · doi:10.1053/jhep.2002.33995 · Cited by 186
The Nuclear Xenobiotic Receptor CAR
Suino, K., Peng, L., Reynolds, R. A., Li, Y., Cha, J.-Y., Repa, J. J., Kliewer, S. A., & Xu, H. E. (2004) · Molecular Cell · doi:10.1016/j.molcel.2004.11.036 · Cited by 186
Retroviral infection of non-dividing cells: Old and new perspectives
Yamashita, M., & Emerman, M. (2005) · Virology · doi:10.1016/j.virol.2005.09.012 · Cited by 186
The Bile Acid Glycochenodeoxycholate Induces TRAIL-Receptor 2/DR5 Expression and Apoptosis
Higuchi, H., Bronk, S. F., Takikawa, Y., Werneburg, N. W., Takimoto, R., El‐Deiry, W. S., & Gores, G. J. (2001) · Journal of Biological Chemistry · doi:10.1074/jbc.m105300200 · Cited by 186
Immune pathomechanism of drug hypersensitivity reactions
Pichler, W. J., Naisbitt, D. J., & Park, B. K. (2011) · Journal of Allergy and Clinical Immunology · doi:10.1016/j.jaci.2010.11.048 · Cited by 186
Self-citationZimmerman, H. J. (2000) · Clinics in Liver Disease · doi:10.1016/s1089-3261(05)70097-0 · Cited by 186
Hughes, M. A., Harper, N. W., Butterworth, M., Cain, K., Cohen, G. M., & MacFarlane, M. (2009) · Molecular Cell · doi:10.1016/j.molcel.2009.06.012 · Cited by 185
Interaction of Methotrexate with Organic-Anion Transporting Polypeptide 1A2 and Its Genetic Variants
Badagnani, I., Castro, R. A., Taylor, T. R., Brett, C. M., Huang, C. C., Stryke, D., Kawamoto, M., Johns, S. J., Ferrin, T. E., Carlson, E. J., et al. (2006) · Journal of Pharmacology and Experimental Therapeutics · doi:10.1124/jpet.106.104364 · Cited by 185
Pathophysiological role of the acute inflammatory response during acetaminophen hepatotoxicity
Cover, C., LIU, J., Farhood, A. I., Malle, E., Waalkes, M. P., Bajt, M. L., & Jaeschke, H. (2006) · Toxicology and Applied Pharmacology · doi:10.1016/j.taap.2006.04.010 · Cited by 185
Self-citationDresser, G. K., Kim, R. B., & Bailey, D. G. (2005) · Clinical Pharmacology & Therapeutics · doi:10.1016/j.clpt.2004.10.005 · Cited by 185
A biochemical dissection of the functional polarity of the plasma membrane of the hepatocyte
Evans, W. H. (1980) · Biochimica et Biophysica Acta (BBA) - Biomembranes · doi:10.1016/0005-2736(80)90584-2 · Cited by 185
Obach, R. S., & Reed‐Hagen, A. E. (2002) · Drug Metabolism and Disposition · doi:10.1124/dmd.30.7.831 · Cited by 185
Hirata, K., Takagi, H., Yamamoto, M., Matsumoto, T., Nishiya, T., Mori, K., Shimizu, S., Masumoto, H., & Okutani, Y. (2007) · The Pharmacogenomics Journal · doi:10.1038/sj.tpj.6500442 · Cited by 184
Tissue specific synthetic ECM hydrogels for 3-D in vitro maintenance of hepatocyte function
Skardal, A., Smith, L., Bharadwaj, S., Atala, A., Soker, S., & Zhang, Y. (2012) · Biomaterials · doi:10.1016/j.biomaterials.2012.03.034 · Cited by 183
Idiosyncratic drug-induced liver injury: an overview
Hussaini, S. H., & Farrington, E. A. (2007) · Expert Opinion on Drug Safety · doi:10.1517/14740338.6.6.673 · Cited by 183
Marquez, R. T., Wendlandt, E. B., Galle, C. S., Keck, K., & McCaffrey, A. P. (2010) · American Journal of Physiology-Gastrointestinal and Liver Physiology · doi:10.1152/ajpgi.00338.2009 · Cited by 183
The Aryl Hydrocarbon Receptor Functions as a Tumor Suppressor of Liver Carcinogenesis
Fan, Y., Boivin, G. P., Knudsen, E. S., Nebert, D. W., Xia, Y., & Puga, A. (2009) · Cancer Research · doi:10.1158/0008-5472.can-09-3090 · Cited by 183
Isolation and culture of adult hepatocytes from liver biopsies
Reese, J. A., & Byard, J. L. (1981) · In Vitro Cellular & Developmental Biology - Plant · doi:10.1007/bf02618417 · Cited by 181
p300 Functions as a Coactivator for the Peroxisome Proliferator-activated Receptor α
Dowell, P., Ishmael, J. E., Avram, D., Peterson, V. J., Nevrivy, D. J., & Leid, M. E. (1997) · Journal of Biological Chemistry · doi:10.1074/jbc.272.52.33435 · Cited by 180
LPS-induced downregulation of MRP2 and BSEP in human liver is due to a posttranscriptional process
Elferink, M. G. L., Olinga, P., Draaisma, A. L., Merema, M. T., Faber, K. N., Slooff, M. J. H., Meijer, D. K. F., & Groothuis, G. M. M. (2004) · American Journal of Physiology-Gastrointestinal and Liver Physiology · doi:10.1152/ajpgi.00071.2004 · Cited by 180
Self-citationBile Salt Export Pump (BSEP/ABCB11) Can Transport a Nonbile Acid Substrate, Pravastatin
Hirano, M., Maeda, K., Hayashi, H., Kusuhara, H., & Sugiyama, Y. (2005) · Journal of Pharmacology and Experimental Therapeutics · doi:10.1124/jpet.105.084830 · Cited by 180
Self-citationJiang, G., Nepomuceno, L., Hopkins, K. J., & Sladek, F. M. (1995) · Molecular and Cellular Biology · doi:10.1128/mcb.15.9.5131 · Cited by 179
New Technologies and Screening Strategies for Hepatotoxicity: Use of In Vitro Models
Dambach, D. M., Andrews, B. A., & Moulin, F. (2005) · Toxicologic Pathology · doi:10.1080/01926230590522284 · Cited by 179
Regulation of CYP3A4 by the bile acid receptor FXR
Gnerre, C., ttler, S. B., Kaufmann, M., Looser, R., & Meyer, U. (2004) · Pharmacogenetics · doi:10.1097/00008571-200410000-00001 · Cited by 178
Immunologic distribution of an organic anion transport protein in rat liver and kidney
Bergwerk, A. J., Shi, X., Ford, A. C., KANAI, N., Jacquemin, E., Burk, R. D., Bai, S., Novikoff, P. M., Stieger, B., Meier, P. J., et al. (1996) · American Journal of Physiology-Gastrointestinal and Liver Physiology · doi:10.1152/ajpgi.1996.271.2.g231 · Cited by 178
Self-citationWege, H., Le, H. T., Chui, M. S., Liu, L., Wu, J. H., Giri, R. K., Malhi, H., Sappal, B. S., Kumaran, V., Gupta, S. K., et al. (2003) · Gastroenterology · doi:10.1053/gast.2003.50064 · Cited by 177
Saile, B., Knittel, T. E., Matthes, N., Schott, P., & Ramadori, G. P. (1997) · Europe PMC (PubMed Central) · Cited by 177
Concave microwell based size-controllable hepatosphere as a three-dimensional liver tissue model
Wong, S. F., No, D. Y., Choi, Y. Y., Kim, D., Chung, B. G., & Lee, S. (2011) · Biomaterials · doi:10.1016/j.biomaterials.2011.07.028 · Cited by 177
Self-citationRuiz, S., Diep, D. H., Gore, A., Panopoulos, A. D., Montserrat, N., Plongthongkum, N., Kumar, S., Fung, H.-L., Giorgetti, A., Bilić, J., et al. (2012) · Proceedings of the National Academy of Sciences · doi:10.1073/pnas.1202352109 · Cited by 177
Organic Anion Transporting Polypeptide Mediates Organic Anion/HCO3− Exchange
Satlin, L. M., Amin, V., & Wolkoff, A. W. (1997) · Journal of Biological Chemistry · doi:10.1074/jbc.272.42.26340 · Cited by 177
Recent advances in the isolation of liver cells
Alpini, G. D., Phillips, J. O., Vroman, B. T., & LaRusso, N. F. (1994) · Hepatology · doi:10.1002/hep.1840200231 · Cited by 176
Hepatotoxicity associated with antiepileptic drugs
Bjornsson, E. S. (2008) · Acta Neurologica Scandinavica · doi:10.1111/j.1600-0404.2008.01009.x · Cited by 176
Cattori, V., van Montfoort, J. E., Stieger, B., Landmann, L., Meijer, D. K. F., Winterhalter, K. H., Meier, P. J., & Hagenbuch, B. (2001) · Pflügers Archiv - European Journal of Physiology · doi:10.1007/s004240100697 · Cited by 175
Self-citationEnterohepatic transport of bile salts and genetics of cholestasis
Pauli‐Magnus, C., Stieger, B., Meier, Y., Kullak-Ublick, G. A., & Meier, P. J. (2005) · Journal of Hepatology · doi:10.1016/j.jhep.2005.03.017 · Cited by 175
Self-citationWang, X. X., Jiang, T., Shen, Y., Adorini, L., Pruzanski, M., Gonzalez, F. J., Scherzer, P., Lewis, L., Miyazaki‐Anzai, S., & Levi, M. (2009) · American Journal of Physiology-Renal Physiology · doi:10.1152/ajprenal.00404.2009 · Cited by 175
Evseenko, D. A., Paxton, J. W., & Keelan, J. A. (2005) · American Journal of Physiology-Regulatory, Integrative and Comparative Physiology · doi:10.1152/ajpregu.00630.2005 · Cited by 175
Wnt/β-catenin signaling mediates oval cell response in rodents
Apte, U. M., Thompson, M. D., Cui, S., Liu, B., Cieply, B. W., & Monga, S. P. (2007) · Hepatology · doi:10.1002/hep.21973 · Cited by 174
Briz, Ó., Serrano, M. A., Macı́as, R. I. R., González‐Gallego, J., & Marı́n, J. J. G. (2003) · Biochemical Journal · doi:10.1042/bj20030034 · Cited by 174
Kullak‐Ublick, G., Glasa, J., Boker, C. A., Oswald, M., Grützner, U., Hagenbuch, B., Stieger, B., Pj, M., Beuers, U. H., Kramer, W., et al. (1997) · Gastroenterology · doi:10.1053/gast.1997.v113.pm9322525 · Cited by 173
Self-citationCytochromes P450 Expression Systems
Gonzalez, F. J., & Korzekwa, K. (1995) · The Annual Review of Pharmacology and Toxicology · doi:10.1146/annurev.pa.35.040195.002101 · Cited by 173
Galactose-carrying polymers as extracellular matrices for liver tissue engineering
Cho, C. S., Seo, S. J., Park, I., Kim, S. H., Kim, T. H., Hoshiba, T., Harada, I., & Akaike, T. (2005) · Biomaterials · doi:10.1016/j.biomaterials.2005.06.008 · Cited by 173
Self-citationThe pivotal role of hepatocytes in drug discovery
Soars, M. G., McGinnity, D. F., Grime, K., & Riley, R. J. (2006) · Chemico-Biological Interactions · doi:10.1016/j.cbi.2006.11.002 · Cited by 172
Sevenich, L., Schurigt, U., Sachse, K., Gajda, M. R., Werner, F., Müller, S., Vasiljeva, O. S., Schwinde, A., Klemm, N., Deussing, J. M., et al. (2010) · Proceedings of the National Academy of Sciences · doi:10.1073/pnas.0907240107 · Cited by 171
Effect of () variant alleles on the pharmacokinetics of pitavastatin in healthy volunteers
Chung, J., Cho, J., YU, K., Kim, J., Oh, D., JUNG, H., Lim, K. S., MOON, K., SHIN, S., & Jang, I. (2005) · Clinical Pharmacology & Therapeutics · doi:10.1016/j.clpt.2005.07.003 · Cited by 170
Shibata, Y., Takahashi, H., Chiba, M., & Ishii, Y. (2002) · Drug Metabolism and Disposition · doi:10.1124/dmd.30.8.892 · Cited by 170
Jung, D., Podvinec, M., Meyer, U., Mangelsdorf, D. J., Fried, M., Meier, P. J., & Kullak-Ublick, G. A. (2002) · Gastroenterology · doi:10.1053/gast.2002.33583 · Cited by 170
Self-citationFickert, P., Fuchsbichler, A., Moustafa, T., Wagner, M., Zollner, G., Halilbasic, E., Stöger, U., Arrese, M., Pizarro, M., Solís, N., et al. (2009) · The American Journal of Pathology · doi:10.2353/ajpath.2009.090114 · Cited by 169
Self-citationCarcinogenicity of 2,3,7,8‐tetrachlorodibenzo‐p‐dioxin in experimental models
Knerr, S., & Schrenk, D. (2006) · Molecular Nutrition & Food Research · doi:10.1002/mnfr.200600006 · Cited by 169
The steady state level of catalase compound I in isolated hemoglobin‐free perfused rat liver
Sies, H., & Chance, B. (1970) · FEBS Letters · doi:10.1016/0014-5793(70)80521-x · Cited by 169
In Vitro Organogenesis of Liver Tissuea
Griffith, L. G., Wu, B. M., Cima, M. J., Powers, M. J., Chaignaud, B. E., & Vacanti, J. P. (1997) · Annals of the New York Academy of Sciences · doi:10.1111/j.1749-6632.1997.tb52212.x · Cited by 169
Weiß, C., Kolluri, S. K., Kiefer, F., & Göttlicher, M. (1996) · Experimental Cell Research · doi:10.1006/excr.1996.0214 · Cited by 169
Pharmacogenetic Pathway Analysis of Docetaxel Elimination
Baker, S. D., Verweij, J., Cusatis, G., van Schaik, R., Marsh, S., Orwick, S., Franke, R. M., Hu, S., Schuetz, E., Lamba, V., et al. (2008) · Clinical Pharmacology & Therapeutics · doi:10.1038/clpt.2008.95 · Cited by 169
Marquez, B., & Françoise Van Bambeke, A. (2011) · Current Drug Targets · doi:10.2174/138945011795378504 · Cited by 169
In vitro analysis of a hepatic device with intrinsic microvascular-based channels
Carraro, A., Hsu, W.-M., Kulig, K. M., Cheung, W. S., Miller, M. L., Weinberg, E. J., Swart, E. F., Kaazempur-Mofrad, M., Borenstein, J. T., Vacanti, J. P., et al. (2008) · Biomedical Microdevices · doi:10.1007/s10544-008-9194-3 · Cited by 168
Bhandari, R., Riccalton-Banks, L., Lewis, A. L., Fry, J. R., Hammond, A. H., Tendler, S. J. B., & Shakesheff, K. M. (2001) · Tissue Engineering · doi:10.1089/10763270152044206 · Cited by 168
Quistorff, B. (1985) · Biochemical Journal · doi:10.1042/bj2290221 · Cited by 168
Differentiation of Human Embryonic Stem Cells After Transplantation in Immune‐Deficient Mice
Przyborski, S. A. (2005) · Stem Cells · doi:10.1634/stemcells.2005-0014 · Cited by 168
Self-citationStinchcombe, S., Buchmann, A., Bock, K. W., & Schwarz, M. (1995) · Carcinogenesis · doi:10.1093/carcin/16.6.1271 · Cited by 167
Self-citationDawson, P. A., Mychaleckyj, J. C., Fossey, S. C., Mihic, S. J., Craddock, A. L., & Bowden, D. W. (2001) · Molecular Genetics and Metabolism · doi:10.1006/mgme.2001.3212 · Cited by 167
Three-Dimensional Primary Hepatocyte Culture in Synthetic Self-Assembling Peptide Hydrogel
Wang, S., Nagrath, D., Chen, P. C., Francois Berthiaume, B., & Yarmush, M. L. (2008) · Tissue Engineering Part A · doi:10.1089/tea.2007.0143 · Cited by 167
Derivation of Induced Pluripotent Stem Cells from Human Peripheral Blood T Lymphocytes
Brown, M. E., Rondon, E., Rajesh, D., Mack, A. A., Lewis, R. L., Feng, X., Zitur, L. J., Learish, R. D., & Nuwaysir, E. F. (2010) · PLoS ONE · doi:10.1371/journal.pone.0011373 · Cited by 167
Bile acid interactions with cholangiocytes
Xia, X. (2006) · World Journal of Gastroenterology · doi:10.3748/wjg.v12.i22.3553 · Cited by 166
A hidden oncogenic positive feedback loop caused by crosstalk between Wnt and ERK pathways
Kim, D., Rath, O., Kolch, W., & Cho, K.-H. (2007) · Oncogene · doi:10.1038/sj.onc.1210230 · Cited by 166
Stabilization of β-catenin affects mouse embryonic liver growth and hepatoblast fate
Decaens, T., Godard, C., de Reyniès, A., Rickman, D. S., Tronche, F., Couty, J., Perret, C., & Colnot, S. (2007) · Hepatology · doi:10.1002/hep.21952 · Cited by 166
III. Bile acids and nuclear receptors
Chiang, J. Y. L. (2003) · American Journal of Physiology-Gastrointestinal and Liver Physiology · doi:10.1152/ajpgi.00417.2002 · Cited by 165
Drasdo, D., Hoehme, S., & Block, M. (2007) · Journal of Statistical Physics · doi:10.1007/s10955-007-9289-x · Cited by 165
Self-citationWnt/β-Catenin Signaling in Murine Hepatic Transit Amplifying Progenitor Cells
Hu, M., Kurobe, M., Jeong, Y. J., Fuerer, C., Ghole, S. A., Nusse, R., & Sylvester, K. G. (2007) · Gastroenterology · doi:10.1053/j.gastro.2007.08.036 · Cited by 164
Aydinlik, H., Nguyen, T. D., Moennikes, O., Buchmann, A., & Schwarz, M. (2001) · Oncogene · doi:10.1038/sj.onc.1204982 · Cited by 164
Self-citationBöhme, M., Müller, M. M., Leier, I., Jedlitschky, G., & KEPPLER, D. O. R. (1994) · Gastroenterology · doi:10.1016/0016-5085(94)90084-1 · Cited by 164
Distinct response to dioxin in an arylhydrocarbon receptor (AHR)-humanized mouse
Moriguchi, T., Motohashi, H., Hosoya, T., Nakajima, O., Takahashi, S., Ohsako, S., Aoki, Y., Nishimura, N., Tohyama, C., Fujii-Kuriyama, Y., et al. (2003) · Proceedings of the National Academy of Sciences · doi:10.1073/pnas.1037886100 · Cited by 164
Fukuda, J., Sakai, Y., & Nakazawa, K. (2005) · Biomaterials · doi:10.1016/j.biomaterials.2005.07.031 · Cited by 163
Drug-Induced Liver Injury in Humans: The Case of Ximelagatran
Keisu, M., & Andersson, T. B. (2009) · Handbook of experimental pharmacology · doi:10.1007/978-3-642-00663-0_13 · Cited by 163
Nowak, M., Gaines, G. C., Rosenberg, J. J., Minter, R. M., Bahjat, F. R., Rectenwald, J. E., MacKay, S. L. D., Edwards, C. K., & Moldawer, L. L. (2000) · American Journal of Physiology-Regulatory, Integrative and Comparative Physiology · doi:10.1152/ajpregu.2000.278.5.r1202 · Cited by 162
Galactosylated chitosan as a synthetic extracellular matrix for hepatocytes attachment
Park, I., Yang, J., Jeong, H., Bom, H., Harada, I., Akaike, T., Kim, S., & Cho, C. (2003) · Biomaterials · doi:10.1016/s0142-9612(03)00108-x · Cited by 162
Self-citationCharacteristic Expression Profiles Induced by Genotoxic Carcinogens in Rat Liver
Ellinger-Ziegelbauer, H. C., Stuart, B. P., Wahle, B., Bomann, W. H., & Ahr, H.-J. (2003) · Toxicological Sciences · doi:10.1093/toxsci/kfh016 · Cited by 162
A role for constitutive androstane receptor in the regulation of human intestinal MDR1 expression
Burk, O., Arnold, K. A., Geick, A., Tegude, H., & Eichelbaum, M. F. (2005) · Biological Chemistry · doi:10.1515/bc.2005.060 · Cited by 162
Shaw, P. J., Hopfensperger, M. J., Ganey, P. E., & Roth, R. A. (2007) · Toxicological Sciences · doi:10.1093/toxsci/kfm218 · Cited by 161
Smith, N. F., Marsh, S., Scott-Horton, T. J., Hamada, A., Mielke, S., Mross, K. B., Figg, W. D., Verweij, J., McLeod, H. L., & Sparreboom, A. (2006) · Clinical Pharmacology & Therapeutics · doi:10.1038/sj.clpt.6100011 · Cited by 161
Drug Hypersensitivity and Human Leukocyte Antigens of the Major Histocompatibility Complex
Bharadwaj, M., Illing, P. T., Theodossis, A., Purcell, A. W., Rossjohn, J., & McCluskey, J. (2011) · The Annual Review of Pharmacology and Toxicology · doi:10.1146/annurev-pharmtox-010611-134701 · Cited by 160
Hepatocanalicular Transport Defects: Pathophysiologic Mechanisms of Rare Diseases
Elferink, R. P. J. O., Paulusma, C. C., & Groen, A. K. (2006) · Gastroenterology · doi:10.1053/j.gastro.2005.08.052 · Cited by 159
Elimination, blocking, and activation of macrophages: three of a kind?
van Rooijen, N., & Sanders, A. (1997) · Journal of Leukocyte Biology · doi:10.1002/jlb.62.6.702 · Cited by 159
Early Hepatic Microvascular Injury in Response to Acetaminophen Toxicity
ITO, Y., BETHEA, N. W., ABRIL, E. R., & MCCUSKEY, R. S. (2003) · Microcirculation · doi:10.1038/sj.mn.7800204 · Cited by 158
Chu, X., Kato, Y., Niinuma, K., Sudo, K.-I., Hakusui, H., & Sugiyama, Y. (1997) · Journal of Pharmacology and Experimental Therapeutics · doi:10.1016/s0022-3565(24)36601-7 · Cited by 158
Self-citationTakagi, S., Nakajima, M., Kida, K., Yamaura, Y., Fukami, T., & Yokoi, T. (2009) · Journal of Biological Chemistry · doi:10.1074/jbc.m109.085431 · Cited by 158
Johansson, L., Båvner, A., Thomsen, J. S., Färnegårdh, M., Gustafsson, J.-Α., & Treuter, E. (2000) · Molecular and Cellular Biology · doi:10.1128/mcb.20.4.1124-1133.2000 · Cited by 158
Repression of Farnesoid X Receptor during the Acute Phase Response
Kim, M. S., Shigenaga, J. K., Moser, A., Feingold, K. R., & Grünfeld, C. (2003) · Journal of Biological Chemistry · doi:10.1074/jbc.m212633200 · Cited by 157
Design of Custom-Shaped Vascularized Tissues Using Microtissue Spheroids as Minimal Building Units
Kelm, J. M., Djonov, V., Ittner, L. M., Fluri, D. A., Born, W., Hoerstrup, S. P., & Fussenegger, M. (2006) · Tissue Engineering · doi:10.1089/ten.2006.12.2151 · Cited by 157
Self-citationBiliary excretion of bile acid conjugates in a hyperbilirubinemic mutant Sprague-Dawley rat,
Takikawa, H., Sano, N., Narita, T., Uchida, Y., Yamanaka, M., Horie, T., Mikami, T., & Tagaya, O. (1991) · Hepatology · doi:10.1002/hep.1840140223 · Cited by 157
Mechanisms of liver disease: cross-talk between the NF-κB and JNK pathways
Papa, S., Bubici, C., Zazzeroni, F., & Franzoso, G. (2009) · bchm · doi:10.1515/bc.2009.111 · Cited by 156
Yamashita, Y., Shimada, M., Harimoto, N., Rikimaru, T., Shirabe, K., Tanaka, S., & Sugimachi, K. (2002) · International Journal of Cancer · doi:10.1002/ijc.10699 · Cited by 156
Echchgadda, I., Song, C. S., Roy, A. K., & Chatterjee, B. (2004) · Molecular Pharmacology · doi:10.1124/mol.65.3.720 · Cited by 156
Direct Control of Glycogen Metabolism in the Perfused Rat Liver by the Sympathetic Innervation
Hartmann, H., Beckh, K., & Jungermann, K. A. (1982) · European Journal of Biochemistry · doi:10.1111/j.1432-1033.1982.tb06562.x · Cited by 156
Yoshida, K. J., Maeda, K., & Sugiyama, Y. (2012) · Clinical Pharmacology & Therapeutics · doi:10.1038/clpt.2011.351 · Cited by 156
Self-citationIsmair, M. G., Stieger, B., Cattori, V., Hagenbuch, B., Fried, M., Meier, P. J., & Kullak-Ublick, G. A. (2001) · Gastroenterology · doi:10.1053/gast.2001.28704 · Cited by 156
Self-citationThe Pathophysiology of Biliary Obstruction and Its Effect on Phagocytic and Immune Function
Scott‐Conner, C. E. H., & Grogan, J. B. (1994) · Journal of Surgical Research · doi:10.1006/jsre.1994.1151 · Cited by 155
Research works printed but not linked: 9
- Bode JG (2011) Inflammation and liver regeneration. In: Häussinger D (ed) Liver regneration. DeGruyter Verlag, Berlin
- Bücher T, Sies H (1976) Mitochondrial and cytosolic redox states in perfused rat liver: methods and problems in metabolic compartmentation. In: Tager jm WJ, Söling D (eds) Use of isolated liver cells and kidney tubules in metabolic studies. North Holland Publishing Company/American Elsevier, New York/Amsterdam
- EPA (2012) EPA’s reanalysis of key issues related to dioxin toxicity and response to NAS Comments. Environmental Protection Agency (EPA), Washington, DC
- Hallifax D, Foster JA, Houston JB (2010) Prediction of human metabolic clearance from in vitro systems: retrospective analysis and prospective view. Pharm Res 27:2150–2161 · DOI
- ITC (International Transporter Consortium) (2010) Membrane transporters in drug development (Report from the FDA Critical Path Workshop). Nat Rev Drug Discov 9:215–236 · DOI · Paper page
- Lamers W, Moorman A, Charles R (1989) The metabolic lobulus, a key to the architecture of the liver. In: Revisiones Sobre Biologia Celular, Springer, New York
- Sahin S (2003) Perfused liver preparation and its applications. FABAD J Pharm Sci 28:39–49
- Waddington CH (1942) The epigenotype. Endeavour 1:18–20
- Warburg O (1923) Versuche an überlebendem Karzinomgewebe. Biochem Z 142:317
Cited by
Sorted by citations
Current advances and future perspectives in extrusion-based bioprinting
Ozbolat, I. T., & Hospodiuk, M. (2015) · Biomaterials · doi:10.1016/j.biomaterials.2015.10.076 · Cited by 1,642
EASL Clinical Practice Guidelines: Drug-induced liver injury
Andrade, R. J., Aithal, G. P., Björnsson, E. S., Kaplowitz, N., Kullak-Ublick, G. A., Larrey, D., & Karlsen, T. H. (2019) · Journal of Hepatology · doi:10.1016/j.jhep.2019.02.014 · Cited by 1,276
Self-citationBell, C. C., Hendriks, D. F. G., Moro, S. M. L., Ellis, E., Walsh, J., Renblom, A., Fredriksson Puigvert, L., Dankers, A. C. A., Jacobs, F., Snoeys, J., et al. (2016) · Scientific Reports · doi:10.1038/srep25187 · Cited by 739
Self-citationOrgans-on-a-Chip: A Fast Track for Engineered Human Tissues in Drug Development
Ronaldson-Bouchard, K., & Vunjak-Novakovic, G. (2018) · Cell Stem Cell · doi:10.1016/j.stem.2018.02.011 · Cited by 657
Du, K., Ramachandran, A., & Jaeschke, H. (2016) · Redox Biology · doi:10.1016/j.redox.2016.10.001 · Cited by 573
Self-citation
Metadata
- Authors
- Godoy, P., Hewitt, N. J., Albrecht, U., Andersen, M. E., Ansari, N., Bhattacharya, S., Bode, J. G., Bolleyn, J., Borner, C., Böttger, J., Braeuning, A., Budinsky, R. A., Burkhardt, B., Cameron, N. R., Camussi, G., Cho, C.-S., Choi, Y.-J., Craig Rowlands, J., Dahmen, U., Damm, G., Dirsch, O., Donato, M. T., Dong, J., Dooley, S., Drasdo, D., Eakins, R., Ferreira, K. S., Fonsato, V., Fraczek, J., Gebhardt, R., Gibson, A., Glanemann, M., Goldring, C. E. P., Gómez-Lechón, M. J., Groothuis, G. M. M., Gustavsson, L., Guyot, C., Hallifax, D., Hammad, S., Hayward, A., Häussinger, D., Hellerbrand, C., Hewitt, P., Hoehme, S., Holzhütter, H.-G., Houston, J. B., Hrach, J., Ito, K., Jaeschke, H., Keitel, V., Kelm, J. M., Kevin Park, B., Kordes, C., Kullak-Ublick, G. A., LeCluyse, E. L., Lu, P., Luebke-Wheeler, J., Lutz, A., Maltman, D. J., Matz-Soja, M., McMullen, P., Merfort, I., Messner, S., Meyer, C., Mwinyi, J., Naisbitt, D. J., Nussler, A. K., Olinga, P., Pampaloni, F., Pi, J., Pluta, L., Przyborski, S. A., Ramachandran, A., Rogiers, V., Rowe, C., Schelcher, C., Schmich, K., Schwarz, M., Singh, B., Stelzer, E. H. K., Stieger, B., Stöber, R., Sugiyama, Y., Tetta, C., Thasler, W. E., Vanhaecke, T., Vinken, M., Weiss, T. S., Widera, A., Woods, C. G., Xu, J. J., Yarborough, K. M., & Hengstler, J. G.
- Affiliations
- University of Zurich (CH)
- Leibniz Research Centre for Working Environment and Human Factors (DE)
- The Hamner Institutes for Health Sciences (US)
- Goethe University Frankfurt (DE)
- Vrije Universiteit Brussel (BE)
- University of Freiburg (DE)
- Leipzig University (DE)
- Dow Chemical (United States) (US)
- Durham University (GB)
- Seoul National University (KR)
- Instituto de Investigación Sanitaria La Fe (ES)
- Heidelberg University (DE)
- University of Liverpool (GB)
- University of Groningen (NL)
- Lund University (SE)
- University of Manchester (GB)
- South Valley University (EG)
- Heinrich Heine University Düsseldorf (DE)
- University Hospital Regensburg (DE)
- Merck KGaA, Darmstadt (Germany) (DE)
- Charité – Universitätsmedizin Berlin (DE)
- Musashino University (JP)
- University Hospital Zurich (CH)
- Merck & Co., Inc., Rahway, NJ, USA (United States) (US)
- Corresponding author
- Hewitt, Nicola J.
- ORCID
- Hewitt, Nicola J.
- Andersen, Melvin E.
- Bhattacharya, Sudin
- Bode, Johannes Georg
- Borner, Christoph
- Böttger, Jan
- Braeuning, Albert
- Budinsky, Robert A.
- Cameron, Neil R.
- Camussi, Giovanni
- Cho, Chong-Su
- Choi, Yun-Jaie
- Dahmen, Uta
- Damm, Georg
- Dirsch, Olaf
- Donato, María Teresa
- Dong, Jian
- Dooley, Steven
- Drasdo, Dirk
- Gibson, Andrew
- Glanemann, Matthias
- Groothuis, Geny M. M.
- Hallifax, David
- Hammad, Seddik
- Hayward, Adam
- Häussinger, Dieter
- Hellerbrand, Claus
- Hewitt, Philip
- Hoehme, Stefan
- Holzhütter, Hermann-Georg
- Houston, J. Brian
- Ito, Kiyomi
- Jaeschke, Hartmut
- Keitel, Verena
- Kordes, Claus
- Kullak-Ublick, Gerd A.
- LeCluyse, Edward L.
- Maltman, Daniel J.
- McMullen, Patrick
- Merfort, Irmgard
- Meyer, Christoph
- Mwinyi, Jessica
- Naisbitt, Dean J.
- Nussler, Andreas K.
- Olinga, Peter
- Pampaloni, Francesco
- Pi, Jingbo
- Pluta, Linda
- Przyborski, Stefan A.
- Ramachandran, Anup
- Rogiers, Vera
- Schwarz, Michael
- Singh, Bijay
- Stelzer, Ernst H. K.
- Stieger, Bruno
- Sugiyama, Yuichi
- Vanhaecke, Tamara
- Vinken, Mathieu
- Weiss, Thomas S.
- Woods, Courtney G.
- Hengstler, Jan G.
- Venue
- Archives of Toxicology
- Published
- 2013-08
- Volume
- 87
- Issue
- 8
- Pages
- 1315-1530
- ISSN
- 0340-5761 (ISSN-L)
- 1432-0738
- PMC
- PMC3753504
- OpenAlex
- W2134520937
- Cited by
- 1,280
- References
- 1,862
- Citations by year
- 2026: 54 · 2025: 63 · 2024: 59 · 2023: 80 · 2022: 98 · 2021: 96 · 2020: 130 · 2019: 132 · 2018: 129 · 2017: 102 · 2016: 118 · 2015: 110 · 2014: 91 · 2013: 12
- FWCI
- 18.06
- Type
- journal article
- Language
- en
- Open access
- hybrid
- doi.org
- Licence
- Locations
- Archives of Toxicology (publishedVersion, other-oa)
- Europe PMC (PubMed Central) (publishedVersion)
- PubMed Central (publishedVersion, cc-by-nc)
- PubMed (publishedVersion)
- Research Explorer (The University of Manchester) (publishedVersion)
- University of Regensburg Publication Server (University of Regensburg) (acceptedVersion)
- Zurich Open Repository and Archive (University of Zurich) (acceptedVersion, other-oa)
- Durham Research Online (Durham University) (acceptedVersion, other-oa)
- Durham Research Online (Durham University) (submittedVersion, cc-by)
- HAL (submittedVersion)
- Institutional Research Information System University of Turin (University of Turin) (submittedVersion)
- Lund University Publications (Lund University) (submittedVersion, other-oa)
- University of Groningen research database (University of Groningen / Centre for Information Technology) (submittedVersion, cc-by)
- Repository of Digital Objects for Teaching Research and Culture (University of Valencia) (submittedVersion, cc-by-nc)
- VUBIR (Vrije Universiteit Brussel) (submittedVersion)
- Zurich Open Repository and Archive (University of Zurich) (submittedVersion, other-oa)
- Zurich Open Repository and Archive (University of Zurich)
- University of Regensburg Publication Server (University of Regensburg)
- Funders
- Leibniz-Institut für Arbeitsforschung an der TU Dortmund
- Deutsche Forschungsgemeinschaft (GRK1104, (EXC 294))
- Agence Nationale de la Recherche
- Bundesministerium für Bildung und Forschung
- Belgian Federal Science Policy Office
- Fonds Wetenschappelijk Onderzoek
- National Research Foundation of Korea
- Innoviris
- Universität Regensburg
- Vlaamse regering
- National Institutes of Health (AA12916)
- Biotechnology and Biological Sciences Research Council (1233823)
- Leibniz-Gemeinschaft
- Japan Society for the Promotion of Science (23590204)
- National Institute on Alcohol Abuse and Alcoholism (R56AA012916, R01AA012916)
- National Institute of Diabetes and Digestive and Kidney Diseases (R01DK070195)
- Topics
- Life Sciences › Pharmacology, Toxicology and Pharmaceutics › Pharmacology › Drug-Induced Hepatotoxicity and Protection
- Health Sciences › Medicine › Hepatology › Liver physiology and pathology
- Health Sciences › Veterinary › Small Animals › Animal testing and alternatives
- Keywords
- hepatotoxicity, primary hepatocytes, non-parenchymal liver cells, hepatocyte co-culture, precision-cut liver slices, isolated perfused liver, stem cell-derived hepatocytes, induced pluripotent stem cell-derived hepatocytes, nuclear receptors, Ras/MEK/ERK pathway, HNF4α, drug metabolism, ADME, drug interactions
- MeSH terms
- Animals, Gene Expression Regulation, Humans, Liver, Inactivation, Metabolic, Organ Culture Techniques, Signal Transduction, Receptors, Cytoplasmic and Nuclear, Toxicity Tests, Coculture Techniques, Hepatocytes, Toxicogenetics, Culture Techniques, High-Throughput Screening Assays
About these checks
Registry, retraction, Cites and statistics results are computed, not judged, with one exception: a printed reference that no index lists is read once by a model before it counts as a citation error. Claims are extracted by a model and kept only when their quote appears verbatim in the text; each cited source is then checked, with a model’s help, for whether it says what the claim relies on. Those verdicts can be wrong — read the claim’s quote and the cited source before relying on one.
Statistics and arithmetic are recomputed, not judged.
Confidence bands are shown only for fields calibrated on our annotated test set. None is calibrated yet, so no band is shown.
What counts as a claim ›How we measure confidence ›How we check this ›
Are you an author, or do you see a problem with this page? Request a review
