

The DOI matches its Crossref record; 167 of the 167 references it cites were found in a registry or an index; 55 of the 152 sources its claims cite were checked for support.
Corneal structure and transparency
Open accessAbstract
The corneal stroma plays several pivotal roles within the eye. Optically, it is the main refracting lens and thus has to combine almost perfect transmission of visible light with precise shape, in order to focus incoming light. Furthermore, mechanically it has to be extremely tough to protect the inner contents of the eye. These functions are governed by its structure at all hierarchical levels. The basic principles of corneal structure and transparency have been known for some time, but in recent years X-ray scattering and other methods have revealed that the details of this structure are far more complex than previously thought and that the intricacy of the arrangement of the collagenous lamellae provides the shape and the mechanical properties of the tissue. At the molecular level, modern technologies and theoretical modelling have started to explain exactly how the collagen fibrils are arranged within the stromal lamellae and how proteoglycans maintain this ultrastructure. In this review we describe the current state of knowledge about the three-dimensional stromal architecture at the microscopic level, and about the control mechanisms at the nanoscopic level that lead to optical transparency.
Overview
AI snapshot
Written from the paper’s full text.
TL;DR
This review synthesizes current knowledge of corneal stromal architecture and transparency, emphasizing that transparency arises from collagen fibril uniformity and short-range order rather than lamellar arrangement alone. It integrates X-ray scattering, electron tomography, nonlinear microscopy, and theoretical modelling to explain how proteoglycans and type V collagen regulate fibril spacing and diameter.
Key findings
- The stroma comprises nearly 90% of corneal thickness; the central human cornea has approximately 200 lamellae, with anterior lamellae highly interwoven and posterior lamellae less interlaced. Anterior lamellar insertions into Bowman’s layer average about 19°.
- Transparency depends on narrow collagen fibrils with uniform diameters and restricted centre-to-centre spacing. Fibrils contain about 300–400 triple-helical molecules per cross-section and about 70 microfibrils, with axial periodicity reduced from 67 nm to closer to 65 nm.
- Maurice calculated that independent scattering would leave only about 6% of incoming light to reach the retina; destructive interference from ordered fibrils cancels scattering in all directions except forward. If 20% of fibrils have twice the normal diameter, backward radiation arises and transparency is impaired.
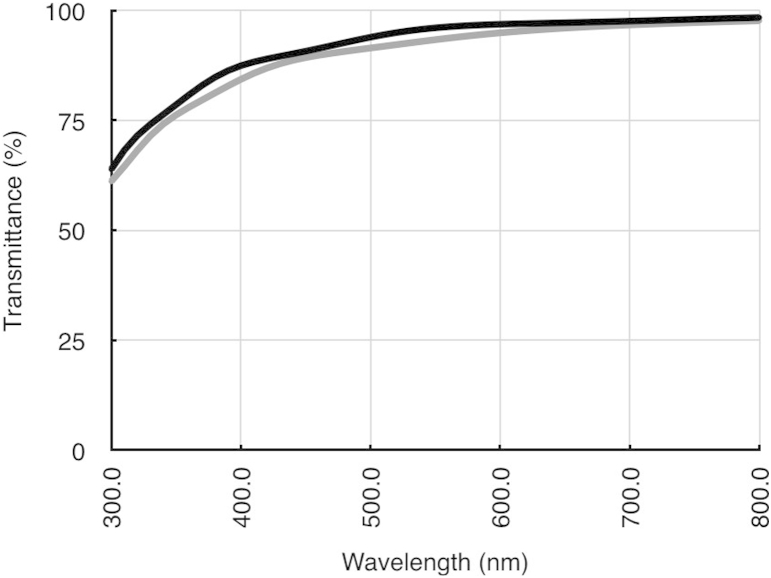
- Type V collagen limits fibril diameter, while proteoglycans maintain interfibrillar spacing. Across over 40 animal species, the volume fraction occupied by hydrated fibrils and interfibrillar GAGs was constant. Human corneal transmittance exceeds 90% between 500 and 1300 nm, reaches 80% at 380 nm, and drops at 1430 and 1950 nm due to water absorption; transmittance decreases outside the central 4 mm.
Methods
- Narrative review of corneal stromal structure and transparency, synthesizing evidence from X-ray scattering, electron tomography, second harmonic generation and other nonlinear microscopy, spectrophotometry, and theoretical modelling.
- Evidence base includes human, bovine, rabbit, chicken embryo, mutant mouse, and comparative data from over 40 animal species, plus unpublished results from the authors’ group.
- Main analysis is qualitative synthesis of structural and optical studies and theoretical models; no systematic review or meta-analysis is described.
Limitations
- Stated in the paper: X-ray scattering cannot directly image lamellae and must infer arrangement from diffraction patterns; it provides bulk averages and cannot resolve adjacent lamellae. Multiple scattering is not fully modelled, and photonic band structure theory has been applied only to a perfect hexagonal lattice. The existence of Dua’s layer/pre-Descemet’s layer remains controversial, and some cited findings are unpublished.
- Evident from the text: as a narrative review, it does not report a systematic search strategy or quantitative synthesis, and it relies substantially on animal models and unpublished or preliminary data rather than new primary experimental data.
Model-written summary. Check it against the paper before relying on it.
Integrity signals
Registry
Cites
Statistics
Figures
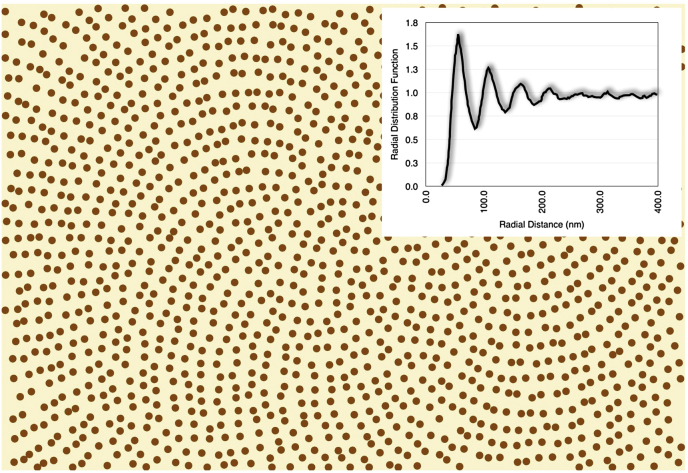
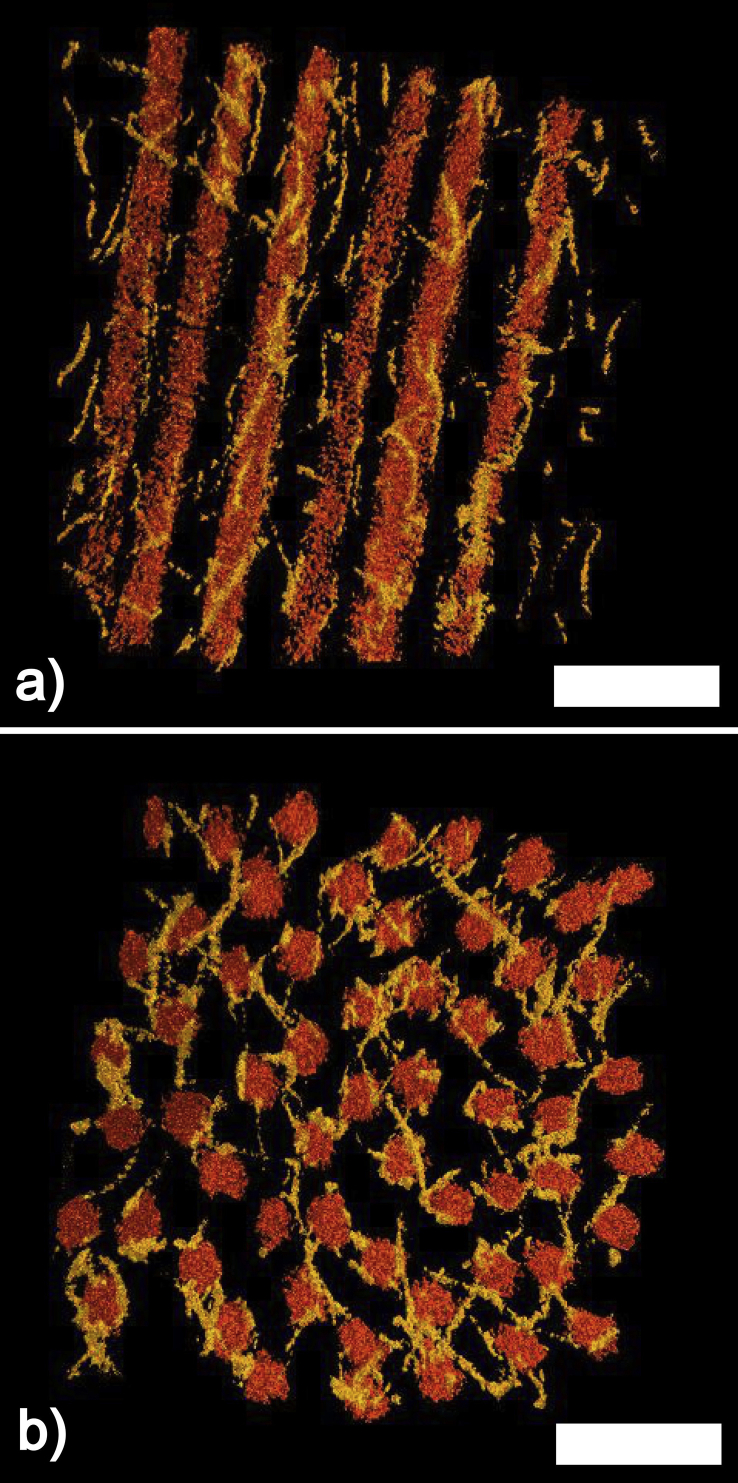
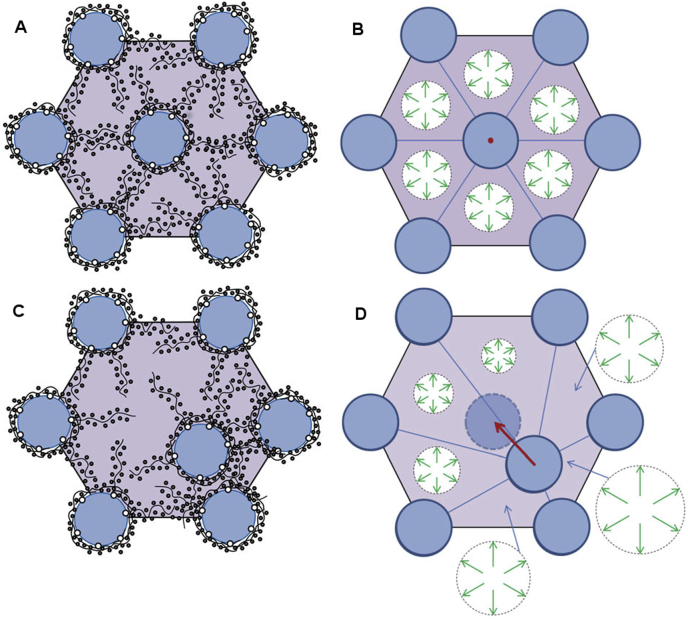
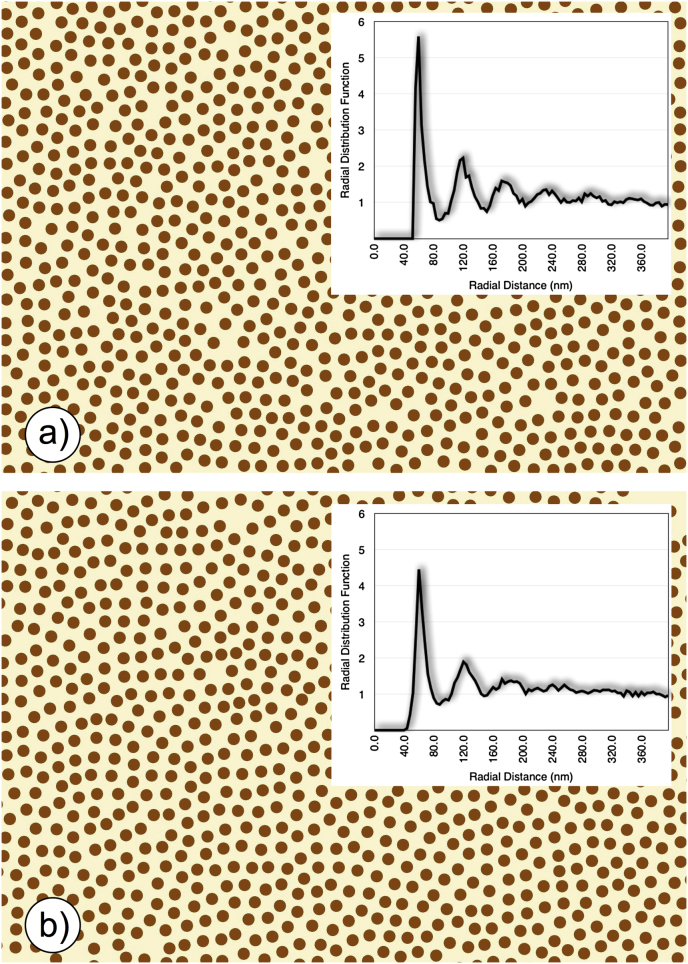
Verification
Claims the paper makes
50 No full text of the sources · 29 Own interpretation · 26 No basis given · 20 Partly supported · 16 Supported · 10 Sources not found · 8 Supported so far · 8 Own result · 3 Couldn’t confirm · 2 Not checked yet · 2 Own method · 1 Mixed support · accuracy not yet measured
Some cited sources support this claim and some don’t — read each source’s verdict below.
In the paper
“Theoretical calculations of light transmission (Doutch et al., 2008) attributed this to the increase in fibril radius that occurs in the periphery of the cornea (Boote et al., 2003).”
§ Corneal structure and transparency > Measurement of corneal transparency
What the sources say
- Partly supportedcites Doutch et al., 2008 sourceExperimental — accuracy not yet measured
The Discussion and “Modeling transmission in the human cornea” attribute increased peripheral scattering to larger fibrils, supporting the main attribution. The paper does not establish the claimed central 4 mm boundary: the Discussion calls the prepupillary zone approximately 3 mm in diameter, while the modeling section describes it as extending about 3 mm from the optical center. Its conclusion also identifies a change in refractive-index ratio as a contributor. (LLM, conf=0.86)
- Disputedcites Boote et al., 2003 sourceExperimental — accuracy not yet measured
The Results (Fig. 5 and Table 2, near p. 2944) say fibril diameter remained constant from the corneal center to the limbus, with no significant difference between the prepupillary and peripheral zones. The reported increase occurs across the limbus, not within the peripheral cornea, so this paper contradicts the attributed explanation. (LLM, conf=0.93)
Checked by a reasoning model — may be wrong.
plaindirect- Asserted: passes — The authors put it forward as true.
- Checkable: passes — It can be checked against evidence.
- Load-bearing: passes — The paper’s conclusions depend on it.
- Based: passes — The paper gives a reason why it holds.
- Partly supported
The cited sources support only part of this claim — read each source’s verdict below.
In the paper
“However, it plays no significant role in corneal transparency”
§ Corneal structure and transparency > Stromal micro- and nano-structure > Lamellae
What the sources say
- Partly supportedcites Meek et al., 2003 sourceExperimental — accuracy not yet measured
The Phototherapeutic keratectomy section (p. 9) predicts only a very small loss of light transmission despite poorly organised collagen in a thin layer newly deposited after PTK. That limited finding does not establish that lamellar arrangement plays no significant role in corneal transparency generally; the Direct summation of fields method section (p. 5) says that destroying fibril order increases scattering. (LLM, conf=0.84)
plain- Asserted: passes — The authors put it forward as true.
- Checkable: passes — It can be checked against evidence.
- Load-bearing: unclear — It is unclear whether the paper’s conclusions depend on it.
- Based: passes — The paper gives a reason why it holds.
- Partly supported
The cited sources support only part of this claim — read each source’s verdict below.
In the paper
“There are about 300–400 triple-helical molecules within the cross-section of a fibril, depending on the species (Meek and Leonard, 1993, Holmes and Kadler, 2005)”
§ Corneal structure and transparency > Stromal micro- and nano-structure > Collagen fibrils
What the sources say
- Partly supportedcites Meek and Leonard, 1993 sourceExperimental — accuracy not yet measured
The Results and Discussion (page unavailable) estimate the number of collagen molecules per fibril cross-section and say that this number differs between species. The accessible passage points to Table 3 for the estimates, but our copy does not provide readable table values establishing the claimed range of about 300–400. (LLM, conf=0.82)
- Not checked — no full text of the sourcecites Holmes and Kadler, 2005 source
plain- Asserted: passes — The authors put it forward as true.
- Checkable: passes — It can be checked against evidence.
- Load-bearing: unclear — It is unclear whether the paper’s conclusions depend on it.
- Based: passes — The paper gives a reason why it holds.
- Partly supported
Every source the paper cites for this claim was checked and supports it.
In the paper
“and seems to contain collagen fibrils with a larger diameter to those in the central cornea (Boote et al., 2011).”
§ Corneal structure and transparency > Stromal micro- and nano-structure > Lamellae
What the sources say
- Supportedcites Boote et al., 2011 source
The section on collagen fibril diameters from central cornea to limbus (Fig. 7) reports that fibril diameter remained constant within the central 6 mm and increased sharply outside it. This supports the comparison between peripheral and central corneal fibrils. (LLM, conf=0.93)
hedgedcorrelational- Asserted: passes — The authors put it forward as true.
- Checkable: passes — It can be checked against evidence.
- Load-bearing: unclear — It is unclear whether the paper’s conclusions depend on it.
- Based: passes — The paper gives a reason why it holds.
- Supported
The sources with a verdict support this claim; the rest weren’t checked yet, have no full text we could read, or their verdicts aren’t rated yet.
In the paper
“In addition, stromal interweaving in the peripheral cornea seems to extend to the deeper posterior lamellae (Radner et al., 1998, Abass et al., 2015).”
§ Corneal structure and transparency > Stromal micro- and nano-structure > Lamellae
What the sources say
- Not checked — no full text of the sourcecites Radner et al., 1998 source
- Supportedcites Abass et al., 2015 source
The Discussion’s figure 12 description states that, in the peripheral cornea between 8 and 10 mm, lamellar interweaving extends through the whole tissue thickness. That includes the deeper posterior lamellae and supports the citing sentence’s qualified wording. (LLM, conf=0.94)
hedgedcorrelational- Asserted: passes — The authors put it forward as true.
- Checkable: passes — It can be checked against evidence.
- Load-bearing: unclear — It is unclear whether the paper’s conclusions depend on it.
- Based: passes — The paper gives a reason why it holds.
The sources with a verdict support this claim; the rest weren’t checked yet, have no full text we could read, or their verdicts aren’t rated yet.
In the paper
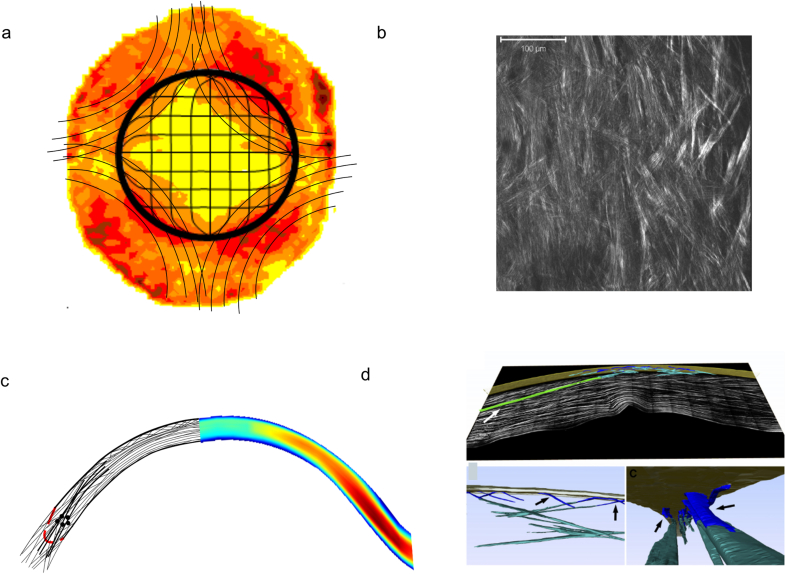
“Both scanning electron microscopy (Radner et al., 1998) and non-linear SHG microscopy (Winkler et al., 2015) have shown that, in the human cornea, there is no orthogonal arrangement between adjacent lamellae (Fig. 1b), not even in the posterior stroma.”
§ Corneal structure and transparency > Stromal micro- and nano-structure > Lamellae
What the sources say
- Not checked — no full text of the sourcecites Radner et al., 1998 source
- Supportedcites Winkler et al., 2015 source
The Lamellar Orthogonality section identifies the human cornea as lacking an orthogonal arrangement between adjacent lamellae throughout the entire stromal thickness. That includes the posterior stroma. (LLM, conf=0.94)
boosted- Asserted: passes — The authors put it forward as true.
- Checkable: passes — It can be checked against evidence.
- Load-bearing: unclear — It is unclear whether the paper’s conclusions depend on it.
- Based: passes — The paper gives a reason why it holds.
The cited sources support only part of this claim — read each source’s verdict below.
In the paper
“The arrangement of these putative structures seem to correspond with the sheer stress distribution in the peripheral cornea (Antony, 2015).”
§ Corneal structure and transparency > Stromal micro- and nano-structure > Lamellae
What the sources say
- Partly supportedcites Antony, 2015 sourceExperimental — accuracy not yet measured
The Results and Discussion report that the measured shear-stress profile correlates with the diamond-like structural architecture of the cornea. The paper describes this correlation for the cornea generally, not specifically for the peripheral cornea, so the location in the citing sentence is not established by our copy. (LLM, conf=0.82)
hedgedcorrelational- Asserted: passes — The authors put it forward as true.
- Checkable: passes — It can be checked against evidence.
- Load-bearing: passes — The paper’s conclusions depend on it.
- Based: passes — The paper gives a reason why it holds.
- Partly supported
Every source the paper cites for this claim was checked and supports it.
In the paper
“This network shows mirror symmetry between left and right eyes (Boote et al., 2006)”
§ Corneal structure and transparency > Stromal micro- and nano-structure > Lamellae
What the sources say
- Supportedcites Boote et al., 2006 source
The Collagen Distribution section reports a high degree of midline mirror symmetry in aligned-collagen contours between a right and left eye. The Discussion says a similar left–right trend appeared in the other specimens, supporting the paraphrase while allowing for variation between eyes. (LLM, conf=0.90)
plaincorrelational- Asserted: passes — The authors put it forward as true.
- Checkable: passes — It can be checked against evidence.
- Load-bearing: unclear — It is unclear whether the paper’s conclusions depend on it.
- Based: passes — The paper gives a reason why it holds.
- Supported
Every source the paper cites for this claim was checked and supports it.
In the paper
“Also in human corneas, Jester et al. (2010) were able to reconstruct the lamellar organisation through the full thickness of the cornea from limbus-to-limbus. The reconstructions demonstrated the interweaving of the anterior lamellae and their bow spring-like insertions in and out of Bowman's layer (Fig. 1d).”
§ Corneal structure and transparency > Stromal micro- and nano-structure > Lamellae
What the sources say
- Supportedcites Jester et al., 2010 source
The Methods describe imaging the entire human corneal slice from the superior to the inferior limbus and combining overlapping 3-D datasets into a tomograph. The Results describe reconstructed anterior lamellae that intertwine, insert into Bowman’s layer, and return to it in a ‘leaf spring’ or ‘bow’ shape. (LLM, conf=0.88)
boosted- Asserted: passes — The authors put it forward as true.
- Checkable: passes — It can be checked against evidence.
- Load-bearing: passes — The paper’s conclusions depend on it.
- Based: passes — The paper gives a reason why it holds.
- Supported
The cited sources support only part of this claim — read each source’s verdict below.
In the paper
“and that this bow spring-like arrangement provides structural support to maintain the shape of the anterior corneal surface (Winkler et al., 2013).”
§ Corneal structure and transparency > Stromal micro- and nano-structure > Lamellae
What the sources say
- Partly supportedcites Winkler et al., 2013 sourceExperimental — accuracy not yet measured
The Discussion says that interconnected transverse fibers in the anterior stroma likely stabilize corneal shape. It does not describe the anterior lamellae as a bow spring-like arrangement or establish that specific arrangement as the mechanism supporting the anterior surface. (LLM, conf=0.82)
plaindirect- Asserted: passes — The authors put it forward as true.
- Checkable: passes — It can be checked against evidence.
- Load-bearing: passes — The paper’s conclusions depend on it.
- Based: passes — The paper gives a reason why it holds.
- Partly supported
- Probably not a substantial claim. 26
- It may state two separate claims as one. 65
- The quote only partly states this claim. 2
Every source the paper cites for this claim was checked and supports it.
In the paper
“The corneal epithelium, on the other hand, is about 53 μm deep (Reinstein et al., 2008) and thus constitutes about 10% of the corneal thickness.”
§ Corneal structure and transparency > Introduction
What the sources say
- Supportedcites Reinstein et al., 2008 source
The Discussion reports an average corneal-vertex epithelial thickness of 53.4 ± 4.6 μm in normal eyes, supporting the approximately 53 μm figure to which the citation is attached. The subsequent 10% statement is presented as the citing authors’ inference, not a separate finding attributed to this source. (LLM, conf=0.94)
plain- Asserted: passes — The authors put it forward as true.
- Checkable: passes — It can be checked against evidence.
- Load-bearing: fails — The paper’s conclusions may not depend on it.
- Based: passes — The paper gives a reason why it holds.
Probably not a substantial claim. The paper’s conclusions may not depend on it. It may state two separate claims as one.
- Supported
The cited sources support only part of this claim — read each source’s verdict below.
In the paper
“Over the last decade there has been an upsurge in the use of non-linear microscopy, in particular second harmonic generation imaging, to provide qualitative (Han et al., 2005, Morishige et al., 2006, Teng et al., 2006, Bueno et al., 2011) and quantitative (Mega et al., 2012, Tuer et al., 2012, Ghazaryan et al., 2013) information about the lamellar organisation within the cornea, a technique that,”
§ Corneal structure and transparency > Stromal micro- and nano-structure > Lamellae
What the sources say
- Supportedcites Han et al., 2005 source
Han et al. is cited for qualitative information; the citing sentence assigns quantitative information to other papers. The Results and discussion section reports that SHG reveals the organisation of corneal collagen fibrils and describes its suitability for living-tissue studies and potential clinical use. The paper does not need to establish quantitative measurement to support the part attributed to it. (LLM, conf=0.88)
- Partly supportedcites Mega et al., 2012 sourceExperimental — accuracy not yet measured
The paper’s Abstract describes a method for quantifying collagen-lamellar orientation in corneal SHG images, supporting the quantitative part for which Mega et al. is cited. The experiments used a bovine cornea placed on a microscope cover slip; our copy does not establish the claimed potential for in vivo use. In the printed sentence, the qualitative citations are to other papers. (LLM, conf=0.86)
- Supportedcites Latour et al., 2012 source
The Discussion (§5.1) reports that polarization-resolved SHG characterizes corneal lamellar-domain orientation and structure, including in vivo imaging of rat corneas. The Conclusion (§6) says the method provides quantitative structural information and could have future in vivo diagnostic applications. (LLM, conf=0.92)
plaincorrelational- Asserted: passes — The authors put it forward as true.
- Checkable: passes — It can be checked against evidence.
- Load-bearing: unclear — It is unclear whether the paper’s conclusions depend on it.
- Based: passes — The paper gives a reason why it holds.
It may state two separate claims as one.
- Supported
Every source the paper cites for this claim was checked and supports it.
In the paper
“The posterior stroma can swell easily whereas the more interwoven anterior cannot (Müller et al., 2001).”
§ Corneal structure and transparency > Stromal micro- and nano-structure > Lamellae
What the sources say
- Supportedcites Müller et al., 2001 source
The Discussion describes swelling as decreasing from the posterior toward the anterior stroma and says the collagen lamellae become interwoven in the most anterior region (page not supplied). The Conclusions and Figure 2 caption report that this anterior region remains stable even under extreme swelling conditions, supporting the contrast in the citing sentence. (LLM, conf=0.92)
plaindirect- Asserted: passes — The authors put it forward as true.
- Checkable: passes — It can be checked against evidence.
- Load-bearing: unclear — It is unclear whether the paper’s conclusions depend on it.
- Based: passes — The paper gives a reason why it holds.
It may state two separate claims as one.
- Supported
The cited sources support only part of this claim — read each source’s verdict below.
In the paper
“and at the nanoscopic level, by the absence of pigments or blood vessels (in most species), and by the structure and organisation of the collagen fibrils within the lamellae (Meek et al., 2003).”
§ Corneal structure and transparency > Stromal micro- and nano-structure > Lamellae
What the sources say
- Partly supportedcites Meek et al., 2003 sourceExperimental — accuracy not yet measured
The discussion of corneal transparency (pp. 2–3) links light transmission to the structure and arrangement of collagen fibrils within lamellae. Our copy does not state that transparency depends on the absence of pigments or blood vessels, including the qualification about most species. (LLM, conf=0.88)
plaindirect- Asserted: passes — The authors put it forward as true.
- Checkable: passes — It can be checked against evidence.
- Load-bearing: fails — The paper’s conclusions may not depend on it.
- Based: passes — The paper gives a reason why it holds.
Probably not a substantial claim. The paper’s conclusions may not depend on it. It may state two separate claims as one.
- Partly supported
Every source the paper cites for this claim was checked and supports it.
In the paper
“The technique was recently used to show that mammalian corneas do not have an orthogonal arrangement of adjacent lamellae, whereas non-mammalian vertebrate corneas share a common orthogonal collagen structural organisation, which suggests that they have a divergent evolutionary background (Winkler et al., 2015).”
§ Corneal structure and transparency > Stromal micro- and nano-structure > Lamellae
What the sources say
- Supportedcites Winkler et al., 2015 source
The Results state that nonmammalian vertebrate corneas have nearly orthogonal neighboring collagen layers, whereas mammalian corneas lack that pattern. The Conclusions explicitly describe a common nonmammalian organization and say the distinct mammalian structure suggests a divergent evolutionary background. (LLM, conf=0.95)
hedgedcorrelational- Asserted: passes — The authors put it forward as true.
- Checkable: passes — It can be checked against evidence.
- Load-bearing: fails — The paper’s conclusions may not depend on it.
- Based: passes — The paper gives a reason why it holds.
Probably not a substantial claim. The paper’s conclusions may not depend on it. It may state two separate claims as one.
- Supported
The sources with a verdict support this claim; the rest weren’t checked yet, have no full text we could read, or their verdicts aren’t rated yet.
In the paper
“Across the anterior stroma, lamellae are highly interwoven (Radner et al., 1998) and randomly directed when observed en face (Abahussin et al., 2009).”
§ Corneal structure and transparency > Stromal micro- and nano-structure > Lamellae
What the sources say
- Not checked — no full text of the sourcecites Radner et al., 1998 source
- Supportedcites Abahussin et al., 2009 source
The discussion (p. 5161) reports an isotropic orientation of collagen fibrils in the anterior cornea, supporting the description of random directions when viewed en face. It notes that irregular orientation was most pronounced in the central 4 mm and that some lamellae farther out were orthogonally aligned. The interwoven description is attributed to Radner et al., not to this source. (LLM, conf=0.89)
plain- Asserted: passes — The authors put it forward as true.
- Checkable: passes — It can be checked against evidence.
- Load-bearing: unclear — It is unclear whether the paper’s conclusions depend on it.
- Based: passes — The paper gives a reason why it holds.
It may state two separate claims as one.
The cited sources support only part of this claim — read each source’s verdict below.
In the paper
“this property is defined at the microscopic level by the absence of scatter by corneal cells or by other structures that could cause local changes to the refractive index”
§ Corneal structure and transparency > Stromal micro- and nano-structure > Lamellae
What the sources say
- Partly supportedcites Meek et al., 2003 sourceExperimental — accuracy not yet measured
The Direct summation of fields method section (p. 5) links low scattering by corneal cells to their refractive indices, but calls the cells weak scatterers—not non-scatterers—and notes that their nuclei scatter. The discussion on p. 3 also says collagen fibrils scatter light because their refractive index differs from the surrounding material; transparency involves interference of that scattered light. Thus the paper supports the importance of limiting scatter, but not the claimed microscopic absence of it. (LLM, conf=0.84)
plain- Asserted: passes — The authors put it forward as true.
- Checkable: passes — It can be checked against evidence.
- Load-bearing: fails — The paper’s conclusions may not depend on it.
- Based: passes — The paper gives a reason why it holds.
Probably not a substantial claim. The paper’s conclusions may not depend on it.
- Partly supported
The cited sources support only part of this claim — read each source’s verdict below.
In the paper
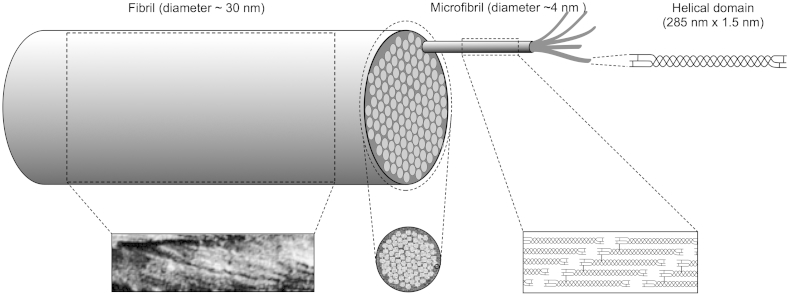
“This cross-linked rope-like structure with alternating twist at each hierarchical level conveys considerable strength to the narrow corneal fibrils, and is in contrast to the fibrils in the adjacent sclera, which are correspondingly wider and therefore have a more parallel arrangement of microfibrils within them (Yamamoto et al., 2000).”
§ Corneal structure and transparency > Stromal micro- and nano-structure > Collagen fibrils
What the sources say
- Partly supportedcites Yamamoto et al., 2000 sourceExperimental — accuracy not yet measured
Split into 2 atoms — 0 confirmed, 2 partially supported, 0 disputed, 0 misattributed, 0 unverifiable. Expand the claim to see per-atom verdicts.
plaindirect- Asserted: passes — The authors put it forward as true.
- Checkable: passes — It can be checked against evidence.
- Load-bearing: unclear — It is unclear whether the paper’s conclusions depend on it.
- Based: passes — The paper gives a reason why it holds.
It may state two separate claims as one.
- Partly supported
Every source the paper cites for this claim was checked and supports it.
In the paper
“From the reconstructions, it was evident that the collagen fibrils were not laying on a perfect hexagonal lattice, and also that there was nothing systematic in the geometry of the connections of adjacent or next nearest collagen fibrils.”
§ Corneal structure and transparency > Molecular mechanisms of corneal transparency
What the sources say
- Supportedcites Lewis et al., 2010 source
Split into 2 atoms — 2 confirmed, 0 partially supported, 0 disputed, 0 misattributed, 0 unverifiable. Expand the claim to see per-atom verdicts.
plain- Asserted: passes — The authors put it forward as true.
- Checkable: passes — It can be checked against evidence.
- Load-bearing: passes — The paper’s conclusions depend on it.
- Based: passes — The paper gives a reason why it holds.
It may state two separate claims as one.
- Supported
The cited sources support only part of this claim — read each source’s verdict below.
In the paper
“fibromodulin plays a major role in development of the peripheral cornea but its presence in the normal cornea is uncertain (Chen et al., 2010).”
§ Corneal structure and transparency > Stromal micro- and nano-structure > Proteoglycans
What the sources say
- Partly supportedcites Chen et al., 2010 sourceExperimental — accuracy not yet measured
The Discussion supports an important role for fibromodulin in peripheral corneal development. But although the Results call its presence in mature corneal stroma controversial, the paper then reports barely detectable levels at P90 and concludes that fibromodulin is not a component of mature corneal stroma. It does not leave its presence in the adult cornea uncertain. (LLM, conf=0.88)
plaindirect- Asserted: passes — The authors put it forward as true.
- Checkable: passes — It can be checked against evidence.
- Load-bearing: fails — The paper’s conclusions may not depend on it.
- Based: passes — The paper gives a reason why it holds.
Probably not a substantial claim. The paper’s conclusions may not depend on it. It may state two separate claims as one.
- Partly supported
The sources with a verdict support this claim; the rest weren’t checked yet, have no full text we could read, or their verdicts aren’t rated yet.
In the paper
“Microfibrils have a right-handed twist within the fibrils (Orgel et al., 2006), and are stabilised by covalent intermolecular and intramolecular crosslinks (Yamauchi et al., 1996).”
§ Corneal structure and transparency > Stromal micro- and nano-structure > Collagen fibrils
What the sources say
- Supportedcites Orgel et al., 2006 source
The Results and Discussion describe a collagen microfibril as five staggered molecules with a right-handed supertwist, supporting the part of the sentence attributed to Orgel et al. The crosslink-stabilisation clause is cited to Yamauchi et al., not to this source. (LLM, conf=0.94)
- Not checked — no full text of the sourcecites Yamauchi et al., 1996 source
plaindirect- Asserted: passes — The authors put it forward as true.
- Checkable: passes — It can be checked against evidence.
- Load-bearing: unclear — It is unclear whether the paper’s conclusions depend on it.
- Based: passes — The paper gives a reason why it holds.
It may state two separate claims as one.
- Supported
Every source the paper cites for this claim was checked and supports it.
In the paper
“Doutch found that not only does its appearance closely resemble the collagen fibril organization seen in micrographs, but also that the wavelength dependence of the predicted transparency matches very closely the experimental one.”
§ Corneal structure and transparency > Theoretical basis of corneal transparency > Fibril organisation and transparency
What the sources say
- Supportedcites Doutch (2009)
Split into 2 atoms — 2 confirmed, 0 partially supported, 0 disputed, 0 misattributed, 0 unverifiable. Expand the claim to see per-atom verdicts.
plaincorrelational- Asserted: passes — The authors put it forward as true.
- Checkable: passes — It can be checked against evidence.
- Load-bearing: fails — The paper’s conclusions may not depend on it.
- Based: passes — The paper gives a reason why it holds.
Probably not a substantial claim. The paper’s conclusions may not depend on it. It may state two separate claims as one.
- Supported
The cited sources support only part of this claim — read each source’s verdict below.
In the paper
“They are also a primary binding site for dermatan sulphate-containing proteoglycans (Scott and Haigh, 1988), which, as we will also see later, are necessary for preventing adjacent fibrils from fusing together (Chen and Birk, 2013).”
§ Corneal structure and transparency > Stromal micro- and nano-structure > Collagen fibrils
What the sources say
- Supportedcites Scott and Haigh, 1988 source
The Results identify chondroitin/dermatan sulphate-rich proteoglycan filaments in the collagen fibril gap zone at the d and e bands. The Discussion confirms that these bands are associated with chondroitin/dermatan sulphate proteoglycans. The separate claim about preventing fibril fusion is attributed to Chen and Birk (2013), not to Scott and Haigh. (LLM, conf=0.90)
- Partly supportedcites Chen and Birk, 2013 sourceExperimental — accuracy not yet measured
The section “Instructive roles in collagen fibrillogenesis” (page unavailable) says that proteoglycan glycosaminoglycans extend into the space between fibrils and can influence their spacing and organization. It does not say that dermatan sulphate-containing proteoglycans are necessary to prevent adjacent fibrils from fusing. The surface-binding-site clause is cited to Scott and Haigh, not Chen and Birk, and is not judged here. (LLM, conf=0.84)
plaindirect- Asserted: passes — The authors put it forward as true.
- Checkable: passes — It can be checked against evidence.
- Load-bearing: passes — The paper’s conclusions depend on it.
- Based: passes — The paper gives a reason why it holds.
It may state two separate claims as one.
- Supported
Every source the paper cites for this claim was checked and supports it.
In the paper
“The keratocytes are regarded as being quiescent but can be activated after injury generating myofibroblast precursors that can sometimes persist and cause corneal scarring due to their own opacity as well as their production of fibrotic tissue (Torreicelli and Wilson, 2014).”
§ Corneal structure and transparency > Theoretical basis of corneal transparency > Contribution of stromal cells
What the sources say
- Supportedcites Torreicelli and Wilson, 2014 source
Section 4, “Corneal opacity — development, persistence and regression” (page not provided), says keratocytes begin proliferating after injury and that this proliferation can generate myofibroblast precursors. It reports that after severe injury these cells may persist and contribute to stromal scarring through their own opacity and the disorganized extracellular matrix they produce. (LLM, conf=0.92)
hedgeddirect- Asserted: passes — The authors put it forward as true.
- Checkable: passes — It can be checked against evidence.
- Load-bearing: unclear — It is unclear whether the paper’s conclusions depend on it.
- Based: passes — The paper gives a reason why it holds.
It may state two separate claims as one.
- Supported
The cited sources support only part of this claim — read each source’s verdict below.
In the paper
“Corneal structural defects of this type are associated, for example, with genetic mutations involving proteoglycans (Chakravarti et al., 1998) which, ultimately, seem to have an effect on the repulsive forces between adjacent fibrils and allow them to fuse together.”
§ Corneal structure and transparency > Theoretical basis of corneal transparency > Fibril organisation and transparency
What the sources say
- Partly supportedcites Chakravarti et al., 1998 sourceExperimental — accuracy not yet measured
The Discussion reports corneal opacity in mice with a null mutation of the lumican gene, and its collagen-fibril section describes frequent lateral fusion of fibrils. The paper proposes that proteoglycan core proteins discourage lateral fusion, but it does not identify a change in repulsive forces between adjacent fibrils as the mechanism. (LLM, conf=0.85)
hedgedcorrelational- Asserted: passes — The authors put it forward as true.
- Checkable: passes — It can be checked against evidence.
- Load-bearing: unclear — It is unclear whether the paper’s conclusions depend on it.
- Based: passes — The paper gives a reason why it holds.
It may state two separate claims as one.
- Partly supported
Every source the paper cites for this claim was checked and supports it.
In the paper
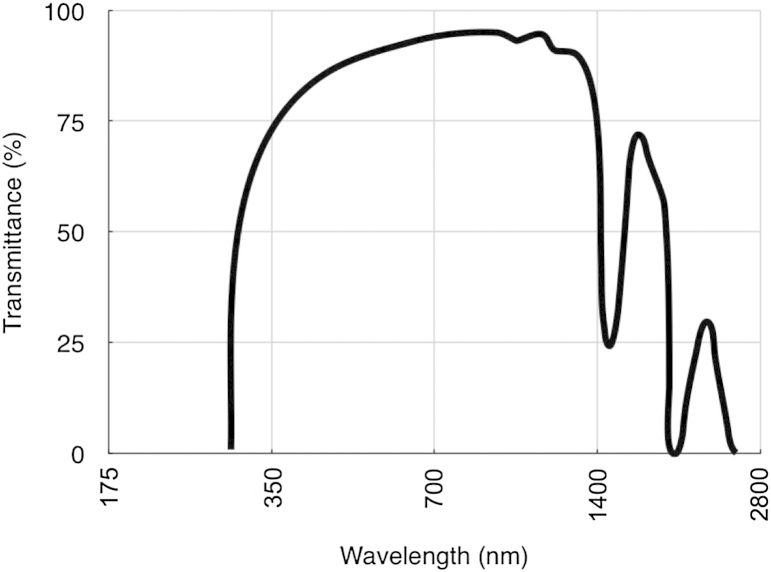
“We found that UV transmission through the cornea decreases from the centre to the periphery, and attributed this to a combination of scattering and absorption (Doutch et al., 2012).”
§ Corneal structure and transparency > Measurement of corneal transparency
What the sources say
- Supportedcites Doutch et al., 2012 source
The Abstract states that UV transmission decreases from the corneal center toward the periphery and attributes the decrease to scattering and absorbance. The Results and Discussion likewise describes reduced peripheral transmission across 310–400 nm and says the combined influence of scattering and absorption is likely. Page numbers are not provided in our copy. (LLM, conf=0.95)
plaindirect- Asserted: passes — The authors put it forward as true.
- Checkable: passes — It can be checked against evidence.
- Load-bearing: passes — The paper’s conclusions depend on it.
- Based: passes — The paper gives a reason why it holds.
It may state two separate claims as one.
- Supported
Every source the paper cites for this claim was checked and supports it.
In the paper
“Their mechanism, illustrated in Fig. 11, operates regardless of the direction of the perturbation and regardless of whether GAG chains are part of a duplex or are independent.”
§ Corneal structure and transparency > Molecular mechanisms of corneal transparency
What the sources say
- Supportedcites Cheng and Pinsky (2013) source
Section 5.1 states that the restoring mechanism operates regardless of perturbation direction and whether GAG chains are duplexed or independent. The Discussion also says that all GAG chains can contribute to the local pressure perturbation in either form. (LLM, conf=0.95)
plain- Asserted: passes — The authors put it forward as true.
- Checkable: passes — It can be checked against evidence.
- Load-bearing: passes — The paper’s conclusions depend on it.
- Based: passes — The paper gives a reason why it holds.
It may state two separate claims as one.
- Supported
Every source the paper cites for this claim was checked and supports it.
In the paper
“On the other hand, the ions attracted by the unbalanced charge on the glycosaminoglycan chains of the interfibrillar PGs play a dominant role in keeping the fibrils on optimal lattice positions, by acting as restoring forces, and the authors showed that these, by themselves, can reproduce the image distribution of fibrils seen in the electron microscope.”
§ Corneal structure and transparency > Molecular mechanisms of corneal transparency
What the sources say
- Supportedcites Cheng and Pinsky (2013) source
Split into 2 atoms — 2 confirmed, 0 partially supported, 0 disputed, 0 misattributed, 0 unverifiable. Expand the claim to see per-atom verdicts.
plaindirect- Asserted: passes — The authors put it forward as true.
- Checkable: passes — It can be checked against evidence.
- Load-bearing: passes — The paper’s conclusions depend on it.
- Based: passes — The paper gives a reason why it holds.
It may state two separate claims as one.
- Supported
The cited sources support only part of this claim — read each source’s verdict below.
In the paper
“However, it was noticed that, in vitro, the fibrils formed by collagen I and collagen V are larger than those found in vivo. This indicates that there may be additional mechanisms such as microfibrillar coiling (Raspanti, 2010) or collagen-bound disaccharides (Harding et al., 1980) that regulate fibril diameter.”
§ Corneal structure and transparency > Molecular mechanisms of corneal transparency
What the sources say
- Supportedcites Raspanti, 2010 source
The citation to Raspanti is attached to microfibrillar coiling, not to collagen-bound disaccharides. The Introduction describes helically wound microfibrils, and the Discussion says their helical substructure constrains fibril growth and produces uniform diameters. The paper therefore supports the proposed diameter-regulating mechanism. (LLM, conf=0.91)
- Not matchedcites Harding et al., 1980
Couldn’t be matched to a paper in Crossref, so it can’t be checked.
hedgedconditional- Asserted: passes — The authors put it forward as true.
- Checkable: passes — It can be checked against evidence.
- Load-bearing: passes — The paper’s conclusions depend on it.
- Based: passes — The paper gives a reason why it holds.
It may state two separate claims as one.
- Supported
The cited sources support only part of this claim — read each source’s verdict below.
In the paper
“Because both polyanionic charge per unit volume and tissue hydration are constant between species, regardless of the PG composition (Scott and Bosworth, 1990, Gyi, 1988), they proposed a model in which the fixed charges on GAGs are synthesised in proportion to the total fibrillar collagen (types I and V) (Meek and Leonard, 1993); the larger the collagen fibrils, the greater amount of fixed charge”
§ Corneal structure and transparency > Molecular mechanisms of corneal transparency
What the sources say
- Partly supportedcites Scott and Bosworth, 1990 sourceExperimental — accuracy not yet measured
Split into 2 atoms — 0 confirmed, 1 partially supported, 0 disputed, 0 misattributed, 1 unverifiable. Expand the claim to see per-atom verdicts.
- Not matchedcites Gyi, 1988
Couldn’t be matched to a paper in Crossref, so it can’t be checked.
- Supportedcites Meek and Leonard, 1993 source
Split into 2 atoms — 2 confirmed, 0 partially supported, 0 disputed, 0 misattributed, 0 unverifiable. Expand the claim to see per-atom verdicts.
plaindirectn = 40- Asserted: passes — The authors put it forward as true.
- Checkable: passes — It can be checked against evidence.
- Load-bearing: passes — The paper’s conclusions depend on it.
- Based: passes — The paper gives a reason why it holds.
It may state two separate claims as one.
- Partly supported
The cited sources support only part of this claim — read each source’s verdict below.
In the paper
“A similar effect occurs in corneal oedema (bullous keratopathy, Fuch's dystrophy) but in this case there are local decreases in refractive index caused by pooling of fluid into so-called “lakes” (Casadessus et al., 2012) (Fig. 8). The influx of fluid into the stroma also leads to disruption of the fibril organisation and thus to the reduction in destructive interference of scattered light.”
§ Corneal structure and transparency > Causes of light scatter in corneal pathologies
What the sources say
- Partly supportedcites Casadessus et al., 2012 sourceExperimental — accuracy not yet measured
Split into 2 atoms — 1 confirmed, 1 partially supported, 0 disputed, 0 misattributed, 0 unverifiable. Expand the claim to see per-atom verdicts.
plaindirect- Asserted: passes — The authors put it forward as true.
- Checkable: passes — It can be checked against evidence.
- Load-bearing: unclear — It is unclear whether the paper’s conclusions depend on it.
- Based: passes — The paper gives a reason why it holds.
It may state two separate claims as one.
- Partly supported
The cited sources support only part of this claim — read each source’s verdict below.
In the paper
“On the other hand, the opacity of corneal scars is a result of improper remodelling of the connective tissue matrix; collagen fibrils are wider than normal and poorly ordered in scar tissue (Boote et al., 2013).”
§ Corneal structure and transparency > Causes of light scatter in corneal pathologies
What the sources say
- Partly supportedcites Boote et al., 2013 sourceExperimental — accuracy not yet measured
The Results (Collagen Spatial Organisation) report locally increased fibril diameter and reduced spatial order at the graft margins compared with unwounded corneas. The Discussion links these changes to incomplete remodelling and fibrotic scar tissue, but says they *could be a contributing factor* to visible opacity. The claim states a definite cause for corneal scars generally, beyond what the paper establishes for these graft margins. (LLM, conf=0.88)
plaindirect- Asserted: passes — The authors put it forward as true.
- Checkable: passes — It can be checked against evidence.
- Load-bearing: unclear — It is unclear whether the paper’s conclusions depend on it.
- Based: passes — The paper gives a reason why it holds.
It may state two separate claims as one.
- Partly supported
In the paper
“current work in our group has revealed that many fibres seem to originate in the limbus, forming sheets at the edge of the cornea which then split up and extend as microfibrils, possibly oxytalan or elaunin (Alexander and Garner, 1983), across the stroma (White et al., 2014).”
§ Corneal structure and transparency > Stromal micro- and nano-structure > Lamellae
What the sources say
- Not matchedcites White et al., 2014
Couldn’t be matched to a paper in Crossref, so it can’t be checked.
hedged- Asserted: passes — The authors put it forward as true.
- Checkable: passes — It can be checked against evidence.
- Load-bearing: unclear — It is unclear whether the paper’s conclusions depend on it.
- Based: passes — The paper gives a reason why it holds.
It may state two separate claims as one.
- Not matched
A result the paper reports from its own data — it cites no other source for it, so there is none to check. The quote shows it is in the paper.
In the paper
“We have shown in the human cornea that these elastic fibres, though present throughout most of the stromal depth, are concentrated below the posterior-most keratocyte layer (unpublished results).”
§ Corneal structure and transparency > Stromal micro- and nano-structure > Lamellae
boostedcorrelational- Asserted: passes — The authors put it forward as true.
- Checkable: passes — It can be checked against evidence.
- Load-bearing: unclear — It is unclear whether the paper’s conclusions depend on it.
- Based: passes — The paper gives a reason why it holds.
It may state two separate claims as one.
The paper states this without a source or data behind it here, so there is nothing to check it against. The quote shows it is in the paper.
In the paper
“Recent preliminary unpublished work by Knupp aimed at elucidating the role of keratocytes in corneal fibril deposition suggested that there may be another type of “attractive” force acting on the fibrils that would prevent them from drifting apart.”
§ Corneal structure and transparency > Molecular mechanisms of corneal transparency
hedgedconditional- Asserted: passes — The authors put it forward as true.
- Checkable: passes — It can be checked against evidence.
- Load-bearing: fails — The paper’s conclusions may not depend on it.
- Based: passes — The paper gives a reason why it holds.
Probably not a substantial claim. The paper’s conclusions may not depend on it.
The paper states this without a source or data behind it here, so there is nothing to check it against. The quote shows it is in the paper.
In the paper
“What was evident, however, was that the distribution of distances between adjacent fibrils was narrow.”
§ Corneal structure and transparency > Molecular mechanisms of corneal transparency
plain- Asserted: passes — The authors put it forward as true.
- Checkable: passes — It can be checked against evidence.
- Load-bearing: passes — The paper’s conclusions depend on it.
- Based: passes — The paper gives a reason why it holds.
The quote only partly states this claim.
A result the paper reports from its own data — it cites no other source for it, so there is none to check. The quote shows it is in the paper.
In the paper
“Recent measurements from our group have shown that the refractive index of the keratocyte cytoplasm matches that of the stroma as a whole, whereas, upon activation, the refractive index falls.”
§ Corneal structure and transparency > Theoretical basis of corneal transparency > Contribution of stromal cells
plaindirect- Asserted: passes — The authors put it forward as true.
- Checkable: passes — It can be checked against evidence.
- Load-bearing: passes — The paper’s conclusions depend on it.
- Based: passes — The paper gives a reason why it holds.
It may state two separate claims as one.
A result the paper reports from its own data — it cites no other source for it, so there is none to check. The quote shows it is in the paper.
In the paper
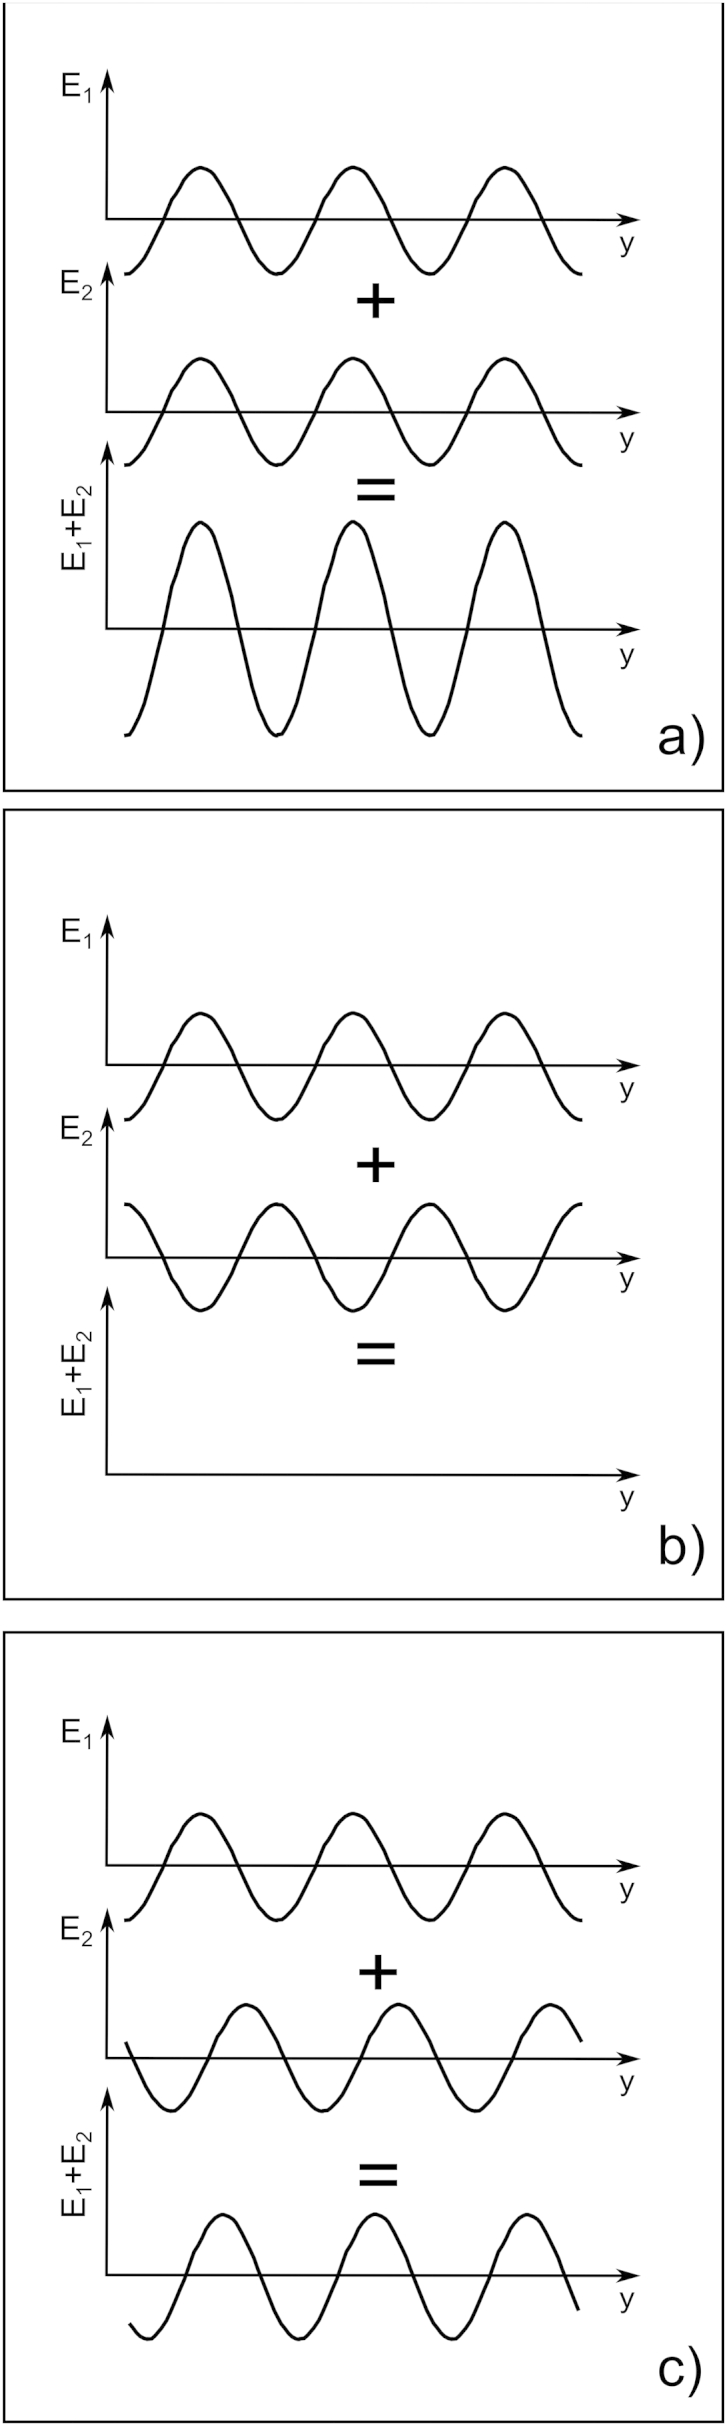
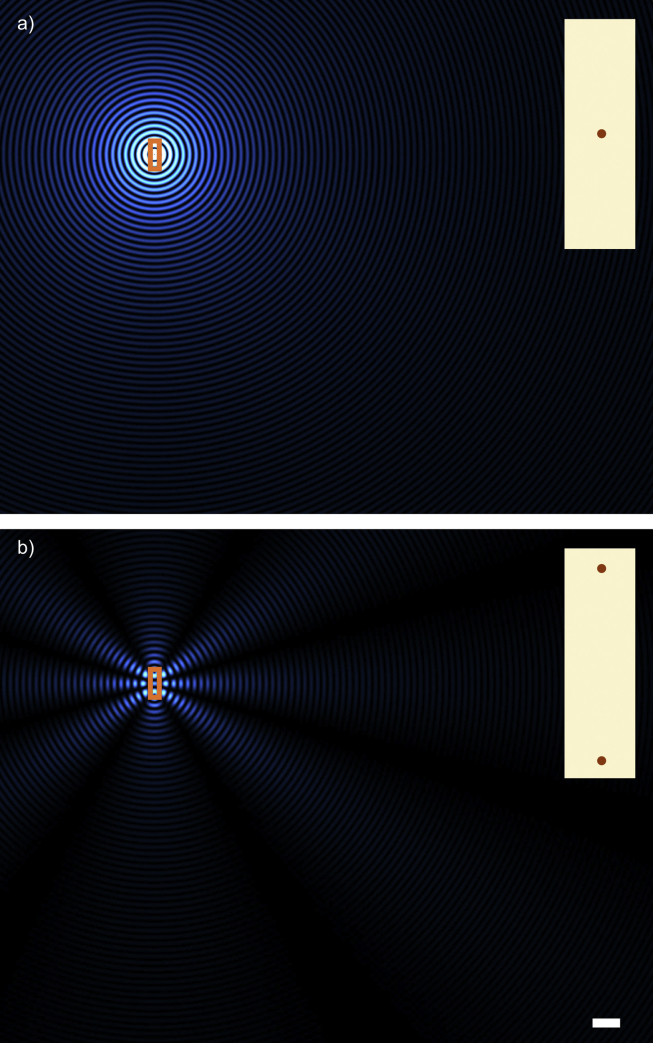
“This simple case shows that, if the wavelength is smaller than the fibril separation as depicted, there can be directions in which secondary radiation cancels out completely and others where they reinforce so that the resulting secondary waves exist only along distinct directions which are related to the fibril separation.”
§ Corneal structure and transparency > Theoretical basis of corneal transparency > Interaction of electromagnetic radiation with collagen fibrils
plaindirect- Asserted: passes — The authors put it forward as true.
- Checkable: passes — It can be checked against evidence.
- Load-bearing: passes — The paper’s conclusions depend on it.
- Based: passes — The paper gives a reason why it holds.
It may state two separate claims as one.
The paper states this without a source or data behind it here, so there is nothing to check it against. The quote shows it is in the paper.
In the paper
“in a number of corneal pathologies, changes in one or more of the other layers can lead to increased light scattering and consequent loss of corneal transparency”
§ Corneal structure and transparency > Introduction
plaindirect- Asserted: passes — The authors put it forward as true.
- Checkable: passes — It can be checked against evidence.
- Load-bearing: fails — The paper’s conclusions may not depend on it.
- Based: fails — The paper may give no reason why it holds.
Probably not a substantial claim. The paper’s conclusions may not depend on it. The paper may give no reason why it holds.
The paper states this without a source or data behind it here, so there is nothing to check it against. The quote shows it is in the paper.
In the paper
“The lamellae have long been known to consist of narrow, parallel collagen fibrils embedded in a proteoglycan-rich hydrated matrix.”
§ Corneal structure and transparency > Stromal micro- and nano-structure > Lamellae
boosted- Asserted: passes — The authors put it forward as true.
- Checkable: passes — It can be checked against evidence.
- Load-bearing: fails — The paper’s conclusions may not depend on it.
- Based: passes — The paper gives a reason why it holds.
Probably not a substantial claim. The paper’s conclusions may not depend on it.
A conclusion the paper draws from its own results — it cites no other source for it, so there is none to check. The quote shows it is in the paper.
In the paper
“This elastic system may have an important biomechanical role but it is unlikely to influence transparency in the centre of the normal cornea.”
§ Corneal structure and transparency > Stromal micro- and nano-structure > Lamellae
hedged- Asserted: passes — The authors put it forward as true.
- Checkable: passes — It can be checked against evidence.
- Load-bearing: unclear — It is unclear whether the paper’s conclusions depend on it.
- Based: passes — The paper gives a reason why it holds.
It may state two separate claims as one.
A claim is checked only against the cited paper’s full text, never its abstract, and none is available for its sources.
In the paper
“when a so-called “big bubble” is induced, part of the posterior stroma often adheres to the Descemet's membrane, and that there is, therefore, a natural cleavage plane in the stroma about 10 μm above Descemet's membrane (Jafarinasab et al., 2010, McKee et al., 2011).”
§ Corneal structure and transparency > Stromal micro- and nano-structure > Lamellae
What the sources say
plaindirect- Asserted: passes — The authors put it forward as true.
- Checkable: passes — It can be checked against evidence.
- Load-bearing: passes — The paper’s conclusions depend on it.
- Based: passes — The paper gives a reason why it holds.
It may state two separate claims as one.
The paper states this without a source or data behind it here, so there is nothing to check it against. The quote shows it is in the paper.
In the paper
“in humans, Bowman's layer and Descemet's membrane, both collagenous tissues like the stroma, together contribute less than 4% to the total corneal thickness”
§ Corneal structure and transparency > Introduction
plain- Asserted: passes — The authors put it forward as true.
- Checkable: passes — It can be checked against evidence.
- Load-bearing: fails — The paper’s conclusions may not depend on it.
- Based: passes — The paper gives a reason why it holds.
Probably not a substantial claim. The paper’s conclusions may not depend on it.
A claim is checked only against the cited paper’s full text, never its abstract, and none is available for its sources.
In the paper
“About 50 years ago the basic ultrastructure had been described (Jakus, 1962) and the principles behind corneal transparency finally elucidated (Maurice, 1957, Hart and Farrell, 1969, Benedek, 1971)”
§ Corneal structure and transparency > Introduction
What the sources say
boosted- Asserted: passes — The authors put it forward as true.
- Checkable: passes — It can be checked against evidence.
- Load-bearing: fails — The paper’s conclusions may not depend on it.
- Based: passes — The paper gives a reason why it holds.
Probably not a substantial claim. The paper’s conclusions may not depend on it. It may state two separate claims as one.
What the paper did — it cites no source for this, so there is none to check. The quote shows it is in the paper.
In the paper
“The X-ray technique does not allow direct imaging of the lamellar structures; the arrangement of lamellae has to be inferred from the diffraction patterns.”
§ Corneal structure and transparency > Stromal micro- and nano-structure > Lamellae
plain- Asserted: passes — The authors put it forward as true.
- Checkable: passes — It can be checked against evidence.
- Load-bearing: unclear — It is unclear whether the paper’s conclusions depend on it.
- Based: passes — The paper gives a reason why it holds.
It may state two separate claims as one.
In the paper
“In fact, collagen crimp, in combination with elastic fibres in the peripheral cornea, may explain why this region is more pliable and absorbs intraocular pressure fluctuations (Boyce et al., 2008), thus preventing deformation of the optically important central cornea.”
§ Corneal structure and transparency > Stromal micro- and nano-structure > Lamellae
What the sources say
- Not checked — no full text of the sourcecites Boyce et al., 2008 source
hedgedconditional- Asserted: passes — The authors put it forward as true.
- Checkable: passes — It can be checked against evidence.
- Load-bearing: unclear — It is unclear whether the paper’s conclusions depend on it.
- Based: passes — The paper gives a reason why it holds.
It may state two separate claims as one.
In the paper
“Collagen fibrils within the cornea are narrower than in many other connective tissues and this is an important factor for transparency, which is a function of the diameter (Hart and Farrell, 1969).”
§ Corneal structure and transparency > Stromal micro- and nano-structure > Collagen fibrils
What the sources say
- Not checked — no full text of the sourcecites Hart and Farrell, 1969 source
plaindirect- Asserted: passes — The authors put it forward as true.
- Checkable: passes — It can be checked against evidence.
- Load-bearing: passes — The paper’s conclusions depend on it.
- Based: passes — The paper gives a reason why it holds.
It may state two separate claims as one.
None of the sources cited for this claim have been checked yet.
In the paper
“There is a distribution of crimp angles, which can be altered under mechanical load.”
§ Corneal structure and transparency > Stromal micro- and nano-structure > Lamellae
plaindirect- Asserted: passes — The authors put it forward as true.
- Checkable: passes — It can be checked against evidence.
- Load-bearing: passes — The paper’s conclusions depend on it.
- Based: passes — The paper gives a reason why it holds.
It may state two separate claims as one.
The paper states this without a source or data behind it here, so there is nothing to check it against. The quote shows it is in the paper.
In the paper
“The basic principles of corneal structure and transparency have been known for some time, but in recent years X-ray scattering and other methods have revealed that the details of this structure are far more complex than previously thought”
§ Corneal structure and transparency > Abstract
plaindirect- Asserted: passes — The authors put it forward as true.
- Checkable: passes — It can be checked against evidence.
- Load-bearing: passes — The paper’s conclusions depend on it.
- Based: passes — The paper gives a reason why it holds.
Probably not a substantial claim. It may state two separate claims as one.
None of the sources cited for this claim have been checked yet.
In the paper
“For nearly a century it has been realised that these properties may derive from the arrangement of the constituents of the stroma (Eisler, 1930, Kolmer and Lauber, 1936).”
§ Corneal structure and transparency > Introduction
What the sources say
- Not checked — no full text of the sourcecites Eisler, 1930 source
- Not matchedcites Kolmer and Lauber, 1936
Couldn’t be matched to a paper in Crossref, so it can’t be checked.
hedgedconditional- Asserted: passes — The authors put it forward as true.
- Checkable: passes — It can be checked against evidence.
- Load-bearing: passes — The paper’s conclusions depend on it.
- Based: passes — The paper gives a reason why it holds.
Probably not a substantial claim.
A claim is checked only against the cited paper’s full text, never its abstract, and none is available for its sources.
In the paper
“These structures are of variable thickness, in humans typically up to 0.2 mm broad and 2 μm thick (Polack, 1961, Komai and Ushiki, 1991).”
§ Corneal structure and transparency > Stromal micro- and nano-structure > Lamellae
What the sources say
- Not checked — no full text of the sourcecites Polack, 1961 source
- Not checked — no full text of the sourcecites Komai and Ushiki, 1991
plain- Asserted: passes — The authors put it forward as true.
- Checkable: passes — It can be checked against evidence.
- Load-bearing: unclear — It is unclear whether the paper’s conclusions depend on it.
- Based: passes — The paper gives a reason why it holds.
It may state two separate claims as one.
What the paper did — it cites no source for this, so there is none to check. The quote shows it is in the paper.
In the paper
“Furthermore, the X-ray data represent bulk averages throughout the tissue being sampled so, for instance, it is not possible to obtain information pertaining to adjacent lamellae using this approach.”
§ Corneal structure and transparency > Stromal micro- and nano-structure > Lamellae
plain- Asserted: passes — The authors put it forward as true.
- Checkable: passes — It can be checked against evidence.
- Load-bearing: unclear — It is unclear whether the paper’s conclusions depend on it.
- Based: passes — The paper gives a reason why it holds.
It may state two separate claims as one.
In the paper
“which are arranged axially with the typical 67 nm D-periodic stagger (Meek and Holmes, 1983) with gaps between the N- and C-termini of consecutive molecules (Fig. 2).”
§ Corneal structure and transparency > Stromal micro- and nano-structure > Collagen fibrils
What the sources say
- Not checked — no full text of the sourcecites Meek and Holmes, 1983 source
plain- Asserted: passes — The authors put it forward as true.
- Checkable: passes — It can be checked against evidence.
- Load-bearing: unclear — It is unclear whether the paper’s conclusions depend on it.
- Based: passes — The paper gives a reason why it holds.
It may state two separate claims as one.
The paper states this without a source or data behind it here, so there is nothing to check it against. The quote shows it is in the paper.
In the paper
“The lamella arrangement within the cornea helps to maintain the overall shape of the tissue and is also responsible for some optical properties such as corneal birefringence.”
§ Corneal structure and transparency > Stromal micro- and nano-structure > Lamellae
plaindirect- Asserted: passes — The authors put it forward as true.
- Checkable: passes — It can be checked against evidence.
- Load-bearing: unclear — It is unclear whether the paper’s conclusions depend on it.
- Based: passes — The paper gives a reason why it holds.
It may state two separate claims as one.
The paper states this without a source or data behind it here, so there is nothing to check it against. The quote shows it is in the paper.
In the paper
“In most mammals, the cornea is the only tissue requiring considerable tensile strength coupled with a perfectly defined shape and optical clarity.”
§ Corneal structure and transparency > Introduction
plain- Asserted: passes — The authors put it forward as true.
- Checkable: passes — It can be checked against evidence.
- Load-bearing: fails — The paper’s conclusions may not depend on it.
- Based: fails — The paper may give no reason why it holds.
Probably not a substantial claim. The paper’s conclusions may not depend on it. The paper may give no reason why it holds.
The paper states this without a source or data behind it here, so there is nothing to check it against. The quote shows it is in the paper.
In the paper
“At the molecular level, modern technologies and theoretical modelling have started to explain exactly how the collagen fibrils are arranged within the stromal lamellae and how proteoglycans maintain this ultrastructure.”
§ Corneal structure and transparency > Abstract
plaindirect- Asserted: passes — The authors put it forward as true.
- Checkable: passes — It can be checked against evidence.
- Load-bearing: fails — The paper’s conclusions may not depend on it.
- Based: passes — The paper gives a reason why it holds.
Probably not a substantial claim. The paper’s conclusions may not depend on it. It may state two separate claims as one.
The paper states this without a source or data behind it here, so there is nothing to check it against. The quote shows it is in the paper.
In the paper
“The posterior lamellae in the central cornea are more hydrated and are believed to have less interlacing, lying on top of each other like the layers in plywood.”
§ Corneal structure and transparency > Stromal micro- and nano-structure > Lamellae
hedgedcorrelational- Asserted: passes — The authors put it forward as true.
- Checkable: passes — It can be checked against evidence.
- Load-bearing: unclear — It is unclear whether the paper’s conclusions depend on it.
- Based: passes — The paper gives a reason why it holds.
It may state two separate claims as one.
In the paper
“The attractive forces are due to those proteoglycans that connect two or more fibrils. These proteoglycans would be subject to thermally driven conformational changes so that their glycosaminoglycan chains will experience a force that prevents them from assuming a fully extended conformation and which brings their terminal ends, and the collagen fibrils attached to them, closer together. These”
§ Corneal structure and transparency > Molecular mechanisms of corneal transparency
What the sources say
- Not matchedcites Feynman et al., 1963
Couldn’t be matched to a paper in Crossref, so it can’t be checked.
hedgeddirect- Asserted: passes — The authors put it forward as true.
- Checkable: passes — It can be checked against evidence.
- Load-bearing: passes — The paper’s conclusions depend on it.
- Based: passes — The paper gives a reason why it holds.
It may state two separate claims as one.
- Not matched
A conclusion the paper draws from its own results — it cites no other source for it, so there is none to check. The quote shows it is in the paper.
In the paper
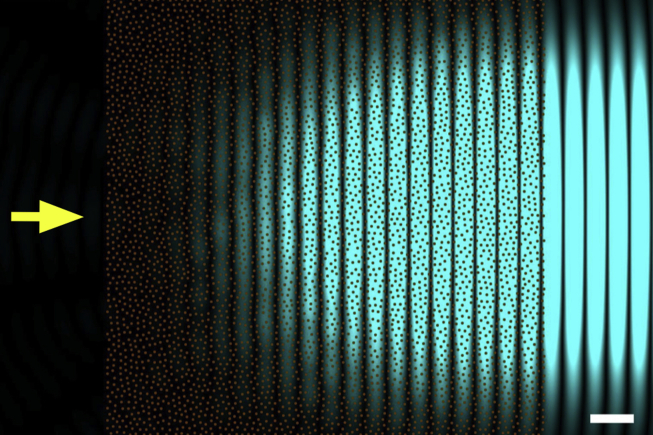
“As it turns out, the requirement of a perfect hexagonal lattice for the arrangement of the collagen fibrils is not a stringent one, in fact, to have a transparent cornea, it is sufficient for the distance between adjacent fibril to be constrained.”
§ Corneal structure and transparency > Theoretical basis of corneal transparency > Fibril organisation and transparency
plaindirect- Asserted: passes — The authors put it forward as true.
- Checkable: passes — It can be checked against evidence.
- Load-bearing: passes — The paper’s conclusions depend on it.
- Based: passes — The paper gives a reason why it holds.
It may state two separate claims as one.
In the paper
“Both collagen types, when purified, could assemble in vitro to form fibrils, but in this case type I collagen formed fibrils of varying diameters, while type V formed small fibrils.”
§ Corneal structure and transparency > Molecular mechanisms of corneal transparency
What the sources say
- Not checked — no full text of the sourcecites Birk et al., 1990 source
plaindirect- Asserted: passes — The authors put it forward as true.
- Checkable: passes — It can be checked against evidence.
- Load-bearing: passes — The paper’s conclusions depend on it.
- Based: passes — The paper gives a reason why it holds.
It may state two separate claims as one.
A claim is checked only against the cited paper’s full text, never its abstract, and none is available for its sources.
In the paper
“They postulated that stromal cells contain cytoplasmic molecules called corneal crystallins that act in much the same was as crystallins in the lens.”
§ Corneal structure and transparency > Theoretical basis of corneal transparency > Contribution of stromal cells
What the sources say
plaindirect- Asserted: passes — The authors put it forward as true.
- Checkable: passes — It can be checked against evidence.
- Load-bearing: passes — The paper’s conclusions depend on it.
- Based: passes — The paper gives a reason why it holds.
Probably not a substantial claim.
A conclusion the paper draws from its own results — it cites no other source for it, so there is none to check. The quote shows it is in the paper.
In the paper
“This suggested that there may be another source of attractive forces between fibrils in the cornea which come from the pressure exerted by the adjacent lamellae. In this case, the fibrils at the interface between lamellae would be pushed inwards, creating a cascade effect that ultimately would hold all fibrils within any lamella close to each other.”
§ Corneal structure and transparency > Molecular mechanisms of corneal transparency
hedgedconditional- Asserted: passes — The authors put it forward as true.
- Checkable: passes — It can be checked against evidence.
- Load-bearing: fails — The paper’s conclusions may not depend on it.
- Based: passes — The paper gives a reason why it holds.
Probably not a substantial claim. The paper’s conclusions may not depend on it. It may state two separate claims as one.
The paper states this without a source or data behind it here, so there is nothing to check it against. The quote shows it is in the paper.
In the paper
“Corneal collagen fibrils, as the principal load-bearing constituents of the lamellae, have to resist the tensile forces due to the intraocular pressure and protect the inner ocular tissues from external trauma while at the same time remaining narrow to allow transparency of the tissue; these are competing requirements.”
§ Corneal structure and transparency > Stromal micro- and nano-structure > Collagen fibrils
plaindirect- Asserted: passes — The authors put it forward as true.
- Checkable: passes — It can be checked against evidence.
- Load-bearing: passes — The paper’s conclusions depend on it.
- Based: passes — The paper gives a reason why it holds.
It may state two separate claims as one.
The paper states this without a source or data behind it here, so there is nothing to check it against. The quote shows it is in the paper.
In the paper
“The normal adult human stroma contains four small leucine-rich proteoglycans: decorin, lumican, keratocan and mimecan.”
§ Corneal structure and transparency > Stromal micro- and nano-structure > Proteoglycans
plain- Asserted: passes — The authors put it forward as true.
- Checkable: passes — It can be checked against evidence.
- Load-bearing: fails — The paper’s conclusions may not depend on it.
- Based: fails — The paper may give no reason why it holds.
Probably not a substantial claim. The paper’s conclusions may not depend on it. The paper may give no reason why it holds.
A conclusion the paper draws from its own results — it cites no other source for it, so there is none to check. The quote shows it is in the paper.
In the paper
“This idea is in agreement with the model of Cheng and Pinsky (Fig. 11); if the collagen fibrils were larger in diameter and the interfibrillar space was constant, the repulsive forces generated by the GAGs and their associated ions would be increased, which would increase the swelling pressure and push the fibrils further apart in order to achieve equilibrium.”
§ Corneal structure and transparency > Molecular mechanisms of corneal transparency
hedgeddirect- Asserted: passes — The authors put it forward as true.
- Checkable: passes — It can be checked against evidence.
- Load-bearing: unclear — It is unclear whether the paper’s conclusions depend on it.
- Based: passes — The paper gives a reason why it holds.
It may state two separate claims as one.
In the paper
“The gel pressure that causes this swelling arises from net electrostatic charges within the stroma. Most of the electrostatic charge is contributed by the acidic groups of the glycosaminoglycans. The other contribution to net stromal charge arises from the temporary complexing of free chloride ions to ligands within the stroma (Hodson, 1997).”
§ Corneal structure and transparency > Theoretical basis of corneal transparency > Fibril organisation and transparency
What the sources say
- Not checked — no full text of the sourcecites Hodson, 1997 source
plaindirect- Asserted: passes — The authors put it forward as true.
- Checkable: passes — It can be checked against evidence.
- Load-bearing: passes — The paper’s conclusions depend on it.
- Based: passes — The paper gives a reason why it holds.
It may state two separate claims as one.
A conclusion the paper draws from its own results — it cites no other source for it, so there is none to check. The quote shows it is in the paper.
In the paper
“It was therefore proposed that the distances between adjacent collagen fibrils are a consequence of the balancing of two opposing forces acting on the fibrils brought about by the proteoglycans. In this model, both opposing forces depend on the separation between the fibrils, and the equilibrium distance between two fibrils is reached when the attractive forces between them cancel out the rep”
§ Corneal structure and transparency > Molecular mechanisms of corneal transparency
hedgeddirect- Asserted: passes — The authors put it forward as true.
- Checkable: passes — It can be checked against evidence.
- Load-bearing: passes — The paper’s conclusions depend on it.
- Based: passes — The paper gives a reason why it holds.
It may state two separate claims as one.
A conclusion the paper draws from its own results — it cites no other source for it, so there is none to check. The quote shows it is in the paper.
In the paper
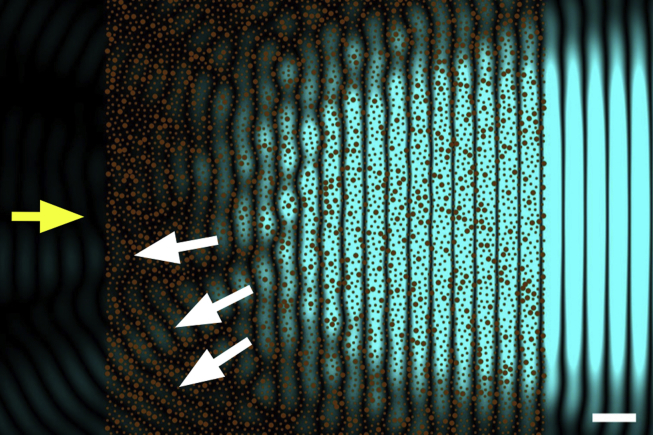
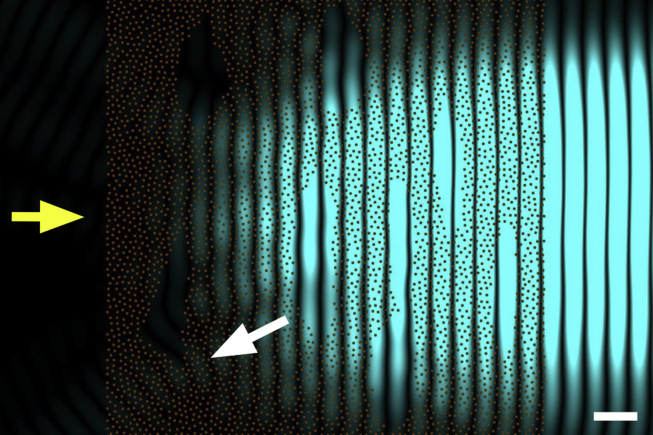
“However, in real corneas, the incoming light is scattered by many more fibrils than those shown, so that the overall loss of intensity becomes significant and corneas with such structural defects exhibit impaired transparency.”
§ Corneal structure and transparency > Theoretical basis of corneal transparency > Fibril organisation and transparency
plaindirect- Asserted: passes — The authors put it forward as true.
- Checkable: passes — It can be checked against evidence.
- Load-bearing: passes — The paper’s conclusions depend on it.
- Based: passes — The paper gives a reason why it holds.
It may state two separate claims as one.
A claim is checked only against the cited paper’s full text, never its abstract, and none is available for its sources.
In the paper
“There are about 70 microfibrils within each fibril (Holmes and Kadler, 2005) which are tilted by about 15° to the fibril long axis (Holmes et al., 2001) and this reduces the usual 67 nm axial periodicity seen in tendon and sclera, to closer to 65 nm (Meek et al., 1981, Marchini et al., 1986, Yamamoto et al., 2000).”
§ Corneal structure and transparency > Stromal micro- and nano-structure > Collagen fibrils
What the sources say
plaindirect- Asserted: passes — The authors put it forward as true.
- Checkable: passes — It can be checked against evidence.
- Load-bearing: unclear — It is unclear whether the paper’s conclusions depend on it.
- Based: passes — The paper gives a reason why it holds.
It may state two separate claims as one.
A conclusion the paper draws from its own results — it cites no other source for it, so there is none to check. The quote shows it is in the paper.
In the paper
“This mechanism would also be relevant to corneal development and to the establishment of the stromal matrix.”
§ Corneal structure and transparency > Molecular mechanisms of corneal transparency
hedgedcorrelational- Asserted: passes — The authors put it forward as true.
- Checkable: passes — It can be checked against evidence.
- Load-bearing: fails — The paper’s conclusions may not depend on it.
- Based: passes — The paper gives a reason why it holds.
Probably not a substantial claim. The paper’s conclusions may not depend on it. It may state two separate claims as one.
In the paper
“This technique may be useful for comparative purposes as it is simple and quick, and we have used it ourselves (Mi et al., 2011). However, Maurice (2001) pointed out that this can be an extremely insensitive test”
§ Corneal structure and transparency > Measurement of corneal transparency
What the sources say
- Not matchedcites Maurice, 2001
Couldn’t be matched to a paper in Crossref, so it can’t be checked.
plain- Asserted: passes — The authors put it forward as true.
- Checkable: passes — It can be checked against evidence.
- Load-bearing: unclear — It is unclear whether the paper’s conclusions depend on it.
- Based: passes — The paper gives a reason why it holds.
It may state two separate claims as one.
- Not matched
In the paper
“Many other microscopical techniques also reveal the presence of this microfibrillar substructure within corneal collagen fibrils (Meek, 2009).”
§ Corneal structure and transparency > Stromal micro- and nano-structure > Collagen fibrils
What the sources say
- Not matchedcites Meek, 2009
Couldn’t be matched to a paper in Crossref, so it can’t be checked.
plain- Asserted: passes — The authors put it forward as true.
- Checkable: passes — It can be checked against evidence.
- Load-bearing: fails — The paper’s conclusions may not depend on it.
- Based: passes — The paper gives a reason why it holds.
Probably not a substantial claim. The paper’s conclusions may not depend on it.
- Not matched
None of the sources cited for this claim could be matched to a paper in Crossref, so there is nothing to check it against.
In the paper
“The transparency of the corneal stroma has been studied since the nineteenth century and the general consensus was that the cornea needed to be optically homogenous to be transparent (Schweigger-Seidel, 1869, Von Fleischl, 1880, Ranvier, 1898).”
§ Corneal structure and transparency > Theoretical basis of corneal transparency
What the sources say
- Not matchedcites Schweigger-Seidel, 1869
Couldn’t be matched to a paper in Crossref, so it can’t be checked.
- Not matchedcites Von Fleischl, 1880
Couldn’t be matched to a paper in Crossref, so it can’t be checked.
- Not matchedcites Ranvier, 1898
Couldn’t be matched to a paper in Crossref, so it can’t be checked.
plaindirect- Asserted: passes — The authors put it forward as true.
- Checkable: passes — It can be checked against evidence.
- Load-bearing: fails — The paper’s conclusions may not depend on it.
- Based: passes — The paper gives a reason why it holds.
Probably not a substantial claim. The paper’s conclusions may not depend on it.
- Not matched
A conclusion the paper draws from its own results — it cites no other source for it, so there is none to check. The quote shows it is in the paper.
In the paper
“This would endow the whole cornea with a less rigid and more fluid overall structure which would make the cornea more resilient to deformations due to external stresses and would facilitate the transport of molecules and nutrients across the cornea.”
§ Corneal structure and transparency > Molecular mechanisms of corneal transparency
hedgeddirect- Asserted: passes — The authors put it forward as true.
- Checkable: passes — It can be checked against evidence.
- Load-bearing: passes — The paper’s conclusions depend on it.
- Based: passes — The paper gives a reason why it holds.
It may state two separate claims as one.
The paper states this without a source or data behind it here, so there is nothing to check it against. The quote shows it is in the paper.
In the paper
“Opacities associated with corneal dystrophies (granular dystrophy, lattice dystrophy, macular dystrophy, Schnyder dystrophy) are caused mostly by different kinds of stromal deposits. Such deposits cause local changes in the refractive index of the stroma, and these refractive index discontinuities, if comparable with the wavelength of light, lead to increased light scatter.”
§ Corneal structure and transparency > Causes of light scatter in corneal pathologies
plaindirect- Asserted: passes — The authors put it forward as true.
- Checkable: passes — It can be checked against evidence.
- Load-bearing: unclear — It is unclear whether the paper’s conclusions depend on it.
- Based: passes — The paper gives a reason why it holds.
It may state two separate claims as one.
In the paper
“At the supra-molecular level, the initial building block is a 4–8 nm wide microfibril (Baldock et al., 2002) with a left-handed twist of the constituent molecules (Fig. 2).”
§ Corneal structure and transparency > Stromal micro- and nano-structure > Collagen fibrils
What the sources say
- Not checked — no full text of the sourcecites Baldock et al., 2002 source
plain- Asserted: passes — The authors put it forward as true.
- Checkable: passes — It can be checked against evidence.
- Load-bearing: unclear — It is unclear whether the paper’s conclusions depend on it.
- Based: passes — The paper gives a reason why it holds.
It may state two separate claims as one.
The paper states this without a source or data behind it here, so there is nothing to check it against. The quote shows it is in the paper.
In the paper
“Two other proteoglycans associated with the cornea are biglycan (containing dermatan sulphate) and fibromodulin (containing keratan sulphate).”
§ Corneal structure and transparency > Stromal micro- and nano-structure > Proteoglycans
plaincorrelational- Asserted: passes — The authors put it forward as true.
- Checkable: passes — It can be checked against evidence.
- Load-bearing: fails — The paper’s conclusions may not depend on it.
- Based: passes — The paper gives a reason why it holds.
Probably not a substantial claim. The paper’s conclusions may not depend on it. It may state two separate claims as one.
A claim is checked only against the cited paper’s full text, never its abstract, and none is available for its sources.
In the paper
“The models they proposed were based essentially on the collagen fibrils in the corneal stroma being connected to six adjacent fibrils by proteoglycans at regular axial intervals. The defined lengths of the proteoglycans would force the fibrils on a perfect hexagonal lattice, which would guarantee corneal transparency.”
§ Corneal structure and transparency > Molecular mechanisms of corneal transparency
What the sources say
hedgeddirect- Asserted: passes — The authors put it forward as true.
- Checkable: passes — It can be checked against evidence.
- Load-bearing: fails — The paper’s conclusions may not depend on it.
- Based: passes — The paper gives a reason why it holds.
Probably not a substantial claim. The paper’s conclusions may not depend on it. It may state two separate claims as one.
The paper states this without a source or data behind it here, so there is nothing to check it against. The quote shows it is in the paper.
In the paper
“The first contains dermatan sulphate and chondroitin sulphate, while the final three contain keratan sulphate GAGs.”
§ Corneal structure and transparency > Stromal micro- and nano-structure > Proteoglycans
plain- Asserted: passes — The authors put it forward as true.
- Checkable: passes — It can be checked against evidence.
- Load-bearing: fails — The paper’s conclusions may not depend on it.
- Based: passes — The paper gives a reason why it holds.
Probably not a substantial claim. The paper’s conclusions may not depend on it. It may state two separate claims as one.
In the paper
“Boettner and Wolter (1962) found that the corneal transmittance rose rapidly from 300 nm, reaching 80% at 380 nm and more than 90% between 500 nm and 1300 nm.”
§ Corneal structure and transparency > Measurement of corneal transparency
What the sources say
- Not matchedcites Boettner and Wolter, 1962
Couldn’t be matched to a paper in Crossref, so it can’t be checked.
plaindirect- Asserted: passes — The authors put it forward as true.
- Checkable: passes — It can be checked against evidence.
- Load-bearing: unclear — It is unclear whether the paper’s conclusions depend on it.
- Based: passes — The paper gives a reason why it holds.
It may state two separate claims as one.
- Not matched
The paper states this without a source or data behind it here, so there is nothing to check it against. The quote shows it is in the paper.
In the paper
“It appears that fibrils have surface dips or grooves in the gap zone compared to the overlap zone, explained by the 4:5 ratio of molecular density in the two zones.”
§ Corneal structure and transparency > Stromal micro- and nano-structure > Collagen fibrils
hedgeddirect- Asserted: passes — The authors put it forward as true.
- Checkable: passes — It can be checked against evidence.
- Load-bearing: unclear — It is unclear whether the paper’s conclusions depend on it.
- Based: passes — The paper gives a reason why it holds.
It may state two separate claims as one.
In the paper
“The suggestion that collagen fibrils needed to have the same refractive index as their surroundings was stated specifically by Renault (1889).”
§ Corneal structure and transparency > Theoretical basis of corneal transparency
What the sources say
- Not matchedcites Renault, 1889
Couldn’t be matched to a paper in Crossref, so it can’t be checked.
plain- Asserted: passes — The authors put it forward as true.
- Checkable: passes — It can be checked against evidence.
- Load-bearing: fails — The paper’s conclusions may not depend on it.
- Based: passes — The paper gives a reason why it holds.
Probably not a substantial claim. The paper’s conclusions may not depend on it.
- Not matched
A conclusion the paper draws from its own results — it cites no other source for it, so there is none to check. The quote shows it is in the paper.
In the paper
“Two of the most important structural factors for corneal transparency are the uniformity of the diameters of the collagen fibrils, and the restriction in the range of distances between adjacent collagen fibrils.”
§ Corneal structure and transparency > Molecular mechanisms of corneal transparency
plaindirect- Asserted: passes — The authors put it forward as true.
- Checkable: passes — It can be checked against evidence.
- Load-bearing: passes — The paper’s conclusions depend on it.
- Based: passes — The paper gives a reason why it holds.
It may state two separate claims as one.
A claim is checked only against the cited paper’s full text, never its abstract, and none is available for its sources.
In the paper
“Corneal opacity during corneal wound healing, or transitory haze following refractive surgery or corneal cross-linking, is caused by activated corneal keratocytes (Connon et al., 2003, Moller-Pedersen, 2004). Once activated, these cells have a lower refractive index than the surrounding connective tissue.”
§ Corneal structure and transparency > Causes of light scatter in corneal pathologies
What the sources say
plaindirect- Asserted: passes — The authors put it forward as true.
- Checkable: passes — It can be checked against evidence.
- Load-bearing: unclear — It is unclear whether the paper’s conclusions depend on it.
- Based: passes — The paper gives a reason why it holds.
It may state two separate claims as one.
A conclusion the paper draws from its own results — it cites no other source for it, so there is none to check. The quote shows it is in the paper.
In the paper
“Any change in cytoplasmic content when the keratocytes transform to myofibroblasts is likely to alter the refractive index, and this would then contribute to the increase in light scatter.”
§ Corneal structure and transparency > Theoretical basis of corneal transparency > Contribution of stromal cells
hedgedconditional- Asserted: passes — The authors put it forward as true.
- Checkable: passes — It can be checked against evidence.
- Load-bearing: passes — The paper’s conclusions depend on it.
- Based: passes — The paper gives a reason why it holds.
It may state two separate claims as one.
In the paper
“It was found that corneal fibrils were a blend of type I and type V collagens, but unlike in other tissues, the collagen V to collagen I ratio was noticeably higher in corneal stroma (Birk et al., 1990).”
§ Corneal structure and transparency > Molecular mechanisms of corneal transparency
What the sources say
- Not checked — no full text of the sourcecites Birk et al., 1990 source
plaincorrelational- Asserted: passes — The authors put it forward as true.
- Checkable: passes — It can be checked against evidence.
- Load-bearing: passes — The paper’s conclusions depend on it.
- Based: passes — The paper gives a reason why it holds.
It may state two separate claims as one.
A conclusion the paper draws from its own results — it cites no other source for it, so there is none to check. The quote shows it is in the paper.
In the paper
“This type of fibrillar arrangement is said to possess short range order and this property is essential to corneal transparency.”
§ Corneal structure and transparency > Theoretical basis of corneal transparency > Fibril organisation and transparency
plaindirect- Asserted: passes — The authors put it forward as true.
- Checkable: passes — It can be checked against evidence.
- Load-bearing: passes — The paper’s conclusions depend on it.
- Based: passes — The paper gives a reason why it holds.
The quote only partly states this claim.
In the paper
“Biglycan occurs in the epithelium and in the stroma of some pathological corneas (Funderburgh et al., 1998)”
§ Corneal structure and transparency > Stromal micro- and nano-structure > Proteoglycans
What the sources say
- Not checked — no full text of the sourcecites Funderburgh et al., 1998
plain- Asserted: passes — The authors put it forward as true.
- Checkable: passes — It can be checked against evidence.
- Load-bearing: fails — The paper’s conclusions may not depend on it.
- Based: passes — The paper gives a reason why it holds.
Probably not a substantial claim. The paper’s conclusions may not depend on it.
The paper states this without a source or data behind it here, so there is nothing to check it against. The quote shows it is in the paper.
In the paper
“The presence of similar oversized collagen fibrils, probably formed by fibril fusion (Fig. 7), is also a major cause of corneal light scatter seen in many of the mucopolysaccharidoses, though there is often accompanying deposition of stored proteoglycans with cells or within the matrix that also contributes.”
§ Corneal structure and transparency > Causes of light scatter in corneal pathologies
hedgeddirect- Asserted: passes — The authors put it forward as true.
- Checkable: passes — It can be checked against evidence.
- Load-bearing: unclear — It is unclear whether the paper’s conclusions depend on it.
- Based: passes — The paper gives a reason why it holds.
It may state two separate claims as one.
A conclusion the paper draws from its own results — it cites no other source for it, so there is none to check. The quote shows it is in the paper.
In the paper
“Thus haze or opacity within the cornea can have multiple causes, and it is often incorrect to attribute the light scattering to a single structural change that may be observed within the tissue.”
§ Corneal structure and transparency > Causes of light scatter in corneal pathologies
plain- Asserted: passes — The authors put it forward as true.
- Checkable: passes — It can be checked against evidence.
- Load-bearing: passes — The paper’s conclusions depend on it.
- Based: passes — The paper gives a reason why it holds.
It may state two separate claims as one.
The authors state this as an assumption.
The secondary electromagnetic radiation scattered by any collagen fibril does not interact with other fibrils of the cornea but travels undisturbed to the retina.
“The explanation for cornea transparency presented above is based on the approximation that the secondary electromagnetic radiation scattered by any collagen fibril will not interact with other fibrils of the cornea, but will travel undisturbed to the retina.”
The paper relies on this without support.
If the cornea swells much above its physiological hydration, it begins to scatter significant quantities of light and lose transparency.
“If the cornea swells much above its physiological hydration it begins to scatter significant quantities of light and to lose its transparency.”
The paper relies on this without support.
Keratocytes themselves are transparent except for their nuclei.
“Keratocytes themselves are transparent except for their nuclei.”
The paper relies on this without support.
Structural data from real corneas can now be collected using modern techniques such as three-dimensional block face scanning electron microscopy.
“Structural data from real corneas can now be collected using modern techniques such as three-dimensional block face scanning electron microscopy”
The paper relies on this without support.
Modern computers are fast enough for transparency predictions to be obtained by solving Maxwell's equations for the collected data.
“modern computers are fast enough for transparency predictions to be obtained by solving Maxwell's equations for the collected data”
Claims other papers make about this one
Each is checked against this paper’s own text: does it say what the citing paper says it does?
The source backs part of the claim, not all of it — or backs it for a different population, condition or comparison.
In the citing paper
“Corneal transparency arises from constructive interference of visible light due to the relatively ordered arrangement of collagen fibrils in the corneal stroma.”
From Structural control of corneal transparency, refractive power and dynamics (2025) · cites this paper as [4]
Experimental — accuracy not yet measured
Citations
Cites
Yee, K. (1966) · IEEE Transactions on Antennas and Propagation · doi:10.1109/tap.1966.1138693 · Cited by 15,008
The Feynman Lectures on Physics
Feynman, R. P., Leighton, R. B., Sands, M., & Treiman, S. B. (1964) · Physics Today · doi:10.1063/1.3051743 · Cited by 2,944
Corneal Collagen Crosslinking: A Systematic Review
Sorkin, N., & Varssano, D. (2014) · Ophthalmologica · doi:10.1159/000357979 · Cited by 1,918
The structure and transparency of the cornea
Maurice, D. M. (1957) · The Journal of Physiology · doi:10.1113/jphysiol.1957.sp005758 · Cited by 1,129
Microfibrillar structure of type I collagen in situ
Orgel, J. P. R. O., Irving, T. C., Miller, A., & Wess, T. J. (2006) · Proceedings of the National Academy of Sciences · doi:10.1073/pnas.0502718103 · Cited by 930
Theory of Transparency of the Eye
Benedek, G. B. (1971) · Applied Optics · doi:10.1364/ao.10.000459 · Cited by 895
(1962) · Investigative Ophthalmology & Visual Science · Cited by 840
Chakravarti, S., Magnuson, T., Lass, J. H., Jepsen, K. J., LaMantia, C., & Carroll, H. (1998) · The Journal of Cell Biology · doi:10.1083/jcb.141.5.1277 · Cited by 731
(1991) · PubMed · Cited by 678
Collagen fibrillogenesis in vitro: interaction of types I and V collagen regulates fibril diameter
Birk, D. E., Fitch, J. M., Babiarz, J. P., Doane, K. J., & Linsenmayer, T. F. (1990) · Journal of Cell Science · doi:10.1242/jcs.95.4.649 · Cited by 596
Research works printed but not linked: 12
- Dohlman, 1971, The function of the corneal epithelium in health and disease, Invest. Ophthalmol., 10, 383
- Feynman, 1963, vol. 1
- Harding, 1980, Corneal collagen: a review, Colloq. Int. Cent. Rech. Sci. Natl., 287, 51
- Kolmer, 1936, Handb. Der mikr, Anat. Des. Menschen (v. Möllend.), III, 2
- Maurice, 2001, Graft transparency is in the eye of the beholder, Invest. Ophthalmol. Vis. Sci., S282
- Meyer, 1948, Mucopolysaccharides and mucoids of ocular tissues, vol. 2, 71
- Ranvier, 1898, Influence histogénétique d’une forme antérieure, à propos de la regeneration de la membrane de Descemet, C. R. Acad. Sci. (Paris), 126, 23
- Rispoli, 1978, Apparecchiatura a fibre ottiche per la misura oggettiva della variazione di trasparenza corneale, Boll. Ocul., 55, 63
- Virchow, 1905, vol. 1, 1
- Von Fleischl, 1880, vol. 3, 47
- Weiner, 1912, Allgemeine Sätze űber die Dielektrizitätskonstanten der Mischkörper, Abh. Sachs. Ges. Akad. Wiss. Math. Phys. Kl., 6, 574
- White, 2014, 3D structural studies of the cornea, Ophthalmic Physiol. Opt., 34, 693
Cited by
Sorted by citations
Items 401–500 of 853
Bowman Layer Marking for Correct Placement of Corneal Allogeneic Intrastromal Ring Segments
Jacob, S., Agarwal, A., Awwad, S. T., Parker, J. S., Mimouni, M., & Sambath, J. (2023) · Cornea · doi:10.1097/ico.0000000000003431 · Cited by 8
Chen, W., Bao, F., Roberts, C. J., Zhang, J., Wang, C., Li, X., Wang, J., Said, A. Z. M. A., Mayopa, K. N., Chen, Y., et al. (2024) · Frontiers in Bioengineering and Biotechnology · doi:10.3389/fbioe.2024.1323612 · Cited by 8
A stochastic model of corneal epithelium maintenance and recovery following perturbation
Moraki, E., Grima, R., & Painter, K. J. (2018) · Journal of Mathematical Biology · doi:10.1007/s00285-018-1308-9 · Cited by 8
Jindal, R., & Sinha, R. (2019) · Bulletin of Environmental Contamination and Toxicology · doi:10.1007/s00128-019-02549-6 · Cited by 8
Stimulation of Phagocytic Activity in Cultured Human Corneal Fibroblasts by Plasminogen
Sato, T., Sugioka, K., Kodama-Takahashi, A., Murakami, J., Saito, A., Mishima, H., Nishida, T., & Kusaka, S. (2019) · Investigative Ophthalmology & Visual Science · doi:10.1167/iovs.19-27736 · Cited by 8
Frazer, H., You, J., Chen, Z. X., Sayyar, S., Liu, X., Taylor, A. C., Hodge, C., Wallace, G. G., & Sutton, G. L. (2020) · Translational Vision Science & Technology · doi:10.1167/tvst.9.13.40 · Cited by 8
Sobczak, M., & Asejczyk-Widlicka, M. (2021) · Biomedical Optics Express · doi:10.1364/boe.440274 · Cited by 8
Hyperopic SMILE Versus FS-LASIK: A Biomechanical Comparison in Human Fellow Corneas
Spiru, B., Torres-Netto, E. A., Kling, S., Hafezi, F., & Sekundo, W. (2021) · Journal of Refractive Surgery · doi:10.3928/1081597x-20210830-02 · Cited by 8
Hydrogels as Corneal Stroma Substitutes for In Vitro Evaluation of Drug Ocular Permeation
Burgalassi, S., Zucchetti, E., Ling, L., Chetoni, P., Tampucci, S., & Monti, D. (2022) · Pharmaceutics · doi:10.3390/pharmaceutics14040850 · Cited by 8
Lu, X., Song, W., Sun, X., Liu, J., Huang, Y., Shen, J., Liu, S., Han, Q., & Ren, L. (2022) · Materials Today Communications · doi:10.1016/j.mtcomm.2022.104071 · Cited by 8
Tang, Y., Du, E., Wang, G., Qin, F., Meng, Z., Dai, L., Wang, Y., & Ren, S. (2023) · Experimental Eye Research · doi:10.1016/j.exer.2023.109654 · Cited by 8
Scheimpflug Corneal Densitometry Changes After the Intrastromal Corneal Ring Segment Implantation
Sedaghat, M.-R., Momeni‐Moghaddam, H., Heravian, J., Belin, M. W., Ambrósio, R., Gheysari-Alishahi, T., & Ghavami, S. H. (2020) · Cornea · doi:10.1097/ico.0000000000002307 · Cited by 8
Nonlinear optical crosslinking (NLO CXL) for correcting refractive errors
Bradford, S. M., Mikula, E. R., Juhász, T., Brown, D. J., & Jester, J. V. (2020) · Experimental Eye Research · doi:10.1016/j.exer.2020.108199 · Cited by 8
Nanoscale Topographies for Corneal Endothelial Regeneration
Formisano, N., Sahin, G., Català, P., Truckenmüller, R. K., Nuijts, R. M. M. A., Dickman, M. M., LaPointe, V. L. S., & Giselbrecht, S. (2021) · Applied Sciences · doi:10.3390/app11020827 · Cited by 9
Bio-polymeric hydrogels for regeneration of corneal epithelial tissue*
Pourjabbar, B., Biazar, E., Keshel, S. H., Ahani‐Nahayati, M., Baradaran‐Rafii, A., Roozafzoon, R., & Alemzadeh-Ansari, M. H. (2021) · International Journal of Polymeric Materials · doi:10.1080/00914037.2021.1909586 · Cited by 8
Delivery of ionic molecules to anterior chamber by iontophoretic contact lenses
Christopher, K. G., & Chauhan, A. (2019) · European Journal of Pharmaceutics and Biopharmaceutics · doi:10.1016/j.ejpb.2019.04.016 · Cited by 8
Memmi, B., Knoeri, J., Leveziel, L., Georgeon, C., Bouheraoua, N., & Borderie, V. M. (2024) · Scientific Reports · doi:10.1038/s41598-024-71604-y · Cited by 7
Cimino, C., Zingale, E., Bonaccorso, A., Musumeci, T., Carbone, C., & Pignatello, R. (2024) · Molecular Pharmaceutics · doi:10.1021/acs.molpharmaceut.4c00554 · Cited by 7
Eye: Anatomy, Physiology, and Disease
Jaffet, J., Pingali, T., Raut, A. K., Mohapatra, S., & Singh, V. M. (2025) · Springer eBooks · doi:10.1007/978-981-96-6306-4_2 · Cited by 7
Design of Stiff, Tough, and Fast‐Recovery Protein Hydrogels
Wang, R., Gao, Y., Wang, W., Xue, B., & Cao, Y. (2025) · Chinese Journal of Chemistry · doi:10.1002/cjoc.70210 · Cited by 11
Corneal macrophages and limbal stem cells: emerging roles in ocular surface regeneration
Mao, Y., Ou, S., Si, W., Zhang, Y., Xu, S., Qi, Y., & Zhang, F. (2026) · Annals of Medicine · doi:10.1080/07853890.2026.2616082 · Cited by 8
Microstructured collagen films for 3D corneal stroma modelling
Prittinen, J., Zhou, X. H., Bano, F., Backman, L. J., & Danielson, P. (2021) · Connective Tissue Research · doi:10.1080/03008207.2021.2007901 · Cited by 7
Ghosh, S., Khathun, A. H., Athulya, G. S., Vignesh, P., Mathan, L., Mudaraddi, N., Narendran, S., Lalitha, P., & Prajna, N. V. (2023) · Experimental Eye Research · doi:10.1016/j.exer.2023.109669 · Cited by 7
Wang, C., Shen, M., Song, Y., Chang, L., Yang, Y., Li, Y., Liu, T., & Wang, Y. (2023) · Experimental Eye Research · doi:10.1016/j.exer.2023.109677 · Cited by 7
A preliminary study into the emergence of tendon microstructure during postnatal development
Raymond-Hayling, H., Lu, Y., Tom Shearer, N., & Kadler, K. E. (2024) · Matrix Biology Plus · doi:10.1016/j.mbplus.2024.100142 · Cited by 7
Upasani, D., & Daigavane, S. V. (2024) · Cureus · doi:10.7759/cureus.66587 · Cited by 7
Hashimoto, Y., Negishi, J., Funamoto, S., Kimura, T., Kobayashi, H., Oshika, T., & Kishida, A. (2024) · Materials Today Bio · doi:10.1016/j.mtbio.2024.101241 · Cited by 7
Pirounides, D., Komnenou, A. T., Papaioannou, N. G., Gounari, E., Stylianaki, I., Alexandridis, A., Chranioti, A., Kofidou, E., Koliakos, G., & Karampatakis, V. E. (2020) · Medical Hypothesis Discovery & Innovation in Ophthalmology · Cited by 7
Malkondu, F., Arıkoğlu, H., Kaya, D. E., Bozkurt, B., & Özkan, F. (2020) · Turkish Journal of Ophthalmology · doi:10.4274/tjo.galenos.2019.55770 · Cited by 7
Hydrogen promotes the activation of Cu, Zn superoxide dismutase in a rat corneal alkali-burn model
Arima, T., Igarashi, T., Uchiyama, M., Kobayashi, M., Ohsawa, I., Shimizu, A., & Takahashi, H. (2020) · International Journal of Ophthalmology · doi:10.18240/ijo.2020.08.01 · Cited by 7
Vural, E., Hazar, L., & Erol, K. (2020) · International Ophthalmology · doi:10.1007/s10792-020-01649-1 · Cited by 7
Management of sepsis in acute care
See, K. C. (2022) · Singapore Medical Journal · doi:10.11622/smedj.2022023 · Cited by 7
Polarized photoacoustic microscopy based on high-order harmonics for anisotropy detection
Wang, T., Yang, J. S., Wang, W., Wang, L., Wang, X., & Zhou, S. (2022) · Annals of Translational Medicine · doi:10.21037/atm-22-794 · Cited by 6
Miralles, E., Kamma‐Lorger, C. S., Domènech, Ò., Sosa, L., Casals, I., Calpena, A. C., & Silva-Abreu, M. (2022) · International Journal of Molecular Sciences · doi:10.3390/ijms231911184 · Cited by 7
Direct measurements of collagen fiber recruitment in the posterior pole of the eye
Lee, P., Fryc, G., Gnalian, J., Wang, B., Hua, Y., Waxman, S., Zhong, F., Yang, B., & Sigal, I. A. (2023) · Acta Biomaterialia · doi:10.1016/j.actbio.2023.11.013 · Cited by 7
Ballesteros‐Sánchez, A., Peraza‐Nieves, J., Casablanca-Piñera, A., Rodríguez‐Calvo‐de‐Mora, M., Catalán-Coronado, S., Torras-Sanvicens, J., Borroni, D., Sánchez‐González, J., & Rocha‐de‐Lossada, C. (2023) · Journal of Clinical Medicine · doi:10.3390/jcm12227133 · Cited by 7
The Cornea, Anatomy and Function
Jirsová, K. (2017) · Springer eBooks · doi:10.1007/978-3-319-48845-5_1 · Cited by 7
Observations on the retina and ‘optical fold’ of a mesopelagic sabretooth fish, Evermanella balbo
Wagner, H., Partridge, J. C., & Douglas, R. H. (2019) · Cell and Tissue Research · doi:10.1007/s00441-019-03060-4 · Cited by 7
Daphna, O., Mimouni, M., Keshet, Y., Ishai, M. B., Barequet, I. S., Knyazer, B., Mrukwa–Kominek, E., Żarnowski, T., Chen-Zion, M., & Marcovich, A. L. (2020) · Journal of Ophthalmology · doi:10.1155/2020/8410920 · Cited by 7
On the mechanobiology of collagen growth and remodelling
Siadat, S. M. (2020) · doi:10.17760/d20399932 · Cited by 7
Tanrıverdi, A., İzbudak, B., Dastjerd, S. A., Zamani, E., & Bal‐Öztürk, A. (2025) · International Journal of Adhesion and Adhesives · doi:10.1016/j.ijadhadh.2025.103948 · Cited by 6
Fabrication of a 3D Corneal Model Using Collagen Bioink and Human Corneal Stromal Cells
Choi, A. J. S., Hefley, B. S., Strobel, H. A., Moss, S. M., Hoying, J. B., Nicholas, S. E., Moshayedi, S., Kim, J., & Karamichos, D. (2025) · Journal of Functional Biomaterials · doi:10.3390/jfb16040118 · Cited by 6
A mathematical model of corneal endothelium pump function
Vanone, F., Foss, A. J. E., Viola, F., Repetto, R., & Dvoriashyna, M. (2025) · Journal of The Royal Society Interface · doi:10.1098/rsif.2025.0167 · Cited by 6
Corneal bioengineering via electrospun nanofibers and nanoparticles
Salehi, M., Arabpour, Z., Zamani, S., Alizadeh, M., Gharibshahian, M., Rezvani, M., Aldaghi, N., Yekesadat, S. M., & Djalilian, A. R. (2025) · Journal of Biomaterials Applications · doi:10.1177/08853282251393784 · Cited by 7
Gustafsson, I., Bizios, D., Ivarsen, A., & Hjortdal, J. (2023) · Scientific Reports · doi:10.1038/s41598-023-32822-y · Cited by 6
Characterization of Cell Surface Glycan Profiles in Human and Mouse Corneas Using Lectin Microarrays
Martínez-Carrasco, R., & Argüeso, P. (2023) · Cells · doi:10.3390/cells12192356 · Cited by 6
Segmenting mechanically heterogeneous domains via unsupervised learning
Nguyen, Q., & Lejeune, E. (2024) · Biomechanics and Modeling in Mechanobiology · doi:10.1007/s10237-023-01779-2 · Cited by 6
Muzyka−Woźniak, M., Woźniak, S., & Łabuz, G. (2024) · Journal of Refractive Surgery · doi:10.3928/1081597x-20240212-02 · Cited by 6
“Keep on ROCKIn”: Repurposed ROCK inhibitors to boost corneal endothelial regeneration
Vercammen, H., Ondra, M., Kotulová, J., Hoz, E. C. D. L., Witters, C., Ječmeňová, K., Compte, M. L., Deben, C., Dhubhghaill, S. N., Koppen, C., et al. (2024) · Biomedicine & Pharmacotherapy · doi:10.1016/j.biopha.2024.116435 · Cited by 6
Wang, Q., Li, M., Lu, Q., Tao, R., Liao, J., & Zhao, J. (2024) · Current Eye Research · doi:10.1080/02713683.2024.2366309 · Cited by 6
Zhurenkov, K. E., Lobov, A. A., Bildyug, N. B., Alexander-Sinclair, E. I., Darvish, D. M., Lomert, E. V., Kriger, D. V., Zainullina, B. R., Chabina, A. S., Khorolskaya, J. I., et al. (2024) · International Journal of Molecular Sciences · doi:10.3390/ijms25168601 · Cited by 6
Zhang, Q., Zhou, X. J., Zhang, W., Wang, X., Dou, S., Zhao, L., El‐Habta, R., Zhou, Q., Backman, L. J., & Danielson, P. (2024) · The FASEB Journal · doi:10.1096/fj.202401392r · Cited by 6
PI3K signaling and lysyl oxidase is critical to corneal stroma fibrosis following mustard gas injury
Sinha, N. R., Hofmann, A. C., Suleiman, L. A., Laub, R., Tripathi, R., Chaurasia, S. S., & Mohan, R. R. (2024) · Experimental Eye Research · doi:10.1016/j.exer.2024.110213 · Cited by 6
Unlocking the potential of EXOs in regenerative medicine: A comprehensive review
Tabatabai, T. S., Alizadeh, M., Rezakhani, L., Tabatabai, T. S., Ehterami, A., Kloucheh, S. G., Kebria, M. M., Vaez, A., & Salehi, M. (2025) · Tissue and Cell · doi:10.1016/j.tice.2025.103068 · Cited by 7
Collagen-based nanomaterials in drug delivery and biomedical applications
Vichare, R., Hossain, C. M., Ali, K. A., Dutta, D., Sneed, K., & Biswal, M. R. (2021) · Elsevier eBooks · doi:10.1016/b978-0-12-820874-8.00008-7 · Cited by 6
Jiménez‐García, M., Dhubhghaill, S. N., Hershko, S., Koppen, C., & Rozema, J. J. (2021) · Ophthalmic and Physiological Optics · doi:10.1111/opo.12821 · Cited by 6
Excimer laser‐assisted corneal epithelial pattern ablation for corneal cross‐linking
Brekelmans, J., Dickman, M. M., Verma, S., Arba‐Mosquera, S., Goldschmidt, R., Goz, A., Brandis, A. S., Berendschot, T. T. J. M., Saelens, I. E. Y., Marcovich, A. L., et al. (2021) · Acta Ophthalmologica · doi:10.1111/aos.15021 · Cited by 6
Graphene-Lined Porous Gelatin Glycidyl Methacrylate Hydrogels: Implications for Tissue Engineering
Sharifi, R., Sharifi, H., Akbari, A., Dohlman, C. H., Paschalis, E. I., González‐Andrades, M., Kong, J., & Chodosh, J. (2021) · ACS Applied Nano Materials · doi:10.1021/acsanm.1c03201 · Cited by 6
Martins, A. C., Gast, T. J., Burns, S. A., Walker, B. R., & King, B. J. (2022) · Biomedical Optics Express · doi:10.1364/boe.465317 · Cited by 6
Suppression by an RAR-γ Agonist of Collagen Degradation Mediated by Corneal Fibroblasts
Kimura, K., Zhou, H., Orita, T., Kobayashi, M., Nishida, T., & Sonoda, K. (2017) · Investigative Ophthalmology & Visual Science · doi:10.1167/iovs.15-18701 · Cited by 6
Comparative analysis of the corneal birefringence pattern in healthy children and adults
Sobczak, M., Asejczyk-Widlicka, M., Kalinowski, K., & Pierscionek, B. K. (2021) · Ophthalmic and Physiological Optics · doi:10.1111/opo.12835 · Cited by 6
Chitosan-Based Hydrogels for Tissue Engineering
Roy, B. K., Tahmid, I., & Rashid, T. U. (2021) · Springer eBooks · doi:10.1007/978-981-16-4420-7_19 · Cited by 6
Joseph, L. B., Gordon, M. K., Zhou, P., Hahn, R. A., Lababidi, H., Croutch, C. R., Sinko, P. J., Heck, D. E., Laskin, D. L., & Laskin, J. D. (2022) · Experimental and Molecular Pathology · doi:10.1016/j.yexmp.2022.104807 · Cited by 6
Jiang, G.-J., You, X.-G., & Fan, T. (2023) · Chemico-Biological Interactions · doi:10.1016/j.cbi.2023.110511 · Cited by 6
LNP-encapsulated miRNA29b for corneal repair: A novel approach to combat fibrosis
Li, D., Ji, J., Li, X., Xie, Y., Huang, Y., Qin, J., Ding, X., Wang, L., & Fan, Y. (2025) · Materials Today Bio · doi:10.1016/j.mtbio.2025.101695 · Cited by 8
Nie, X., Wang, L., Xu, Z., Cui, C., Wang, S., Li, F., Dai, Q., & Liu, W. (2025) · Advanced Healthcare Materials · doi:10.1002/adhm.202504578 · Cited by 5
M2 macrophage-derived exosomes deliver NGF-modified mRNA to promote comprehensive corneal repair
Gong, D., Chen, H., Wang, H., Witman, N., Lu, Y., Fu, Y., & Fu, W. (2026) · Journal of Controlled Release · doi:10.1016/j.jconrel.2026.114930 · Cited by 5
Second harmonic generation microscopy of the living human cornea
Artal, P., Ávila, F. J., & Bueno, J. M. (2018) · Multiphoton Microscopy in the Biomedical Sciences · doi:10.1117/12.2290470 · Cited by 5
Manta, A., Pop, N. E., Tripon, R. G., Vultur, F., Suzuki, S., Cordoș, B. A., Radu, C. C., Hogea, T., Carasca, C., Horvath, K. U., et al. (2024) · Ophthalmic Plastic and Reconstructive Surgery · doi:10.1097/iop.0000000000002709 · Cited by 5
Transmission interference microscopy of anterior human eye
Alhaddad, S., Ghouali, W., Baudouin, C., Boccara, C., & Mazlin, V. (2025) · Nature Communications · doi:10.1038/s41467-025-62718-6 · Cited by 5
Subramanian, D., Tjahjono, N. S., Nammi, S., Miron-Mendoza, M., Varner, V. D., Petroll, W. M., & Schmidtke, D. W. (2025) · International Journal of Molecular Sciences · doi:10.3390/ijms26031183 · Cited by 5
Li, X., Hayashi, R., Imaizumi, T., Harrington, J., Kudo, Y., Takayanagi, H., Baba, K., & Nishida, K. (2025) · PLoS ONE · doi:10.1371/journal.pone.0321579 · Cited by 5
In vivo removal of KS GAGs from murine cornea by intrastromal injection of keratanase II enzyme
Emu, M. E., Soleimani, M., Baharnoori, S. M., Djalilian, A. R., & Hatami-Marbini, H. (2025) · Experimental Eye Research · doi:10.1016/j.exer.2025.110518 · Cited by 5
The T414G mitochondrial DNA mutation: a biomarker of ageing in human eye
Gary, A.-S., Dorr, M. M., & Rochette, P. J. (2021) · Mutagenesis · doi:10.1093/mutage/geab003 · Cited by 5
Propagation of scalar waves in dense disordered media exhibiting short- and long-range correlations
Rohfritsch, A., Conoir, J.-M., Valier‐Brasier, T., Pierrat, R., & Marchiano, R. (2021) · Physical review. E · doi:10.1103/physreve.104.064138 · Cited by 5
Muench, S., Roellig, M., & Balzani, D. (2021) · Biomechanics and Modeling in Mechanobiology · doi:10.1007/s10237-021-01541-6 · Cited by 5
Tseng, S. H., Yang, C.-Y., Li, J.-H., Jeng, Y.-M., Ranasinghesagara, J. C., & Venugopalan, V. (2022) · Biomedical Optics Express · doi:10.1364/boe.444832 · Cited by 5
Novel DCN Mutation in Armenian Family With Congenital Stromal Corneal Dystrophy
Williams, D., Chung, D. D., Hovakimyan, A. V., Davtyan, A., Glasgow, B. J., & Aldave, A. J. (2022) · Cornea · doi:10.1097/ico.0000000000003167 · Cited by 5
Hydrophilic, Porous, Fiber‐Reinforced Collagen‐Based Membrane for Corneal Repair
Li, Z., Liu, J., Xu, Y., Sun, X., Peng, Y., Zhao, Q., Lin, Y., Huang, Y., & Ren, L. (2024) · Macromolecular Bioscience · doi:10.1002/mabi.202300449 · Cited by 5
Ávila, F. J., del Barco, Ó., Marcellán, M. C., & Remón, L. (2024) · Photonics · doi:10.3390/photonics11060524 · Cited by 5
Smita, S. S., & Pramanik, K. (2024) · International Journal of Polymeric Materials · doi:10.1080/00914037.2024.2408488 · Cited by 5
Microwave treatment of the cornea leads to localised disruption of the extracellular matrix
Morgan, S. R., Hieda, O., Nakai, Y., Boote, C., Hayes, S., Kinoshita, S., Meek, K. M., & Quantock, A. J. (2018) · Scientific Reports · doi:10.1038/s41598-018-32110-0 · Cited by 5
Self-citationA new storage solution for the hypothermic preservation of corneal grafts: an experimental study
Koulouri, I., Hellwinkel, O., Altenähr, S., Spitzer, M. S., Fritz, S., Feuerstacke, J., & Filev, F. S. (2020) · Cell and Tissue Banking · doi:10.1007/s10561-020-09838-z · Cited by 5
Cellular Contractility Profiles of Human Diabetic Corneal Stromal Cells
Lam, T. N., Nicholas, S. E., Choi, A. J. S., Ma, J., & Karamichos, D. (2021) · Analytical Cellular Pathology · doi:10.1155/2021/9913210 · Cited by 5
Corneal Ectasia after Laser-Assisted Small-Incision Lenticule Extraction
Zarei‐Ghanavati, S., Hassanzadeh, S., & Ambrósio, R. (2022) · Journal of Current Ophthalmology · doi:10.4103/joco.joco_79_22 · Cited by 5
Narooie-Noori, F., Mirzajani, A., Jafarzadehpur, E., Behnia, M., & Khabazkhoob, M. (2023) · International Journal of Ophthalmology · doi:10.18240/ijo.2023.04.11 · Cited by 5
Tjoa, K., Nadhif, M. H., Utami, S. S., Kusuma, S. R., Yusuf, P. A., & Adriono, G. A. (2024) · International Journal of Biological Macromolecules · doi:10.1016/j.ijbiomac.2024.131183 · Cited by 5
Capek, K. D., Culnan, D. M., Merkley, K. H., Huang, T. T., & Trocmé, S. D. (2018) · Elsevier eBooks · doi:10.1016/b978-0-323-47661-4.00041-1 · Cited by 5
A Proposed Model of Xeno-Keratoplasty Using 3D Printing and DecellularizationPreprint
Wang, X., Elbahrawi, R. T., Abdukadir, A. M., Ali, Z. M., & Corridon, P. R. (2023) · Preprints.org · doi:10.20944/preprints202303.0522.v1 · Cited by 4
Collagen Fibril Orientation In Vitro: From Formation to Advanced Biomaterial Development
Nashchekina, Y. A., & Нащекин, А. В. (2025) · Biomimetics · doi:10.3390/biomimetics10100644 · Cited by 7
Cui, G., Di, Y.-L., Yang, S., Chen, Y.-X., Li, Y., & Chen, D. (2024) · Frontiers in Medicine · doi:10.3389/fmed.2024.1406748 · Cited by 4
Yang, S. J., Deng, H., Zhang, J., Zhang, T., Xue, C., Wang, X., & Wang, Y. (2025) · Experimental Eye Research · doi:10.1016/j.exer.2025.110277 · Cited by 4
Win, K. Y., Wong, J. H. F., Ying, W. Q., Qi, C. C. S., Chua, J., Wong, D. W. K., Ang, M., Schmetterer, L. F., & Tan, B. (2025) · Translational Vision Science & Technology · doi:10.1167/tvst.14.3.19 · Cited by 4
Assaf, J. F., Hong, J., Li, Y., & Huang, D. (2025) · Translational Vision Science & Technology · doi:10.1167/tvst.14.4.7 · Cited by 4
3D Printing Strategies for Bioengineering Human Cornea
Yuan, Y., Lim, K. S., Sutton, G. L., Wallace, G. G., & You, J. (2025) · Advanced Healthcare Materials · doi:10.1002/adhm.202502767 · Cited by 4
4D Bioprinting of Self‐Morphed Corneal Equivalents Using Smart Hybrid Hydrogels
Ghosh, A., Adhikari, J., Ghosh, S., Bera, A. K., Zeenat, L., Rajora, A. D., Singh, V., Basu, S., & Pati, F. (2025) · Advanced Healthcare Materials · doi:10.1002/adhm.202502721 · Cited by 4
Muñoz-Villaescusa, C., van der Ven, D. L., Quetzeri-Santiago, M. A., & Rivas, D. F. (2026) · Advanced Drug Delivery Reviews · doi:10.1016/j.addr.2026.115792 · Cited by 4
Migratory serpiginous corneal epitheliopathy (MSCE)- details of 4 cases
Mohanty, A., Mittal, R., Khurana, A., Chanda, S., Priyadarshini, S. R., & Sahu, S. K. (2020) · The Ocular Surface · doi:10.1016/j.jtos.2020.08.002 · Cited by 4
Measuring intraocular pressure with OCT: the first approach
Niemczyk, M., & Iskander, D. R. (2023) · Biomedical Optics Express · doi:10.1364/boe.500546 · Cited by 4
Sun, M., Acosta, A. C., Emerick, V. L., Adams, S. M., Avila, M. Y., Margo, C. E., & Espana, E. M. (2024) · Matrix Biology · doi:10.1016/j.matbio.2024.02.004 · Cited by 4
Metadata
- Authors
- Meek, K. M., & Knupp, C.
- Affiliations
- Cardiff University (GB)
- Corresponding author
- Meek, Keith M.
- Venue
- Progress in Retinal and Eye Research
- Publisher
- Elsevier BV
- Published
- 2015-11
- Volume
- 49
- Pages
- 1-16
- ISSN
- 1350-9462 (ISSN-L)
- PMC
- PMC4655862
- OpenAlex
- W1954007937
- Semantic Scholar
- 3bb35dcc7f7012bba80682a274c794b4fcefef47
- Cited by
- 853
- References
- 166
- Citations by year
- 2026: 104 · 2025: 109 · 2024: 101 · 2023: 94 · 2022: 99 · 2021: 88 · 2020: 87 · 2019: 75 · 2018: 45 · 2017: 32 · 2016: 17 · 2015: 1
- FWCI
- 5.05
- Type
- journal article
- Language
- en
- Open access
- hybrid
- doi.org
- Locations
- Progress in Retinal and Eye Research (publishedVersion, cc-by)
- PubMed Central (publishedVersion, cc-by)
- PubMed (publishedVersion)
- ORCA Online Research @Cardiff (Cardiff University) (acceptedVersion)
- Funders
- MRC Programme (503626)
- Diamond Light Source
- ESRF
- Topics
- Health Sciences › Medicine › Ophthalmology › Corneal surgery and disorders
- Health Sciences › Medicine › Ophthalmology › Corneal Surgery and Treatments
- Physical Sciences › Materials Science › Biomaterials › Collagen: Extraction and Characterization
- Keywords
- corneal stroma, corneal transparency, collagen fibrils, collagen lamellae, proteoglycans, corneal ultrastructure, optical transmittance, corneal refractive index
- MeSH terms
- Collagen, Cornea, Corneal Stroma, Crystallins, Humans, Microscopy, Electron, Proteoglycans, Extracellular Matrix Proteins
About these checks
Registry, retraction, Cites and statistics results are computed, not judged, with one exception: a printed reference that no index lists is read once by a model before it counts as a citation error. Claims are extracted by a model and kept only when their quote appears verbatim in the text; each cited source is then checked, with a model’s help, for whether it says what the claim relies on. Those verdicts can be wrong — read the claim’s quote and the cited source before relying on one.
A language model drew the claims from the paper on 2026-11-02, under version 3 of the claim definition (model deepseek-v4.1-flash, prompt extract-v3).
A second model labelled each claim on 2026-11-02 (model jev-1.13-20260917, definition revision gold-guideline-v0.2).
Cited sources are checked with a language model’s help (gpt-6-sol).
Statistics and arithmetic are recomputed, not judged.
Confidence bands are shown only for fields calibrated on our annotated test set. None is calibrated yet, so no band is shown.
What counts as a claim ›How we measure confidence ›How we check this ›
Are you an author, or do you see a problem with this page? Request a review
