

The DOI matches its Crossref record; 5 of the 5 references it cites were found in a registry or an index.
Nucleus basalis and thalamic control of neocortical activity in the freely moving rat
Abstract
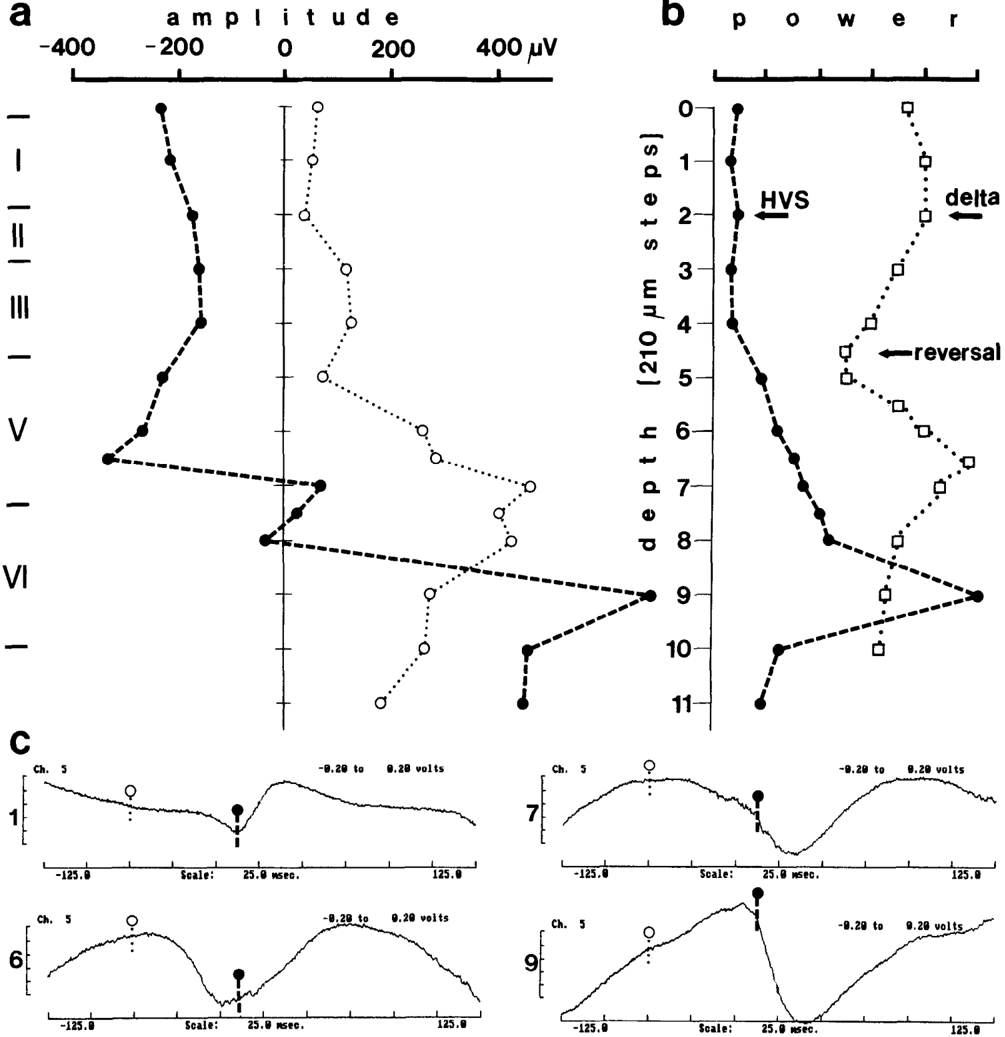
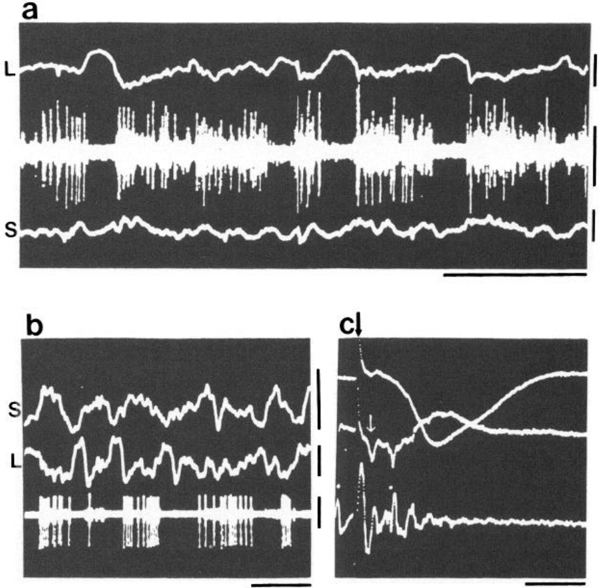
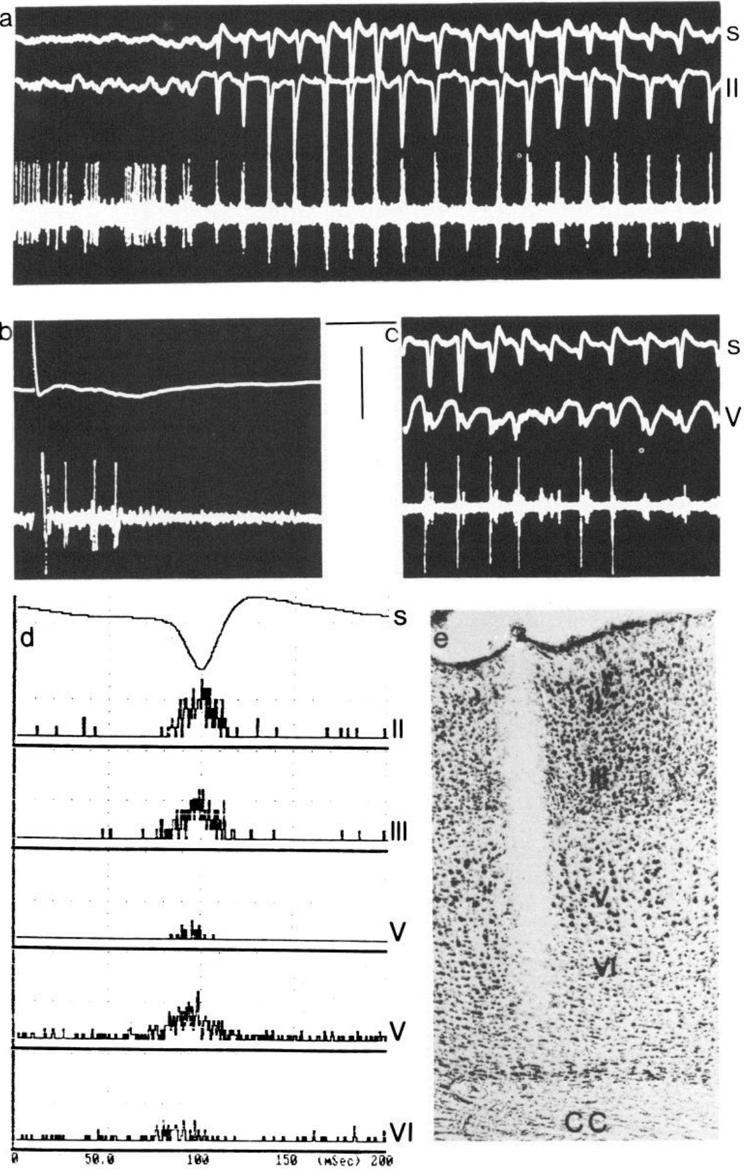
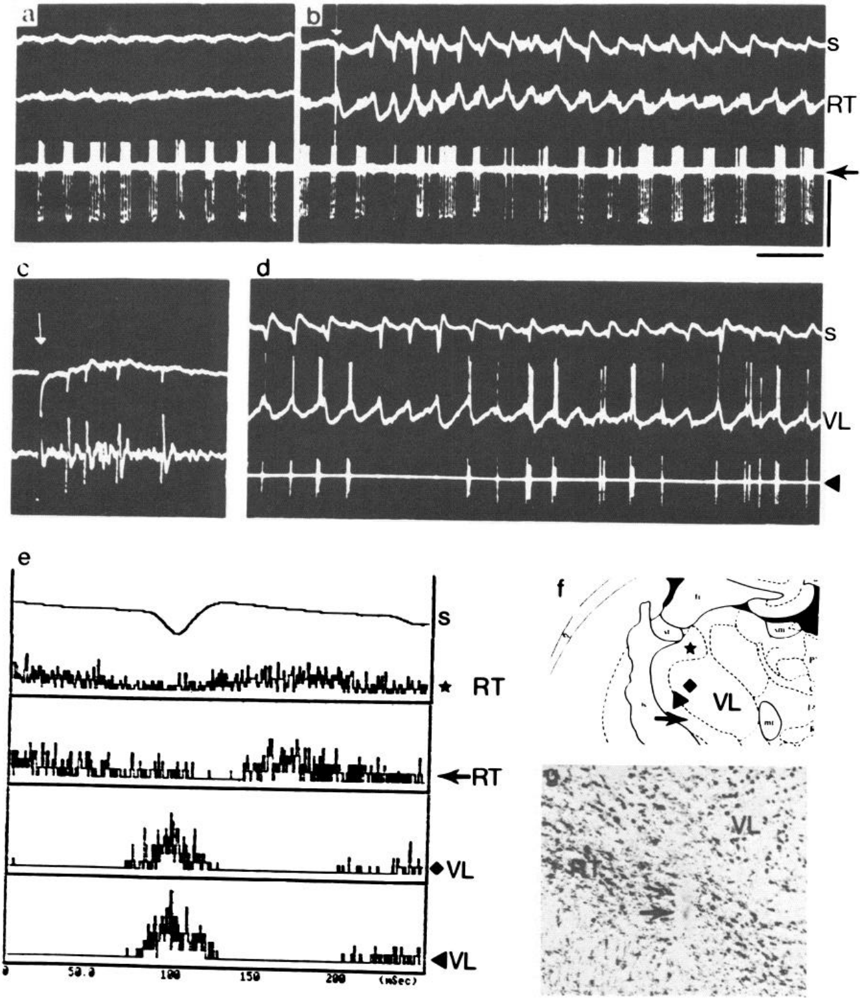
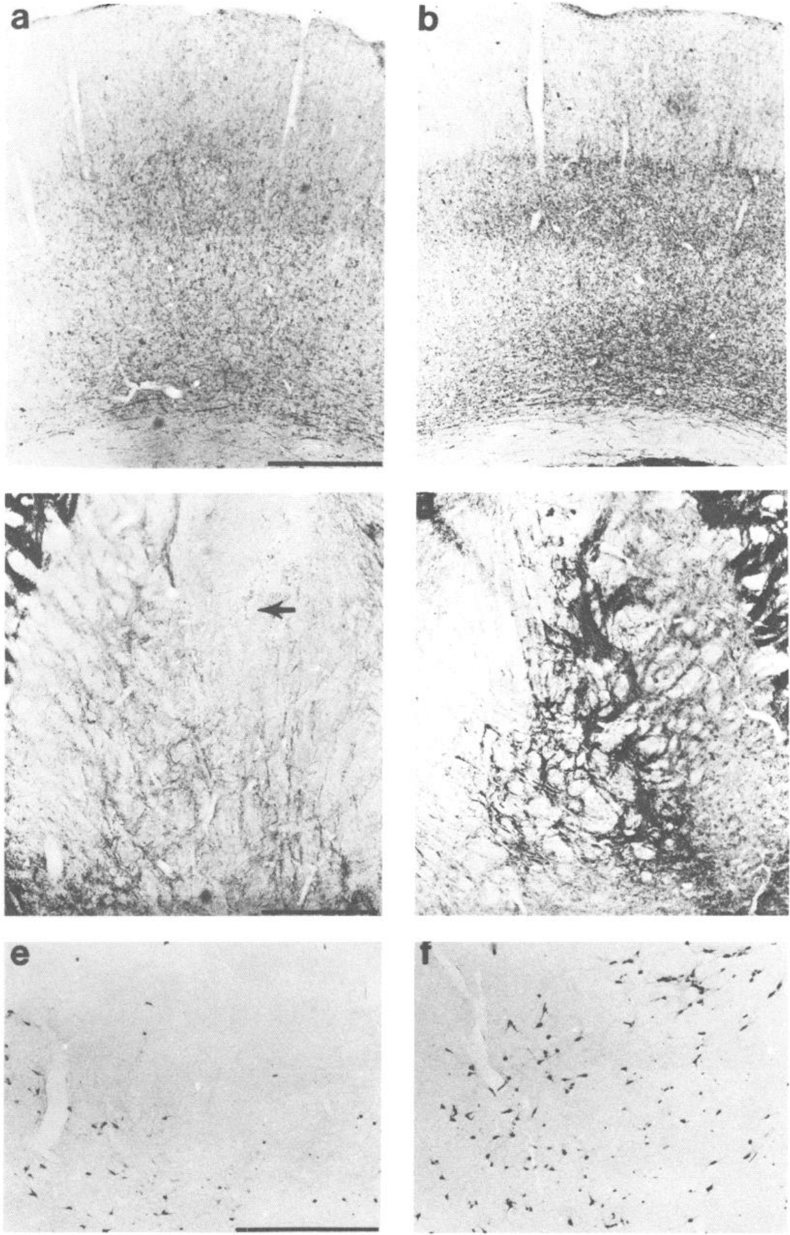
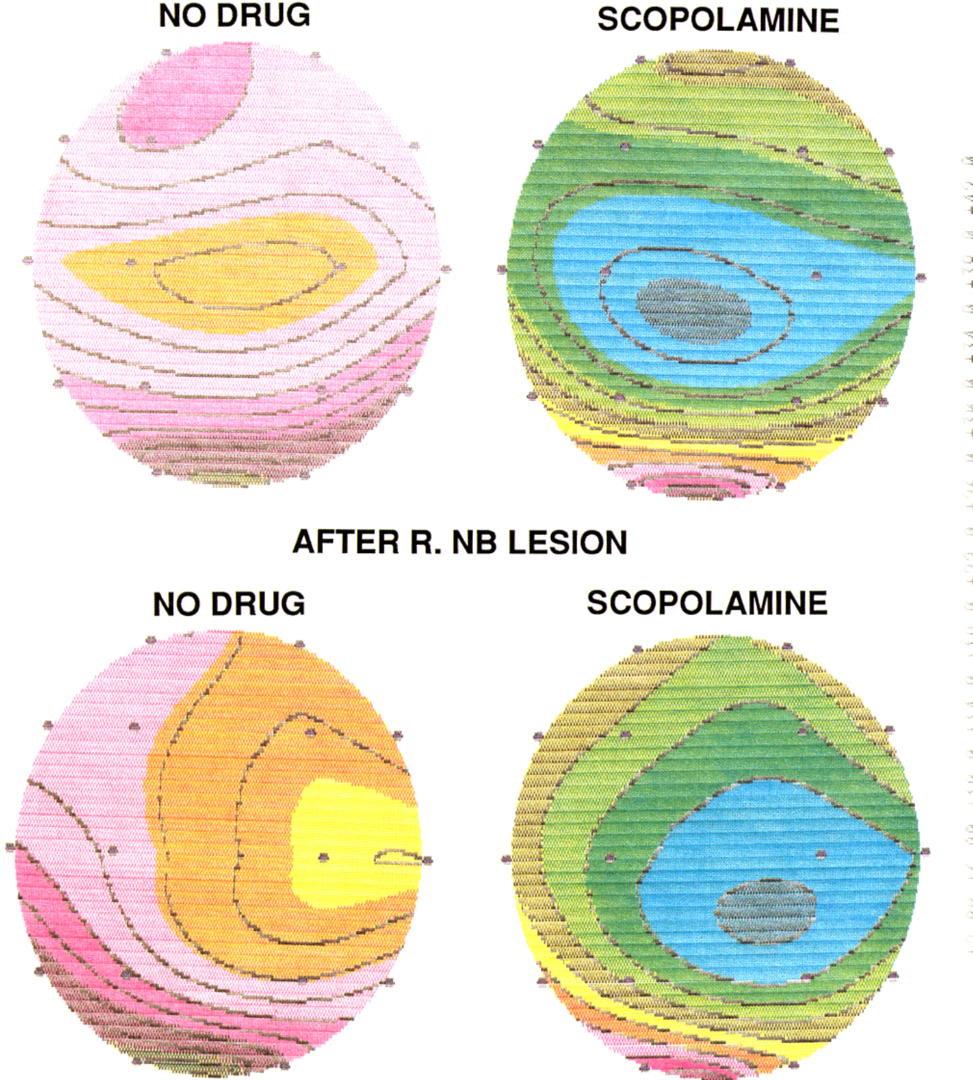
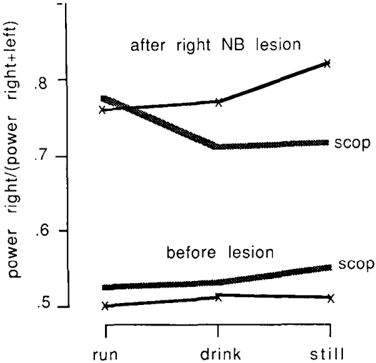
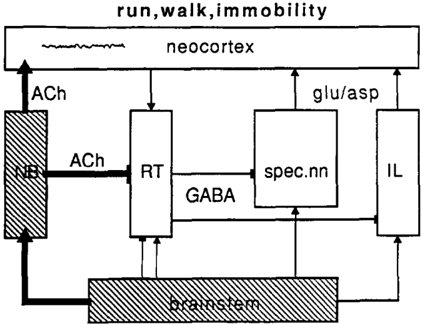
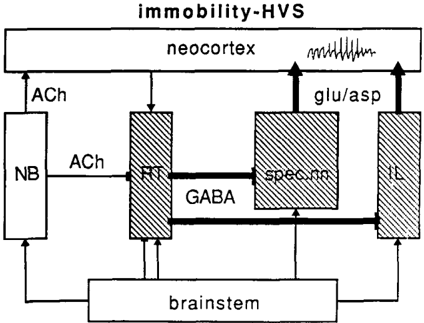
EEG and single-unit techniques have been used to study the EEG correlates of cellular firing in the neocortex, n. reticularis (RT) and “specific” thalamic nuclei, and the cholinergic forebrain area (nucleus basalis, NB). Neuronal firing was related to the ongoing behavior of the rat. In addition, using a 16-channel neocortical recording/mapping system, we studied the effects of ibotenic acid lesion of NB, RT, and other thalamic nuclei on the patterns and spatial distribution of neocortical electrical activity. The majority of neurons in neocortex, NB, and RT increased their firing rates during walking, as compared to during immobility, with concurrent decrease of delta power in the neocortical EEG. During immobility, high-voltage spindles (HVS; greater than 1 mV) were occasionally recorded from the neocortex. Depth profiles of HVS and slow delta waves were different in the neocortex. Neocortical cells decreased their discharge frequency during the positive portion of delta waves recorded in layers V and VI. All cells in the neocortex and specific thalamic nuclei fired rhythmically and phase-locked to the spike component of HVS. RT neurons showed an opposite phase relationship and fired mainly during the wave component of HVS. Half of the NB neurons also showed phasic modulation with HVS. Circumscribed lesion of RT and extensive damage of other thalamic regions, including the intralaminar nuclei, suppressed HVS but had no effect on the neocortical EEG correlates of behavior. In sharp contrast, damage to the NB resulted in a dramatic increase of slow delta waves on the side of the lesion, mimicking the effect of scopolamine administration. We suggest that the NB plays a key role in neocortical arousal by directly activating the neocortex and by suppressing the rhythm generation in the RT-thalamocortical circuitry. We further suggest that the NB system may serve as a structural basis for the concept of the generalized ascending activation of Moruzzi and Magoun (1949).
Overview
The claims and statistics of this paper haven’t been checked yet.
Run the check — free, no account needed. It reads the open-access text and checks the sources it cites.
Integrity signals
Registry
Cites
Statistics
Figures
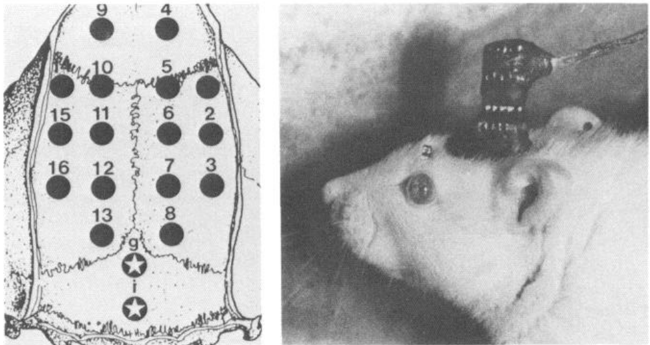
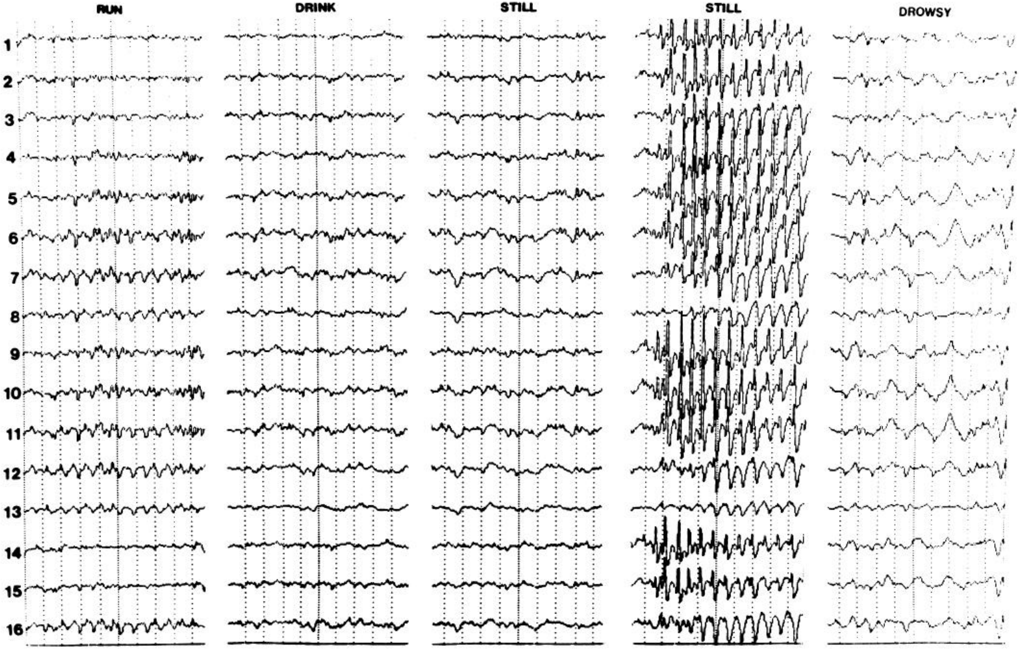
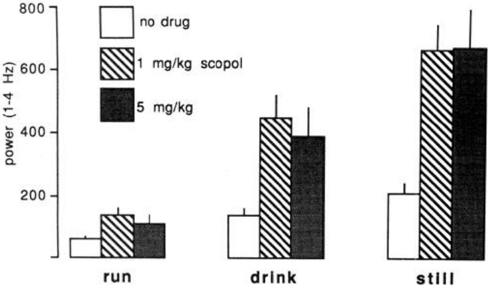
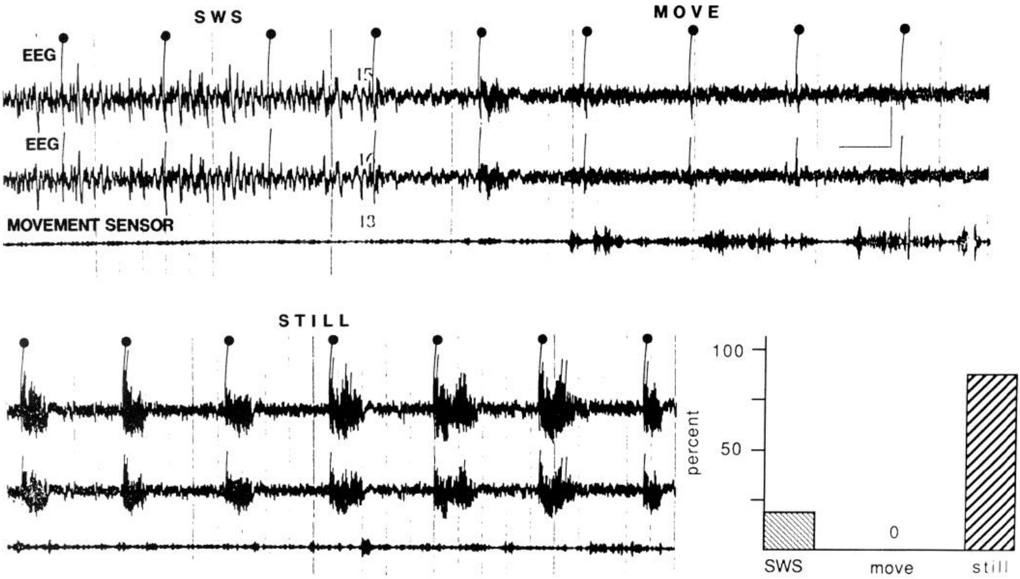
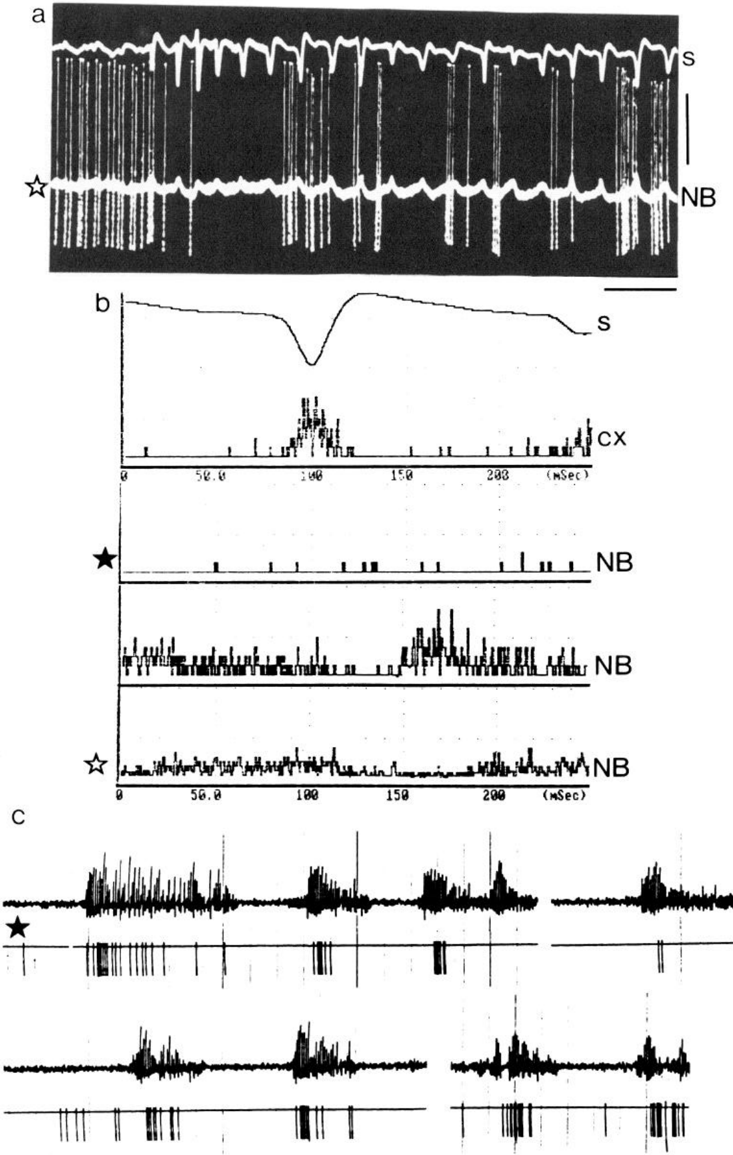
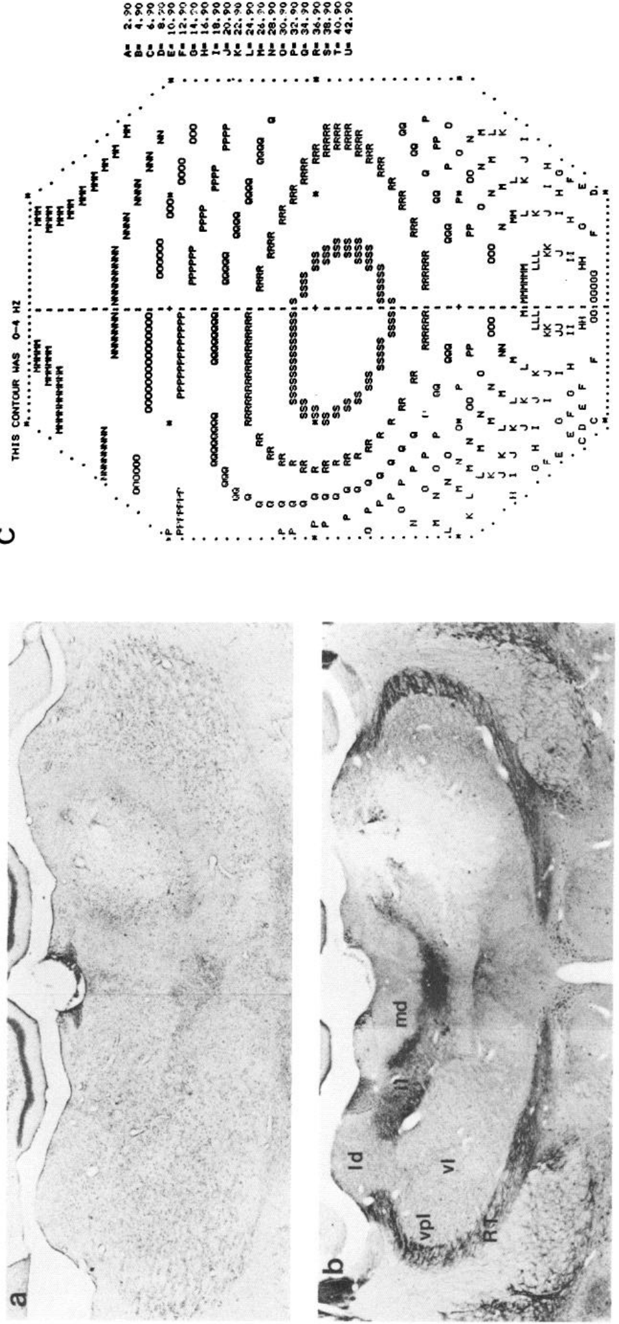
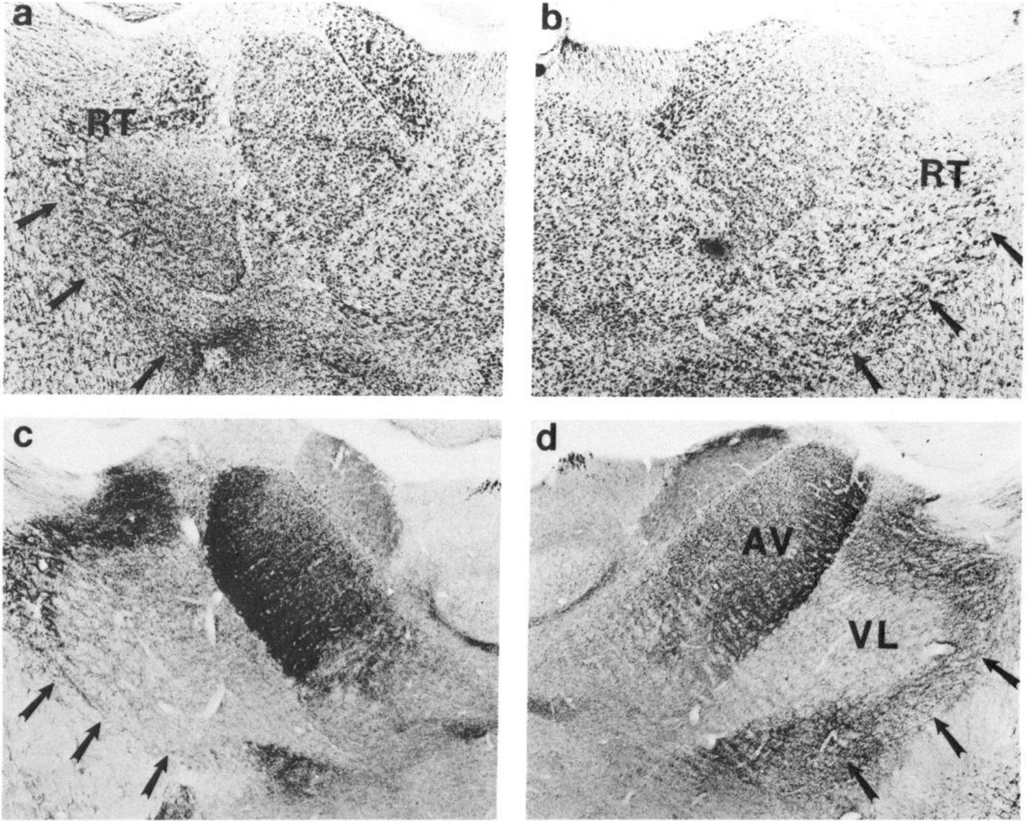
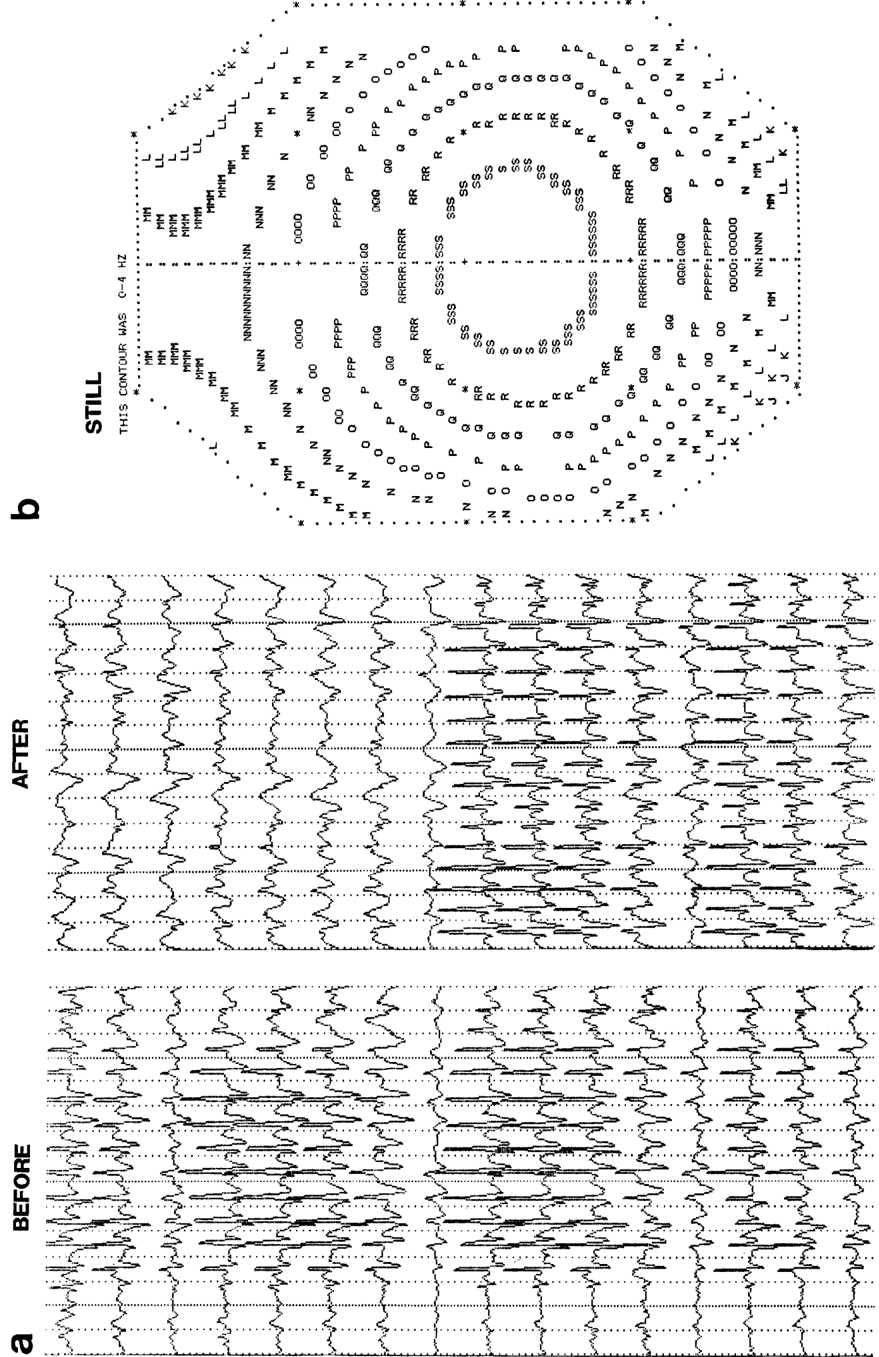
Verification
Claims the paper makes
The claims and statistics of this paper haven’t been checked yet.
Run the check — free, no account needed. It reads the open-access text and checks the sources it cites.
Claims other papers make about this one
Each is checked against this paper’s own text: does it say what the citing paper says it does?
The source backs part of the claim, not all of it — or backs it for a different population, condition or comparison.
In the citing paper
“For example, extensive ablation or inhibition of thalamic neurons fails to alter the normal pattern and amount of waking and sleeping behavior, and the only apparent electroencephalographic abnormality that results is a loss of spindle activity during sleep.8–10”
From Thalamic strokes that severely impair arousal extend into the brainstem (2018) · cites this paper as [10]
Experimental — accuracy not yet measuredIn the citing paper
“These results are consistent with growing evidence that pathways most critical for human arousal lie outside the thalamus.”
From Thalamic strokes that severely impair arousal extend into the brainstem (2018) · cites this paper as [10]
In the citing paper
“Yet the assumption that critical, arousal-promoting projections from the brainstem must synapse in the thalamus has been challenged by a growing body of research in experimental animals.”
From Thalamic strokes that severely impair arousal extend into the brainstem (2018) · cites this paper as [10]
Self-check
Percentages, sums and reported differences re-computed from the paper’s own numbers.
The self-check needs the paper’s full text.
Citations
Cites
Abolition of spindle oscillations in thalamic neurons disconnected from nucleus reticularis thalami
Steriade, M., Deschenes, M., Domich, L., & Mulle, C. (1985) · Journal of Neurophysiology · doi:10.1152/jn.1985.54.6.1473 · Cited by 624
Some aspects of the organization of the thalamic reticular complex
Jones, E. G. (1975) · Journal of Comparative Neurology · doi:10.1002/cne.901620302 · Cited by 582
The afferent and efferent connections of the ventromedial thalamic nucleus in the rat
Herkenham, M. (1979) · Journal of Comparative Neurology · doi:10.1002/cne.901830304 · Cited by 477 · cited 1×
“, 1974), and the ventromedial thalamic nucleus (Herkenham, 1979).”
BackgroundJones, E. G., Burton, H., Saper, C. B., & Swanson, L. W. (1976) · Journal of Comparative Neurology · doi:10.1002/cne.901670402 · Cited by 420
Cholinergic modulation of the functional organization of the cat visual cortex
Sillito, A. M., & Kemp, J. A. (1983) · Brain Research · doi:10.1016/0006-8993(83)90015-x · Cited by 387
Research works printed but not linked: 11
- Bickford, R. G. (1981) A combined EEG and evoked potential pro- cedure in clinical EEG (automated cerebral electrogram-ACE test). In Recent Advances in EEG and EMG Data Processing, N. Yamaguchi and K. Fujisaura, eds., pp. 2 17-235, Elsevier, Amsterdam.
- Bickford, R. G., and B. Allen (1986) A simple add-on personal com- puter procedure for color displays of electrophysiological data: Ad- vantage and pitfalls. In Topographic Mapping of Brain Electrical Ac- tivity, F. H. Duffy, ed., pp. 203-216, Butterworths, Boston.
- Buzs&i, G., R. G. Bickford, D. M. Armstrong, G. Ponomareff, K. Chen, R. Ruiz, L. J. Thal, and F. H. Gage (1988) EEG activity in the neocortex of freely moving young and aged rats. Neuroscience (in press).
- Colonnier, M. (198 1) The electron-microscopic analysis of the neu- ronal organization of the cerebral cortex. In The Organization ofthe Cerebral Cortex, F. 0. Schmitt, F. G. Worden, G. Adelman, and S. G. Dennis, eds., pp. 125-152, MIT Press, Cambridge, London.
- Gottesmann, C. (1967) Recherche sur psychophysiologie du sommeil chez la rat. Thesis, Doctor of Natural Science, Presse du Palais Royal, pp. 1-156.
- Peronnet, I., M. Sindou, A. Laviron, F. Quoex, and P. Germ (1981) Human cortical electrogenesis: Stratigraphy and spectral analysis. In Svnchronization ofEEG Activitv in Evilevsies, H. Petsche and M. A. B: Brazier, eds., pp. 235-261, Springer, Heidelberg.
- Purpura, D. P. (1969) Intemeuronal mechanisms in thalamically in- duced synchronizing and desynchronizing activities. In The Inter- neuron, V. E. Hall, ed., pp. 467-496, U. California Press, Berkeley, Los Angeles.
- Vanderwolf, C. H., and T. H. Robinson (1981) Reticulocortical ac- tivity and behavior: A critique of the arousal theory and a new syn- thesis. Behav. Brain Sci. 4: 459-5 14.
- Villablanca, J. (1974) Role of the thalamus in sleep control. In Basic Sleep Mechanisms, P. Petre-Quadeus and J. Schlag, eds., pp. 5 l-8 1, Academic, New York.
- Walker, A. E. (1938) The Primate Thalamus, U. Chicago Press, Chi- cago.
- Wikler, A. (1952) Pharmacologic dissociation on behavior and EEG sleep patterns in dogs: Morphine, N-allylnormotphine and atropine. Proc. Sot. Exp. Biol. Med. 79: 261-265.
Cited by
Sorted by citations
The origin of extracellular fields and currents — EEG, ECoG, LFP and spikes
Buzsáki, G., Anastassiou, C. A., & Koch, C. (2012) · Nature Reviews Neuroscience · doi:10.1038/nrn3241 · Cited by 4,225
Self-citationWhat we can do and what we cannot do with fMRI
Logothetis, N. K. (2008) · Nature · doi:10.1038/nature06976 · Cited by 3,612
Berridge, C. W., & Waterhouse, B. D. (2003) · Brain Research Reviews · doi:10.1016/s0165-0173(03)00143-7 · Cited by 2,529
Modulation of visual responses by behavioral state in mouse visual cortex
Niell, C. M., & Stryker, M. P. (2010) · Neuron · doi:10.1016/j.neuron.2010.01.033 · Cited by 1,483
“We see a shift from low to high frequency in the LFP spectrum in cortex, which is a characteristic of the actions of acetylcholine and nucleus basalis stimulation (Buzsaki et al., 1988; Metherate et al., 1992; Rodriguez et al., 2004).”
Logothetis, N. K., & Wandell, B. A. (2004) · Annual Review of Physiology · doi:10.1146/annurev.physiol.66.082602.092845 · Cited by 1,568
Control of sleep and wakefulness
Brown, R. E., Basheer, R., McKenna, J. T., Strecker, R. E., & McCarley, R. W. (2012) · Physiological Reviews · doi:10.1152/physrev.00032.2011 · Cited by 1,477
Saper, C. B., Fuller, P. M., Pedersen, N. P., Lu, J., & Scammell, T. E. (2010) · Neuron · doi:10.1016/j.neuron.2010.11.032 · Cited by 1,404
CENTRAL CHOLINERGIC SYSTEMS AND COGNITION
Everitt, B. J., & Robbins, T. W. (1997) · Annual Review of Psychology · doi:10.1146/annurev.psych.48.1.649 · Cited by 1,348
Natural waking and sleep states: a view from inside neocortical neurons
Steriade, M., Timofeev, I., & Grenier, F. (2001) · Journal of Neurophysiology · doi:10.1152/jn.2001.85.5.1969 · Cited by 1,296
Dijk, D., & Czeisler, C. (1995) · The Journal of Neuroscience · doi:10.1523/jneurosci.15-05-03526.1995 · Cited by 1,356
Sleep and arousal: thalamocortical mechanisms
McCormick, D. A., & Bal, T. (1997) · Annual Review of Neuroscience · doi:10.1146/annurev.neuro.20.1.185 · Cited by 1,267
McCormick, D. A. (1992) · Progress in Neurobiology · doi:10.1016/0301-0082(92)90012-4 · Cited by 1,117
Neural Circuitry of Wakefulness and Sleep
Scammell, T. E., Arrigoni, E., & Lipton, J. O. (2017) · Neuron · doi:10.1016/j.neuron.2017.01.014 · Cited by 966
Arousal and Locomotion Make Distinct Contributions to Cortical Activity Patterns and Visual Encoding
Vinck, M., Batista-Brito, R., Knoblich, U., & Cardin, J. A. (2015) · Neuron · doi:10.1016/j.neuron.2015.03.028 · Cited by 819
Modelling and analysis of local field potentials for studying the function of cortical circuits
Einevoll, G. T., Kayser, C., Logothetis, N. K., & Panzeri, S. (2013) · Nature Reviews Neuroscience · doi:10.1038/nrn3599 · Cited by 857
Grouping of spindle activity during slow oscillations in human non-rapid eye movement sleep
Mölle, M., Marshall, L., Gais, S., & Born, J. (2002) · The Journal of Neuroscience · doi:10.1523/jneurosci.22-24-10941.2002 · Cited by 617
The specificity of the ‘nonspecific’ midline and intralaminar thalamic nuclei
Groenewegen, H. J., & Berendse, H. W. (1994) · Trends in Neurosciences · doi:10.1016/0166-2236(94)90074-4 · Cited by 596
Thalamic Mechanisms of EEG Alpha Rhythms and Their Pathological Implications
Hughes, S. W., & Crunelli, V. (2005) · The Neuroscientist · doi:10.1177/1073858405277450 · Cited by 565
Fast modulation of visual perception by basal forebrain cholinergic neurons
Pinto, L., Goard, M. J., Estandian, D., Xu, M., Kwan, A. C., Lee, S.-H., Harrison, T. C., Feng, G., & Dan, Y. (2013) · Nature Neuroscience · doi:10.1038/nn.3552 · Cited by 529
Neurophysiology of the BOLD fMRI Signal in Awake Monkeys
Goense, J. B. M., & Logothetis, N. K. (2008) · Current Biology · doi:10.1016/j.cub.2008.03.054 · Cited by 583
Destexhe, A., Contreras, D., & Steriade, M. (1999) · The Journal of Neuroscience · doi:10.1523/jneurosci.19-11-04595.1999 · Cited by 573
Differential regulation of neocortical synapses by neuromodulators and activity
Gil, Z., Connors, B. W., & Amitai, Y. (1997) · Neuron · doi:10.1016/s0896-6273(00)80380-3 · Cited by 553
Transcranial direct current stimulation during sleep improves declarative memory
Marshall, L., Mölle, M., Hallschmid, M., & Born, J. (2004) · The Journal of Neuroscience · doi:10.1523/jneurosci.2725-04.2004 · Cited by 548
Basal forebrain circuit for sleep-wake control
Xu, M., Chung, S., Zhang, S., Zhong, P., Ma, C., Chang, W.-C., Weissbourd, B., Sakai, N., Luo, L., Nishino, S., et al. (2015) · Nature Neuroscience · doi:10.1038/nn.4143 · Cited by 514
Why do we sleep?11Published on the World Wide Web on 7 November 2000.
Sejnowski, T. J., & Destexhe, A. (2000) · Brain Research · doi:10.1016/s0006-8993(00)03007-9 · Cited by 489
Achermann, P., Dijk, D.-J., Brunner, D. P., & Borbély, A. A. (1993) · Brain Research Bulletin · doi:10.1016/0361-9230(93)90016-5 · Cited by 470
Central Cholinergic Neurons Are Rapidly Recruited by Reinforcement Feedback
Hangya, B., Ranade, S. P., Lorenc, M., & Kepecs, A. (2015) · Cell · doi:10.1016/j.cell.2015.07.057 · Cited by 399
Astrocyte Calcium Signaling Transforms Cholinergic Modulation to Cortical Plasticity In Vivo
Takata, N., Mishima, T., Hisatsune, C., Nagai, T., Ebisui, E., Mikoshiba, K., & Hirase, H. (2011) · The Journal of Neuroscience · doi:10.1523/jneurosci.5289-11.2011 · Cited by 382
Noradrenergic modulation of arousal
Berridge, C. W. (2008) · Brain Research Reviews · doi:10.1016/j.brainresrev.2007.10.013 · Cited by 368
Feldmeyer, D., Brecht, M., Helmchen, F., Petersen, C. C. H., Poulet, J. F. A., Staiger, J. F., Luhmann, H. J., & Schwarz, C. (2013) · Progress in Neurobiology · doi:10.1016/j.pneurobio.2012.11.002 · Cited by 354
“A major role is played by acetylcholine (ACh), norepinephrine (NE), and other neurotransmitters which act in thalamus and cortex amongst other structures (McCormick and Bal, 1997; Buzsaki et al., 1988; Kristt, 1979; Kristt and Waldman, 1981; Houser et al., 1985).”
BackgroundDijk, D.-J., Hayes, B., & Czeisler, C. A. (1993) · Brain Research · doi:10.1016/0006-8993(93)90579-c · Cited by 317
Wang, Z., & McCormick, D. (1993) · The Journal of Neuroscience · doi:10.1523/jneurosci.13-05-02199.1993 · Cited by 307
Neuronal Mechanisms for Sleep/Wake Regulation and Modulatory Drive
Eban-Rothschild, A., Appelbaum, L., & de Lecea, L. (2018) · Neuropsychopharmacology · doi:10.1038/npp.2017.294 · Cited by 282
Subthreshold mechanisms underlying state-dependent modulation of visual responses
Bennett, C., Arroyo, S., & Hestrin, S. (2013) · Neuron · doi:10.1016/j.neuron.2013.08.007 · Cited by 292
Neurophysiology of sleep and wakefulness: basic science and clinical implications
Schwartz, J., & Roth, T. (2008) · Current Neuropharmacology · doi:10.2174/157015908787386050 · Cited by 289
Basal forebrain control of wakefulness and cortical rhythms
Anaclet, C., Pedersen, N. P., Ferrari, L. L., Venner, A., Bass, C. E., Arrigoni, E., & Fuller, P. M. (2015) · Nature Communications · doi:10.1038/ncomms9744 · Cited by 273
Identification of a brainstem circuit regulating visual cortical state in parallel with locomotion
Lee, A. M., Hoy, J. L., Bonci, A., Wilbrecht, L., Stryker, M. P., & Niell, C. M. (2014) · Neuron · doi:10.1016/j.neuron.2014.06.031 · Cited by 282
Interaction between neocortical and hippocampal networks via slow oscillations
Sirota, A., & Buzsáki, G. (2005) · Thalamus and Related Systems · doi:10.1017/s1472928807000258 · Cited by 270
Self-citationMotor cortex feedback influences sensory processing by modulating network state
Zagha, E., Casale, A. E., Sachdev, R. N. S., McGinley, M. J., & McCormick, D. A. (2013) · Neuron · doi:10.1016/j.neuron.2013.06.008 · Cited by 268
Alcohol disrupts sleep homeostasis
Thakkar, M. M., Sharma, R., & Sahota, P. (2015) · Alcohol · doi:10.1016/j.alcohol.2014.07.019 · Cited by 262
Criticality between Cortical States
Fontenele, A. J., de Vasconcelos, N. A. P., Feliciano, T., Aguiar, L. A. A., Soares-Cunha, C., Coimbra, B., Dalla Porta, L., Ribeiro, S., Rodrigues, A. J., Sousa, N., et al. (2019) · Physical Review Letters · doi:10.1103/physrevlett.122.208101 · Cited by 237
Interactions Between Membrane Conductances Underlying Thalamocortical Slow-Wave Oscillations
DESTEXHE, A., & SEJNOWSKI, T. J. (2003) · Physiological Reviews · doi:10.1152/physrev.00012.2003 · Cited by 241
Cholinergic signals in mouse barrel cortex during active whisker sensing
Eggermann, E., Kremer, Y., Crochet, S., & Petersen, C. C. H. (2014) · Cell Reports · doi:10.1016/j.celrep.2014.11.005 · Cited by 234
Klink, R., & Alonso, A. (1997) · Journal of Neurophysiology · doi:10.1152/jn.1997.77.4.1813 · Cited by 228
Heterogeneity of phasic cholinergic signaling in neocortical neurons
Gulledge, A. T., Park, S. B., Kawaguchi, Y., & Stuart, G. J. (2007) · Journal of Neurophysiology · doi:10.1152/jn.00493.2006 · Cited by 194
Mesulam, M. ‐., Hersh, L. B., Mash, D. C., & Geula, C. (1992) · Journal of Comparative Neurology · doi:10.1002/cne.903180308 · Cited by 188
Sleep Neurobiology for the Clinician
(2004) · Sleep · doi:10.1093/sleep/27.4.811 · Cited by 151
Brain areas that influence general anesthesia
Leung, L. S., Luo, T., Ma, J., & Herrick, I. (2014) · Progress in Neurobiology · doi:10.1016/j.pneurobio.2014.08.001 · Cited by 126
Regulation of cortical activity and arousal by the matrix cells of the ventromedial thalamic nucleus
Honjoh, S., Sasai, S., Schiereck, S. S., Nagai, H., Tononi, G., & Cirelli, C. (2018) · Nature Communications · doi:10.1038/s41467-018-04497-x · Cited by 118
Bayraktar, T., Staiger, J. F., Acsady, L., Cozzari, C., Freund, T. F., & Zilles, K. (1997) · Brain Research · doi:10.1016/s0006-8993(97)00218-7 · Cited by 99
Smythies, J. (1997) · Consciousness and Cognition · doi:10.1006/ccog.1997.0315 · Cited by 99
Precisely Timed Nicotinic Activation Drives SST Inhibition in Neocortical Circuits
Urban-Ciecko, J., Jouhanneau, J.-S., Myal, S. E., Poulet, J. F. A., & Barth, A. L. (2018) · Neuron · doi:10.1016/j.neuron.2018.01.037 · Cited by 93
Whalen, P., Kapp, B., & Pascoe, J. (1994) · The Journal of Neuroscience · doi:10.1523/jneurosci.14-03-01623.1994 · Cited by 87
Hypocretin as a Hub for Arousal and Motivation
Tyree, S. M., Borniger, J. C., & de Lecea, L. (2018) · Frontiers in Neurology · doi:10.3389/fneur.2018.00413 · Cited by 83
Dendritic calcium spikes are clearly detectable at the cortical surface
Suzuki, M., & Larkum, M. E. (2017) · Nature Communications · doi:10.1038/s41467-017-00282-4 · Cited by 70
Spike-and-wave epilepsy in rats: sex differences and inheritance of physiological traits
Jando´, G., Carpi, D., Kandel, A., Urioste, R., Horvath, Z., Pierre, E., Vadi, D., Vadasz, C., & Buzsa´ki, G. (1995) · Neuroscience · doi:10.1016/0306-4522(94)00329-4 · Cited by 72
Campbell, I. G., & Feinberg, I. (2016) · Sleep · doi:10.5665/sleep.5346 · Cited by 64
Coma and Related Global Disturbances of the Human Conscious State
Plum, F. (1991) · Cerebral Cortex · doi:10.1007/978-1-4615-6622-9_9 · Cited by 68
Network dysfunction in α‐synuclein transgenic mice and human Lewy body dementia
Morris, M., Sanchez, P. E., Verret, L., Beagle, A. J., Guo, W., Dubal, D., Ranasinghe, K. G., Koyama, A., Ho, K., Yu, G., et al. (2015) · Annals of Clinical and Translational Neurology · doi:10.1002/acn3.257 · Cited by 61
Faraguna, U., Nelson, A., Vyazovskiy, V. V., Cirelli, C., & Tononi, G. (2010) · Cerebral Cortex · doi:10.1093/cercor/bhq041 · Cited by 54
Thalamic strokes that severely impair arousal extend into the brainstem
Hindman, J., Bowren, M. D., Bruss, J., Wright, B., Geerling, J. C., & Boes, A. D. (2018) · Annals of Neurology · doi:10.1002/ana.25377 · Cited by 53
Cholinergic Control in Developing Prefrontal–Hippocampal Networks
Janiesch, P. C., Krüger, H.-S., Pöschel, B., & Hanganu-Opatz, I. L. (2011) · The Journal of Neuroscience · doi:10.1523/jneurosci.2644-11.2011 · Cited by 49
To what extent do neurobiological sleep-waking processes support psychoanalysis?
Gottesmann, C. (2010) · International review of neurobiology · doi:10.1016/s0074-7742(10)92012-6 · Cited by 5
Metadata
- Authors
- Buzsaki, G., Bickford, R., Ponomareff, G., Thal, L., Mandel, R., & Gage, F.
- Venue
- The Journal of Neuroscience
- Publisher
- Society for Neuroscience
- Published
- 1988-11-01
- Volume
- 8
- Issue
- 11
- Pages
- 4007-4026
- ISSN
- 0270-6474
- 1529-2401
- Cited by
- 848
- References
- 5
- Language
- en
About these checks
Registry, retraction, Cites and statistics results are computed, not judged, with one exception: a printed reference that no index lists is read once by a model before it counts as a citation error. Claims are extracted by a model and kept only when their quote appears verbatim in the text; each cited source is then checked, with a model’s help, for whether it says what the claim relies on. Those verdicts can be wrong — read the claim’s quote and the cited source before relying on one.
Statistics and arithmetic are recomputed, not judged.
Confidence bands are shown only for fields calibrated on our annotated test set. None is calibrated yet, so no band is shown.
What counts as a claim ›How we measure confidence ›How we check this ›
Are you an author, or do you see a problem with this page? Request a review
