

The DOI matches its Crossref record; 138 of the 138 references it cites were found in a registry or an index; 19 of the 112 sources its claims cite were checked for support.
A harmonized atlas of mouse spinal cord cell types and their spatial organization
Open accessAbstract
Single-cell RNA sequencing data can unveil the molecular diversity of cell types. Cell type atlases of the mouse spinal cord have been published in recent years but have not been integrated together. Here, we generate an atlas of spinal cell types based on single-cell transcriptomic data, unifying the available datasets into a common reference framework. We report a hierarchical structure of postnatal cell type relationships, with location providing the highest level of organization, then neurotransmitter status, family, and finally, dozens of refined populations. We validate a combinatorial marker code for each neuronal cell type and map their spatial distributions in the adult spinal cord. We also show complex lineage relationships among postnatal cell types. Additionally, we develop an open-source cell type classifier, SeqSeek, to facilitate the standardization of cell type identification. This work provides an integrated view of spinal cell types, their gene expression signatures, and their molecular organization.
Overview
AI snapshot
Written from the paper’s full text.
TL;DR
This paper harmonizes six published single-cell/nucleus RNA-sequencing datasets into a common reference atlas of postnatal mouse spinal cord cell types, identifying 16 major cell types and 69 neuronal populations. It validates combinatorial marker genes in adult tissue, infers embryonic lineage relationships, and provides a two-tiered classifier and web resource, SeqSeek.
Key findings
- Integration of six studies yielded a final dataset of 52,623 cells/nuclei and 16 major cell types, including 69 neuronal clusters comprising 19,353 neuronal cells/nuclei.
- Spatial location was the highest level of organization: dorsal and mid/ventral neurons separated before neurotransmitter status, and dorsal clusters were more robust and more readily identified in situ than ventral clusters.
- In adult lumbar spinal cord, 71% of neurons (2057/2894) were confidently assigned to one of the 69 neuronal clusters, and an additional 9% (266/2894) to pairs of closely related clusters; 79 of 95 tested genes showed reliable expression.
- Automated classification performed well: coarse cell-type accuracy was 89% for label transfer, 83% for a neural network, and 80% for an SVM; the two-tiered model classified 90% of nuclei from known independent clusters accurately and identified 28% of nuclei from unknown clusters.
Methods
- Raw sequencing reads from the first six publicly available postnatal mouse spinal cord single-cell datasets were reprocessed uniformly, merged, and integrated with Seurat; results were compared with Harmony, Conos, and LIGER.
- Clustering was performed in phases for all cells, all neurons, and targeted mid/ventral and motoneuron subsets; cell-type relationships were analyzed by principal-component distances, dendrograms, differential expression, and GO analysis.
- Validation used high-content RNA in situ hybridization with 95 unique genes in ten overlapping sets on adult lumbar spinal cord sections from N = 3 animals, plus immunofluorescence and WFA-lectin staining; embryonic lineage was inferred by co-integration with an e9.5–e13.5 dataset, and classifiers were tested on an independent 10x single-nucleus dataset from four adult mice.
Limitations
- Stated: the atlas is limited to RNA expression in postnatal mouse spinal cord and merges multiple time points; in situ validation is limited to adult lumbar spinal cord, so failure to detect some genes may reflect age, region, transient expression, or technical issues.
- Stated: the analysis is population-based and likely underrepresents true biological variability, including noisy expression and continua of cell types; single-cell/nucleus profiling gives one perspective and may not capture connectivity, electrophysiology, or behavioral function.
- Evident: classifier training used labels from the harmonized analysis because no gold standard exists, and several original datasets were included in training, so some performance estimates may be artificially high; ventral clusters were less robust and less separable than dorsal clusters.
Model-written summary. Check it against the paper before relying on it.
Integrity signals
Registry
Cites
Statistics
Figures
Verification
Claims the paper makes
136 Own result · 42 Own interpretation · 38 Not checked yet · 17 Own method · 17 No basis given · 4 Partly supported · accuracy not yet measured
A result the paper reports from its own data — it cites no other source for it, so there is none to check. The quote shows it is in the paper.
In the paper
“We report a hierarchical structure of postnatal cell type relationships, with location providing the highest level of organization, then neurotransmitter status, family, and finally, dozens of refined populations.”
§ A harmonized atlas of mouse spinal cord cell types and their spatial organization > Abstract
plaincorrelational- Asserted: passes — The authors put it forward as true.
- Checkable: passes — It can be checked against evidence.
- Load-bearing: passes — The paper’s conclusions depend on it.
- Based: passes — The paper gives a reason why it holds.
The paper states this without a source or data behind it here, so there is nothing to check it against. The quote shows it is in the paper.
In the paper
“We also show complex lineage relationships among postnatal cell types.”
§ A harmonized atlas of mouse spinal cord cell types and their spatial organization > Abstract
plaincorrelational- Asserted: passes — The authors put it forward as true.
- Checkable: passes — It can be checked against evidence.
- Load-bearing: unclear — It is unclear whether the paper’s conclusions depend on it.
- Based: passes — The paper gives a reason why it holds.
A result the paper reports from its own data — it cites no other source for it, so there is none to check. The quote shows it is in the paper.
In the paper
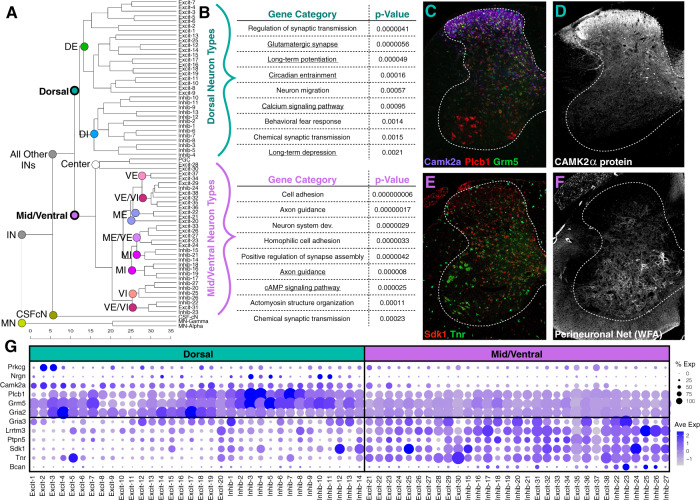
“Intriguingly, neurons that are located at the spatial mid-point between the dorsal and ventral sides of the cord (preganglionic cells and two excitatory populations near the central canal) were organized as a single branch (Fig. 3a; center), further underscoring the importance of spatial distribution as an organizing principle in the spinal cord.”
§ A harmonized atlas of mouse spinal cord cell types and their spatial organization > Results > General trends in molecular identity relationships amongst neuronal populations
plaincorrelational- Asserted: passes — The authors put it forward as true.
- Checkable: passes — It can be checked against evidence.
- Load-bearing: passes — The paper’s conclusions depend on it.
- Based: passes — The paper gives a reason why it holds.
A result the paper reports from its own data — it cites no other source for it, so there is none to check. The quote shows it is in the paper.
In the paper
“We found general agreement between the clusters that they reported and our harmonized analysis with the following differences (Supplementary Fig. 7).”
§ A harmonized atlas of mouse spinal cord cell types and their spatial organization > Results > Overview of harmonized neuronal cell types
plaincorrelational- Asserted: passes — The authors put it forward as true.
- Checkable: passes — It can be checked against evidence.
- Load-bearing: unclear — It is unclear whether the paper’s conclusions depend on it.
- Based: passes — The paper gives a reason why it holds.
A result the paper reports from its own data — it cites no other source for it, so there is none to check. The quote shows it is in the paper.
In the paper
“Interestingly, this bifurcation occurred even before cell types split by neurotransmitter status (for example into dorsal excitatory or dorsal inhibitory types), a core feature of neuronal identity.”
§ A harmonized atlas of mouse spinal cord cell types and their spatial organization > Results > General trends in molecular identity relationships amongst neuronal populations
plaincorrelational- Asserted: passes — The authors put it forward as true.
- Checkable: passes — It can be checked against evidence.
- Load-bearing: passes — The paper’s conclusions depend on it.
- Based: passes — The paper gives a reason why it holds.
A result the paper reports from its own data — it cites no other source for it, so there is none to check. The quote shows it is in the paper.
In the paper
“Sixteen major types were identified that represent all known classes of spinal cord cell types.”
§ A harmonized atlas of mouse spinal cord cell types and their spatial organization > Results > A harmonized atlas of major cell types
plain- Asserted: passes — The authors put it forward as true.
- Checkable: passes — It can be checked against evidence.
- Load-bearing: passes — The paper’s conclusions depend on it.
- Based: passes — The paper gives a reason why it holds.
None of the sources cited for this claim have been checked yet.
In the paper
“This larger dataset, combined with the barcoding of the Alkaslasi study enabled the identification of distinctly localized MN subtypes that were not previously resolved.”
§ A harmonized atlas of mouse spinal cord cell types and their spatial organization > Results > Detailed cluster analysis and marker validation for harmonized neuronal cell types
What the sources say
- Not checked yetcites Blum et al.10 Blum, J. A. et al. Single-cell transcriptomic analysis of the adult mouse spinal cord reveals molecular diversity of autonomic and skeletal motor neurons. Nat. Neurosci. 24, 572–583 (2021). source
- Not checked yetcites Alkaslasi et al.11 Alkaslasi, M. R. et al. Single nucleus RNA-sequencing defines unexpected diversity of cholinergic neuron types in the adult mouse spinal cord. Nat. Commun. 12, 2471 (2021). source
plaindirect- Asserted: passes — The authors put it forward as true.
- Checkable: passes — It can be checked against evidence.
- Load-bearing: passes — The paper’s conclusions depend on it.
- Based: passes — The paper gives a reason why it holds.
A result the paper reports from its own data — it cites no other source for it, so there is none to check. The quote shows it is in the paper.
In the paper
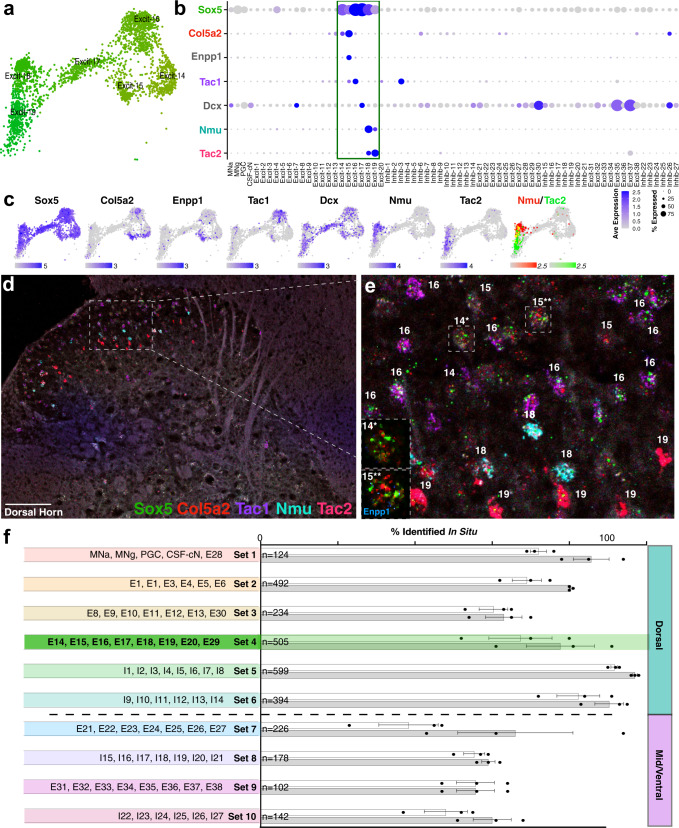
“Using this approach, 79 genes (out of 95) showed reliable expression in the adult spinal cord (Supplementary Table 3) and 71% of neurons in the adult lumbar spinal cord could be identified as belonging to one of the 69 neuronal clusters (2057/2894 total).”
§ A harmonized atlas of mouse spinal cord cell types and their spatial organization > Results > Detailed cluster analysis and marker validation for harmonized neuronal cell types
plain- Asserted: passes — The authors put it forward as true.
- Checkable: passes — It can be checked against evidence.
- Load-bearing: passes — The paper’s conclusions depend on it.
- Based: passes — The paper gives a reason why it holds.
A result the paper reports from its own data — it cites no other source for it, so there is none to check. The quote shows it is in the paper.
In the paper
“As expected, the cell types that were derived from each study corresponded to the techniques used to isolate the cells or nuclei (Supplementary Fig. 2e).”
§ A harmonized atlas of mouse spinal cord cell types and their spatial organization > Results > A harmonized atlas of major cell types
plaincorrelational- Asserted: passes — The authors put it forward as true.
- Checkable: passes — It can be checked against evidence.
- Load-bearing: unclear — It is unclear whether the paper’s conclusions depend on it.
- Based: passes — The paper gives a reason why it holds.
None of the sources cited for this claim have been checked yet.
In the paper
“In each case, highly reliable cell type results were observed, based on visual inspection of UMAP distributions and low Local Inverse Simpson Index (LISI) values for cell type coherence when compared to Seurat integration.”
§ A harmonized atlas of mouse spinal cord cell types and their spatial organization > Results > Merged analysis of spinal cord cells and nuclei
What the sources say
- Not checked yetcites [25] Korsunsky, I. et al. Fast, sensitive and accurate integration of single-cell data with Harmony. Nat. Meth 16, 1289–1296 (2019). source
- Not checked yetcites [26] Barkas, N. et al. Joint analysis of heterogeneous single-cell RNA-seq dataset collections. Nat. Meth 16, 695–698 (2019). source
- Not checked yetcites [27] Welch, J. D. et al. Single-cell multi-omic integration compares and contrasts features of brain cell identity. Cell 177, 1873–1887.e17 (2019). source
plaincorrelational- Asserted: passes — The authors put it forward as true.
- Checkable: passes — It can be checked against evidence.
- Load-bearing: passes — The paper’s conclusions depend on it.
- Based: passes — The paper gives a reason why it holds.
A result the paper reports from its own data — it cites no other source for it, so there is none to check. The quote shows it is in the paper.
In the paper
“Second, most excitatory or inhibitory clusters that Blum et al. described corresponded to multiple refined harmonized clusters.”
§ A harmonized atlas of mouse spinal cord cell types and their spatial organization > Results > Overview of harmonized neuronal cell types
plaincorrelational- Asserted: passes — The authors put it forward as true.
- Checkable: passes — It can be checked against evidence.
- Load-bearing: passes — The paper’s conclusions depend on it.
- Based: passes — The paper gives a reason why it holds.
None of the sources cited for this claim have been checked yet.
In the paper
“Finally, we compared all marker genes that we highlight in this paper (those in Table 1 and all figures) to their patterns in a recent spatial transcriptomics analysis of the spinal cord28 and to the Allen29 and Gensat30 expression databases and found general concordance between these resources (Supplementary Table 4).”
§ A harmonized atlas of mouse spinal cord cell types and their spatial organization > Results > Overview of harmonized neuronal cell types
What the sources say
- Not checked yetcites [28] Maniatis, S. et al. Spatiotemporal dynamics of molecular pathology in amyotrophic lateral sclerosis. Science 364, 89–93 (2019). source
- Not checked yetcites [29] Lein, E. S. et al. Genome-wide atlas of gene expression in the adult mouse brain. Nature 445, 168–176 (2007). source
- Not checked yetcites [30] Gong, S. et al. A gene expression atlas of the central nervous system based on bacterial artificial chromosomes. Nature 425, 917–925 (2003). source
plaincorrelational- Asserted: passes — The authors put it forward as true.
- Checkable: passes — It can be checked against evidence.
- Load-bearing: unclear — It is unclear whether the paper’s conclusions depend on it.
- Based: passes — The paper gives a reason why it holds.
A result the paper reports from its own data — it cites no other source for it, so there is none to check. The quote shows it is in the paper.
In the paper
“Using this approach, 79 genes (out of 95) showed reliable expression in the adult spinal cord (Supplementary Table 3) and 71% of neurons in the adult lumbar spinal cord could be identified as belonging to one of the 69 neuronal clusters (2057/2894 total).”
§ A harmonized atlas of mouse spinal cord cell types and their spatial organization > Results > Detailed cluster analysis and marker validation for harmonized neuronal cell types
plain- Asserted: passes — The authors put it forward as true.
- Checkable: passes — It can be checked against evidence.
- Load-bearing: passes — The paper’s conclusions depend on it.
- Based: passes — The paper gives a reason why it holds.
A result the paper reports from its own data — it cites no other source for it, so there is none to check. The quote shows it is in the paper.
In the paper
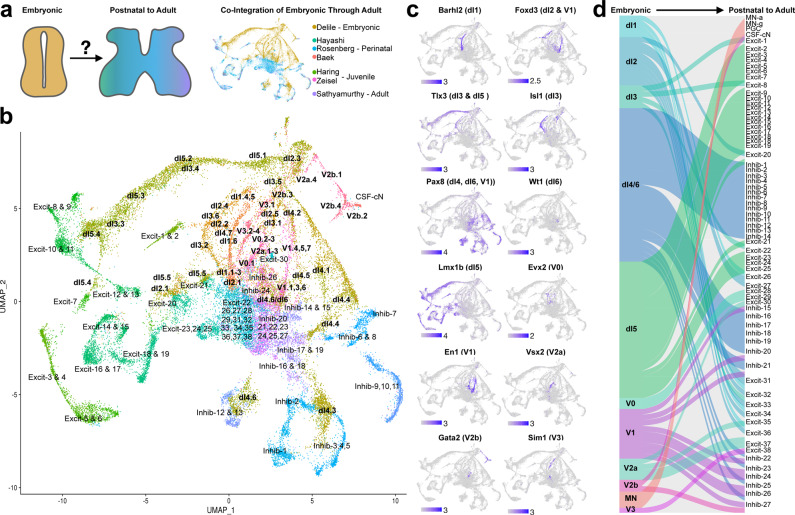
“We clustered the cells and nuclei of this meta-dataset to reveal 15 non-neural and 69 neural cell types, thereby providing a cell type resolution and characterization that surpasses all prior studies, both in the depth of its detail and the breadth of general trends.”
§ A harmonized atlas of mouse spinal cord cell types and their spatial organization > Introduction
plaindirect- Asserted: passes — The authors put it forward as true.
- Checkable: passes — It can be checked against evidence.
- Load-bearing: passes — The paper’s conclusions depend on it.
- Based: passes — The paper gives a reason why it holds.
A result the paper reports from its own data — it cites no other source for it, so there is none to check. The quote shows it is in the paper.
In the paper
“An additional 9% of neurons could be identified as belonging to pairs of closely related clusters (266/2894 total).”
§ A harmonized atlas of mouse spinal cord cell types and their spatial organization > Results > Detailed cluster analysis and marker validation for harmonized neuronal cell types
hedged- Asserted: passes — The authors put it forward as true.
- Checkable: passes — It can be checked against evidence.
- Load-bearing: unclear — It is unclear whether the paper’s conclusions depend on it.
- Based: passes — The paper gives a reason why it holds.
A result the paper reports from its own data — it cites no other source for it, so there is none to check. The quote shows it is in the paper.
In the paper
“As expected, genes involved in neurotransmitter status were detected (such as Pax2 and Gad2) but we also observed consistent differential expression between excitatory and inhibitory neurons for a pair of calcium channels (Cacna2d3 and Cacna2d1) and a pair of synaptic adhesion molecules that promote repulsion to limit homophilic interactions (Dscam and Dscaml1) (Supplementary Fig. 8).”
§ A harmonized atlas of mouse spinal cord cell types and their spatial organization > Results > General trends in molecular identity relationships amongst neuronal populations
plaincorrelational- Asserted: passes — The authors put it forward as true.
- Checkable: passes — It can be checked against evidence.
- Load-bearing: unclear — It is unclear whether the paper’s conclusions depend on it.
- Based: passes — The paper gives a reason why it holds.
A result the paper reports from its own data — it cites no other source for it, so there is none to check. The quote shows it is in the paper.
In the paper
“This revealed that the primary distinctions within spinal interneurons/projection neurons (non-motoneurons) were based on spatial location in the dorsal horn or mid/ventral regions of the spinal cord.”
§ A harmonized atlas of mouse spinal cord cell types and their spatial organization > Results > General trends in molecular identity relationships amongst neuronal populations
plaincorrelational- Asserted: passes — The authors put it forward as true.
- Checkable: passes — It can be checked against evidence.
- Load-bearing: passes — The paper’s conclusions depend on it.
- Based: passes — The paper gives a reason why it holds.
A result the paper reports from its own data — it cites no other source for it, so there is none to check. The quote shows it is in the paper.
In the paper
“This detailed in situ hybridization analysis also revealed the in-tissue prevalence and laminar location of each of the lumbar adult neuronal cell types (Table 1) and can serve to translate single-cell sequencing data back into tissue-based analysis.”
§ A harmonized atlas of mouse spinal cord cell types and their spatial organization > Results > Detailed cluster analysis and marker validation for harmonized neuronal cell types
plain- Asserted: passes — The authors put it forward as true.
- Checkable: passes — It can be checked against evidence.
- Load-bearing: passes — The paper’s conclusions depend on it.
- Based: passes — The paper gives a reason why it holds.
A result the paper reports from its own data — it cites no other source for it, so there is none to check. The quote shows it is in the paper.
In the paper
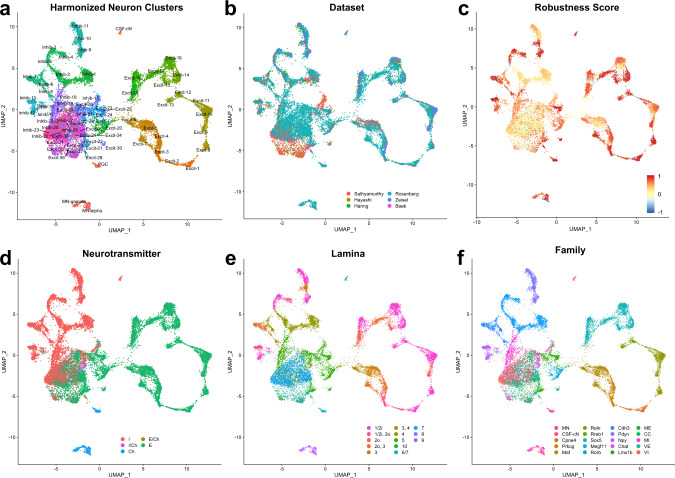
“Of note, the ability to use defined markers to identify cell types in tissue varied by combinatorial gene set such that dorsal sets could be more readily assigned based on in situ gene expression than ventral sets (Fig. 4F).”
§ A harmonized atlas of mouse spinal cord cell types and their spatial organization > Results > Detailed cluster analysis and marker validation for harmonized neuronal cell types
plaincorrelational- Asserted: passes — The authors put it forward as true.
- Checkable: passes — It can be checked against evidence.
- Load-bearing: unclear — It is unclear whether the paper’s conclusions depend on it.
- Based: passes — The paper gives a reason why it holds.
A result the paper reports from its own data — it cites no other source for it, so there is none to check. The quote shows it is in the paper.
In the paper
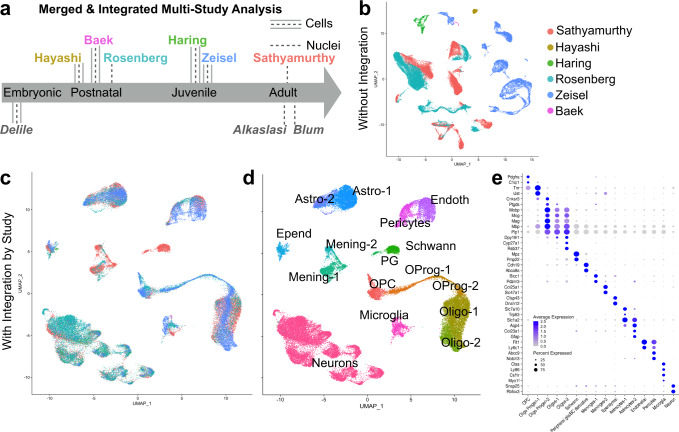
“With the integrated merged data, we performed preliminary clustering and removed low-quality clusters and doublets (see Methods) to obtain a final dataset of over fifty thousand cells and nuclei (Supplementary Fig. 2a, e).”
§ A harmonized atlas of mouse spinal cord cell types and their spatial organization > Results > Merged analysis of spinal cord cells and nuclei
plaindirect- Asserted: passes — The authors put it forward as true.
- Checkable: passes — It can be checked against evidence.
- Load-bearing: passes — The paper’s conclusions depend on it.
- Based: passes — The paper gives a reason why it holds.
A result the paper reports from its own data — it cites no other source for it, so there is none to check. The quote shows it is in the paper.
In the paper
“The majority of these cells/nuclei from this analysis are from the three studies that used high throughput collection and barcoding techniques (the Sathyamurthy, Rosenberg, and Zeisel datasets).”
§ A harmonized atlas of mouse spinal cord cell types and their spatial organization > Results > Merged analysis of spinal cord cells and nuclei
plain- Asserted: passes — The authors put it forward as true.
- Checkable: passes — It can be checked against evidence.
- Load-bearing: unclear — It is unclear whether the paper’s conclusions depend on it.
- Based: passes — The paper gives a reason why it holds.
In the paper
“First, they described many more sub-types of motoneurons, similar to the work of Alkaslasi et al., and we incorporated both of these studies and performed an expanded analysis of motoneuron sub-types (see below).”
§ A harmonized atlas of mouse spinal cord cell types and their spatial organization > Results > Overview of harmonized neuronal cell types
What the sources say
- Not checked yetcites Alkaslasi et al.
plaincorrelational- Asserted: passes — The authors put it forward as true.
- Checkable: passes — It can be checked against evidence.
- Load-bearing: unclear — It is unclear whether the paper’s conclusions depend on it.
- Based: passes — The paper gives a reason why it holds.
None of the sources cited for this claim have been checked yet.
In the paper
“We first created a merged dataset with over one hundred thousand cells and nuclei from the first six published studies of the postnatal mouse spinal cord1–6.”
§ A harmonized atlas of mouse spinal cord cell types and their spatial organization > Results > Merged analysis of spinal cord cells and nuclei
What the sources say
- Not checked yetcites [1] Sathyamurthy, A. et al. Massively parallel single nucleus transcriptional profiling defines spinal cord neurons and their activity during behavior. Cell Rep. 22, 2216–2225 (2018). source
- Not checked yetcites [2] Hayashi, M. et al. Graded arrays of spinal and supraspinal V2a interneuron subtypes underlie forelimb and hindlimb motor control. Neuron 97, 869–884.e5 (2018). source
- Not checked yetcites [3] Häring, M. et al. Neuronal atlas of the dorsal horn defines its architecture and links sensory input to transcriptional cell types. Nat. Neurosci. 21, 869–880 (2018). source
- Not checked yetcites [4] Rosenberg, A. B. et al. Single-cell profiling of the developing mouse brain and spinal cord with split-pool barcoding. Science 360, 176–182 (2018). source
- Not checked yetcites [5] Zeisel, A. et al. Molecular architecture of the mouse nervous system. Cell 174, 999–1014.e22 (2018). source
- Not checked yetcites [6] Baek, M., Menon, V., Jessell, T. M., Hantman, A. W. & Dasen, J. S. Molecular logic of spinocerebellar tract neuron diversity and connectivity. Cell Rep. 27, 2620–2635.e4 (2019). source
plain- Asserted: passes — The authors put it forward as true.
- Checkable: passes — It can be checked against evidence.
- Load-bearing: passes — The paper’s conclusions depend on it.
- Based: passes — The paper gives a reason why it holds.
A result the paper reports from its own data — it cites no other source for it, so there is none to check. The quote shows it is in the paper.
In the paper
“Remarkably, we found that genes related to plasticity were significantly enriched in the dorsal horn of the spinal cord.”
§ A harmonized atlas of mouse spinal cord cell types and their spatial organization > Results > General trends in molecular identity relationships amongst neuronal populations
plaincorrelational- Asserted: passes — The authors put it forward as true.
- Checkable: passes — It can be checked against evidence.
- Load-bearing: unclear — It is unclear whether the paper’s conclusions depend on it.
- Based: passes — The paper gives a reason why it holds.
In the paper
“In contrast, genes related to structural adhesion and stability were enriched in the ventral horn of the spinal cord, including (1) genes related to cell-cell adhesion such as Lrrtm3, Cntn5, Cdh18, and Sdk1; (2) genes related to perineuronal net components such as Bcan (Brevican) and Tnr (Tenascin R), and genes related to limiting the signal transduction pathways associated with LTP such as Ptpn5”
§ A harmonized atlas of mouse spinal cord cell types and their spatial organization > Results > General trends in molecular identity relationships amongst neuronal populations
What the sources say
- Not checked yetcites [33] Won, S. & Roche, K. W. Regulation of glutamate receptors by striatal-enriched tyrosine phosphatase 61 (STEP61). J. Physiol. 599, 443–451 (2021). source
plaincorrelational- Asserted: passes — The authors put it forward as true.
- Checkable: passes — It can be checked against evidence.
- Load-bearing: unclear — It is unclear whether the paper’s conclusions depend on it.
- Based: passes — The paper gives a reason why it holds.
The paper states this without a source or data behind it here, so there is nothing to check it against. The quote shows it is in the paper.
In the paper
“Third, Blum et al. cluster “0” was described as inhibitory neurons but likely included both inhibitory and excitatory ventral neurons.”
§ A harmonized atlas of mouse spinal cord cell types and their spatial organization > Results > Overview of harmonized neuronal cell types
hedged- Asserted: passes — The authors put it forward as true.
- Checkable: passes — It can be checked against evidence.
- Load-bearing: unclear — It is unclear whether the paper’s conclusions depend on it.
- Based: unclear — It is unclear why the paper says it holds.
A result the paper reports from its own data — it cites no other source for it, so there is none to check. The quote shows it is in the paper.
In the paper
“Nevertheless, we found that cells/nuclei from the original studies were distributed into the harmonized clusters in coherent patterns that facilitated the registration of the original clusters based on their distance in the neuron principal component space (Supplementary Fig. 6).”
§ A harmonized atlas of mouse spinal cord cell types and their spatial organization > Results > Overview of harmonized neuronal cell types
plaindirect- Asserted: passes — The authors put it forward as true.
- Checkable: passes — It can be checked against evidence.
- Load-bearing: passes — The paper’s conclusions depend on it.
- Based: passes — The paper gives a reason why it holds.
The paper states this without a source or data behind it here, so there is nothing to check it against. The quote shows it is in the paper.
In the paper
“Additionally, we develop an open-source cell type classifier, SeqSeek, to facilitate the standardization of cell type identification.”
§ A harmonized atlas of mouse spinal cord cell types and their spatial organization > Abstract
plaindirect- Asserted: passes — The authors put it forward as true.
- Checkable: passes — It can be checked against evidence.
- Load-bearing: unclear — It is unclear whether the paper’s conclusions depend on it.
- Based: passes — The paper gives a reason why it holds.
A result the paper reports from its own data — it cites no other source for it, so there is none to check. The quote shows it is in the paper.
In the paper
“In total, 69 neuronal clusters were identified (Fig. 2, Supplementary Figs. 4 and 5, Supplementary Table 2, and Supplementary Movie 1) and the neurotransmitter status and putative regional location (dorsal horn, mid-region, ventral horn) were determined by marker gene expression and comparison to the original six studies.”
§ A harmonized atlas of mouse spinal cord cell types and their spatial organization > Results > Overview of harmonized neuronal cell types
plain- Asserted: passes — The authors put it forward as true.
- Checkable: passes — It can be checked against evidence.
- Load-bearing: passes — The paper’s conclusions depend on it.
- Based: passes — The paper gives a reason why it holds.
A result the paper reports from its own data — it cites no other source for it, so there is none to check. The quote shows it is in the paper.
In the paper
“Each of these clusters, except Inhib-2, expressed Rorb.”
§ A harmonized atlas of mouse spinal cord cell types and their spatial organization > Results > Detailed cluster analysis and marker validation for harmonized neuronal cell types
plain- Asserted: passes — The authors put it forward as true.
- Checkable: passes — It can be checked against evidence.
- Load-bearing: unclear — It is unclear whether the paper’s conclusions depend on it.
- Based: passes — The paper gives a reason why it holds.
A result the paper reports from its own data — it cites no other source for it, so there is none to check. The quote shows it is in the paper.
In the paper
“All three clusters expressed enriched levels of Maf and Rora (which was broadly expressed in many other clusters at lower levels).”
§ A harmonized atlas of mouse spinal cord cell types and their spatial organization > Results > Detailed cluster analysis and marker validation for harmonized neuronal cell types
plaincorrelationaln = 3- Asserted: passes — The authors put it forward as true.
- Checkable: passes — It can be checked against evidence.
- Load-bearing: unclear — It is unclear whether the paper’s conclusions depend on it.
- Based: passes — The paper gives a reason why it holds.
A result the paper reports from its own data — it cites no other source for it, so there is none to check. The quote shows it is in the paper.
In the paper
“This family also expressed low levels of Slc17a8 (vGlut3).”
§ A harmonized atlas of mouse spinal cord cell types and their spatial organization > Results > Detailed cluster analysis and marker validation for harmonized neuronal cell types
plain- Asserted: passes — The authors put it forward as true.
- Checkable: passes — It can be checked against evidence.
- Load-bearing: unclear — It is unclear whether the paper’s conclusions depend on it.
- Based: passes — The paper gives a reason why it holds.
A result the paper reports from its own data — it cites no other source for it, so there is none to check. The quote shows it is in the paper.
In the paper
“It expressed Megf11 and Mdga1.”
§ A harmonized atlas of mouse spinal cord cell types and their spatial organization > Results > Detailed cluster analysis and marker validation for harmonized neuronal cell types
plaincorrelational- Asserted: passes — The authors put it forward as true.
- Checkable: passes — It can be checked against evidence.
- Load-bearing: unclear — It is unclear whether the paper’s conclusions depend on it.
- Based: passes — The paper gives a reason why it holds.
A result the paper reports from its own data — it cites no other source for it, so there is none to check. The quote shows it is in the paper.
In the paper
“Inhib-2 is grouped with this family based on its proximity in principal component space, as reflected in the UMAP and dendrogram analysis.”
§ A harmonized atlas of mouse spinal cord cell types and their spatial organization > Results > Detailed cluster analysis and marker validation for harmonized neuronal cell types
plaincorrelational- Asserted: passes — The authors put it forward as true.
- Checkable: passes — It can be checked against evidence.
- Load-bearing: unclear — It is unclear whether the paper’s conclusions depend on it.
- Based: passes — The paper gives a reason why it holds.
None of the sources cited for this claim have been checked yet.
In the paper
“For example, we found that digit-innervating motoneurons, expressing Cpne4 and Fign38, separated into two subtypes, one found in limb-innervating regions (both cervical and lumbar) and one that was specifically localized to the lumbar spinal cord39,40”
§ A harmonized atlas of mouse spinal cord cell types and their spatial organization > Results > Detailed cluster analysis and marker validation for harmonized neuronal cell types
What the sources say
- Not checked yetcites [39] Blum, J. A. et al. Single-cell transcriptomic analysis of the adult mouse spinal cord reveals molecular diversity of autonomic and skeletal motor neurons. Nat. Neurosci. 24, 572–583 (2021). source
- Not checked yetcites [40] Alkaslasi, M. R. et al. Single nucleus RNA-sequencing defines unexpected diversity of cholinergic neuron types in the adult mouse spinal cord. Nat. Commun. 12, 2471 (2021). source
plaincorrelational- Asserted: passes — The authors put it forward as true.
- Checkable: passes — It can be checked against evidence.
- Load-bearing: unclear — It is unclear whether the paper’s conclusions depend on it.
- Based: passes — The paper gives a reason why it holds.
A result the paper reports from its own data — it cites no other source for it, so there is none to check. The quote shows it is in the paper.
In the paper
“Cerebrospinal fluid contacting neurons (CSF-cN) were distinguished by Pkd2l1 and Pkd1l2.”
§ A harmonized atlas of mouse spinal cord cell types and their spatial organization > Results > Detailed cluster analysis and marker validation for harmonized neuronal cell types
plaincorrelational- Asserted: passes — The authors put it forward as true.
- Checkable: passes — It can be checked against evidence.
- Load-bearing: passes — The paper’s conclusions depend on it.
- Based: passes — The paper gives a reason why it holds.
A result the paper reports from its own data — it cites no other source for it, so there is none to check. The quote shows it is in the paper.
In the paper
“Each of these clusters expressed the glycinergic marker Slc76a5.”
§ A harmonized atlas of mouse spinal cord cell types and their spatial organization > Results > Detailed cluster analysis and marker validation for harmonized neuronal cell types
plain- Asserted: passes — The authors put it forward as true.
- Checkable: passes — It can be checked against evidence.
- Load-bearing: unclear — It is unclear whether the paper’s conclusions depend on it.
- Based: passes — The paper gives a reason why it holds.
A result the paper reports from its own data — it cites no other source for it, so there is none to check. The quote shows it is in the paper.
In the paper
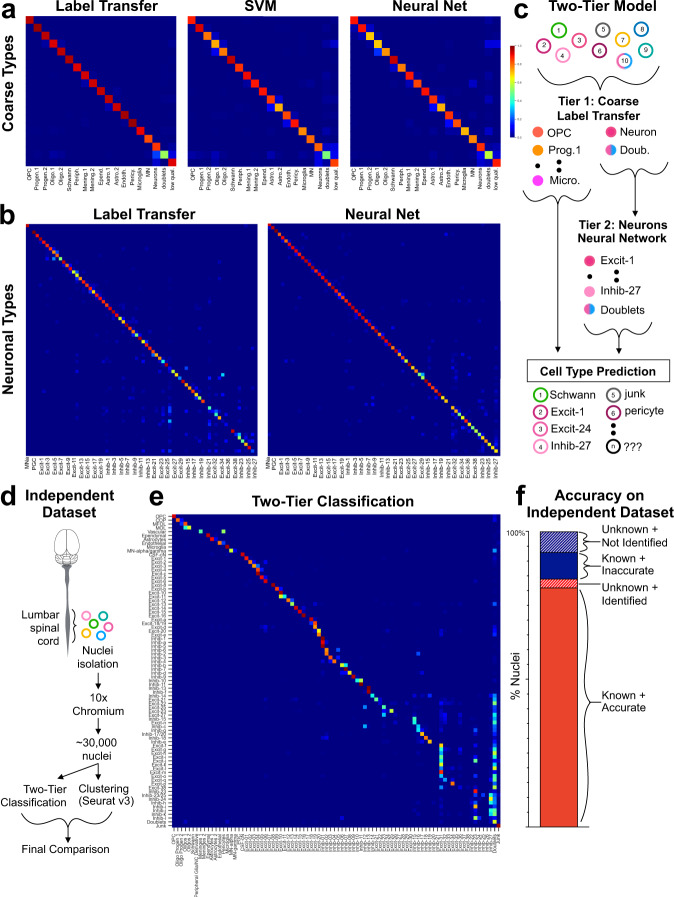
“Using the raw (normalized) data from each of the six original studies as an independent input to the two-tiered model, we found that it showed strong performance in identifying the neuronal sub-types in five of the six studies (Sathyamurthy, Hayashi, Haring, Rosenberg, and Zeisel) (Supplementary Fig. 11).”
§ A harmonized atlas of mouse spinal cord cell types and their spatial organization > Results > Using machine learning to classify spinal cord cell types
boosteddirect- Asserted: passes — The authors put it forward as true.
- Checkable: passes — It can be checked against evidence.
- Load-bearing: passes — The paper’s conclusions depend on it.
- Based: passes — The paper gives a reason why it holds.
- Rests on an assumption: There is no existing gold standard for spinal cord cell identities.
- Rests on an assumption: The harmonized analysis cell type labels are adequate as training labels for machine learning classifiers.
A result the paper reports from its own data — it cites no other source for it, so there is none to check. The quote shows it is in the paper.
In the paper
“The most striking finding from this analysis was the unexpectedly high degree of convergence of multiple lineages into postnatal cell types.”
§ A harmonized atlas of mouse spinal cord cell types and their spatial organization > Results > Developmental lineages of postnatal spinal neuron populations
plaincorrelational- Asserted: passes — The authors put it forward as true.
- Checkable: passes — It can be checked against evidence.
- Load-bearing: passes — The paper’s conclusions depend on it.
- Based: passes — The paper gives a reason why it holds.
- Rests on an assumption: Developmental lineage is a powerful and influential framework for categorizing spinal neurons.
A result the paper reports from its own data — it cites no other source for it, so there is none to check. The quote shows it is in the paper.
In the paper
“This cluster expressed multiple genes associated with Clarke’s column including Chmp2b, Syt4, Ebf3, Rgs4, and Enc16.”
§ A harmonized atlas of mouse spinal cord cell types and their spatial organization > Results > Detailed cluster analysis and marker validation for harmonized neuronal cell types
plaincorrelational- Asserted: passes — The authors put it forward as true.
- Checkable: passes — It can be checked against evidence.
- Load-bearing: unclear — It is unclear whether the paper’s conclusions depend on it.
- Based: passes — The paper gives a reason why it holds.
The paper states this without a source or data behind it here, so there is nothing to check it against. The quote shows it is in the paper.
In the paper
“The ventral, excitatory clusters were grouped as one family comprised of Excit-31, Excit-32, Excit-33, Excit-34, Excit-35, Excit-36, Excit-37, and Excit-38.”
§ A harmonized atlas of mouse spinal cord cell types and their spatial organization > Results > Detailed cluster analysis and marker validation for harmonized neuronal cell types
plain- Asserted: passes — The authors put it forward as true.
- Checkable: passes — It can be checked against evidence.
- Load-bearing: unclear — It is unclear whether the paper’s conclusions depend on it.
- Based: passes — The paper gives a reason why it holds.
A result the paper reports from its own data — it cites no other source for it, so there is none to check. The quote shows it is in the paper.
In the paper
“We identified several genes that contribute to overlapping gene expression patterns across clusters by being present in a spatial region of the cord and in diverse mid/ventral cell types.”
§ A harmonized atlas of mouse spinal cord cell types and their spatial organization > Results > Detailed cluster analysis and marker validation for harmonized neuronal cell types
plaincorrelational- Asserted: passes — The authors put it forward as true.
- Checkable: passes — It can be checked against evidence.
- Load-bearing: unclear — It is unclear whether the paper’s conclusions depend on it.
- Based: passes — The paper gives a reason why it holds.
A result the paper reports from its own data — it cites no other source for it, so there is none to check. The quote shows it is in the paper.
In the paper
“We found that 90% of nuclei from known clusters were accurately classified by the two-tiered model (Fig. 6f known + accurate).”
§ A harmonized atlas of mouse spinal cord cell types and their spatial organization > Results > Using machine learning to classify spinal cord cell types
plainn = 4- Asserted: passes — The authors put it forward as true.
- Checkable: passes — It can be checked against evidence.
- Load-bearing: passes — The paper’s conclusions depend on it.
- Based: passes — The paper gives a reason why it holds.
- Rests on an assumption: There is no existing gold standard for spinal cord cell identities.
- Rests on an assumption: The harmonized analysis cell type labels are adequate as training labels for machine learning classifiers.
A result the paper reports from its own data — it cites no other source for it, so there is none to check. The quote shows it is in the paper.
In the paper
“These clusters could also be distinguished by expression of Zfhx3 (Excit-21 and Excit-22) or Nfib (Excit-23, Excit-24, and Excit-25), which corresponded to lateral Zfhx3 and medial Nfib sub-types.”
§ A harmonized atlas of mouse spinal cord cell types and their spatial organization > Results > Detailed cluster analysis and marker validation for harmonized neuronal cell types
hedgedcorrelational- Asserted: passes — The authors put it forward as true.
- Checkable: passes — It can be checked against evidence.
- Load-bearing: unclear — It is unclear whether the paper’s conclusions depend on it.
- Based: passes — The paper gives a reason why it holds.
A result the paper reports from its own data — it cites no other source for it, so there is none to check. The quote shows it is in the paper.
In the paper
“90% of nuclei (out of 28,584 total) were in clusters that could be assigned a cell-type label based on marker gene expression (known clusters).”
§ A harmonized atlas of mouse spinal cord cell types and their spatial organization > Results > Using machine learning to classify spinal cord cell types
plainn = 4- Asserted: passes — The authors put it forward as true.
- Checkable: passes — It can be checked against evidence.
- Load-bearing: passes — The paper’s conclusions depend on it.
- Based: passes — The paper gives a reason why it holds.
- Rests on an assumption: There is no existing gold standard for spinal cord cell identities.
- Rests on an assumption: The harmonized analysis cell type labels are adequate as training labels for machine learning classifiers.
A result the paper reports from its own data — it cites no other source for it, so there is none to check. The quote shows it is in the paper.
In the paper
“By combining these two methods, we improved overall performance by maximizing performance at both steps.”
§ A harmonized atlas of mouse spinal cord cell types and their spatial organization > Results > Using machine learning to classify spinal cord cell types
plaindirect- Asserted: passes — The authors put it forward as true.
- Checkable: passes — It can be checked against evidence.
- Load-bearing: passes — The paper’s conclusions depend on it.
- Based: passes — The paper gives a reason why it holds.
- Rests on an assumption: There is no existing gold standard for spinal cord cell identities.
- Rests on an assumption: The harmonized analysis cell type labels are adequate as training labels for machine learning classifiers.
A result the paper reports from its own data — it cites no other source for it, so there is none to check. The quote shows it is in the paper.
In the paper
“The ventral, inhibitory clusters were also grouped as one family that was comprised of Inhib-22, Inhib-23, Inhib-24, Inhib-25, Inhib-26, and Inhib-27.”
§ A harmonized atlas of mouse spinal cord cell types and their spatial organization > Results > Detailed cluster analysis and marker validation for harmonized neuronal cell types
plain- Asserted: passes — The authors put it forward as true.
- Checkable: passes — It can be checked against evidence.
- Load-bearing: unclear — It is unclear whether the paper’s conclusions depend on it.
- Based: passes — The paper gives a reason why it holds.
A result the paper reports from its own data — it cites no other source for it, so there is none to check. The quote shows it is in the paper.
In the paper
“These cell types are located at greater distances from each other in principal component/UMAP space, have higher measures of robustness (such as co-clustering frequency and silhouette score), and can be reliably distinguished by machine learning algorithms or in tissue with combinatorial marker genes.”
§ A harmonized atlas of mouse spinal cord cell types and their spatial organization > Discussion
plaincorrelational- Asserted: passes — The authors put it forward as true.
- Checkable: passes — It can be checked against evidence.
- Load-bearing: passes — The paper’s conclusions depend on it.
- Based: passes — The paper gives a reason why it holds.
A result the paper reports from its own data — it cites no other source for it, so there is none to check. The quote shows it is in the paper.
In the paper
“However, we validated the vast majority of predicted expression patterns from the harmonized atlas and the resulting data provided the most extensive characterization of cell types, their prevalence, and their spatial distribution in the postnatal spinal cord.”
§ A harmonized atlas of mouse spinal cord cell types and their spatial organization > Discussion
plain- Asserted: passes — The authors put it forward as true.
- Checkable: passes — It can be checked against evidence.
- Load-bearing: passes — The paper’s conclusions depend on it.
- Based: passes — The paper gives a reason why it holds.
A result the paper reports from its own data — it cites no other source for it, so there is none to check. The quote shows it is in the paper.
In the paper
“Surprisingly, we found that 28% of unknown nuclei could be identified with the two-tier classification model (Fig. 6f unknown + identified).”
§ A harmonized atlas of mouse spinal cord cell types and their spatial organization > Results > Using machine learning to classify spinal cord cell types
plaindirect- Asserted: passes — The authors put it forward as true.
- Checkable: passes — It can be checked against evidence.
- Load-bearing: passes — The paper’s conclusions depend on it.
- Based: passes — The paper gives a reason why it holds.
- Rests on an assumption: There is no existing gold standard for spinal cord cell identities.
- Rests on an assumption: The harmonized analysis cell type labels are adequate as training labels for machine learning classifiers.
A result the paper reports from its own data — it cites no other source for it, so there is none to check. The quote shows it is in the paper.
In the paper
“We present a harmonized atlas of these cell types; a validated combinatorial panel of markers to facilitate their study either in vivo, in tissue sections, and in vitro cell culture; putative embryonic lineages for each cell type; computational resources for classifying spinal cord cells based on transcriptomics; and a web-based resource, SeqSeek, to allow the community to interact easily with and”
§ A harmonized atlas of mouse spinal cord cell types and their spatial organization > Discussion
plain- Asserted: passes — The authors put it forward as true.
- Checkable: passes — It can be checked against evidence.
- Load-bearing: passes — The paper’s conclusions depend on it.
- Based: passes — The paper gives a reason why it holds.
A result the paper reports from its own data — it cites no other source for it, so there is none to check. The quote shows it is in the paper.
In the paper
“Indeed, the robustness scores for mid/ventral cell types were very low until they are analyzed in a focused principal component space (Supplementary Fig. 2).”
§ A harmonized atlas of mouse spinal cord cell types and their spatial organization > Methods > Clustering
plaindirect- Asserted: passes — The authors put it forward as true.
- Checkable: passes — It can be checked against evidence.
- Load-bearing: passes — The paper’s conclusions depend on it.
- Based: passes — The paper gives a reason why it holds.
The paper states this without a source or data behind it here, so there is nothing to check it against. The quote shows it is in the paper.
In the paper
“We present a harmonized atlas of these cell types; a validated combinatorial panel of markers to facilitate their study either in vivo, in tissue sections, and in vitro cell culture; putative embryonic lineages for each cell type; computational resources for classifying spinal cord cells based on transcriptomics; and a web-based resource, SeqSeek, to allow the community to interact easily with and”
§ A harmonized atlas of mouse spinal cord cell types and their spatial organization > Discussion
plain- Asserted: passes — The authors put it forward as true.
- Checkable: passes — It can be checked against evidence.
- Load-bearing: passes — The paper’s conclusions depend on it.
- Based: passes — The paper gives a reason why it holds.
In the paper
“Here, we co-integrated an embryonic (e9.5–e13.5) spinal cord sequencing dataset7 with our harmonized analysis and identified putative lineages of many postnatal cell types.”
§ A harmonized atlas of mouse spinal cord cell types and their spatial organization > Discussion
What the sources say
- Not checked yetcites [7] Delile, J. et al. Single cell transcriptomics reveals spatial and temporal dynamics of gene expression in the developing mouse spinal cord. Development 146, dev173807 (2019). source
hedgedcorrelational- Asserted: passes — The authors put it forward as true.
- Checkable: passes — It can be checked against evidence.
- Load-bearing: passes — The paper’s conclusions depend on it.
- Based: passes — The paper gives a reason why it holds.
A result the paper reports from its own data — it cites no other source for it, so there is none to check. The quote shows it is in the paper.
In the paper
“One of the most striking findings was the difference in cell type organization between the dorsal and mid/ventral regions of the spinal cord, both in cluster relationships and in general molecular trends.”
§ A harmonized atlas of mouse spinal cord cell types and their spatial organization > Discussion
plaincorrelational- Asserted: passes — The authors put it forward as true.
- Checkable: passes — It can be checked against evidence.
- Load-bearing: passes — The paper’s conclusions depend on it.
- Based: passes — The paper gives a reason why it holds.
A result the paper reports from its own data — it cites no other source for it, so there is none to check. The quote shows it is in the paper.
In the paper
“These cell types are located at greater distances from each other in principal component/UMAP space, have higher measures of robustness (such as co-clustering frequency and silhouette score), and can be reliably distinguished by machine learning algorithms or in tissue with combinatorial marker genes.”
§ A harmonized atlas of mouse spinal cord cell types and their spatial organization > Discussion
plaincorrelational- Asserted: passes — The authors put it forward as true.
- Checkable: passes — It can be checked against evidence.
- Load-bearing: passes — The paper’s conclusions depend on it.
- Based: passes — The paper gives a reason why it holds.
The paper states this without a source or data behind it here, so there is nothing to check it against. The quote shows it is in the paper.
In the paper
“We present a harmonized atlas of these cell types; a validated combinatorial panel of markers to facilitate their study either in vivo, in tissue sections, and in vitro cell culture; putative embryonic lineages for each cell type; computational resources for classifying spinal cord cells based on transcriptomics; and a web-based resource, SeqSeek, to allow the community to interact easily with and”
§ A harmonized atlas of mouse spinal cord cell types and their spatial organization > Discussion
plain- Asserted: passes — The authors put it forward as true.
- Checkable: passes — It can be checked against evidence.
- Load-bearing: passes — The paper’s conclusions depend on it.
- Based: passes — The paper gives a reason why it holds.
A result the paper reports from its own data — it cites no other source for it, so there is none to check. The quote shows it is in the paper.
In the paper
“On the analytical side, this work is among the first practical applications of automated classification for large and complex single-cell datasets from neural tissue.”
§ A harmonized atlas of mouse spinal cord cell types and their spatial organization > Discussion
plain- Asserted: passes — The authors put it forward as true.
- Checkable: passes — It can be checked against evidence.
- Load-bearing: unclear — It is unclear whether the paper’s conclusions depend on it.
- Based: passes — The paper gives a reason why it holds.
The paper states this without a source or data behind it here, so there is nothing to check it against. The quote shows it is in the paper.
In the paper
“This work brings together the first single-cell studies of the post-natal mouse spinal cord to create a standard reference set of spinal cord cell types.”
§ A harmonized atlas of mouse spinal cord cell types and their spatial organization > Discussion
plaindirect- Asserted: passes — The authors put it forward as true.
- Checkable: passes — It can be checked against evidence.
- Load-bearing: passes — The paper’s conclusions depend on it.
- Based: passes — The paper gives a reason why it holds.
A result the paper reports from its own data — it cites no other source for it, so there is none to check. The quote shows it is in the paper.
In the paper
“Here, we found that a two-tiered model that incorporates label transfer and a neural network displayed excellent performance in the computationally challenging task of classifying cells and nuclei into the 69 fine resolution neuronal cell types of the spinal cord.”
§ A harmonized atlas of mouse spinal cord cell types and their spatial organization > Discussion
plaindirect- Asserted: passes — The authors put it forward as true.
- Checkable: passes — It can be checked against evidence.
- Load-bearing: passes — The paper’s conclusions depend on it.
- Based: passes — The paper gives a reason why it holds.
A result the paper reports from its own data — it cites no other source for it, so there is none to check. The quote shows it is in the paper.
In the paper
“Related to these overall differences in cell type relationships, the dorsal and ventral regions of the spinal cord displayed broad molecular differences from each other that drove the primary bifurcation amongst spinal interneurons/projection neurons (non-motoneurons or CSF-cN neurons) in our cluster dendogram analysis, even before excitatory and inhibitory neuron types separated from each other.”
§ A harmonized atlas of mouse spinal cord cell types and their spatial organization > Discussion
plaindirect- Asserted: passes — The authors put it forward as true.
- Checkable: passes — It can be checked against evidence.
- Load-bearing: passes — The paper’s conclusions depend on it.
- Based: passes — The paper gives a reason why it holds.
A result the paper reports from its own data — it cites no other source for it, so there is none to check. The quote shows it is in the paper.
In the paper
“As an example, we identified major differences between dorsal and ventral neuron types in their cluster relationships and in plasticity gene signatures, highlighting the primary role of spatial location in the organization of the mammalian spinal cord.”
§ A harmonized atlas of mouse spinal cord cell types and their spatial organization > Discussion
plaincorrelational- Asserted: passes — The authors put it forward as true.
- Checkable: passes — It can be checked against evidence.
- Load-bearing: unclear — It is unclear whether the paper’s conclusions depend on it.
- Based: passes — The paper gives a reason why it holds.
The paper states this without a source or data behind it here, so there is nothing to check it against. The quote shows it is in the paper.
In the paper
“We present a harmonized atlas of these cell types; a validated combinatorial panel of markers to facilitate their study either in vivo, in tissue sections, and in vitro cell culture; putative embryonic lineages for each cell type; computational resources for classifying spinal cord cells based on transcriptomics; and a web-based resource, SeqSeek, to allow the community to interact easily with and”
§ A harmonized atlas of mouse spinal cord cell types and their spatial organization > Discussion
hedged- Asserted: passes — The authors put it forward as true.
- Checkable: passes — It can be checked against evidence.
- Load-bearing: passes — The paper’s conclusions depend on it.
- Based: passes — The paper gives a reason why it holds.
A result the paper reports from its own data — it cites no other source for it, so there is none to check. The quote shows it is in the paper.
In the paper
“The third phase of targeted sub-clustering was done because mid/ventral and motoneuron sub-types did not separate well in preliminary neuron analysis.”
§ A harmonized atlas of mouse spinal cord cell types and their spatial organization > Methods > Clustering
plaindirect- Asserted: passes — The authors put it forward as true.
- Checkable: passes — It can be checked against evidence.
- Load-bearing: passes — The paper’s conclusions depend on it.
- Based: passes — The paper gives a reason why it holds.
A result the paper reports from its own data — it cites no other source for it, so there is none to check. The quote shows it is in the paper.
In the paper
“We present a harmonized atlas of these cell types; a validated combinatorial panel of markers to facilitate their study either in vivo, in tissue sections, and in vitro cell culture; putative embryonic lineages for each cell type; computational resources for classifying spinal cord cells based on transcriptomics; and a web-based resource, SeqSeek, to allow the community to interact easily with and”
§ A harmonized atlas of mouse spinal cord cell types and their spatial organization > Discussion
plain- Asserted: passes — The authors put it forward as true.
- Checkable: passes — It can be checked against evidence.
- Load-bearing: passes — The paper’s conclusions depend on it.
- Based: passes — The paper gives a reason why it holds.
A result the paper reports from its own data — it cites no other source for it, so there is none to check. The quote shows it is in the paper.
In the paper
“In a few instances, this data differed from the harmonized sequencing data (for example in Excit-3 and Excit-4) which may reflect differences in developmental patterns.”
§ A harmonized atlas of mouse spinal cord cell types and their spatial organization > Discussion
hedged- Asserted: passes — The authors put it forward as true.
- Checkable: passes — It can be checked against evidence.
- Load-bearing: unclear — It is unclear whether the paper’s conclusions depend on it.
- Based: passes — The paper gives a reason why it holds.
In the paper
“Within the dorsal horn, this included both broadly expressed genes such as Camk2a (CAMK2α) as well as cell type-specific genes such as Prkcg (PKCγ)31.”
§ A harmonized atlas of mouse spinal cord cell types and their spatial organization > Discussion
What the sources say
- Not checked yetcites [31] Kandel, E. R., Dudai, Y. & Mayford, M. R. The molecular and systems biology of memory. Cell 157, 163–186 (2014). source
plaincorrelational- Asserted: passes — The authors put it forward as true.
- Checkable: passes — It can be checked against evidence.
- Load-bearing: unclear — It is unclear whether the paper’s conclusions depend on it.
- Based: passes — The paper gives a reason why it holds.
The paper states this without a source or data behind it here, so there is nothing to check it against. The quote shows it is in the paper.
In the paper
“In that context, the work here provides a comprehensive atlas of spinal cord transcriptomic cell types that can be used as a framework to compare with other cellular features.”
§ A harmonized atlas of mouse spinal cord cell types and their spatial organization > Discussion
plain- Asserted: passes — The authors put it forward as true.
- Checkable: passes — It can be checked against evidence.
- Load-bearing: passes — The paper’s conclusions depend on it.
- Based: passes — The paper gives a reason why it holds.
A result the paper reports from its own data — it cites no other source for it, so there is none to check. The quote shows it is in the paper.
In the paper
“For example, dI3.3 and dI3.4 were found together with dI5.3 and dI5.4 in a long trajectory toward the majority of dorsal excitatory neurons.”
§ A harmonized atlas of mouse spinal cord cell types and their spatial organization > Discussion
plaincorrelational- Asserted: passes — The authors put it forward as true.
- Checkable: passes — It can be checked against evidence.
- Load-bearing: unclear — It is unclear whether the paper’s conclusions depend on it.
- Based: passes — The paper gives a reason why it holds.
The paper states this without a source or data behind it here, so there is nothing to check it against. The quote shows it is in the paper.
In the paper
“Here, we leveraged and expanded upon the previously published single-cell sequencing studies of the postnatal mouse spinal cord to define 84 types of spinal cord cells.”
§ A harmonized atlas of mouse spinal cord cell types and their spatial organization > Discussion
plaindirect- Asserted: passes — The authors put it forward as true.
- Checkable: passes — It can be checked against evidence.
- Load-bearing: passes — The paper’s conclusions depend on it.
- Based: passes — The paper gives a reason why it holds.
A result the paper reports from its own data — it cites no other source for it, so there is none to check. The quote shows it is in the paper.
In the paper
“These cell types are located at greater distances from each other in principal component/UMAP space, have higher measures of robustness (such as co-clustering frequency and silhouette score), and can be reliably distinguished by machine learning algorithms or in tissue with combinatorial marker genes.”
§ A harmonized atlas of mouse spinal cord cell types and their spatial organization > Discussion
plaincorrelational- Asserted: passes — The authors put it forward as true.
- Checkable: passes — It can be checked against evidence.
- Load-bearing: passes — The paper’s conclusions depend on it.
- Based: passes — The paper gives a reason why it holds.
A result the paper reports from its own data — it cites no other source for it, so there is none to check. The quote shows it is in the paper.
In the paper
“we sorted all significant genes in each cluster by the average log fold change, selected genes with a value > 2 (nuclei > cells), and identified a list of 10 protein-coding genes and 3 lncRNAs (Supplementary Table 6).”
§ A harmonized atlas of mouse spinal cord cell types and their spatial organization > Methods > Computational classification
plaincorrelational- Asserted: passes — The authors put it forward as true.
- Checkable: passes — It can be checked against evidence.
- Load-bearing: unclear — It is unclear whether the paper’s conclusions depend on it.
- Based: passes — The paper gives a reason why it holds.
A result the paper reports from its own data — it cites no other source for it, so there is none to check. The quote shows it is in the paper.
In the paper
“Interestingly, the baseline model had the largest validation accuracy.”
§ A harmonized atlas of mouse spinal cord cell types and their spatial organization > Methods > Computational classification
plain- Asserted: passes — The authors put it forward as true.
- Checkable: passes — It can be checked against evidence.
- Load-bearing: unclear — It is unclear whether the paper’s conclusions depend on it.
- Based: passes — The paper gives a reason why it holds.
A result the paper reports from its own data — it cites no other source for it, so there is none to check. The quote shows it is in the paper.
In the paper
“We found that 484 unique genes were differentially expressed and of these, 482 (99.6%) were enriched in cells compared to nuclei.”
§ A harmonized atlas of mouse spinal cord cell types and their spatial organization > Methods > Computational classification
plaincorrelational- Asserted: passes — The authors put it forward as true.
- Checkable: passes — It can be checked against evidence.
- Load-bearing: unclear — It is unclear whether the paper’s conclusions depend on it.
- Based: passes — The paper gives a reason why it holds.
A result the paper reports from its own data — it cites no other source for it, so there is none to check. The quote shows it is in the paper.
In the paper
“and that general metabolism genes were enriched in studies that used cells”
§ A harmonized atlas of mouse spinal cord cell types and their spatial organization > Methods > Computational classification
plaincorrelational- Asserted: passes — The authors put it forward as true.
- Checkable: passes — It can be checked against evidence.
- Load-bearing: unclear — It is unclear whether the paper’s conclusions depend on it.
- Based: passes — The paper gives a reason why it holds.
A result the paper reports from its own data — it cites no other source for it, so there is none to check. The quote shows it is in the paper.
In the paper
“only studies that used nuclei contributed to MN-alpha, MN-gamma, or PGC cells as well as Excit-7 and most ventral neuronal clusters (Supplementary Table 6).”
§ A harmonized atlas of mouse spinal cord cell types and their spatial organization > Methods > Computational classification
plaincorrelational- Asserted: passes — The authors put it forward as true.
- Checkable: passes — It can be checked against evidence.
- Load-bearing: passes — The paper’s conclusions depend on it.
- Based: passes — The paper gives a reason why it holds.
A result the paper reports from its own data — it cites no other source for it, so there is none to check. The quote shows it is in the paper.
In the paper
“the number of genes per cell/nucleus, the expression of immediate early genes, and the expression of stress-related genes were all different based on technique (Supplementary Fig. 3).”
§ A harmonized atlas of mouse spinal cord cell types and their spatial organization > Methods > Computational classification
plaincorrelational- Asserted: passes — The authors put it forward as true.
- Checkable: passes — It can be checked against evidence.
- Load-bearing: passes — The paper’s conclusions depend on it.
- Based: passes — The paper gives a reason why it holds.
A result the paper reports from its own data — it cites no other source for it, so there is none to check. The quote shows it is in the paper.
In the paper
“the number of genes per cell/nucleus, the expression of immediate early genes, and the expression of stress-related genes were all different based on technique (Supplementary Fig. 3).”
§ A harmonized atlas of mouse spinal cord cell types and their spatial organization > Methods > Computational classification
plaincorrelational- Asserted: passes — The authors put it forward as true.
- Checkable: passes — It can be checked against evidence.
- Load-bearing: passes — The paper’s conclusions depend on it.
- Based: passes — The paper gives a reason why it holds.
A result the paper reports from its own data — it cites no other source for it, so there is none to check. The quote shows it is in the paper.
In the paper
“The decision to include doublets for further classification was founded on the observation that a non-trivial number of neurons were misclassified as doublets at the coarse cell-type level.”
§ A harmonized atlas of mouse spinal cord cell types and their spatial organization > Methods > Computational classification
plaindirect- Asserted: passes — The authors put it forward as true.
- Checkable: passes — It can be checked against evidence.
- Load-bearing: passes — The paper’s conclusions depend on it.
- Based: passes — The paper gives a reason why it holds.
A result the paper reports from its own data — it cites no other source for it, so there is none to check. The quote shows it is in the paper.
In the paper
“Overall, nuclei from the formalin and rotarod conditions accounted for 11.0% of the total neuronal cells/nuclei”
§ A harmonized atlas of mouse spinal cord cell types and their spatial organization > Methods > Computational classification
plain- Asserted: passes — The authors put it forward as true.
- Checkable: passes — It can be checked against evidence.
- Load-bearing: passes — The paper’s conclusions depend on it.
- Based: passes — The paper gives a reason why it holds.
A result the paper reports from its own data — it cites no other source for it, so there is none to check. The quote shows it is in the paper.
In the paper
“The only gene that was significantly different (ANOVA, corrected p-value < 0.05) was the immediate early gene Fos.”
§ A harmonized atlas of mouse spinal cord cell types and their spatial organization > Methods > Computational classification
plain- Asserted: passes — The authors put it forward as true.
- Checkable: passes — It can be checked against evidence.
- Load-bearing: passes — The paper’s conclusions depend on it.
- Based: passes — The paper gives a reason why it holds.
A result the paper reports from its own data — it cites no other source for it, so there is none to check. The quote shows it is in the paper.
In the paper
“and also represented 11.1% (±0.7 standard error) of each cluster.”
§ A harmonized atlas of mouse spinal cord cell types and their spatial organization > Methods > Computational classification
plain- Asserted: passes — The authors put it forward as true.
- Checkable: passes — It can be checked against evidence.
- Load-bearing: passes — The paper’s conclusions depend on it.
- Based: passes — The paper gives a reason why it holds.
A result the paper reports from its own data — it cites no other source for it, so there is none to check. The quote shows it is in the paper.
In the paper
“We found that 484 unique genes were differentially expressed and of these, 482 (99.6%) were enriched in cells compared to nuclei.”
§ A harmonized atlas of mouse spinal cord cell types and their spatial organization > Methods > Computational classification
plaincorrelational- Asserted: passes — The authors put it forward as true.
- Checkable: passes — It can be checked against evidence.
- Load-bearing: unclear — It is unclear whether the paper’s conclusions depend on it.
- Based: passes — The paper gives a reason why it holds.
A result the paper reports from its own data — it cites no other source for it, so there is none to check. The quote shows it is in the paper.
In the paper
“the number of genes per cell/nucleus, the expression of immediate early genes, and the expression of stress-related genes were all different based on technique (Supplementary Fig. 3).”
§ A harmonized atlas of mouse spinal cord cell types and their spatial organization > Methods > Computational classification
plaincorrelational- Asserted: passes — The authors put it forward as true.
- Checkable: passes — It can be checked against evidence.
- Load-bearing: passes — The paper’s conclusions depend on it.
- Based: passes — The paper gives a reason why it holds.
A result the paper reports from its own data — it cites no other source for it, so there is none to check. The quote shows it is in the paper.
In the paper
“Only one differentially expressed gene was an immediate early gene (Homer1a was found in a higher fraction of cells/nuclei from the experimental condition in cluster Inhib-8 but also had a lower expression level per cell/nucleus).”
§ A harmonized atlas of mouse spinal cord cell types and their spatial organization > Methods > Computational classification
plain- Asserted: passes — The authors put it forward as true.
- Checkable: passes — It can be checked against evidence.
- Load-bearing: passes — The paper’s conclusions depend on it.
- Based: passes — The paper gives a reason why it holds.
A result the paper reports from its own data — it cites no other source for it, so there is none to check. The quote shows it is in the paper.
In the paper
“The only clusters that had >16% contribution from an experimental condition were in the mid/ventral regions of the spinal cord”
§ A harmonized atlas of mouse spinal cord cell types and their spatial organization > Methods > Computational classification
plaincorrelational- Asserted: passes — The authors put it forward as true.
- Checkable: passes — It can be checked against evidence.
- Load-bearing: passes — The paper’s conclusions depend on it.
- Based: passes — The paper gives a reason why it holds.
A result the paper reports from its own data — it cites no other source for it, so there is none to check. The quote shows it is in the paper.
In the paper
“the major differences that we observed were that ventral cell types were mainly detected in studies that used nuclei compared with cells”
§ A harmonized atlas of mouse spinal cord cell types and their spatial organization > Methods > Computational classification
plaincorrelational- Asserted: passes — The authors put it forward as true.
- Checkable: passes — It can be checked against evidence.
- Load-bearing: passes — The paper’s conclusions depend on it.
- Based: passes — The paper gives a reason why it holds.
A result the paper reports from its own data — it cites no other source for it, so there is none to check. The quote shows it is in the paper.
In the paper
“but the overall validation and test accuracies are still lower”
§ A harmonized atlas of mouse spinal cord cell types and their spatial organization > Methods > Computational classification
plain- Asserted: passes — The authors put it forward as true.
- Checkable: passes — It can be checked against evidence.
- Load-bearing: unclear — It is unclear whether the paper’s conclusions depend on it.
- Based: passes — The paper gives a reason why it holds.
A conclusion the paper draws from its own results — it cites no other source for it, so there is none to check. The quote shows it is in the paper.
In the paper
“We clustered the cells and nuclei of this meta-dataset to reveal 15 non-neural and 69 neural cell types, thereby providing a cell type resolution and characterization that surpasses all prior studies, both in the depth of its detail and the breadth of general trends.”
§ A harmonized atlas of mouse spinal cord cell types and their spatial organization > Introduction
plain- Asserted: passes — The authors put it forward as true.
- Checkable: passes — It can be checked against evidence.
- Load-bearing: passes — The paper’s conclusions depend on it.
- Based: passes — The paper gives a reason why it holds.
A conclusion the paper draws from its own results — it cites no other source for it, so there is none to check. The quote shows it is in the paper.
In the paper
“This suggests that the distinction between dorsal and ventral neurons that we described above is not limited to the sequencing data but exists in the adult spinal cord tissue.”
§ A harmonized atlas of mouse spinal cord cell types and their spatial organization > Results > Detailed cluster analysis and marker validation for harmonized neuronal cell types
hedged- Asserted: passes — The authors put it forward as true.
- Checkable: passes — It can be checked against evidence.
- Load-bearing: passes — The paper’s conclusions depend on it.
- Based: passes — The paper gives a reason why it holds.
The paper states this without a source or data behind it here, so there is nothing to check it against. The quote shows it is in the paper.
In the paper
“A major obstacle is the lack of accepted ground truth of cell types in this tissue that could form the basis of a reference atlas.”
§ A harmonized atlas of mouse spinal cord cell types and their spatial organization > Introduction
plaindirect- Asserted: passes — The authors put it forward as true.
- Checkable: passes — It can be checked against evidence.
- Load-bearing: passes — The paper’s conclusions depend on it.
- Based: passes — The paper gives a reason why it holds.
None of the sources cited for this claim have been checked yet.
In the paper
“Unfortunately, this challenge is compounded by the difficulty in comparing data between studies even when the same tissue types and techniques are used3,5.”
§ A harmonized atlas of mouse spinal cord cell types and their spatial organization > Introduction
What the sources say
- Not checked yetcites [3] Häring, M. et al. Neuronal atlas of the dorsal horn defines its architecture and links sensory input to transcriptional cell types. Nat. Neurosci. 21, 869–880 (2018). source
- Not checked yetcites [5] Zeisel, A. et al. Molecular architecture of the mouse nervous system. Cell 174, 999–1014.e22 (2018). source
plain- Asserted: passes — The authors put it forward as true.
- Checkable: passes — It can be checked against evidence.
- Load-bearing: passes — The paper’s conclusions depend on it.
- Based: passes — The paper gives a reason why it holds.
A conclusion the paper draws from its own results — it cites no other source for it, so there is none to check. The quote shows it is in the paper.
In the paper
“We therefore concluded that the previously published atlases cannot simply be registered to each other to achieve a valid reference atlas.”
§ A harmonized atlas of mouse spinal cord cell types and their spatial organization > Results > Merged analysis of spinal cord cells and nuclei
plain- Asserted: passes — The authors put it forward as true.
- Checkable: passes — It can be checked against evidence.
- Load-bearing: passes — The paper’s conclusions depend on it.
- Based: passes — The paper gives a reason why it holds.
A conclusion the paper draws from its own results — it cites no other source for it, so there is none to check. The quote shows it is in the paper.
In the paper
“Thus, integration has the potential to facilitate merged analysis and comparison amongst independent datasets by reducing (but not eliminating) the effects of technical differences between the studies.”
§ A harmonized atlas of mouse spinal cord cell types and their spatial organization > Results > Merged analysis of spinal cord cells and nuclei
hedgedconditional- Asserted: passes — The authors put it forward as true.
- Checkable: passes — It can be checked against evidence.
- Load-bearing: passes — The paper’s conclusions depend on it.
- Based: passes — The paper gives a reason why it holds.
In the paper
“These studies provide a powerful and multi-faceted perspective on spinal cord cell types, yet despite this significant effort and a rich literature of spinal cord cell type characterization (see reviews12–19), there is still no consensus cell type atlas of the spinal cord20.”
§ A harmonized atlas of mouse spinal cord cell types and their spatial organization > Introduction
What the sources say
- Not checked yetcites [20] Dobrott, C. I., Sathyamurthy, A. & Levine, A. J. Decoding cell type diversity within the spinal cord. Current 8, 1–6 (2019). source
plain- Asserted: passes — The authors put it forward as true.
- Checkable: passes — It can be checked against evidence.
- Load-bearing: passes — The paper’s conclusions depend on it.
- Based: passes — The paper gives a reason why it holds.
A conclusion the paper draws from its own results — it cites no other source for it, so there is none to check. The quote shows it is in the paper.
In the paper
“The similarity of Excit-7 with Excit-3, Excit-4, Excit-5, and Excit-6 suggests a shared lineage relationship between these families.”
§ A harmonized atlas of mouse spinal cord cell types and their spatial organization > Results > Detailed cluster analysis and marker validation for harmonized neuronal cell types
hedgedcorrelational- Asserted: passes — The authors put it forward as true.
- Checkable: passes — It can be checked against evidence.
- Load-bearing: unclear — It is unclear whether the paper’s conclusions depend on it.
- Based: unclear — It is unclear why the paper says it holds.
None of the sources cited for this claim have been checked yet.
In the paper
“This family had markers of interneurons suggested to be involved in mechanical itch46,47.”
§ A harmonized atlas of mouse spinal cord cell types and their spatial organization > Results > Detailed cluster analysis and marker validation for harmonized neuronal cell types
What the sources say
- Not checked yetcites [46] Gatto, G. et al. A functional topographic map for spinal sensorimotor reflexes. Neuron 109, 91–104.e5 (2021). source
- Not checked yetcites [47] Pan, H. et al. Identification of a spinal circuit for mechanical and persistent spontaneous itch. Neuron 103, 1135–1149.e6 (2019). source
hedgedcorrelational- Asserted: passes — The authors put it forward as true.
- Checkable: passes — It can be checked against evidence.
- Load-bearing: unclear — It is unclear whether the paper’s conclusions depend on it.
- Based: passes — The paper gives a reason why it holds.
In the paper
“Inhib-23 and Inhib-25 expressed Foxp2 and Esrrb, suggesting they correspond to the Foxp2 clade of V1 lineage neurons described by Bikoff and colleagues88.”
§ A harmonized atlas of mouse spinal cord cell types and their spatial organization > Results > Detailed cluster analysis and marker validation for harmonized neuronal cell types
What the sources say
- Not checked yetcites [88] Bikoff, J. B. et al. Spinal inhibitory interneuron diversity delineates variant motor microcircuits. Cell 165, 207–219 (2016). source
hedgedcorrelational- Asserted: passes — The authors put it forward as true.
- Checkable: passes — It can be checked against evidence.
- Load-bearing: unclear — It is unclear whether the paper’s conclusions depend on it.
- Based: passes — The paper gives a reason why it holds.
In the paper
“Inhib-24 expressed both Pou6f2 and Nr5a2, suggesting that this cluster corresponded to the Pou6f2/Nr5a2 clade of V1 lineage neurons88.”
§ A harmonized atlas of mouse spinal cord cell types and their spatial organization > Results > Detailed cluster analysis and marker validation for harmonized neuronal cell types
What the sources say
- Not checked yetcites [88] Bikoff, J. B. et al. Spinal inhibitory interneuron diversity delineates variant motor microcircuits. Cell 165, 207–219 (2016). source
hedgedcorrelational- Asserted: passes — The authors put it forward as true.
- Checkable: passes — It can be checked against evidence.
- Load-bearing: unclear — It is unclear whether the paper’s conclusions depend on it.
- Based: passes — The paper gives a reason why it holds.
None of the sources cited for this claim have been checked yet.
In the paper
“A subset of cells from the dorsal dI4.6/dI6 lineages contributed to most ventral inhibitory populations, which was unexpected though there have been reports of scattered dI4 Ptf1a-derived cells in the embryonic and perinatal ventral horn103,104, and the very small dI6 population is known to be ventrally located105–107.”
§ A harmonized atlas of mouse spinal cord cell types and their spatial organization > Results > Developmental lineages of postnatal spinal neuron populations
What the sources say
- Not checked yetcites [103] Glasgow, S. M., Henke, R. M., Macdonald, R. J., Wright, C. V. E. & Johnson, J. E. Ptf1a determines GABAergic over glutamatergic neuronal cell fate in the spinal cord dorsal horn. Development 132, 5461–5469 (2005). source
- Not checked yetcites [104] Escalante, A. & Klein, R. Spinal inhibitory Ptf1a-derived neurons prevent self-generated itch. Cell Rep. 33, 108422 (2020). source
- Not checked yetcites [105] Gross, M. K., Dottori, M. & Goulding, M. Lbx1 specifies somatosensory association interneurons in the dorsal spinal cord. Neuron 34, 535–549 (2002). source
- Not checked yetcites [106] Müller, T. et al. The homeodomain factor lbx1 distinguishes two major programs of neuronal differentiation in the dorsal spinal cord. Neuron 34, 551–562 (2002). source
- Not checked yetcites [107] Vallstedt, A. & Kullander, K. Dorsally derived spinal interneurons in locomotor circuits. Ann. N. Y. Acad. Sci. 1279, 32–42 (2013). source
plaindirect- Asserted: passes — The authors put it forward as true.
- Checkable: passes — It can be checked against evidence.
- Load-bearing: passes — The paper’s conclusions depend on it.
- Based: passes — The paper gives a reason why it holds.
- Rests on an assumption: Developmental lineage is a powerful and influential framework for categorizing spinal neurons.
A conclusion the paper draws from its own results — it cites no other source for it, so there is none to check. The quote shows it is in the paper.
In the paper
“Multiple dorsal excitatory cell types seemed to be derived from a mixed set of dI5 lineage cells (as expected) and an Isl1-negative, Tlx3-positive dI3.3/dI3.4 embryonic population (which was unexpected).”
§ A harmonized atlas of mouse spinal cord cell types and their spatial organization > Results > Developmental lineages of postnatal spinal neuron populations
hedgedconditional- Asserted: passes — The authors put it forward as true.
- Checkable: passes — It can be checked against evidence.
- Load-bearing: passes — The paper’s conclusions depend on it.
- Based: passes — The paper gives a reason why it holds.
- Rests on an assumption: Developmental lineage is a powerful and influential framework for categorizing spinal neurons.
What the paper did — it cites no source for this, so there is none to check. The quote shows it is in the paper.
In the paper
“The cell types of the mid-region of the spinal cord, the deep dorsal horn, were comprised of the following families and the clusters were generally less robust than dorsal clusters (Fig. 2b and Supplementary Fig. 5).”
§ A harmonized atlas of mouse spinal cord cell types and their spatial organization > Results > Detailed cluster analysis and marker validation for harmonized neuronal cell types
plain- Asserted: passes — The authors put it forward as true.
- Checkable: passes — It can be checked against evidence.
- Load-bearing: unclear — It is unclear whether the paper’s conclusions depend on it.
- Based: passes — The paper gives a reason why it holds.
A conclusion the paper draws from its own results — it cites no other source for it, so there is none to check. The quote shows it is in the paper.
In the paper
“In comparison, the model’s accuracy of 85% reveals the outstanding performance of this approach.”
§ A harmonized atlas of mouse spinal cord cell types and their spatial organization > Results > Using machine learning to classify spinal cord cell types
boosted- Asserted: passes — The authors put it forward as true.
- Checkable: passes — It can be checked against evidence.
- Load-bearing: passes — The paper’s conclusions depend on it.
- Based: passes — The paper gives a reason why it holds.
- Rests on an assumption: There is no existing gold standard for spinal cord cell identities.
- Rests on an assumption: The harmonized analysis cell type labels are adequate as training labels for machine learning classifiers.
- Rests on an assumption: Perfect performance would require perfect and invariable biological data: discrete cell types that express completely distinct patterns of gene expression and experimental data without natural heterogeneity, doublets, low-quality cells, or other sources of indeterminate data.
A conclusion the paper draws from its own results — it cites no other source for it, so there is none to check. The quote shows it is in the paper.
In the paper
“A second notable caveat that is common to most single-cell sequencing experiments is that this analysis is population-based.”
§ A harmonized atlas of mouse spinal cord cell types and their spatial organization > Discussion
plain- Asserted: passes — The authors put it forward as true.
- Checkable: passes — It can be checked against evidence.
- Load-bearing: unclear — It is unclear whether the paper’s conclusions depend on it.
- Based: passes — The paper gives a reason why it holds.
- Rests on an assumption: The rate of false-negative data in each cell and the requirement for statistical power necessitates analyzing many cells of each type and considering population-level shared patterns.
A conclusion the paper draws from its own results — it cites no other source for it, so there is none to check. The quote shows it is in the paper.
In the paper
“As an example, we identified major differences between dorsal and ventral neuron types in their cluster relationships and in plasticity gene signatures, highlighting the primary role of spatial location in the organization of the mammalian spinal cord.”
§ A harmonized atlas of mouse spinal cord cell types and their spatial organization > Discussion
boosteddirect- Asserted: passes — The authors put it forward as true.
- Checkable: passes — It can be checked against evidence.
- Load-bearing: passes — The paper’s conclusions depend on it.
- Based: passes — The paper gives a reason why it holds.
What the paper did — it cites no source for this, so there is none to check. The quote shows it is in the paper.
In the paper
“First, highly reliable clusters were identified based on four independent integration methodologies – Seurat V3, Harmony, Conos, and LIGER – suggesting that these clusters represent the underlying biological reality of cell types.”
§ A harmonized atlas of mouse spinal cord cell types and their spatial organization > Discussion
hedgedcorrelational- Asserted: passes — The authors put it forward as true.
- Checkable: passes — It can be checked against evidence.
- Load-bearing: passes — The paper’s conclusions depend on it.
- Based: passes — The paper gives a reason why it holds.
A conclusion the paper draws from its own results — it cites no other source for it, so there is none to check. The quote shows it is in the paper.
In the paper
“First, highly reliable clusters were identified based on four independent integration methodologies – Seurat V3, Harmony, Conos, and LIGER – suggesting that these clusters represent the underlying biological reality of cell types.”
§ A harmonized atlas of mouse spinal cord cell types and their spatial organization > Discussion
hedged- Asserted: passes — The authors put it forward as true.
- Checkable: passes — It can be checked against evidence.
- Load-bearing: passes — The paper’s conclusions depend on it.
- Based: passes — The paper gives a reason why it holds.
What the paper did — it cites no source for this, so there is none to check. The quote shows it is in the paper.
In the paper
“Third, and most importantly, this atlas does not rest only on select studies or on computational approaches that would be subject to the biases of particular tools and parameter choices.”
§ A harmonized atlas of mouse spinal cord cell types and their spatial organization > Discussion
plain- Asserted: passes — The authors put it forward as true.
- Checkable: passes — It can be checked against evidence.
- Load-bearing: passes — The paper’s conclusions depend on it.
- Based: passes — The paper gives a reason why it holds.
A conclusion the paper draws from its own results — it cites no other source for it, so there is none to check. The quote shows it is in the paper.
In the paper
“The first trend is that cell types within the family structure that we described generally shared common embryonic lineages, suggesting a developmental basis for the group resemblances.”
§ A harmonized atlas of mouse spinal cord cell types and their spatial organization > Discussion
hedgedcorrelational- Asserted: passes — The authors put it forward as true.
- Checkable: passes — It can be checked against evidence.
- Load-bearing: passes — The paper’s conclusions depend on it.
- Based: passes — The paper gives a reason why it holds.
In the paper
“This analysis also found that performance depends partly on the number of cell types and the complexity (the relatedness between clusters) of a dataset, similar to what we observed.”
§ A harmonized atlas of mouse spinal cord cell types and their spatial organization > Discussion
What the sources say
- Not checked yetcites [125] Abdelaal, T. et al. A comparison of automatic cell identification methods for single-cell RNA sequencing data. Genome Biol. 20, 194–19 (2019). source
plainconditional- Asserted: passes — The authors put it forward as true.
- Checkable: passes — It can be checked against evidence.
- Load-bearing: unclear — It is unclear whether the paper’s conclusions depend on it.
- Based: passes — The paper gives a reason why it holds.
A conclusion the paper draws from its own results — it cites no other source for it, so there is none to check. The quote shows it is in the paper.
In the paper
“These results establish a two-tiered model based on label transfer and a neural network as an effective approach for the computational classification of single-cell sequencing data, even in the context of the finely separated populations of spinal cord neurons.”
§ A harmonized atlas of mouse spinal cord cell types and their spatial organization > Results > Using machine learning to classify spinal cord cell types
boosteddirect- Asserted: passes — The authors put it forward as true.
- Checkable: passes — It can be checked against evidence.
- Load-bearing: passes — The paper’s conclusions depend on it.
- Based: passes — The paper gives a reason why it holds.
- Rests on an assumption: There is no existing gold standard for spinal cord cell identities.
- Rests on an assumption: The harmonized analysis cell type labels are adequate as training labels for machine learning classifiers.
A conclusion the paper draws from its own results — it cites no other source for it, so there is none to check. The quote shows it is in the paper.
In the paper
“Thus, the two-tiered model surpassed the ability of experienced users to identify spinal cord cell types.”
§ A harmonized atlas of mouse spinal cord cell types and their spatial organization > Results > Using machine learning to classify spinal cord cell types
plaindirect- Asserted: passes — The authors put it forward as true.
- Checkable: passes — It can be checked against evidence.
- Load-bearing: passes — The paper’s conclusions depend on it.
- Based: passes — The paper gives a reason why it holds.
- Rests on an assumption: There is no existing gold standard for spinal cord cell identities.
- Rests on an assumption: The harmonized analysis cell type labels are adequate as training labels for machine learning classifiers.
A conclusion the paper draws from its own results — it cites no other source for it, so there is none to check. The quote shows it is in the paper.
In the paper
“By providing a broad perspective on developmental and mature cell type similarities, this work suggests that there are multiple schemes that guide the differentiation of spinal cord neural precursors into the highly refined and diverse array of neurons that mediate adult behavior.”
§ A harmonized atlas of mouse spinal cord cell types and their spatial organization > Discussion
hedged- Asserted: passes — The authors put it forward as true.
- Checkable: passes — It can be checked against evidence.
- Load-bearing: passes — The paper’s conclusions depend on it.
- Based: passes — The paper gives a reason why it holds.
A conclusion the paper draws from its own results — it cites no other source for it, so there is none to check. The quote shows it is in the paper.
In the paper
“Relatedly, the in situ hybridization experiments here are also limited in scope, being specific to the adult lumbar spinal cord.”
§ A harmonized atlas of mouse spinal cord cell types and their spatial organization > Discussion
plain- Asserted: passes — The authors put it forward as true.
- Checkable: passes — It can be checked against evidence.
- Load-bearing: unclear — It is unclear whether the paper’s conclusions depend on it.
- Based: passes — The paper gives a reason why it holds.
A conclusion the paper draws from its own results — it cites no other source for it, so there is none to check. The quote shows it is in the paper.
In the paper
“In addition, it can standardize spinal cord cell type classification so that a unified and harmonized set of cell types can be identified and studied consistently between datasets, biological conditions, and laboratories throughout the field.”
§ A harmonized atlas of mouse spinal cord cell types and their spatial organization > Results > Using machine learning to classify spinal cord cell types
plaindirect- Asserted: passes — The authors put it forward as true.
- Checkable: passes — It can be checked against evidence.
- Load-bearing: passes — The paper’s conclusions depend on it.
- Based: passes — The paper gives a reason why it holds.
- Rests on an assumption: There is no existing gold standard for spinal cord cell identities.
- Rests on an assumption: The harmonized analysis cell type labels are adequate as training labels for machine learning classifiers.
None of the sources cited for this claim have been checked yet.
In the paper
“Second, these clusters correspond well with prior gene expression analysis of the postnatal spinal cord including many classic and well-established marker gene studies as well as three independent single nucleus sequencing datasets that were not included in the harmonized clustering: an independent dataset that we clustered separately and used to test the SeqSeek Classify algorithm, and two recent”
§ A harmonized atlas of mouse spinal cord cell types and their spatial organization > Discussion
What the sources say
- Not checked yetcites [8] Mona, B. et al. Positive autofeedback regulation of Ptf1a transcription generates the levels of PTF1A required to generate itch circuit neurons. Genes Dev. 34, 621–636 (2020). source
- Not checked yetcites [9] Skinnider, M. A. et al. Cell type prioritization in single-cell data. Nat. Biotechnol. 6, 377–5 (2020).
boostedcorrelational- Asserted: passes — The authors put it forward as true.
- Checkable: passes — It can be checked against evidence.
- Load-bearing: passes — The paper’s conclusions depend on it.
- Based: passes — The paper gives a reason why it holds.
What the paper did — it cites no source for this, so there is none to check. The quote shows it is in the paper.
In the paper
“We performed high content in situ hybridization to test the validity of predicted expression profiles in the full transverse view of adult lumbar spinal cord tissue.”
§ A harmonized atlas of mouse spinal cord cell types and their spatial organization > Discussion
plain- Asserted: passes — The authors put it forward as true.
- Checkable: passes — It can be checked against evidence.
- Load-bearing: passes — The paper’s conclusions depend on it.
- Based: passes — The paper gives a reason why it holds.
A conclusion the paper draws from its own results — it cites no other source for it, so there is none to check. The quote shows it is in the paper.
In the paper
“It is likely that by emphasizing common patterns, this analysis underrepresents true biological variability, including noisy gene expression and continua of cell types.”
§ A harmonized atlas of mouse spinal cord cell types and their spatial organization > Discussion
hedgedconditional- Asserted: passes — The authors put it forward as true.
- Checkable: passes — It can be checked against evidence.
- Load-bearing: unclear — It is unclear whether the paper’s conclusions depend on it.
- Based: passes — The paper gives a reason why it holds.
- Rests on an assumption: The rate of false-negative data in each cell and the requirement for statistical power necessitates analyzing many cells of each type and considering population-level shared patterns.
A conclusion the paper draws from its own results — it cites no other source for it, so there is none to check. The quote shows it is in the paper.
In the paper
“The second trend is that many cell types were derived from multiple lineage domains.”
§ A harmonized atlas of mouse spinal cord cell types and their spatial organization > Discussion
plaindirect- Asserted: passes — The authors put it forward as true.
- Checkable: passes — It can be checked against evidence.
- Load-bearing: passes — The paper’s conclusions depend on it.
- Based: passes — The paper gives a reason why it holds.
A conclusion the paper draws from its own results — it cites no other source for it, so there is none to check. The quote shows it is in the paper.
In the paper
“Therefore, we concluded that the gene expression profiles are not biased by the inclusion of these nuclei.”
§ A harmonized atlas of mouse spinal cord cell types and their spatial organization > Methods > Computational classification
boosted- Asserted: passes — The authors put it forward as true.
- Checkable: passes — It can be checked against evidence.
- Load-bearing: passes — The paper’s conclusions depend on it.
- Based: passes — The paper gives a reason why it holds.
A conclusion the paper draws from its own results — it cites no other source for it, so there is none to check. The quote shows it is in the paper.
In the paper
“Since the training accuracy is 100% as compared to 85% in the validation set, the model is clearly overfitting the training data.”
§ A harmonized atlas of mouse spinal cord cell types and their spatial organization > Methods > Computational classification
boosteddirect- Asserted: passes — The authors put it forward as true.
- Checkable: passes — It can be checked against evidence.
- Load-bearing: unclear — It is unclear whether the paper’s conclusions depend on it.
- Based: passes — The paper gives a reason why it holds.
A conclusion the paper draws from its own results — it cites no other source for it, so there is none to check. The quote shows it is in the paper.
In the paper
“In fact, the broadly elevated levels of immediate early genes in the Haring and Zeisel datasets (Supplementary Figs. 1 and 3) likely washes out any small effect of the behavioral conditions from the Sathyamurthy dataset.”
§ A harmonized atlas of mouse spinal cord cell types and their spatial organization > Methods > Computational classification
hedgedconditional- Asserted: passes — The authors put it forward as true.
- Checkable: passes — It can be checked against evidence.
- Load-bearing: passes — The paper’s conclusions depend on it.
- Based: passes — The paper gives a reason why it holds.
A conclusion the paper draws from its own results — it cites no other source for it, so there is none to check. The quote shows it is in the paper.
In the paper
“a very short time window that makes major changes in gene expression or cell composition exceedingly unlikely.”
§ A harmonized atlas of mouse spinal cord cell types and their spatial organization > Methods > Computational classification
hedged- Asserted: passes — The authors put it forward as true.
- Checkable: passes — It can be checked against evidence.
- Load-bearing: passes — The paper’s conclusions depend on it.
- Based: passes — The paper gives a reason why it holds.
A conclusion the paper draws from its own results — it cites no other source for it, so there is none to check. The quote shows it is in the paper.
In the paper
“Therefore, we concluded that the cluster contribution is not biased by experimental conditions.”
§ A harmonized atlas of mouse spinal cord cell types and their spatial organization > Methods > Computational classification
boosted- Asserted: passes — The authors put it forward as true.
- Checkable: passes — It can be checked against evidence.
- Load-bearing: passes — The paper’s conclusions depend on it.
- Based: passes — The paper gives a reason why it holds.
- It may state two separate claims as one. 111
- The quote only partly states this claim. 2
- Probably not a substantial claim. 28
The cited sources support only part of this claim — read each source’s verdict below.
In the paper
“With this approach, the cells and nuclei from all six studies were spatially interposed in a UMAP visualization of principal component space (Fig. 1c) and separated into groupings that each expressed a panel of well-established cell type markers such as Snap25 (neurons), Mbp (oligodendrocytes), Aqp4 (astrocytes), and Ctss (microglia) (Fig. 1d, e).”
§ A harmonized atlas of mouse spinal cord cell types and their spatial organization > Results > Merged analysis of spinal cord cells and nuclei
What the sources say
- Partly supportedcites [22] Nguyen, Q. H., Pervolarakis, N., Nee, K. & Kessenbrock, K. Experimental considerations for single-cell RNA sequencing approaches. Front Cell Dev. Biol. 6, 108 (2018). sourceExperimental — accuracy not yet measured
The Study Design and Data Analysis section describes using Seurat’s canonical correlation analysis to integrate datasets and identify cell-type clusters. Its Figure 2, however, shows breast epithelial cells from four individuals in a tSNE plot—not cells and nuclei from six studies in a UMAP—and does not report the named brain-cell markers. No page number is available in our copy. (LLM, conf=0.86)
- Partly supportedcites [23] Stuart, T. et al. Comprehensive integration of single-cell data. Cell 177, 1888–1902.e21 (2019). sourceExperimental — accuracy not yet measured
The STAR Methods section (page not provided) describes Seurat integration followed by PCA, UMAP visualization, and cell-type annotation, supporting the methodological part of the claim. It does not report the cited document’s result involving cells and nuclei from six studies or the specified Snap25, Mbp, Aqp4, and Ctss marker-defined groupings. (LLM, conf=0.86)
boosteddirect- Asserted: passes — The authors put it forward as true.
- Checkable: passes — It can be checked against evidence.
- Load-bearing: passes — The paper’s conclusions depend on it.
- Based: passes — The paper gives a reason why it holds.
It may state two separate claims as one.
- Partly supported
The cited sources support only part of this claim — read each source’s verdict below.
In the paper
“The Prkcg dorsal, excitatory family was comprised of Excit-3 and Excit-4 and likely corresponded to neurons involved in light static touch and allodynic pain in pathological situations46,48–56.”
§ A harmonized atlas of mouse spinal cord cell types and their spatial organization > Results > Detailed cluster analysis and marker validation for harmonized neuronal cell types
What the sources say
- Partly supportedcites [46] Gatto, G. et al. A functional topographic map for spinal sensorimotor reflexes. Neuron 109, 91–104.e5 (2021). sourceExperimental — accuracy not yet measured
The Results section ('Spatial distribution and molecular identity define distinct spinal microcircuits'; page unavailable) identifies PKCγ-positive dorsal excitatory interneurons, and another Results section links an overlapping CCK-positive population to static paw-withdrawal reflexes. Our copy does not identify a Prkcg family comprising Excit-3 and Excit-4 or establish that those clusters mediate allodynic pain in pathological conditions. (LLM, conf=0.83)
- Partly supportedcites [48] Abraira, V. E. et al. The cellular and synaptic architecture of the mechanosensory dorsal horn. Cell 168, 295–310.e19 (2017). sourceExperimental — accuracy not yet measured
The Introduction identifies excitatory interneuron subtypes involved in innocuous touch processing, and the Methods describe analysis of PKCγ-positive neurons for excitatory markers (pages unavailable). Our copy does not identify a Prkcg family comprising Excit-3 and Excit-4 or link those neurons specifically to light static touch and allodynic pain in pathological conditions. (LLM, conf=0.78)
- Could not verifycites [49] Acton, D. et al. Spinal neuropeptide Y1 receptor-expressing neurons form an essential excitatory pathway for mechanical itch. Cell Rep. 28, 625–639.e6 (2019). sourceExperimental — accuracy not yet measured
The Results section on Y1Cre neurons reports a role in light punctate touch, but does not identify a Prkcg family comprising Excit-3 and Excit-4 or link that family to pathological allodynic pain. Searches for Prkcg, PKCγ, Excit-3/Excit-4, and allodynia found only a PKCγ antibody in Methods and an allodynia-related reference, not the attributed finding. No page numbers are available in our copy. (LLM, conf=0.75)
- Partly supportedcites [50] Bourane, S. et al. Identification of a spinal circuit for light touch and fine motor control. Cell 160, 503–515 (2015). sourceExperimental — accuracy not yet measured
The Results section (page not available) identifies a dorsal PKCγ-positive subset of excitatory RORα interneurons and reports that ablating RORα interneurons impairs static light touch. It does not identify that subset as Excit-3 or Excit-4, test its specific role in static touch, or link it to allodynic pain in pathological conditions. (LLM, conf=0.85)
- Partly supportedcites [51] Cheng, L. et al. Identification of spinal circuits involved in touch-evoked dynamic mechanical pain. Nat. Neurosci. 20, 804–814 (2017). sourceExperimental — accuracy not yet measured
The Results section ('Spinal neurons marked by VT3Cre expression'; page unavailable) places PKCγ-positive interneurons in an area receiving low-threshold mechanoreceptor input and says they have been implicated in neuropathic pain. The Introduction says they might mediate dynamic and punctate mechanical hypersensitivity, but distinguishes punctate from static allodynia. The source does not identify Excit-3 or Excit-4 or establish a role for these neurons in light static touch. (LLM, conf=0.84)
- Partly supportedcites [52] Duan, B. et al. Identification of spinal circuits transmitting and gating mechanical pain. Cell 159, 1417–1432 (2014). sourceExperimental — accuracy not yet measured
The Discussion (page unavailable) describes PKCγ-positive excitatory neurons in a spinal circuit linked to mechanical pain, and the Results report that static allodynia was reduced after ablation of SOM-lineage neurons. The paper does not identify a Prkcg family comprising Excit-3 and Excit-4 or establish that those groups mediate light static touch. (LLM, conf=0.82)
- Partly supportedcites [53] Gutierrez-Mecinas, M., Furuta, T., Watanabe, M. & Todd, A. J. A quantitative study of neurochemically defined excitatory interneuron populations in laminae I-III of the mouse spinal cord. Mol. Pain. 12, 174480691662906 (2016). sourceExperimental — accuracy not yet measured
The Background proposes that PKCγ cells transmit low-threshold tactile input and contribute to tactile allodynia in chronic pain states; the Discussion likewise describes a suggested route from tactile inputs to nociceptive neurons. The paper does not identify a “Prkcg dorsal” family comprising Excit-3 and Excit-4, or specifically describe its role in light static touch. Page numbers are unavailable in our copy. (LLM, conf=0.86)
- Could not verifycites [54] Liu, Y. et al. Touch and tactile neuropathic pain sensitivity are set by corticospinal projections. Nature 561, 547–550 (2018). sourceExperimental — accuracy not yet measured
Extended Data Figure 2 uses PKCγ only as a marker of a dorsal-horn region; it does not identify a Prkcg excitatory family or Excit-3 and Excit-4. The paper examines static mechanical sensitivity and tactile allodynia (Methods, Behavioral experiments), but its interneuron findings concern CCK+ cells (Extended Data Figure 8). Searches for Prkcg, Excit-3, Excit-4, and PKCγ interneuron function found no passage linking the claimed family to those sensations. (LLM, conf=0.75)
- Not checked yetcites [55] Malmberg, A. B., Chen, C., Tonegawa, S. & Basbaum, A. I. Preserved acute pain and reduced neuropathic pain in mice lacking PKCgamma. Science 278, 279–283 (1997). source
- Partly supportedcites [56] Peirs, C. et al. Dorsal horn circuits for persistent mechanical pain. Neuron 87, 797–812 (2015). sourceExperimental — accuracy not yet measured
The Discussion section on spinal cord circuits for mechanical hypersensitivity describes PKCγ neurons as part of a proposed pathway that can transform touch into pain after injury, and reports their activation in a neuropathic-pain model. It does not establish a role specifically in static touch. Excit-3 and Excit-4 are the citing authors’ classification, not populations identified in this source. (LLM, conf=0.82)
hedgedcorrelational- Asserted: passes — The authors put it forward as true.
- Checkable: passes — It can be checked against evidence.
- Load-bearing: unclear — It is unclear whether the paper’s conclusions depend on it.
- Based: passes — The paper gives a reason why it holds.
It may state two separate claims as one.
- Partly supported
The cited sources support only part of this claim — read each source’s verdict below.
In the paper
“The Maf dorsal, the excitatory family was comprised of Excit-5, Excit-6, and Excit-7 which expressed markers of neurons involved in light touch46,48,50,56,57.”
§ A harmonized atlas of mouse spinal cord cell types and their spatial organization > Results > Detailed cluster analysis and marker validation for harmonized neuronal cell types
What the sources say
- Partly supportedcites [46] Gatto, G. et al. A functional topographic map for spinal sensorimotor reflexes. Neuron 109, 91–104.e5 (2021). sourceExperimental — accuracy not yet measured
The Results section, “Spatial distribution and molecular identity define distinct spinal microcircuits” (page unavailable), reports cMaf-positive dorsal horn excitatory interneurons and places the overlapping CCK-positive population in the low-threshold mechanoreceptor recipient zone, supporting a connection to light touch. It does not identify a “Maf dorsal” family comprising Excit-5, Excit-6, and Excit-7 or establish marker expression for those three groups. (LLM, conf=0.82)
- Could not verifycites [48] Abraira, V. E. et al. The cellular and synaptic architecture of the mechanosensory dorsal horn. Cell 168, 295–310.e19 (2017). sourceExperimental — accuracy not yet measured
The Results section, “A Dorsal Horn Molecular-Genetic Toolbox” (page unavailable), describes excitatory interneuron subtypes in a touch-processing region but does not identify a Maf dorsal family or Excit-5, Excit-6, and Excit-7. Searches for those labels and their proposed light-touch markers found no passage addressing the claimed grouping or marker expression. (LLM, conf=0.74)
- Partly supportedcites [50] Bourane, S. et al. Identification of a spinal circuit for light touch and fine motor control. Cell 160, 503–515 (2015). sourceExperimental — accuracy not yet measured
The Results section (‘RORα identifies a distinct population of excitatory neurons’; page unavailable) identifies MafA+/c-Maf+/RORα+ excitatory interneurons, and the paper links RORα interneurons to light touch. It does not identify a ‘Maf dorsal’ family or classify it as Excit-5, Excit-6, and Excit-7, so that part of the claim is unsupported by this source. (LLM, conf=0.87)
- Could not verifycites [56] Peirs, C. et al. Dorsal horn circuits for persistent mechanical pain. Neuron 87, 797–812 (2015). sourceExperimental — accuracy not yet measured
The Results sections on VGLUT3-positive interneurons and mechanical hypersensitivity describe dorsal horn excitatory neurons and responses to low-threshold mechanical stimulation (page unavailable). Searches for “Maf dorsal,” “Excit-5,” “Excit-6,” and “Excit-7” found no passage identifying those clusters or their light-touch markers, so our copy does not establish the attributed classification. (LLM, conf=0.74)
- Partly supportedcites [57] Peirs, C. et al. Mechanical allodynia circuitry in the dorsal horn is defined by the nature of the injury. Neuron 109, 73–90.e7 (2021). sourceExperimental — accuracy not yet measured
The Results section on deep dorsal horn neurons (page unavailable) reports Maf expression in a subset of CCK-lineage neurons involved in dynamic mechanical allodynia. It does not identify a “Maf dorsal” excitatory family, assign Excit-5, Excit-6, and Excit-7 to it, or establish that those clusters express markers of light-touch neurons. (LLM, conf=0.76)
plaincorrelational- Asserted: passes — The authors put it forward as true.
- Checkable: passes — It can be checked against evidence.
- Load-bearing: unclear — It is unclear whether the paper’s conclusions depend on it.
- Based: passes — The paper gives a reason why it holds.
It may state two separate claims as one.
- Partly supported
The cited sources support only part of this claim — read each source’s verdict below.
In the paper
“The mid inhibitory cell types were grouped as one family comprised of Inhib-15, Inhib-16, Inhib-17, Inhib-18, Inhib-19, Inhib-20, and Inhib-21, which expressed the glycinergic marker Slc6a5 (with the exception of Inhib-21) and also the gaba-ergic marker Gad2, implicating these neurons in sensorimotor processing84–86.”
§ A harmonized atlas of mouse spinal cord cell types and their spatial organization > Results > Detailed cluster analysis and marker validation for harmonized neuronal cell types
What the sources say
- Partly supportedcites [84] Hilde, K. L. et al. Satb2 is required for the development of a spinal exteroceptive microcircuit that modulates limb position. Neuron 91, 763–776 (2016). sourceExperimental — accuracy not yet measured
Split into 2 atoms — 1 confirmed, 1 partially supported, 0 disputed, 0 misattributed, 0 unverifiable. Expand the claim to see per-atom verdicts.
- Partly supportedcites [85] Koch, S. C. et al. RORβ spinal interneurons gate sensory transmission during locomotion to secure a fluid walking gait. Neuron https://doi.org/10.1016/j.neuron.2017.11.011 (2017). sourceExperimental — accuracy not yet measured
Split into 2 atoms — 1 confirmed, 1 partially supported, 0 disputed, 0 misattributed, 0 unverifiable. Expand the claim to see per-atom verdicts.
- Partly supportedcites [86] Fink, A. J. P. et al. Presynaptic inhibition of spinal sensory feedback ensures smooth movement. Nature 509, 43–48 (2014). sourceExperimental — accuracy not yet measured
Split into 2 atoms — 1 confirmed, 1 partially supported, 0 disputed, 0 misattributed, 0 unverifiable. Expand the claim to see per-atom verdicts.
plaincorrelational- Asserted: passes — The authors put it forward as true.
- Checkable: passes — It can be checked against evidence.
- Load-bearing: unclear — It is unclear whether the paper’s conclusions depend on it.
- Based: passes — The paper gives a reason why it holds.
It may state two separate claims as one.
- Partly supported
A result the paper reports from its own data — it cites no other source for it, so there is none to check. The quote shows it is in the paper.
In the paper
“We validate a combinatorial marker code for each neuronal cell type and map their spatial distributions in the adult spinal cord.”
§ A harmonized atlas of mouse spinal cord cell types and their spatial organization > Abstract
plain- Asserted: passes — The authors put it forward as true.
- Checkable: passes — It can be checked against evidence.
- Load-bearing: passes — The paper’s conclusions depend on it.
- Based: passes — The paper gives a reason why it holds.
It may state two separate claims as one.
A result the paper reports from its own data — it cites no other source for it, so there is none to check. The quote shows it is in the paper.
In the paper
“Here, we generate an atlas of spinal cell types based on single-cell transcriptomic data, unifying the available datasets into a common reference framework.”
§ A harmonized atlas of mouse spinal cord cell types and their spatial organization > Abstract
plain- Asserted: passes — The authors put it forward as true.
- Checkable: passes — It can be checked against evidence.
- Load-bearing: passes — The paper’s conclusions depend on it.
- Based: passes — The paper gives a reason why it holds.
It may state two separate claims as one.
The paper states this without a source or data behind it here, so there is nothing to check it against. The quote shows it is in the paper.
In the paper
“The three studies that FACS sorted neurons from the spinal cord (Hayashi, Haring, and Baek datasets) predominantly gave rise to cells in the neuronal sub-clusters, as well as non-neural cells that most likely represented doublets.”
§ A harmonized atlas of mouse spinal cord cell types and their spatial organization > Results > A harmonized atlas of major cell types
hedgedcorrelational- Asserted: passes — The authors put it forward as true.
- Checkable: passes — It can be checked against evidence.
- Load-bearing: unclear — It is unclear whether the paper’s conclusions depend on it.
- Based: passes — The paper gives a reason why it holds.
It may state two separate claims as one.
A result the paper reports from its own data — it cites no other source for it, so there is none to check. The quote shows it is in the paper.
In the paper
“We now present SeqSeek, a web-based resource for querying this data by gene or cell type and for accessing automated classification algorithm of any spinal cord cell or nucleus from raw sequencing data.”
§ A harmonized atlas of mouse spinal cord cell types and their spatial organization > Introduction
plain- Asserted: passes — The authors put it forward as true.
- Checkable: passes — It can be checked against evidence.
- Load-bearing: passes — The paper’s conclusions depend on it.
- Based: passes — The paper gives a reason why it holds.
It may state two separate claims as one.
A result the paper reports from its own data — it cites no other source for it, so there is none to check. The quote shows it is in the paper.
In the paper
“Co-integration with embryonic cell types allowed us to infer putative lineage relationships for each postnatal cell type and uncovered complex convergent contributions from multiple lineages to many cell types.”
§ A harmonized atlas of mouse spinal cord cell types and their spatial organization > Introduction
hedgeddirect- Asserted: passes — The authors put it forward as true.
- Checkable: passes — It can be checked against evidence.
- Load-bearing: passes — The paper’s conclusions depend on it.
- Based: passes — The paper gives a reason why it holds.
It may state two separate claims as one.
None of the sources cited for this claim have been checked yet.
In the paper
“The motoneuron (MN) family includes alpha motoneurons (MNa) which had relatively higher levels of Poln and Spp134, gamma motoneurons (MNg) which had relatively higher levels of Esrrg and Htr1f35, and the related preganglionic cells (PGC) which expressed Gfra3, Nos1, and Fbn236,37.”
§ A harmonized atlas of mouse spinal cord cell types and their spatial organization > Results > Detailed cluster analysis and marker validation for harmonized neuronal cell types
What the sources say
- Not checked yetcites [35] Friese, A. et al. Gamma and alpha motor neurons distinguished by expression of transcription factor Err3. Proc. Natl Acad. Sci. USA106, 13588–13593 (2009). source
- Not checked yetcites [36] Schaller, S. et al. Novel combinatorial screening identifies neurotrophic factors for selective classes of motor neurons. Proc. Natl Acad. Sci. USA 114, E2486–E2493 (2017). source
- Not checked yetcites [37] Springell, D. A., Powers-Martin, K., Phillips, J. K., Pilowsky, P. M. & Goodchild, A. K. Phosphorylated extracellular signal-regulated kinase 1/2 immunoreactivity identifies a novel subpopulation of sympathetic preganglionic neurons. Neuroscience 133, 583–590 (2005). source
plaincorrelational- Asserted: passes — The authors put it forward as true.
- Checkable: passes — It can be checked against evidence.
- Load-bearing: passes — The paper’s conclusions depend on it.
- Based: passes — The paper gives a reason why it holds.
It may state two separate claims as one.
A result the paper reports from its own data — it cites no other source for it, so there is none to check. The quote shows it is in the paper.
In the paper
“Dorsal clusters showed very high robustness with this measure, whereas mid and ventral clusters showed low to moderate robustness.”
§ A harmonized atlas of mouse spinal cord cell types and their spatial organization > Results > Overview of harmonized neuronal cell types
plaincorrelational- Asserted: passes — The authors put it forward as true.
- Checkable: passes — It can be checked against evidence.
- Load-bearing: unclear — It is unclear whether the paper’s conclusions depend on it.
- Based: passes — The paper gives a reason why it holds.
It may state two separate claims as one.
A result the paper reports from its own data — it cites no other source for it, so there is none to check. The quote shows it is in the paper.
In the paper
“Moreover, the integration-adjusted gene expression values markedly improved the ability to identify relationships between the clusters of the original studies and also improved the top correlation score for each original cluster (Supplementary Fig. 1c, d).”
§ A harmonized atlas of mouse spinal cord cell types and their spatial organization > Results > Merged analysis of spinal cord cells and nuclei
boosteddirect- Asserted: passes — The authors put it forward as true.
- Checkable: passes — It can be checked against evidence.
- Load-bearing: passes — The paper’s conclusions depend on it.
- Based: passes — The paper gives a reason why it holds.
It may state two separate claims as one.
A result the paper reports from its own data — it cites no other source for it, so there is none to check. The quote shows it is in the paper.
In the paper
“This analysis also revealed that putative dorsal clusters were well separated from each other by long dendrogram branches, while putative mid and ventral clusters were much closer to each other in this reduced gene expression space (Fig. 3a).”
§ A harmonized atlas of mouse spinal cord cell types and their spatial organization > Results > General trends in molecular identity relationships amongst neuronal populations
hedgedcorrelational- Asserted: passes — The authors put it forward as true.
- Checkable: passes — It can be checked against evidence.
- Load-bearing: passes — The paper’s conclusions depend on it.
- Based: passes — The paper gives a reason why it holds.
It may state two separate claims as one.
A result the paper reports from its own data — it cites no other source for it, so there is none to check. The quote shows it is in the paper.
In the paper
“This work revealed striking differences between dorsal and ventral neuronal cell types, both in their cell-type relationships and molecular trends.”
§ A harmonized atlas of mouse spinal cord cell types and their spatial organization > Introduction
boostedcorrelational- Asserted: passes — The authors put it forward as true.
- Checkable: passes — It can be checked against evidence.
- Load-bearing: passes — The paper’s conclusions depend on it.
- Based: passes — The paper gives a reason why it holds.
It may state two separate claims as one.
A result the paper reports from its own data — it cites no other source for it, so there is none to check. The quote shows it is in the paper.
In the paper
“Finally, we tested a range of automated classification algorithms and identified a two-tiered model based on label transfer and neural networks as the best method for classifying spinal cord cell types.”
§ A harmonized atlas of mouse spinal cord cell types and their spatial organization > Introduction
plain- Asserted: passes — The authors put it forward as true.
- Checkable: passes — It can be checked against evidence.
- Load-bearing: passes — The paper’s conclusions depend on it.
- Based: passes — The paper gives a reason why it holds.
It may state two separate claims as one.
A result the paper reports from its own data — it cites no other source for it, so there is none to check. The quote shows it is in the paper.
In the paper
“A comparison across studies revealed that these high throughput studies detected fewer genes per cell/nucleus than studies that used single well technical approaches (the Hayashi, Haring, and Baek datasets), and studies that used cells (the Hayashi, Haring, Zeisel, and Baek datasets) detected more genes per cell/nucleus but had higher levels of immediate early gene and stress gene expression than”
§ A harmonized atlas of mouse spinal cord cell types and their spatial organization > Results > Merged analysis of spinal cord cells and nuclei
plaincorrelational- Asserted: passes — The authors put it forward as true.
- Checkable: passes — It can be checked against evidence.
- Load-bearing: passes — The paper’s conclusions depend on it.
- Based: passes — The paper gives a reason why it holds.
It may state two separate claims as one.
The paper states this without a source or data behind it here, so there is nothing to check it against. The quote shows it is in the paper.
In the paper
“As a result, this merged dataset contains more cells and nuclei than were analyzed in the original studies and a uniform set of genes.”
§ A harmonized atlas of mouse spinal cord cell types and their spatial organization > Results > Merged analysis of spinal cord cells and nuclei
plain- Asserted: passes — The authors put it forward as true.
- Checkable: passes — It can be checked against evidence.
- Load-bearing: passes — The paper’s conclusions depend on it.
- Based: passes — The paper gives a reason why it holds.
It may state two separate claims as one.
The paper states this without a source or data behind it here, so there is nothing to check it against. The quote shows it is in the paper.
In the paper
“The only study to dissect the spinal cord including the dorsal and ventral spinal roots (the Sathyamurthy dataset) was the only source of Schwann and peripheral glia cells that would be located in these roots.”
§ A harmonized atlas of mouse spinal cord cell types and their spatial organization > Results > A harmonized atlas of major cell types
hedged- Asserted: passes — The authors put it forward as true.
- Checkable: passes — It can be checked against evidence.
- Load-bearing: unclear — It is unclear whether the paper’s conclusions depend on it.
- Based: passes — The paper gives a reason why it holds.
The quote only partly states this claim.
A result the paper reports from its own data — it cites no other source for it, so there is none to check. The quote shows it is in the paper.
In the paper
“This family was only comprised of nuclei from the Sathyamurthy and Rosenberg datasets but we could not detected refined sub-populations of motoneurons. However, this included only 565 MNs.”
§ A harmonized atlas of mouse spinal cord cell types and their spatial organization > Results > Detailed cluster analysis and marker validation for harmonized neuronal cell types
plain- Asserted: passes — The authors put it forward as true.
- Checkable: passes — It can be checked against evidence.
- Load-bearing: passes — The paper’s conclusions depend on it.
- Based: passes — The paper gives a reason why it holds.
It may state two separate claims as one.
A result the paper reports from its own data — it cites no other source for it, so there is none to check. The quote shows it is in the paper.
In the paper
“Moreover, among the three studies that examined all cell types, the early postnatal Rosenberg study showed enrichment of immature cells of oligodendrocyte lineage relative to the adult Sathyamurthy study, while the adolescent Zeisel study showed an intermediate distribution.”
§ A harmonized atlas of mouse spinal cord cell types and their spatial organization > Results > A harmonized atlas of major cell types
plaincorrelational- Asserted: passes — The authors put it forward as true.
- Checkable: passes — It can be checked against evidence.
- Load-bearing: unclear — It is unclear whether the paper’s conclusions depend on it.
- Based: passes — The paper gives a reason why it holds.
It may state two separate claims as one.
A result the paper reports from its own data — it cites no other source for it, so there is none to check. The quote shows it is in the paper.
In the paper
“We observed 20 dorsal excitatory clusters, 14 dorsal inhibitory clusters, 10 deep dorsal/mid excitatory clusters, 7 deep dorsal/mid inhibitory clusters, 8 ventral excitatory clusters, 6 ventral inhibitory clusters, 3 cholinergic motoneuron clusters, and 1 cluster of the cerebrospinal fluid contacting neurons (CSF-cN).”
§ A harmonized atlas of mouse spinal cord cell types and their spatial organization > Results > Overview of harmonized neuronal cell types
plain- Asserted: passes — The authors put it forward as true.
- Checkable: passes — It can be checked against evidence.
- Load-bearing: passes — The paper’s conclusions depend on it.
- Based: passes — The paper gives a reason why it holds.
It may state two separate claims as one.
A result the paper reports from its own data — it cites no other source for it, so there is none to check. The quote shows it is in the paper.
In the paper
“Unfortunately, the cells or nuclei from each study were segregated from each other almost completely, indicating that the study of origin is a major source of variability in the dataset (Fig. 1b).”
§ A harmonized atlas of mouse spinal cord cell types and their spatial organization > Results > Merged analysis of spinal cord cells and nuclei
hedgeddirect- Asserted: passes — The authors put it forward as true.
- Checkable: passes — It can be checked against evidence.
- Load-bearing: passes — The paper’s conclusions depend on it.
- Based: passes — The paper gives a reason why it holds.
It may state two separate claims as one.
A result the paper reports from its own data — it cites no other source for it, so there is none to check. The quote shows it is in the paper.
In the paper
“We validated the differentially expressed patterns of several of these genes using in situ hybridization and also at the protein level for CAMK2α and WFA-lectin to reveal perineuronal nets, thereby confirming predicted gene expression signatures that would differentially regulate plasticity in the dorsal and ventral horns of the spinal cord (Fig. 3c–f).”
§ A harmonized atlas of mouse spinal cord cell types and their spatial organization > Results > General trends in molecular identity relationships amongst neuronal populations
hedgeddirect- Asserted: passes — The authors put it forward as true.
- Checkable: passes — It can be checked against evidence.
- Load-bearing: passes — The paper’s conclusions depend on it.
- Based: passes — The paper gives a reason why it holds.
It may state two separate claims as one.
A result the paper reports from its own data — it cites no other source for it, so there is none to check. The quote shows it is in the paper.
In the paper
“When either all genes or the top 500 highly variable genes were analyzed, there were weak overall correlations and very few alignments between clusters from different studies (Supplementary Fig. 1a, b, d).”
§ A harmonized atlas of mouse spinal cord cell types and their spatial organization > Results > Merged analysis of spinal cord cells and nuclei
plaincorrelational- Asserted: passes — The authors put it forward as true.
- Checkable: passes — It can be checked against evidence.
- Load-bearing: passes — The paper’s conclusions depend on it.
- Based: passes — The paper gives a reason why it holds.
It may state two separate claims as one.
A result the paper reports from its own data — it cites no other source for it, so there is none to check. The quote shows it is in the paper.
In the paper
“Excit-17 included almost exclusively nuclei from the Rosenberg dataset and showed enriched expression of the immature neuron marker Dcx.”
§ A harmonized atlas of mouse spinal cord cell types and their spatial organization > Results > Detailed cluster analysis and marker validation for harmonized neuronal cell types
plaincorrelational- Asserted: passes — The authors put it forward as true.
- Checkable: passes — It can be checked against evidence.
- Load-bearing: unclear — It is unclear whether the paper’s conclusions depend on it.
- Based: passes — The paper gives a reason why it holds.
It may state two separate claims as one.
A result the paper reports from its own data — it cites no other source for it, so there is none to check. The quote shows it is in the paper.
In the paper
“Excit-5 also expressed Pvalb and Cck, Excit-6 expressed Rorb and Cpne4, and Excit-7 was distinguished by having only nuclei from the Rosenberg dataset and expressed the immature neuron marker Dcx, suggesting an immature phenotype.”
§ A harmonized atlas of mouse spinal cord cell types and their spatial organization > Results > Detailed cluster analysis and marker validation for harmonized neuronal cell types
hedgedcorrelational- Asserted: passes — The authors put it forward as true.
- Checkable: passes — It can be checked against evidence.
- Load-bearing: unclear — It is unclear whether the paper’s conclusions depend on it.
- Based: passes — The paper gives a reason why it holds.
It may state two separate claims as one.
A result the paper reports from its own data — it cites no other source for it, so there is none to check. The quote shows it is in the paper.
In the paper
“These clusters expressed enriched levels of Car12 (in particular in Excit-9 and Excit-10), the neuropeptide receptors Trhr (Excit-8), Npr1 (Excit-9 and Excit-10), and Nmur2 (Excit-10), and the neuropeptide Grp (Excit-9).”
§ A harmonized atlas of mouse spinal cord cell types and their spatial organization > Results > Detailed cluster analysis and marker validation for harmonized neuronal cell types
plaincorrelational- Asserted: passes — The authors put it forward as true.
- Checkable: passes — It can be checked against evidence.
- Load-bearing: unclear — It is unclear whether the paper’s conclusions depend on it.
- Based: passes — The paper gives a reason why it holds.
It may state two separate claims as one.
A result the paper reports from its own data — it cites no other source for it, so there is none to check. The quote shows it is in the paper.
In the paper
“Inhib-6 and Inhib-7 expressed Cdh3 and were distinguished by co-expression of Kcnip2 and Pvalb in Inhib-7.”
§ A harmonized atlas of mouse spinal cord cell types and their spatial organization > Results > Detailed cluster analysis and marker validation for harmonized neuronal cell types
plaincorrelational- Asserted: passes — The authors put it forward as true.
- Checkable: passes — It can be checked against evidence.
- Load-bearing: unclear — It is unclear whether the paper’s conclusions depend on it.
- Based: passes — The paper gives a reason why it holds.
It may state two separate claims as one.
A result the paper reports from its own data — it cites no other source for it, so there is none to check. The quote shows it is in the paper.
In the paper
“Prkcg is a classic marker gene in the spinal cord and defined this family together with the neuropeptides Cck and Trh (Excit-3) and Nts (Excit-4).”
§ A harmonized atlas of mouse spinal cord cell types and their spatial organization > Results > Detailed cluster analysis and marker validation for harmonized neuronal cell types
plaincorrelational- Asserted: passes — The authors put it forward as true.
- Checkable: passes — It can be checked against evidence.
- Load-bearing: passes — The paper’s conclusions depend on it.
- Based: passes — The paper gives a reason why it holds.
Probably not a substantial claim.
A result the paper reports from its own data — it cites no other source for it, so there is none to check. The quote shows it is in the paper.
In the paper
“While Inhib-8 contained only low levels of Cdh3 in this analysis, Cdh3 expression was confirmed by in situ hybridization and this cluster was included in this family based on proximity in principal component space as reflected in the UMAP and dendrogram analysis. Inhib-8 also expressed Klhl14.”
§ A harmonized atlas of mouse spinal cord cell types and their spatial organization > Results > Detailed cluster analysis and marker validation for harmonized neuronal cell types
plaincorrelational- Asserted: passes — The authors put it forward as true.
- Checkable: passes — It can be checked against evidence.
- Load-bearing: unclear — It is unclear whether the paper’s conclusions depend on it.
- Based: passes — The paper gives a reason why it holds.
It may state two separate claims as one.
A result the paper reports from its own data — it cites no other source for it, so there is none to check. The quote shows it is in the paper.
In the paper
“The Cpne4 dorsal, excitatory family was comprised of Excit-1 and Excit-2. Excit-1 was a rare subset, both in the harmonized clusters and in the in situ counts, that also expressed Dach2. Excit-2 was more prevalent and co-expressed Prkcg as well as Cbln2.”
§ A harmonized atlas of mouse spinal cord cell types and their spatial organization > Results > Detailed cluster analysis and marker validation for harmonized neuronal cell types
plaincorrelational- Asserted: passes — The authors put it forward as true.
- Checkable: passes — It can be checked against evidence.
- Load-bearing: unclear — It is unclear whether the paper’s conclusions depend on it.
- Based: passes — The paper gives a reason why it holds.
It may state two separate claims as one.
A result the paper reports from its own data — it cites no other source for it, so there is none to check. The quote shows it is in the paper.
In the paper
“The Megf11 cluster (Excit-20) displayed features of dorsal excitatory neurons and mid excitatory neurons, being located in lamina 4/5 and being grouped with mid neurons in principal component space in the UMAP and dendrogram analysis.”
§ A harmonized atlas of mouse spinal cord cell types and their spatial organization > Results > Detailed cluster analysis and marker validation for harmonized neuronal cell types
plaincorrelational- Asserted: passes — The authors put it forward as true.
- Checkable: passes — It can be checked against evidence.
- Load-bearing: unclear — It is unclear whether the paper’s conclusions depend on it.
- Based: passes — The paper gives a reason why it holds.
It may state two separate claims as one.
A result the paper reports from its own data — it cites no other source for it, so there is none to check. The quote shows it is in the paper.
In the paper
“Of note, there were two discrepancies in this family between the sequencing data and the in situ hybridization data: Cck was present at high levels in the Excit-3 in the sequencing data but we did not detect Cck in most Prkcg-expressing cells of the adult spinal cord and Prkcg was not enriched in Excit-4 in the sequencing data but was readily detected with Nts and Calb1 in this cluster in adult t”
§ A harmonized atlas of mouse spinal cord cell types and their spatial organization > Results > Detailed cluster analysis and marker validation for harmonized neuronal cell types
plainn = 2- Asserted: passes — The authors put it forward as true.
- Checkable: passes — It can be checked against evidence.
- Load-bearing: unclear — It is unclear whether the paper’s conclusions depend on it.
- Based: passes — The paper gives a reason why it holds.
It may state two separate claims as one.
A result the paper reports from its own data — it cites no other source for it, so there is none to check. The quote shows it is in the paper.
In the paper
“In addition to Rorb, Inhib-1 expressed Sorcs3, Inhib-3 expressed Nppc as well as Nrgn, Inhib-4 expressed Rxfp2, and Inhib-5 did not express these other genes. Inhib-2 expressed Sorcs3 and Adamts5.”
§ A harmonized atlas of mouse spinal cord cell types and their spatial organization > Results > Detailed cluster analysis and marker validation for harmonized neuronal cell types
plaincorrelational- Asserted: passes — The authors put it forward as true.
- Checkable: passes — It can be checked against evidence.
- Load-bearing: unclear — It is unclear whether the paper’s conclusions depend on it.
- Based: passes — The paper gives a reason why it holds.
It may state two separate claims as one.
A result the paper reports from its own data — it cites no other source for it, so there is none to check. The quote shows it is in the paper.
In the paper
“Both subsets also expressed Calb1, although it was not specific to these clusters.”
§ A harmonized atlas of mouse spinal cord cell types and their spatial organization > Results > Detailed cluster analysis and marker validation for harmonized neuronal cell types
plaincorrelational- Asserted: passes — The authors put it forward as true.
- Checkable: passes — It can be checked against evidence.
- Load-bearing: unclear — It is unclear whether the paper’s conclusions depend on it.
- Based: passes — The paper gives a reason why it holds.
It may state two separate claims as one.
A result the paper reports from its own data — it cites no other source for it, so there is none to check. The quote shows it is in the paper.
In the paper
“This cluster was very distinct from other neuronal populations, inhibitory, and also expressed the early neuron marker Sox2 and the V2b lineage markers Gata2 and Gata3, suggesting an immature phenotype.”
§ A harmonized atlas of mouse spinal cord cell types and their spatial organization > Results > Detailed cluster analysis and marker validation for harmonized neuronal cell types
hedgedcorrelational- Asserted: passes — The authors put it forward as true.
- Checkable: passes — It can be checked against evidence.
- Load-bearing: unclear — It is unclear whether the paper’s conclusions depend on it.
- Based: passes — The paper gives a reason why it holds.
It may state two separate claims as one.
A result the paper reports from its own data — it cites no other source for it, so there is none to check. The quote shows it is in the paper.
In the paper
“The Rreb1 dorsal, excitatory family was comprised of Excit-12 and Excit-13. These clusters also expressed Satb1 and either Zim1 (Excit-12) or Nmur2 and Crh (Excit-13).”
§ A harmonized atlas of mouse spinal cord cell types and their spatial organization > Results > Detailed cluster analysis and marker validation for harmonized neuronal cell types
plaincorrelational- Asserted: passes — The authors put it forward as true.
- Checkable: passes — It can be checked against evidence.
- Load-bearing: unclear — It is unclear whether the paper’s conclusions depend on it.
- Based: passes — The paper gives a reason why it holds.
It may state two separate claims as one.
A result the paper reports from its own data — it cites no other source for it, so there is none to check. The quote shows it is in the paper.
In the paper
“PGCs were clustered into 23 subtypes that varied by spinal cord level and MNa were clustered into 14 subtypes that also varied by spinal level.”
§ A harmonized atlas of mouse spinal cord cell types and their spatial organization > Results > Detailed cluster analysis and marker validation for harmonized neuronal cell types
plaincorrelational- Asserted: passes — The authors put it forward as true.
- Checkable: passes — It can be checked against evidence.
- Load-bearing: passes — The paper’s conclusions depend on it.
- Based: passes — The paper gives a reason why it holds.
It may state two separate claims as one.
A result the paper reports from its own data — it cites no other source for it, so there is none to check. The quote shows it is in the paper.
In the paper
“Within this family, Excit-14 and Excit-15 were slightly separated and also similar to the Rreb1 family clusters and expressed Col5a2 (Excit-14) or Col5a2 and Enpp1 (Excit-15).”
§ A harmonized atlas of mouse spinal cord cell types and their spatial organization > Results > Detailed cluster analysis and marker validation for harmonized neuronal cell types
plaincorrelational- Asserted: passes — The authors put it forward as true.
- Checkable: passes — It can be checked against evidence.
- Load-bearing: unclear — It is unclear whether the paper’s conclusions depend on it.
- Based: passes — The paper gives a reason why it holds.
It may state two separate claims as one.
A result the paper reports from its own data — it cites no other source for it, so there is none to check. The quote shows it is in the paper.
In the paper
“Excit-16, Excit-18, and Excit-19 expressed the neuropeptides Tac1 (Excit-16), Nmu-hi/Tac2-lo (Excit-18), and Tac2hi/Nmu-lo (Excit-19).”
§ A harmonized atlas of mouse spinal cord cell types and their spatial organization > Results > Detailed cluster analysis and marker validation for harmonized neuronal cell types
plaincorrelational- Asserted: passes — The authors put it forward as true.
- Checkable: passes — It can be checked against evidence.
- Load-bearing: unclear — It is unclear whether the paper’s conclusions depend on it.
- Based: passes — The paper gives a reason why it holds.
It may state two separate claims as one.
A result the paper reports from its own data — it cites no other source for it, so there is none to check. The quote shows it is in the paper.
In the paper
“Each of these clusters expressed Pdyn, while Inhib-10 also expressed Gal and Mlxipl and Inhib-11 also expressed Gal only. Of note, the clusters in this family also expressed Rorb and Nrgn.”
§ A harmonized atlas of mouse spinal cord cell types and their spatial organization > Results > Detailed cluster analysis and marker validation for harmonized neuronal cell types
plaincorrelational- Asserted: passes — The authors put it forward as true.
- Checkable: passes — It can be checked against evidence.
- Load-bearing: unclear — It is unclear whether the paper’s conclusions depend on it.
- Based: passes — The paper gives a reason why it holds.
It may state two separate claims as one.
A result the paper reports from its own data — it cites no other source for it, so there is none to check. The quote shows it is in the paper.
In the paper
“Dual contributions of dI5.5 and dI2.1 to Excit-20 and of V1 and V2b to Inhib-27 were also observed.”
§ A harmonized atlas of mouse spinal cord cell types and their spatial organization > Results > Developmental lineages of postnatal spinal neuron populations
plaindirect- Asserted: passes — The authors put it forward as true.
- Checkable: passes — It can be checked against evidence.
- Load-bearing: passes — The paper’s conclusions depend on it.
- Based: passes — The paper gives a reason why it holds.
It may state two separate claims as one.
- Rests on an assumption: Developmental lineage is a powerful and influential framework for categorizing spinal neurons.
A result the paper reports from its own data — it cites no other source for it, so there is none to check. The quote shows it is in the paper.
In the paper
“The model showed very high confidence scores for correct predictions; however, performance varied with cell type prevalence suggesting a target for improving the model in the future (Supplementary Fig. 11).”
§ A harmonized atlas of mouse spinal cord cell types and their spatial organization > Results > Using machine learning to classify spinal cord cell types
hedgedcorrelational- Asserted: passes — The authors put it forward as true.
- Checkable: passes — It can be checked against evidence.
- Load-bearing: unclear — It is unclear whether the paper’s conclusions depend on it.
- Based: passes — The paper gives a reason why it holds.
It may state two separate claims as one.
- Rests on an assumption: There is no existing gold standard for spinal cord cell identities.
- Rests on an assumption: The harmonized analysis cell type labels are adequate as training labels for machine learning classifiers.
A result the paper reports from its own data — it cites no other source for it, so there is none to check. The quote shows it is in the paper.
In the paper
“Excit-35 also expressed Vamp1, Pou3f1, Shox2, and Pou6f2 and Excit-36 expressed Esrrg.”
§ A harmonized atlas of mouse spinal cord cell types and their spatial organization > Results > Detailed cluster analysis and marker validation for harmonized neuronal cell types
plain- Asserted: passes — The authors put it forward as true.
- Checkable: passes — It can be checked against evidence.
- Load-bearing: unclear — It is unclear whether the paper’s conclusions depend on it.
- Based: passes — The paper gives a reason why it holds.
It may state two separate claims as one.
A result the paper reports from its own data — it cites no other source for it, so there is none to check. The quote shows it is in the paper.
In the paper
“Of note, nearly all of the cells and nuclei in this family were from the Rosenberg and Sathyamurthy datasets and Excit-26 in particular was predominantly from the Rosenberg dataset.”
§ A harmonized atlas of mouse spinal cord cell types and their spatial organization > Results > Detailed cluster analysis and marker validation for harmonized neuronal cell types
plaincorrelational- Asserted: passes — The authors put it forward as true.
- Checkable: passes — It can be checked against evidence.
- Load-bearing: fails — The paper’s conclusions may not depend on it.
- Based: passes — The paper gives a reason why it holds.
Probably not a substantial claim. The paper’s conclusions may not depend on it. It may state two separate claims as one.
A result the paper reports from its own data — it cites no other source for it, so there is none to check. The quote shows it is in the paper.
In the paper
“A neural network model with one hidden layer (256 nodes) and an SGD optimizer showed the best performance (overall accuracy of 80%) and was selected for further work.”
§ A harmonized atlas of mouse spinal cord cell types and their spatial organization > Results > Using machine learning to classify spinal cord cell types
plain- Asserted: passes — The authors put it forward as true.
- Checkable: passes — It can be checked against evidence.
- Load-bearing: passes — The paper’s conclusions depend on it.
- Based: passes — The paper gives a reason why it holds.
It may state two separate claims as one.
- Rests on an assumption: There is no existing gold standard for spinal cord cell identities.
- Rests on an assumption: The harmonized analysis cell type labels are adequate as training labels for machine learning classifiers.
A result the paper reports from its own data — it cites no other source for it, so there is none to check. The quote shows it is in the paper.
In the paper
“For example, Pou6f2 was expressed in the deep dorsal horn and in the dorsal part of the ventral horn and was enriched in mid-excitatory (Excit-21, Excit-28, and Excit 30), ventral excitatory (Excit-34 and Excit-35), and ventral inhibitory (Inhib-24) clusters that are located within this domain.”
§ A harmonized atlas of mouse spinal cord cell types and their spatial organization > Results > Detailed cluster analysis and marker validation for harmonized neuronal cell types
plaincorrelational- Asserted: passes — The authors put it forward as true.
- Checkable: passes — It can be checked against evidence.
- Load-bearing: unclear — It is unclear whether the paper’s conclusions depend on it.
- Based: passes — The paper gives a reason why it holds.
It may state two separate claims as one.
None of the sources cited for this claim have been checked yet.
In the paper
“The Chat dorsal inhibitor cluster Inhib-14 was a deep dorsal (lamina 4), inhibitory and cholinergic population and also expressed Nos180–82.”
§ A harmonized atlas of mouse spinal cord cell types and their spatial organization > Results > Detailed cluster analysis and marker validation for harmonized neuronal cell types
What the sources say
- Not checked yetcites [80] Laing, I., Todd, A. J., Heizmann, C. W. & Schmidt, H. H. Subpopulations of GABAergic neurons in laminae I-III of rat spinal dorsal horn defined by coexistence with classical transmitters, peptides, nitric oxide synthase or parvalbumin. Neuroscience 61, 123–132 (1994). source
- Not checked yetcites [81] Kluchová, D. et al. Partial colocalization of NADPH-diaphorase and acetylcholinesterase positivity in spinal cord neurons. Physiol. Res. 49, 151–155 (2000).
- Not checked yetcites [82] Mesnage, B. et al. Morphological and functional characterization of cholinergic interneurons in the dorsal horn of the mouse spinal cord. J. Comp. Neurol. 519, 3139–3158 (2011). source
plain- Asserted: passes — The authors put it forward as true.
- Checkable: passes — It can be checked against evidence.
- Load-bearing: unclear — It is unclear whether the paper’s conclusions depend on it.
- Based: passes — The paper gives a reason why it holds.
It may state two separate claims as one.
A result the paper reports from its own data — it cites no other source for it, so there is none to check. The quote shows it is in the paper.
In the paper
“Of note, nearly all of the cells and nuclei in this family were from the Rosenberg and Sathyamurthy datasets.”
§ A harmonized atlas of mouse spinal cord cell types and their spatial organization > Results > Detailed cluster analysis and marker validation for harmonized neuronal cell types
plain- Asserted: passes — The authors put it forward as true.
- Checkable: passes — It can be checked against evidence.
- Load-bearing: fails — The paper’s conclusions may not depend on it.
- Based: passes — The paper gives a reason why it holds.
Probably not a substantial claim. The paper’s conclusions may not depend on it.
A result the paper reports from its own data — it cites no other source for it, so there is none to check. The quote shows it is in the paper.
In the paper
“Similarly, Nfib was expressed in the medial deep dorsal horn (mid) spinal cord and was enriched in both excitatory (Excit-23, Excit-25, and Excit-30) and inhibitory (Inhib-15 and Inhib-21) clusters.”
§ A harmonized atlas of mouse spinal cord cell types and their spatial organization > Results > Detailed cluster analysis and marker validation for harmonized neuronal cell types
plaincorrelational- Asserted: passes — The authors put it forward as true.
- Checkable: passes — It can be checked against evidence.
- Load-bearing: unclear — It is unclear whether the paper’s conclusions depend on it.
- Based: passes — The paper gives a reason why it holds.
It may state two separate claims as one.
A result the paper reports from its own data — it cites no other source for it, so there is none to check. The quote shows it is in the paper.
In the paper
“These clusters expressed Npy and were distinguished by low levels of Vgf (Inhib-12) or by expression of Qrfpr (Inhib-13).”
§ A harmonized atlas of mouse spinal cord cell types and their spatial organization > Results > Detailed cluster analysis and marker validation for harmonized neuronal cell types
plaincorrelational- Asserted: passes — The authors put it forward as true.
- Checkable: passes — It can be checked against evidence.
- Load-bearing: unclear — It is unclear whether the paper’s conclusions depend on it.
- Based: passes — The paper gives a reason why it holds.
It may state two separate claims as one.
A result the paper reports from its own data — it cites no other source for it, so there is none to check. The quote shows it is in the paper.
In the paper
“Other markers sub-divided the clusters in a combinatorial manner, including Nms (Excit-21), Bcl11a (Excit-22 through Excit-25), Satb1 and Cdh23 (Excit-23, Excit-24, and Excit-25), Cep112 (Excit-23 and Excit-24), and Prox1 (Excit-25).”
§ A harmonized atlas of mouse spinal cord cell types and their spatial organization > Results > Detailed cluster analysis and marker validation for harmonized neuronal cell types
plaincorrelational- Asserted: passes — The authors put it forward as true.
- Checkable: passes — It can be checked against evidence.
- Load-bearing: unclear — It is unclear whether the paper’s conclusions depend on it.
- Based: passes — The paper gives a reason why it holds.
It may state two separate claims as one.
A result the paper reports from its own data — it cites no other source for it, so there is none to check. The quote shows it is in the paper.
In the paper
“All three strategies performed well, with label transfer showing the best performance (overall accuracy of 89%), followed by the neural network (83%), and then the SVM (80%) (Fig. 6a and Supplementary Table 6).”
§ A harmonized atlas of mouse spinal cord cell types and their spatial organization > Results > Using machine learning to classify spinal cord cell types
plain- Asserted: passes — The authors put it forward as true.
- Checkable: passes — It can be checked against evidence.
- Load-bearing: passes — The paper’s conclusions depend on it.
- Based: passes — The paper gives a reason why it holds.
It may state two separate claims as one.
- Rests on an assumption: There is no existing gold standard for spinal cord cell identities.
- Rests on an assumption: The harmonized analysis cell type labels are adequate as training labels for machine learning classifiers.
A result the paper reports from its own data — it cites no other source for it, so there is none to check. The quote shows it is in the paper.
In the paper
“We found that long trajectories of embryonic cells led towards particular cluster families, which allowed us to infer developmental relationships (Fig. 5b).”
§ A harmonized atlas of mouse spinal cord cell types and their spatial organization > Results > Developmental lineages of postnatal spinal neuron populations
plaindirect- Asserted: passes — The authors put it forward as true.
- Checkable: passes — It can be checked against evidence.
- Load-bearing: passes — The paper’s conclusions depend on it.
- Based: passes — The paper gives a reason why it holds.
It may state two separate claims as one. The quote only partly states this claim.
- Rests on an assumption: Developmental lineage is a powerful and influential framework for categorizing spinal neurons.
A result the paper reports from its own data — it cites no other source for it, so there is none to check. The quote shows it is in the paper.
In the paper
“The molecular identities of the cardinal classes were confirmed by classic marker analysis (Fig. 5c) and these marker genes often extended into the postnatal cell type domains as well.”
§ A harmonized atlas of mouse spinal cord cell types and their spatial organization > Results > Developmental lineages of postnatal spinal neuron populations
plaincorrelational- Asserted: passes — The authors put it forward as true.
- Checkable: passes — It can be checked against evidence.
- Load-bearing: unclear — It is unclear whether the paper’s conclusions depend on it.
- Based: passes — The paper gives a reason why it holds.
It may state two separate claims as one.
- Rests on an assumption: Developmental lineage is a powerful and influential framework for categorizing spinal neurons.
A result the paper reports from its own data — it cites no other source for it, so there is none to check. The quote shows it is in the paper.
In the paper
“Inhib-15 expressed Prox1, Gabra1, and Nfib, Inhib-16 expressed Gpc3 and Sema5b, Inhib-17 expressed Satb2, Inhib-18 expressed Sema5b, Inhib-19 expressed Ccbe1 and Pou6f2, Inhib-20 expressed higher levels of Tfap2b as well as Zfhx3, and Inhib-21 expressed Nfib and was distinguished by having only Gad2 and not Slc6a5 and was mainly derived from the Rosenberg dataset.”
§ A harmonized atlas of mouse spinal cord cell types and their spatial organization > Results > Detailed cluster analysis and marker validation for harmonized neuronal cell types
plain- Asserted: passes — The authors put it forward as true.
- Checkable: passes — It can be checked against evidence.
- Load-bearing: unclear — It is unclear whether the paper’s conclusions depend on it.
- Based: passes — The paper gives a reason why it holds.
It may state two separate claims as one.
A result the paper reports from its own data — it cites no other source for it, so there is none to check. The quote shows it is in the paper.
In the paper
“Excit-26 expressed Nfib, Excit-27 expressed Adamts2, Excit-28 expressed Chat and Pitx2 and thus likely corresponds to V0c neurons, and Excit-29 expressed Pmfbp1.”
§ A harmonized atlas of mouse spinal cord cell types and their spatial organization > Results > Detailed cluster analysis and marker validation for harmonized neuronal cell types
hedgedcorrelational- Asserted: passes — The authors put it forward as true.
- Checkable: passes — It can be checked against evidence.
- Load-bearing: unclear — It is unclear whether the paper’s conclusions depend on it.
- Based: passes — The paper gives a reason why it holds.
It may state two separate claims as one.
A result the paper reports from its own data — it cites no other source for it, so there is none to check. The quote shows it is in the paper.
In the paper
“The Clarke’s column marker gene, Gdnf, was expressed at very low levels in the merged dataset, but was present in several Excit-30 cells.”
§ A harmonized atlas of mouse spinal cord cell types and their spatial organization > Results > Detailed cluster analysis and marker validation for harmonized neuronal cell types
plain- Asserted: passes — The authors put it forward as true.
- Checkable: passes — It can be checked against evidence.
- Load-bearing: unclear — It is unclear whether the paper’s conclusions depend on it.
- Based: passes — The paper gives a reason why it holds.
It may state two separate claims as one.
A result the paper reports from its own data — it cites no other source for it, so there is none to check. The quote shows it is in the paper.
In the paper
“This analysis also supported a division of deep dorsal horn excitatory neurons into two overall groups (with the ME/Lmx1b family being more closely related to dI5, while the other ME clusters are more closely related to dI1-dI3) and a division of ventral excitatory neurons into two groups (with Excit-31 through Excit-34 being closer to dI1-3 and Excit-35 through Excit-37 being closer to V0, V2a, a”
§ A harmonized atlas of mouse spinal cord cell types and their spatial organization > Results > Developmental lineages of postnatal spinal neuron populations
plaincorrelational- Asserted: passes — The authors put it forward as true.
- Checkable: passes — It can be checked against evidence.
- Load-bearing: passes — The paper’s conclusions depend on it.
- Based: passes — The paper gives a reason why it holds.
It may state two separate claims as one.
- Rests on an assumption: Developmental lineage is a powerful and influential framework for categorizing spinal neurons.
A result the paper reports from its own data — it cites no other source for it, so there is none to check. The quote shows it is in the paper.
In the paper
“We found that the model performance varied with the co-clustering frequency of each cluster and with the ability to identify cell types in situ and we propose that these measures can be used to set a reasonable expectation for neural network performance.”
§ A harmonized atlas of mouse spinal cord cell types and their spatial organization > Results > Using machine learning to classify spinal cord cell types
plaincorrelational- Asserted: passes — The authors put it forward as true.
- Checkable: passes — It can be checked against evidence.
- Load-bearing: passes — The paper’s conclusions depend on it.
- Based: passes — The paper gives a reason why it holds.
It may state two separate claims as one.
- Rests on an assumption: There is no existing gold standard for spinal cord cell identities.
- Rests on an assumption: The harmonized analysis cell type labels are adequate as training labels for machine learning classifiers.
- Rests on an assumption: Perfect performance would require perfect and invariable biological data: discrete cell types that express completely distinct patterns of gene expression and experimental data without natural heterogeneity, doublets, low-quality cells, or other sources of indeterminate data.
A result the paper reports from its own data — it cites no other source for it, so there is none to check. The quote shows it is in the paper.
In the paper
“Excit-37 expressed low levels of the V3 marker gene Sim1 as well as Rnf220.”
§ A harmonized atlas of mouse spinal cord cell types and their spatial organization > Results > Detailed cluster analysis and marker validation for harmonized neuronal cell types
plain- Asserted: passes — The authors put it forward as true.
- Checkable: passes — It can be checked against evidence.
- Load-bearing: unclear — It is unclear whether the paper’s conclusions depend on it.
- Based: passes — The paper gives a reason why it holds.
It may state two separate claims as one.
A result the paper reports from its own data — it cites no other source for it, so there is none to check. The quote shows it is in the paper.
In the paper
“These clusters could be distinguished by Gm26673, Syt2, and Prlr (Excit-31), Mdga1 and Prlr (Excit-32), and Bnc2 and Pou6f2 (Excit-34).”
§ A harmonized atlas of mouse spinal cord cell types and their spatial organization > Results > Detailed cluster analysis and marker validation for harmonized neuronal cell types
hedgedcorrelational- Asserted: passes — The authors put it forward as true.
- Checkable: passes — It can be checked against evidence.
- Load-bearing: unclear — It is unclear whether the paper’s conclusions depend on it.
- Based: passes — The paper gives a reason why it holds.
It may state two separate claims as one.
A result the paper reports from its own data — it cites no other source for it, so there is none to check. The quote shows it is in the paper.
In the paper
“We found that a linear model (with no regularization and with an SGD optimizer) showed the best performance, with an overall test accuracy of 85% (Fig. 6b and Supplementary Table 6).”
§ A harmonized atlas of mouse spinal cord cell types and their spatial organization > Results > Using machine learning to classify spinal cord cell types
plain- Asserted: passes — The authors put it forward as true.
- Checkable: passes — It can be checked against evidence.
- Load-bearing: unclear — It is unclear whether the paper’s conclusions depend on it.
- Based: passes — The paper gives a reason why it holds.
It may state two separate claims as one.
- Rests on an assumption: There is no existing gold standard for spinal cord cell identities.
- Rests on an assumption: The harmonized analysis cell type labels are adequate as training labels for machine learning classifiers.
A result the paper reports from its own data — it cites no other source for it, so there is none to check. The quote shows it is in the paper.
In the paper
“In contrast, ventral clusters are much more similar to each other, with close or overlapping distributions in principal component space and overlapping gene expression patterns.”
§ A harmonized atlas of mouse spinal cord cell types and their spatial organization > Discussion
plaincorrelational- Asserted: passes — The authors put it forward as true.
- Checkable: passes — It can be checked against evidence.
- Load-bearing: passes — The paper’s conclusions depend on it.
- Based: passes — The paper gives a reason why it holds.
It may state two separate claims as one.
A result the paper reports from its own data — it cites no other source for it, so there is none to check. The quote shows it is in the paper.
In the paper
“Dorsal clusters are distinct from each other with clearly separated individual cell types that can be grouped loosely into families.”
§ A harmonized atlas of mouse spinal cord cell types and their spatial organization > Discussion
boosted- Asserted: passes — The authors put it forward as true.
- Checkable: passes — It can be checked against evidence.
- Load-bearing: passes — The paper’s conclusions depend on it.
- Based: passes — The paper gives a reason why it holds.
It may state two separate claims as one.
A result the paper reports from its own data — it cites no other source for it, so there is none to check. The quote shows it is in the paper.
In the paper
“For example, three very different methods – single-cell data clustering, multiplexed in situ hybridization, and an artificial intelligence neural network – all showed a relatively weak ability to classify ventral cell types into discrete types and a relatively strong but still imperfect ability to classify dorsal cell types.”
§ A harmonized atlas of mouse spinal cord cell types and their spatial organization > Discussion
plaincorrelational- Asserted: passes — The authors put it forward as true.
- Checkable: passes — It can be checked against evidence.
- Load-bearing: passes — The paper’s conclusions depend on it.
- Based: passes — The paper gives a reason why it holds.
It may state two separate claims as one.
A result the paper reports from its own data — it cites no other source for it, so there is none to check. The quote shows it is in the paper.
In the paper
“Differential gene expression and gene ontology analysis revealed that learning-related genes are enriched in the dorsal horn while structural stability-related genes are enriched in the ventral horn.”
§ A harmonized atlas of mouse spinal cord cell types and their spatial organization > Discussion
plaincorrelational- Asserted: passes — The authors put it forward as true.
- Checkable: passes — It can be checked against evidence.
- Load-bearing: passes — The paper’s conclusions depend on it.
- Based: passes — The paper gives a reason why it holds.
It may state two separate claims as one.
The paper states this without a source or data behind it here, so there is nothing to check it against. The quote shows it is in the paper.
In the paper
“The neural network model was at least as accurate as other methods such as Seurat-based clustering and high-content in situ hybridization and was orders of magnitude faster.”
§ A harmonized atlas of mouse spinal cord cell types and their spatial organization > Results > Using machine learning to classify spinal cord cell types
plain- Asserted: passes — The authors put it forward as true.
- Checkable: passes — It can be checked against evidence.
- Load-bearing: passes — The paper’s conclusions depend on it.
- Based: passes — The paper gives a reason why it holds.
It may state two separate claims as one.
- Rests on an assumption: There is no existing gold standard for spinal cord cell identities.
- Rests on an assumption: The harmonized analysis cell type labels are adequate as training labels for machine learning classifiers.
The paper states this without a source or data behind it here, so there is nothing to check it against. The quote shows it is in the paper.
In the paper
“Of note, several cell types were not expected to be present in the independent dataset, including Schwann cells, peripheral glia, and meninges 2 (based on the surgical dissection method used that did not include spinal roots or outer layers of meninges) and including PGC, Excitatory-7, and Excitatory-17 (based on the lumbar region and adult age that was used). As expected, these cell types were”
§ A harmonized atlas of mouse spinal cord cell types and their spatial organization > Results > Using machine learning to classify spinal cord cell types
plain- Asserted: passes — The authors put it forward as true.
- Checkable: passes — It can be checked against evidence.
- Load-bearing: unclear — It is unclear whether the paper’s conclusions depend on it.
- Based: passes — The paper gives a reason why it holds.
It may state two separate claims as one.
- Rests on an assumption: There is no existing gold standard for spinal cord cell identities.
- Rests on an assumption: The harmonized analysis cell type labels are adequate as training labels for machine learning classifiers.
A result the paper reports from its own data — it cites no other source for it, so there is none to check. The quote shows it is in the paper.
In the paper
“In particular, several mid/ventral cell types were not detected in the independent dataset while two ventral clusters (Excitatory-31 and Inhibitory-27) were over-represented (Fig. 6 and Supplementary Fig. 13).”
§ A harmonized atlas of mouse spinal cord cell types and their spatial organization > Results > Using machine learning to classify spinal cord cell types
plain- Asserted: passes — The authors put it forward as true.
- Checkable: passes — It can be checked against evidence.
- Load-bearing: unclear — It is unclear whether the paper’s conclusions depend on it.
- Based: passes — The paper gives a reason why it holds.
It may state two separate claims as one.
- Rests on an assumption: There is no existing gold standard for spinal cord cell identities.
- Rests on an assumption: The harmonized analysis cell type labels are adequate as training labels for machine learning classifiers.
A result the paper reports from its own data — it cites no other source for it, so there is none to check. The quote shows it is in the paper.
In the paper
“This work also led to the surprising discovery of gene expression signatures for plasticity in the dorsal horn and for structural stability in the ventral horn.”
§ A harmonized atlas of mouse spinal cord cell types and their spatial organization > Discussion
plaindirect- Asserted: passes — The authors put it forward as true.
- Checkable: passes — It can be checked against evidence.
- Load-bearing: passes — The paper’s conclusions depend on it.
- Based: passes — The paper gives a reason why it holds.
It may state two separate claims as one.
A result the paper reports from its own data — it cites no other source for it, so there is none to check. The quote shows it is in the paper.
In the paper
“For example, the deep dorsal horn excitatory neurons can be divided into two families, with Excit-21 through Excit-25 in one family that is likely derived from dI5 precursors and Excit-26 through Excit-29 in a looser family that includes dI1/2 and V0 precursors.”
§ A harmonized atlas of mouse spinal cord cell types and their spatial organization > Discussion
hedgedconditional- Asserted: passes — The authors put it forward as true.
- Checkable: passes — It can be checked against evidence.
- Load-bearing: passes — The paper’s conclusions depend on it.
- Based: passes — The paper gives a reason why it holds.
It may state two separate claims as one.
None of the sources cited for this claim have been checked yet.
In the paper
“Within the ventral horn, this included components of perineuronal nets (which are thought to restrict plasticity and had been previously detected in the ventral spinal cord110,111) such as Tnr (Tenascin-R), as well as adhesion molecules such as Sdk1 and intracellular signaling components such as Ptpn5 (STEP) which de-phosphorylates CAMK2α, NMDA receptors, and ERK kinases33.”
§ A harmonized atlas of mouse spinal cord cell types and their spatial organization > Discussion
What the sources say
- Not checked yetcites [110] Sorg, B. A. et al. Casting a wide net: role of perineuronal nets in neural plasticity. J. Neurosci. 36, 11459–11468 (2016). source
- Not checked yetcites [111] Galtrey, C. M., Kwok, J. C. F., Carulli, D., Rhodes, K. E. & Fawcett, J. W. Distribution and synthesis of extracellular matrix proteoglycans, hyaluronan, link proteins and tenascin-R in the rat spinal cord. Eur. J. Neurosci. 27, 1373–1390 (2008). source
- Not checked yetcites [33] Won, S. & Roche, K. W. Regulation of glutamate receptors by striatal-enriched tyrosine phosphatase 61 (STEP61). J. Physiol. 599, 443–451 (2021). source
plaincorrelational- Asserted: passes — The authors put it forward as true.
- Checkable: passes — It can be checked against evidence.
- Load-bearing: passes — The paper’s conclusions depend on it.
- Based: passes — The paper gives a reason why it holds.
It may state two separate claims as one.
A result the paper reports from its own data — it cites no other source for it, so there is none to check. The quote shows it is in the paper.
In the paper
“Building on these preliminary findings, the scope of the harmonized analysis here afforded a much deeper characterization of cell type relationships and robustness, the validation of these molecular distinctions in tissue, and through machine learning.”
§ A harmonized atlas of mouse spinal cord cell types and their spatial organization > Discussion
boosteddirect- Asserted: passes — The authors put it forward as true.
- Checkable: passes — It can be checked against evidence.
- Load-bearing: passes — The paper’s conclusions depend on it.
- Based: passes — The paper gives a reason why it holds.
It may state two separate claims as one.
A result the paper reports from its own data — it cites no other source for it, so there is none to check. The quote shows it is in the paper.
In the paper
“Adding regularization helped to lower the gap between the training and validation accuracy”
§ A harmonized atlas of mouse spinal cord cell types and their spatial organization > Methods > Computational classification
plaindirect- Asserted: passes — The authors put it forward as true.
- Checkable: passes — It can be checked against evidence.
- Load-bearing: fails — The paper’s conclusions may not depend on it.
- Based: passes — The paper gives a reason why it holds.
Probably not a substantial claim. The paper’s conclusions may not depend on it.
A result the paper reports from its own data — it cites no other source for it, so there is none to check. The quote shows it is in the paper.
In the paper
“Whereas the training was faster, validation accuracy improved by around 5% when we lowered the batch size to 32.”
§ A harmonized atlas of mouse spinal cord cell types and their spatial organization > Methods > Computational classification
plaindirect- Asserted: passes — The authors put it forward as true.
- Checkable: passes — It can be checked against evidence.
- Load-bearing: fails — The paper’s conclusions may not depend on it.
- Based: passes — The paper gives a reason why it holds.
Probably not a substantial claim. The paper’s conclusions may not depend on it.
A result the paper reports from its own data — it cites no other source for it, so there is none to check. The quote shows it is in the paper.
In the paper
“No additional improvement was seen at a batch size of 16, so the batch size was set to 32 for the rest of the study.”
§ A harmonized atlas of mouse spinal cord cell types and their spatial organization > Methods > Computational classification
plain- Asserted: passes — The authors put it forward as true.
- Checkable: passes — It can be checked against evidence.
- Load-bearing: fails — The paper’s conclusions may not depend on it.
- Based: passes — The paper gives a reason why it holds.
Probably not a substantial claim. The paper’s conclusions may not depend on it.
A result the paper reports from its own data — it cites no other source for it, so there is none to check. The quote shows it is in the paper.
In the paper
“GO analysis revealed that all of the enriched gene annotation clusters were associated with basic cell metabolism terms such as the ribosome, metabolic pathways, and proton transport (Supplementary Table 6).”
§ A harmonized atlas of mouse spinal cord cell types and their spatial organization > Methods > Computational classification
plaincorrelational- Asserted: passes — The authors put it forward as true.
- Checkable: passes — It can be checked against evidence.
- Load-bearing: fails — The paper’s conclusions may not depend on it.
- Based: passes — The paper gives a reason why it holds.
Probably not a substantial claim. The paper’s conclusions may not depend on it.
A result the paper reports from its own data — it cites no other source for it, so there is none to check. The quote shows it is in the paper.
In the paper
“This pipeline achieved an overall accuracy of 80% on the validation data.”
§ A harmonized atlas of mouse spinal cord cell types and their spatial organization > Methods > Computational classification
plain- Asserted: passes — The authors put it forward as true.
- Checkable: passes — It can be checked against evidence.
- Load-bearing: fails — The paper’s conclusions may not depend on it.
- Based: passes — The paper gives a reason why it holds.
Probably not a substantial claim. The paper’s conclusions may not depend on it.
The paper states this without a source or data behind it here, so there is nothing to check it against. The quote shows it is in the paper.
In the paper
“Indeed, it is not clear whether the cell types from the original studies are comparable in their current forms, resulting in a fragmented set of incomplete and conflicting atlases for the spinal cord.”
§ A harmonized atlas of mouse spinal cord cell types and their spatial organization > Introduction
plaindirect- Asserted: passes — The authors put it forward as true.
- Checkable: passes — It can be checked against evidence.
- Load-bearing: passes — The paper’s conclusions depend on it.
- Based: passes — The paper gives a reason why it holds.
It may state two separate claims as one.
None of the sources cited for this claim have been checked yet.
In the paper
“This general feature was consistent with previous observations and likely reflects similar patterns of gene expression amongst mid and ventral clusters1,4.”
§ A harmonized atlas of mouse spinal cord cell types and their spatial organization > Results > Overview of harmonized neuronal cell types
What the sources say
- Not checked yetcites [1] Sathyamurthy, A. et al. Massively parallel single nucleus transcriptional profiling defines spinal cord neurons and their activity during behavior. Cell Rep. 22, 2216–2225 (2018). source
- Not checked yetcites [4] Rosenberg, A. B. et al. Single-cell profiling of the developing mouse brain and spinal cord with split-pool barcoding. Science 360, 176–182 (2018). source
hedgedconditional- Asserted: passes — The authors put it forward as true.
- Checkable: passes — It can be checked against evidence.
- Load-bearing: fails — The paper’s conclusions may not depend on it.
- Based: passes — The paper gives a reason why it holds.
Probably not a substantial claim. The paper’s conclusions may not depend on it. It may state two separate claims as one.
What the paper did — it cites no source for this, so there is none to check. The quote shows it is in the paper.
In the paper
“To best compare the data from these studies, we began with the raw sequencing reads from each study and performed our own data processing with uniform methods and filters.”
§ A harmonized atlas of mouse spinal cord cell types and their spatial organization > Results > Merged analysis of spinal cord cells and nuclei
plain- Asserted: passes — The authors put it forward as true.
- Checkable: passes — It can be checked against evidence.
- Load-bearing: passes — The paper’s conclusions depend on it.
- Based: passes — The paper gives a reason why it holds.
It may state two separate claims as one.
A conclusion the paper draws from its own results — it cites no other source for it, so there is none to check. The quote shows it is in the paper.
In the paper
“Together, these analyses demonstrated that integration of publicly available datasets can be used to harmonize spinal cord sequencing data, preserve important biological differences between studies, and uncover a robust set of shared cell types.”
§ A harmonized atlas of mouse spinal cord cell types and their spatial organization > Results > Merged analysis of spinal cord cells and nuclei
boosteddirect- Asserted: passes — The authors put it forward as true.
- Checkable: passes — It can be checked against evidence.
- Load-bearing: passes — The paper’s conclusions depend on it.
- Based: passes — The paper gives a reason why it holds.
It may state two separate claims as one.
A conclusion the paper draws from its own results — it cites no other source for it, so there is none to check. The quote shows it is in the paper.
In the paper
“Thus, we discovered general differences in the relationships between clusters in the dorsal versus the ventral horn and molecular trends that could confer differential plasticity control in these two regions.”
§ A harmonized atlas of mouse spinal cord cell types and their spatial organization > Results > General trends in molecular identity relationships amongst neuronal populations
hedgedconditional- Asserted: passes — The authors put it forward as true.
- Checkable: passes — It can be checked against evidence.
- Load-bearing: passes — The paper’s conclusions depend on it.
- Based: passes — The paper gives a reason why it holds.
It may state two separate claims as one.
None of the sources cited for this claim have been checked yet.
In the paper
“The Npy dorsal, the inhibitory family was comprised of Inhib-12 and Inhib-13. Studies suggest this family’s markers identify neurons involved in mechanical itch and pain73,78,79.”
§ A harmonized atlas of mouse spinal cord cell types and their spatial organization > Results > Detailed cluster analysis and marker validation for harmonized neuronal cell types
What the sources say
- Not checked yetcites [73] Boyle, K. A. et al. A quantitative study of neurochemically defined populations of inhibitory interneurons in the superficial dorsal horn of the mouse spinal cord. Neuroscience 363, 120–133 (2017). source
- Not checked yetcites [78] Bourane, S. et al. Gate control of mechanical itch by a subpopulation of spinal cord interneurons. Science 350, 550–554 (2015). source
- Not checked yetcites [79] Tashima, R. et al. A subset of spinal dorsal horn interneurons crucial for gating touch-evoked pain-like behavior. Proc. Natl. Acad. Sci. USA 118, e2021220118 (2021). source
hedgedcorrelational- Asserted: passes — The authors put it forward as true.
- Checkable: passes — It can be checked against evidence.
- Load-bearing: unclear — It is unclear whether the paper’s conclusions depend on it.
- Based: passes — The paper gives a reason why it holds.
It may state two separate claims as one.
None of the sources cited for this claim have been checked yet.
In the paper
“The Reln dorsal, excitatory family was comprised of Excit-8, Excit-9, Excit-10, and Excit-11 and expressed markers indicative of a role in chemical itch sensation58–62.”
§ A harmonized atlas of mouse spinal cord cell types and their spatial organization > Results > Detailed cluster analysis and marker validation for harmonized neuronal cell types
What the sources say
- Not checked yetcites [58] Bell, A. M. et al. Expression of green fluorescent protein defines a specific population of lamina II excitatory interneurons in the GRP::eGFP mouse. Sci. Rep. 10, 13176–14 (2020). source
- Not checked yetcites [59] Christensen, A. J. et al. In vivo interrogation of spinal mechanosensory circuits. Cell Rep. 17, 1699–1710 (2016). source
- Not checked yetcites [60] Fatima, M. et al. Spinal somatostatin-positive interneurons transmit chemical itch. Pain 160, 1166–1174 (2019). source
- Not checked yetcites [61] Huang, J. et al. Circuit dissection of the role of somatostatin in itch and pain. Nat. Neurosci. 21, 707–716 (2018). source
- Not checked yetcites [62] Mishra, S. K. & Hoon, M. A. The cells and circuitry for itch responses in mice. Science 340, 968–971 (2013). source
hedgedcorrelational- Asserted: passes — The authors put it forward as true.
- Checkable: passes — It can be checked against evidence.
- Load-bearing: unclear — It is unclear whether the paper’s conclusions depend on it.
- Based: passes — The paper gives a reason why it holds.
It may state two separate claims as one.
None of the sources cited for this claim have been checked yet.
In the paper
“The Pdyn dorsal, inhibitory family was comprised of Inhib-9, Inhib-10, and Inhib-11 and expressed markers suggestive of a role in chemical itch52,61,73–77.”
§ A harmonized atlas of mouse spinal cord cell types and their spatial organization > Results > Detailed cluster analysis and marker validation for harmonized neuronal cell types
What the sources say
- Not checked yetcites [52] Duan, B. et al. Identification of spinal circuits transmitting and gating mechanical pain. Cell 159, 1417–1432 (2014). source
- Not checked yetcites [61] Huang, J. et al. Circuit dissection of the role of somatostatin in itch and pain. Nat. Neurosci. 21, 707–716 (2018). source
- Not checked yetcites [73] Boyle, K. A. et al. A quantitative study of neurochemically defined populations of inhibitory interneurons in the superficial dorsal horn of the mouse spinal cord. Neuroscience 363, 120–133 (2017). source
- Not checked yetcites [74] Brewer, C. L., Li, J., O’Conor, K., Serafin, E. K. & Baccei, M. L. Neonatal injury evokes persistent deficits in dynorphin inhibitory circuits within the adult mouse superficial dorsal horn. J. Neurosci. 40, 3882–3895 (2020). source
- Not checked yetcites [75] Brewer, C. L., Styczynski, L. M., Serafin, E. K. & Baccei, M. L. Postnatal maturation of spinal dynorphin circuits and their role in somatosensation. Pain 161, 1906–1924 (2020). source
- Not checked yetcites [76] Kardon, A. P. et al. Dynorphin acts as a neuromodulator to inhibit itch in the dorsal horn of the spinal cord. Neuron 82, 573–586 (2014). source
- Not checked yetcites [77] Serafin, E. K. et al. Transcriptional profile of spinal dynorphin-lineage interneurons in the developing mouse. Pain 160, 2380–2397 (2019). source
hedgedcorrelational- Asserted: passes — The authors put it forward as true.
- Checkable: passes — It can be checked against evidence.
- Load-bearing: unclear — It is unclear whether the paper’s conclusions depend on it.
- Based: passes — The paper gives a reason why it holds.
It may state two separate claims as one.
None of the sources cited for this claim have been checked yet.
In the paper
“The Rorb and Adamts5 dorsal, the inhibitory family was comprised of Inhib-1, Inhib-2, Inhib-3, Inhib-4, and Inhib-5, with markers of neurons involved in the dampening of dynamic touch48,68,69.”
§ A harmonized atlas of mouse spinal cord cell types and their spatial organization > Results > Detailed cluster analysis and marker validation for harmonized neuronal cell types
What the sources say
- Not checked yetcites [48] Abraira, V. E. et al. The cellular and synaptic architecture of the mechanosensory dorsal horn. Cell 168, 295–310.e19 (2017). source
- Not checked yetcites [68] Cui, L. et al. Identification of early RET+ deep dorsal spinal cord interneurons in gating pain. Neuron 91, 1137–1153 (2016). source
- Not checked yetcites [69] Gutierrez-Mecinas, M., Polgár, E., Bell, A. M., Herau, M. & Todd, A. J. Substance P-expressing excitatory interneurons in the mouse superficial dorsal horn provide a propriospinal input to the lateral spinal nucleus. Brain Struct. Funct. 223, 2377–2392 (2018). source
plaincorrelational- Asserted: passes — The authors put it forward as true.
- Checkable: passes — It can be checked against evidence.
- Load-bearing: unclear — It is unclear whether the paper’s conclusions depend on it.
- Based: passes — The paper gives a reason why it holds.
It may state two separate claims as one.
None of the sources cited for this claim have been checked yet.
In the paper
“The Cdh3 dorsal, inhibitory family was comprised of Inhib-6, Inhib-7, and Inhib-8 and are likely to be involved in the dampening of dynamic touch and therefore in mechanical allodynia70–72.”
§ A harmonized atlas of mouse spinal cord cell types and their spatial organization > Results > Detailed cluster analysis and marker validation for harmonized neuronal cell types
What the sources say
- Not checked yetcites [70] Boyle, K. A. et al. Defining a spinal microcircuit that gates myelinated afferent input: implications for tactile allodynia. Cell Rep. 28, 526–540.e6 (2019). source
- Not checked yetcites [71] Hughes, D. I. et al. Morphological, neurochemical and electrophysiological features of parvalbumin-expressing cells: a likely source of axo-axonic inputs in the mouse spinal dorsal horn. J. Physiol. 590, 3927–3951 (2012). source
- Not checked yetcites [72] Petitjean, H. et al. Dorsal horn parvalbumin neurons are gate-keepers of touch-evoked pain after nerve injury. Cell Rep. 13, 1246–1257 (2015). source
hedgedconditional- Asserted: passes — The authors put it forward as true.
- Checkable: passes — It can be checked against evidence.
- Load-bearing: unclear — It is unclear whether the paper’s conclusions depend on it.
- Based: passes — The paper gives a reason why it holds.
It may state two separate claims as one.
None of the sources cited for this claim have been checked yet.
In the paper
“The Sox5 dorsal, the excitatory family was comprised of Excit-14, Excit-15, Excit-16, Excit-17, Excit-18, and Excit-19, and expressed markers suggestive of a role in coping pain and mechanical nociception46,52,56,63–67.”
§ A harmonized atlas of mouse spinal cord cell types and their spatial organization > Results > Detailed cluster analysis and marker validation for harmonized neuronal cell types
What the sources say
- Not checked yetcites [46] Gatto, G. et al. A functional topographic map for spinal sensorimotor reflexes. Neuron 109, 91–104.e5 (2021). source
- Not checked yetcites [52] Duan, B. et al. Identification of spinal circuits transmitting and gating mechanical pain. Cell 159, 1417–1432 (2014). source
- Not checked yetcites [56] Peirs, C. et al. Dorsal horn circuits for persistent mechanical pain. Neuron 87, 797–812 (2015). source
- Not checked yetcites [63] Huang, T. et al. Identifying the pathways required for coping behaviours associated with sustained pain. Nature 565, 86–90 (2019). source
- Not checked yetcites [64] Moriyama, M. et al. Presynaptic modulation by neuromedin U of sensory synaptic transmission in rat spinal dorsal horn neurones. J. Physiol. 559, 707–713 (2004). source
- Not checked yetcites [65] Petitjean, H. et al. Recruitment of spinoparabrachial neurons by dorsal horn calretinin neurons. Cell Rep. 28, 1429–1438.e4 (2019). source
- Not checked yetcites [66] Polgár, E. et al. Substance P-expressing neurons in the superficial dorsal horn of the mouse spinal cord: insights into their functions and their roles in synaptic circuits. Neuroscience 450, 113–125 (2020). source
- Not checked yetcites [67] Smith, K. M. et al. Calretinin positive neurons form an excitatory amplifier network in the spinal cord dorsal horn. Elife 8, 1750 (2019). source
hedgedcorrelational- Asserted: passes — The authors put it forward as true.
- Checkable: passes — It can be checked against evidence.
- Load-bearing: unclear — It is unclear whether the paper’s conclusions depend on it.
- Based: passes — The paper gives a reason why it holds.
It may state two separate claims as one.
In the paper
“All of the clusters except Excit-25 expressed Tacr1 and Excit-21 also expressed Lypd1, suggesting that these are candidate ascending populations3.”
§ A harmonized atlas of mouse spinal cord cell types and their spatial organization > Results > Detailed cluster analysis and marker validation for harmonized neuronal cell types
What the sources say
- Not checked yetcites [3] Häring, M. et al. Neuronal atlas of the dorsal horn defines its architecture and links sensory input to transcriptional cell types. Nat. Neurosci. 21, 869–880 (2018). source
hedgedcorrelational- Asserted: passes — The authors put it forward as true.
- Checkable: passes — It can be checked against evidence.
- Load-bearing: unclear — It is unclear whether the paper’s conclusions depend on it.
- Based: passes — The paper gives a reason why it holds.
It may state two separate claims as one.
A conclusion the paper draws from its own results — it cites no other source for it, so there is none to check. The quote shows it is in the paper.
In the paper
“Together, the joint analysis of spinal cord neurons from embryonic through adult stages began to align these two perspectives on cell types while also highlighting the complex relationships that exist between genetically defined cellular origins and mature transcriptional signatures.”
§ A harmonized atlas of mouse spinal cord cell types and their spatial organization > Results > Developmental lineages of postnatal spinal neuron populations
plaincorrelational- Asserted: passes — The authors put it forward as true.
- Checkable: passes — It can be checked against evidence.
- Load-bearing: passes — The paper’s conclusions depend on it.
- Based: passes — The paper gives a reason why it holds.
It may state two separate claims as one.
- Rests on an assumption: Developmental lineage is a powerful and influential framework for categorizing spinal neurons.
A conclusion the paper draws from its own results — it cites no other source for it, so there is none to check. The quote shows it is in the paper.
In the paper
“Excit-33 was comprised almost entirely of nuclei from the Rosenberg dataset and may represent an immature cell type.”
§ A harmonized atlas of mouse spinal cord cell types and their spatial organization > Results > Detailed cluster analysis and marker validation for harmonized neuronal cell types
hedgedcorrelational- Asserted: passes — The authors put it forward as true.
- Checkable: passes — It can be checked against evidence.
- Load-bearing: unclear — It is unclear whether the paper’s conclusions depend on it.
- Based: passes — The paper gives a reason why it holds.
It may state two separate claims as one.
In the paper
“Excit-35, Excit-36, and Excit-37 are likely derived from the V2a lineage, as they expressed Vsx2 (Chx10) and included many cells from the Hayashi dataset that sorted cells based on Chx10 genetic expression and thus may play a role in skilled reaching87.”
§ A harmonized atlas of mouse spinal cord cell types and their spatial organization > Results > Detailed cluster analysis and marker validation for harmonized neuronal cell types
What the sources say
- Not checked yetcites [87] Azim, E., Jiang, J., Alstermark, B. & Jessell, T. M. Skilled reaching relies on a V2a propriospinal internal copy circuit. Nature 508, 357–363 (2014). source
hedgedconditional- Asserted: passes — The authors put it forward as true.
- Checkable: passes — It can be checked against evidence.
- Load-bearing: unclear — It is unclear whether the paper’s conclusions depend on it.
- Based: passes — The paper gives a reason why it holds.
It may state two separate claims as one.
A conclusion the paper draws from its own results — it cites no other source for it, so there is none to check. The quote shows it is in the paper.
In the paper
“Of note, several cluster markers of ventral cell types, such as Sim1, were not observed in adult spinal cord tissue by in situ hybridization and while they are detected in the harmonized sequencing data, they likely represent lingering RNA from developmental samples.”
§ A harmonized atlas of mouse spinal cord cell types and their spatial organization > Results > Detailed cluster analysis and marker validation for harmonized neuronal cell types
hedgedconditional- Asserted: passes — The authors put it forward as true.
- Checkable: passes — It can be checked against evidence.
- Load-bearing: passes — The paper’s conclusions depend on it.
- Based: passes — The paper gives a reason why it holds.
It may state two separate claims as one.
A conclusion the paper draws from its own results — it cites no other source for it, so there is none to check. The quote shows it is in the paper.
In the paper
“These clusters expressed Lmx1b, suggesting a dI5/dILB embryonic origin.”
§ A harmonized atlas of mouse spinal cord cell types and their spatial organization > Results > Detailed cluster analysis and marker validation for harmonized neuronal cell types
hedgedcorrelational- Asserted: passes — The authors put it forward as true.
- Checkable: passes — It can be checked against evidence.
- Load-bearing: unclear — It is unclear whether the paper’s conclusions depend on it.
- Based: passes — The paper gives a reason why it holds.
It may state two separate claims as one.
A conclusion the paper draws from its own results — it cites no other source for it, so there is none to check. The quote shows it is in the paper.
In the paper
“Excit-28 and Excit-29 also express Onecut2 and Pou6f2, potentially revealing a link with ventral cell types.”
§ A harmonized atlas of mouse spinal cord cell types and their spatial organization > Results > Detailed cluster analysis and marker validation for harmonized neuronal cell types
hedgedcorrelational- Asserted: passes — The authors put it forward as true.
- Checkable: passes — It can be checked against evidence.
- Load-bearing: unclear — It is unclear whether the paper’s conclusions depend on it.
- Based: passes — The paper gives a reason why it holds.
It may state two separate claims as one.
What the paper did — it cites no source for this, so there is none to check. The quote shows it is in the paper.
In the paper
“In general, we found that the ventral clusters had less distinct gene expression patterns and were less robust than dorsal and mid clusters; therefore, the final identities of these clusters should be considered with caution.”
§ A harmonized atlas of mouse spinal cord cell types and their spatial organization > Results > Detailed cluster analysis and marker validation for harmonized neuronal cell types
plaindirect- Asserted: passes — The authors put it forward as true.
- Checkable: passes — It can be checked against evidence.
- Load-bearing: passes — The paper’s conclusions depend on it.
- Based: passes — The paper gives a reason why it holds.
It may state two separate claims as one.
A conclusion the paper draws from its own results — it cites no other source for it, so there is none to check. The quote shows it is in the paper.
In the paper
“The remaining ME family was comprised of mid, excitatory clusters were comprised of Excit-26, Excit-27, Excit-28, and Excit-29. These clusters do not express Lmx1b, in contrast to the other mid excitatory family and are likely derived from dI1-3 or ventral embryonic lineages.”
§ A harmonized atlas of mouse spinal cord cell types and their spatial organization > Results > Detailed cluster analysis and marker validation for harmonized neuronal cell types
hedgedconditional- Asserted: passes — The authors put it forward as true.
- Checkable: passes — It can be checked against evidence.
- Load-bearing: unclear — It is unclear whether the paper’s conclusions depend on it.
- Based: passes — The paper gives a reason why it holds.
It may state two separate claims as one.
What the paper did — it cites no source for this, so there is none to check. The quote shows it is in the paper.
In the paper
“As the in situ hybridization experiments were performed on mid/lower lumbar spinal cord sections, we did not validate markers for this cluster.”
§ A harmonized atlas of mouse spinal cord cell types and their spatial organization > Results > Detailed cluster analysis and marker validation for harmonized neuronal cell types
plaindirect- Asserted: passes — The authors put it forward as true.
- Checkable: passes — It can be checked against evidence.
- Load-bearing: fails — The paper’s conclusions may not depend on it.
- Based: passes — The paper gives a reason why it holds.
Probably not a substantial claim. The paper’s conclusions may not depend on it. It may state two separate claims as one.
A conclusion the paper draws from its own results — it cites no other source for it, so there is none to check. The quote shows it is in the paper.
In the paper
“Inhib-22 and Inhib-27 also expressed the gaba-ergic marker Gad2 as well as Pax2 and Pou6f2. They were distinguished by low levels of Gata3 expression in Inhib-27, which may represent V2b lineage.”
§ A harmonized atlas of mouse spinal cord cell types and their spatial organization > Results > Detailed cluster analysis and marker validation for harmonized neuronal cell types
hedgedcorrelational- Asserted: passes — The authors put it forward as true.
- Checkable: passes — It can be checked against evidence.
- Load-bearing: unclear — It is unclear whether the paper’s conclusions depend on it.
- Based: passes — The paper gives a reason why it holds.
It may state two separate claims as one.
In the paper
“They were identified by expression of Gm26673 and Pvalb in Inhib-23, which may suggest that this cluster included Ia-inhibitory neurons89.”
§ A harmonized atlas of mouse spinal cord cell types and their spatial organization > Results > Detailed cluster analysis and marker validation for harmonized neuronal cell types
What the sources say
- Not checked yetcites [89] Alvarez, F. J. et al. Postnatal phenotype and localization of spinal cord V1 derived interneurons. J. Comp. Neurol. 493, 177–192 (2005). source
hedgedcorrelational- Asserted: passes — The authors put it forward as true.
- Checkable: passes — It can be checked against evidence.
- Load-bearing: unclear — It is unclear whether the paper’s conclusions depend on it.
- Based: passes — The paper gives a reason why it holds.
It may state two separate claims as one.
What the paper did — it cites no source for this, so there is none to check. The quote shows it is in the paper.
In the paper
“These results must be interpreted with caution because each of these datasets were included in the overall training data which could lead to artificially high performance.”
§ A harmonized atlas of mouse spinal cord cell types and their spatial organization > Results > Using machine learning to classify spinal cord cell types
hedgedconditional- Asserted: passes — The authors put it forward as true.
- Checkable: passes — It can be checked against evidence.
- Load-bearing: passes — The paper’s conclusions depend on it.
- Based: passes — The paper gives a reason why it holds.
Probably not a substantial claim. It may state two separate claims as one.
- Rests on an assumption: There is no existing gold standard for spinal cord cell identities.
- Rests on an assumption: The harmonized analysis cell type labels are adequate as training labels for machine learning classifiers.
None of the sources cited for this claim have been checked yet.
In the paper
“The mid excitatory (ME)/Lmx1b family was comprised of Excit-21, Excit-22, Excit-23, Excit-24, and Excit-25 and corresponds to cells suggested to be involved in pain3,83.”
§ A harmonized atlas of mouse spinal cord cell types and their spatial organization > Results > Detailed cluster analysis and marker validation for harmonized neuronal cell types
What the sources say
- Not checked yetcites [3] Häring, M. et al. Neuronal atlas of the dorsal horn defines its architecture and links sensory input to transcriptional cell types. Nat. Neurosci. 21, 869–880 (2018). source
- Not checked yetcites [83] Barik, A. et al. A spinoparabrachial circuit defined by Tacr1 expression drives pain. Elife 10, e61135 (2021). source
plaincorrelational- Asserted: passes — The authors put it forward as true.
- Checkable: passes — It can be checked against evidence.
- Load-bearing: unclear — It is unclear whether the paper’s conclusions depend on it.
- Based: passes — The paper gives a reason why it holds.
It may state two separate claims as one.
A conclusion the paper draws from its own results — it cites no other source for it, so there is none to check. The quote shows it is in the paper.
In the paper
“Of these, Excit-31, Excit-32, Excit-33, and Excit-34 expressed low levels of Lhx2, Lhx9, and Isl1, potentially suggesting dorsal dI1/dI2/dI3 embryonic lineages for these clusters.”
§ A harmonized atlas of mouse spinal cord cell types and their spatial organization > Results > Detailed cluster analysis and marker validation for harmonized neuronal cell types
hedgedcorrelational- Asserted: passes — The authors put it forward as true.
- Checkable: passes — It can be checked against evidence.
- Load-bearing: unclear — It is unclear whether the paper’s conclusions depend on it.
- Based: passes — The paper gives a reason why it holds.
It may state two separate claims as one.
A conclusion the paper draws from its own results — it cites no other source for it, so there is none to check. The quote shows it is in the paper.
In the paper
“Intriguingly, many cells from the Baek dataset, which sorted cells based on spinocerebellar status were found in Excit-35, suggesting that this population includes ascending projection neurons that target the cerebellum.”
§ A harmonized atlas of mouse spinal cord cell types and their spatial organization > Results > Detailed cluster analysis and marker validation for harmonized neuronal cell types
hedgedcorrelational- Asserted: passes — The authors put it forward as true.
- Checkable: passes — It can be checked against evidence.
- Load-bearing: unclear — It is unclear whether the paper’s conclusions depend on it.
- Based: passes — The paper gives a reason why it holds.
It may state two separate claims as one.
None of the sources cited for this claim have been checked yet.
In the paper
“Inhib-26 was the most robust ventral cluster and expressed the Renshaw marker genes Chrna2, Chrna7, and Calb1, suggesting that this cluster corresponded to Renshaw cells89,90.”
§ A harmonized atlas of mouse spinal cord cell types and their spatial organization > Results > Detailed cluster analysis and marker validation for harmonized neuronal cell types
What the sources say
- Not checked yetcites [89] Alvarez, F. J. et al. Postnatal phenotype and localization of spinal cord V1 derived interneurons. J. Comp. Neurol. 493, 177–192 (2005). source
- Not checked yetcites [90] Perry, S. et al. Firing properties of Renshaw cells defined by Chrna2 are modulated by hyperpolarizing and small conductance ion currents Ih and ISK. Eur. J. Neurosci. 41, 889–900 (2015). source
hedgedcorrelational- Asserted: passes — The authors put it forward as true.
- Checkable: passes — It can be checked against evidence.
- Load-bearing: passes — The paper’s conclusions depend on it.
- Based: passes — The paper gives a reason why it holds.
It may state two separate claims as one.
A conclusion the paper draws from its own results — it cites no other source for it, so there is none to check. The quote shows it is in the paper.
In the paper
“However, this cluster only contained two defined spinocerebellar cells from the Baek et al. dataset while the majority of this cluster was from the Hayashi dataset, arguing against Clarke’s column identity and also suggesting a V2 embryonic lineage.”
§ A harmonized atlas of mouse spinal cord cell types and their spatial organization > Results > Detailed cluster analysis and marker validation for harmonized neuronal cell types
hedgedcorrelational- Asserted: passes — The authors put it forward as true.
- Checkable: passes — It can be checked against evidence.
- Load-bearing: passes — The paper’s conclusions depend on it.
- Based: passes — The paper gives a reason why it holds.
It may state two separate claims as one.
A conclusion the paper draws from its own results — it cites no other source for it, so there is none to check. The quote shows it is in the paper.
In the paper
“The Excit-30 cluster was marked by Gbx2, Neurod2, and Sp8 and there was partial evidence that it corresponded to Clarke’s column (CC).”
§ A harmonized atlas of mouse spinal cord cell types and their spatial organization > Results > Detailed cluster analysis and marker validation for harmonized neuronal cell types
hedgedcorrelational- Asserted: passes — The authors put it forward as true.
- Checkable: passes — It can be checked against evidence.
- Load-bearing: unclear — It is unclear whether the paper’s conclusions depend on it.
- Based: passes — The paper gives a reason why it holds.
It may state two separate claims as one.
A conclusion the paper draws from its own results — it cites no other source for it, so there is none to check. The quote shows it is in the paper.
In the paper
“In a few instances, this data differed from the harmonized sequencing data (for example in Excit-3 and Excit-4) which may reflect differences in developmental patterns.”
§ A harmonized atlas of mouse spinal cord cell types and their spatial organization > Discussion
hedgedconditional- Asserted: passes — The authors put it forward as true.
- Checkable: passes — It can be checked against evidence.
- Load-bearing: fails — The paper’s conclusions may not depend on it.
- Based: passes — The paper gives a reason why it holds.
Probably not a substantial claim. The paper’s conclusions may not depend on it.
What the paper did — it cites no source for this, so there is none to check. The quote shows it is in the paper.
In the paper
“Animal experiments were performed in accordance with institutional guidelines and approved (protocol #1384) by the National Institute of Neurological Disorder and Stroke’s Institutional Animal Care and Use Committee.”
§ A harmonized atlas of mouse spinal cord cell types and their spatial organization > Methods > Mice
plain- Asserted: passes — The authors put it forward as true.
- Checkable: passes — It can be checked against evidence.
- Load-bearing: fails — The paper’s conclusions may not depend on it.
- Based: passes — The paper gives a reason why it holds.
Probably not a substantial claim. The paper’s conclusions may not depend on it. It may state two separate claims as one.
What the paper did — it cites no source for this, so there is none to check. The quote shows it is in the paper.
In the paper
“An even balance of male and female mice that were 9 weeks old and of mixed C57BL/6 J and BALB/cJ background were used for single nucleus sequencing (four mice) and validation studies (two groups of three mice).”
§ A harmonized atlas of mouse spinal cord cell types and their spatial organization > Methods > Mice
plainn = 4- Asserted: passes — The authors put it forward as true.
- Checkable: passes — It can be checked against evidence.
- Load-bearing: fails — The paper’s conclusions may not depend on it.
- Based: passes — The paper gives a reason why it holds.
Probably not a substantial claim. The paper’s conclusions may not depend on it. It may state two separate claims as one.
None of the sources cited for this claim have been checked yet.
In the paper
“It is already known that the adult cell types of Ia inhibitory neurons and CSF-contacting neurons each have dual origins43,45,121, suggesting that this could be a common occurrence.”
§ A harmonized atlas of mouse spinal cord cell types and their spatial organization > Discussion
What the sources say
- Not checked yetcites [43] Petracca, Y. L. et al. The late and dual origin of cerebrospinal fluid-contacting neurons in the mouse spinal cord. Development 143, 880–891 (2016).
- Not checked yetcites [45] Djenoune, L. et al. The dual developmental origin of spinal cerebrospinal fluid-contacting neurons gives rise to distinct functional subtypes. Sci. Rep. 7, 719–14 (2017). source
- Not checked yetcites [121] Zhang, Y. et al. An RNA-sequencing transcriptome and splicing database of glia, neurons, and vascular cells of the cerebral cortex. J. Neurosci. 34, 11929–11947 (2014). source
boosted- Asserted: passes — The authors put it forward as true.
- Checkable: passes — It can be checked against evidence.
- Load-bearing: fails — The paper’s conclusions may not depend on it.
- Based: passes — The paper gives a reason why it holds.
Probably not a substantial claim. The paper’s conclusions may not depend on it. It may state two separate claims as one.
What the paper did — it cites no source for this, so there is none to check. The quote shows it is in the paper.
In the paper
“For all three phases, we used the following method to determine whether candidate pairs of clusters should be merged: a dendrogram based on mean gene expression and UMAP location were used to systemically identify closely related clusters and we then probed for differential gene expression (for example, see Supplementary Fig. 4).”
§ A harmonized atlas of mouse spinal cord cell types and their spatial organization > Methods > Clustering
plaindirect- Asserted: passes — The authors put it forward as true.
- Checkable: passes — It can be checked against evidence.
- Load-bearing: passes — The paper’s conclusions depend on it.
- Based: passes — The paper gives a reason why it holds.
Probably not a substantial claim. It may state two separate claims as one.
What the paper did — it cites no source for this, so there is none to check. The quote shows it is in the paper.
In the paper
“Here, the range of resolutions were examined by (1) the range of average silhouette scores for the clusters, (2) visual inspection of UMAP cluster distribution, and, most importantly (3) comparison of cluster markers with known markers and with known co-expression patterns in the literature. (Supplementary Fig. 4).”
§ A harmonized atlas of mouse spinal cord cell types and their spatial organization > Methods > Clustering
plain- Asserted: passes — The authors put it forward as true.
- Checkable: passes — It can be checked against evidence.
- Load-bearing: passes — The paper’s conclusions depend on it.
- Based: passes — The paper gives a reason why it holds.
Probably not a substantial claim.
A conclusion the paper draws from its own results — it cites no other source for it, so there is none to check. The quote shows it is in the paper.
In the paper
“Most specifically, this analysis is limited in scope to RNA expression in the postnatal mouse spinal cord and reflects a merged study of multiple time points.”
§ A harmonized atlas of mouse spinal cord cell types and their spatial organization > Discussion
plain- Asserted: passes — The authors put it forward as true.
- Checkable: passes — It can be checked against evidence.
- Load-bearing: unclear — It is unclear whether the paper’s conclusions depend on it.
- Based: passes — The paper gives a reason why it holds.
It may state two separate claims as one.
What the paper did — it cites no source for this, so there is none to check. The quote shows it is in the paper.
In the paper
“Annotations from Seurat integration were then overlapped on the integrated UMAP projections obtained from other integration methods and the cell type clusters were compared for reproducibility.”
§ A harmonized atlas of mouse spinal cord cell types and their spatial organization > Methods > Merged analysis and integration
plain- Asserted: passes — The authors put it forward as true.
- Checkable: passes — It can be checked against evidence.
- Load-bearing: passes — The paper’s conclusions depend on it.
- Based: passes — The paper gives a reason why it holds.
Probably not a substantial claim. It may state two separate claims as one.
In the paper
“Ventral neuron cell types may be organized at a second, nested level of spatial trends that overlay embryonic lineage-defined cell types: a Pou6f2-Esrrg trend along the dorsal-ventral axis and a Nfib-Zfhx3/4 and birthdate trends along the medial-lateral axis, consistent with a recent report108.”
§ A harmonized atlas of mouse spinal cord cell types and their spatial organization > Discussion
What the sources say
- Not checked yetcites [108] Osseward, P. J. et al. Conserved genetic signatures parcellate cardinal spinal neuron classes into local and projection subsets. Science 372, 385–393 (2021). source
hedgedcorrelational- Asserted: passes — The authors put it forward as true.
- Checkable: passes — It can be checked against evidence.
- Load-bearing: passes — The paper’s conclusions depend on it.
- Based: passes — The paper gives a reason why it holds.
It may state two separate claims as one.
A conclusion the paper draws from its own results — it cites no other source for it, so there is none to check. The quote shows it is in the paper.
In the paper
“We propose that this reflects some technical limitations but also a fundamental complexity and diversity in how gene expression is controlled within individual cells and in cell-type populations.”
§ A harmonized atlas of mouse spinal cord cell types and their spatial organization > Discussion
plainconditional- Asserted: passes — The authors put it forward as true.
- Checkable: unclear — It is unclear whether it could be checked against evidence.
- Load-bearing: unclear — It is unclear whether the paper’s conclusions depend on it.
- Based: passes — The paper gives a reason why it holds.
It may state two separate claims as one.
What the paper did — it cites no source for this, so there is none to check. The quote shows it is in the paper.
In the paper
“Cell type annotations for the non-neuronal cell types were based on the presence of well-established marker genes (Supplementary Table 1) and on the gene expression patterns in the Allen in situ hybridization database (for meningeal, ependymal, Schwann cell, and peripheral glia clusters).”
§ A harmonized atlas of mouse spinal cord cell types and their spatial organization > Methods > Clustering
boosted- Asserted: passes — The authors put it forward as true.
- Checkable: passes — It can be checked against evidence.
- Load-bearing: passes — The paper’s conclusions depend on it.
- Based: passes — The paper gives a reason why it holds.
Probably not a substantial claim.
None of the sources cited for this claim have been checked yet.
In the paper
“This integration was compared to three independent methods (Harmony25, Conos26, and LIGER27).”
§ A harmonized atlas of mouse spinal cord cell types and their spatial organization > Methods > Merged analysis and integration
What the sources say
- Not checked yetcites [25] Korsunsky, I. et al. Fast, sensitive and accurate integration of single-cell data with Harmony. Nat. Meth 16, 1289–1296 (2019). source
- Not checked yetcites [26] Barkas, N. et al. Joint analysis of heterogeneous single-cell RNA-seq dataset collections. Nat. Meth 16, 695–698 (2019). source
- Not checked yetcites [27] Welch, J. D. et al. Single-cell multi-omic integration compares and contrasts features of brain cell identity. Cell 177, 1873–1887.e17 (2019). source
plain- Asserted: passes — The authors put it forward as true.
- Checkable: passes — It can be checked against evidence.
- Load-bearing: fails — The paper’s conclusions may not depend on it.
- Based: passes — The paper gives a reason why it holds.
Probably not a substantial claim. The paper’s conclusions may not depend on it.
In the paper
“A comparative analysis of automated classification approaches across diverse datasets found that SVM and neural network models showed the best performance on the Allen Brain Atlas dataset of 92 neuronal cell types–a dataset similar in scale and complexity to the harmonized analysis here125.”
§ A harmonized atlas of mouse spinal cord cell types and their spatial organization > Discussion
What the sources say
- Not checked yetcites [125] Abdelaal, T. et al. A comparison of automatic cell identification methods for single-cell RNA sequencing data. Genome Biol. 20, 194–19 (2019). source
plaincorrelational- Asserted: passes — The authors put it forward as true.
- Checkable: passes — It can be checked against evidence.
- Load-bearing: fails — The paper’s conclusions may not depend on it.
- Based: passes — The paper gives a reason why it holds.
Probably not a substantial claim. The paper’s conclusions may not depend on it.
A conclusion the paper draws from its own results — it cites no other source for it, so there is none to check. The quote shows it is in the paper.
In the paper
“This may reflect a training dataset that is not large enough to train a model that distinguishes closely related cell types, that small clusters are not modeled as well, and that some mid/ventral clusters are defined partly by early postnatal gene expression contained within the harmonized analysis but absent from the independent adult dataset.”
§ A harmonized atlas of mouse spinal cord cell types and their spatial organization > Results > Using machine learning to classify spinal cord cell types
hedgedconditional- Asserted: passes — The authors put it forward as true.
- Checkable: passes — It can be checked against evidence.
- Load-bearing: unclear — It is unclear whether the paper’s conclusions depend on it.
- Based: passes — The paper gives a reason why it holds.
It may state two separate claims as one.
- Rests on an assumption: There is no existing gold standard for spinal cord cell identities.
- Rests on an assumption: The harmonized analysis cell type labels are adequate as training labels for machine learning classifiers.
What the paper did — it cites no source for this, so there is none to check. The quote shows it is in the paper.
In the paper
“Raw datasets were used instead of investigator-provided count matrices so that we could align all sequences to the same genome and apply uniform data filtering.”
§ A harmonized atlas of mouse spinal cord cell types and their spatial organization > Methods > Published data acquisition
plaindirect- Asserted: passes — The authors put it forward as true.
- Checkable: passes — It can be checked against evidence.
- Load-bearing: passes — The paper’s conclusions depend on it.
- Based: passes — The paper gives a reason why it holds.
Probably not a substantial claim.
In the paper
“We had previously noted differences in the robustness of dorsal and ventral cell type clusters1 and a similar trend of overlapping ventral cell types was observed in the neonatal spinal cord4.”
§ A harmonized atlas of mouse spinal cord cell types and their spatial organization > Discussion
What the sources say
- Not checked yetcites [1] Sathyamurthy, A. et al. Massively parallel single nucleus transcriptional profiling defines spinal cord neurons and their activity during behavior. Cell Rep. 22, 2216–2225 (2018). source
plain- Asserted: passes — The authors put it forward as true.
- Checkable: passes — It can be checked against evidence.
- Load-bearing: fails — The paper’s conclusions may not depend on it.
- Based: passes — The paper gives a reason why it holds.
Probably not a substantial claim. The paper’s conclusions may not depend on it.
What the paper did — it cites no source for this, so there is none to check. The quote shows it is in the paper.
In the paper
“For all three phases, each cluster was analyzed for candidate marker genes and excluded if the cluster met either of the following criteria. Clusters were considered low-quality if they had fewer than three significant markers relevant to cell type, particularly if they showed very low nGene. Clusters were considered doublets if they had significant markers for multiple unrelated cell types and a”
§ A harmonized atlas of mouse spinal cord cell types and their spatial organization > Methods > Clustering
plain- Asserted: passes — The authors put it forward as true.
- Checkable: passes — It can be checked against evidence.
- Load-bearing: passes — The paper’s conclusions depend on it.
- Based: passes — The paper gives a reason why it holds.
Probably not a substantial claim.
A conclusion the paper draws from its own results — it cites no other source for it, so there is none to check. The quote shows it is in the paper.
In the paper
“Finally, it is crucial to note that single-cell/nucleus profiling, particularly single-cell/nucleus RNA sequencing, produces one perspective on cell types and it is not yet clear how this will relate to other core cellular features such as circuit connectivity, electrophysiology, and behavioral function.”
§ A harmonized atlas of mouse spinal cord cell types and their spatial organization > Discussion
plain- Asserted: passes — The authors put it forward as true.
- Checkable: fails — It may be too vague to check against evidence.
- Load-bearing: fails — The paper’s conclusions may not depend on it.
- Based: fails — The paper may give no reason why it holds.
Probably not a substantial claim. It may be too vague to check against evidence. The paper’s conclusions may not depend on it. The paper may give no reason why it holds. It may state two separate claims as one.
In the paper
“We had previously noted differences in the robustness of dorsal and ventral cell type clusters1 and a similar trend of overlapping ventral cell types was observed in the neonatal spinal cord4.”
§ A harmonized atlas of mouse spinal cord cell types and their spatial organization > Discussion
What the sources say
- Not checked yetcites [4] Rosenberg, A. B. et al. Single-cell profiling of the developing mouse brain and spinal cord with split-pool barcoding. Science 360, 176–182 (2018). source
plain- Asserted: passes — The authors put it forward as true.
- Checkable: passes — It can be checked against evidence.
- Load-bearing: fails — The paper’s conclusions may not depend on it.
- Based: passes — The paper gives a reason why it holds.
Probably not a substantial claim. The paper’s conclusions may not depend on it.
A conclusion the paper draws from its own results — it cites no other source for it, so there is none to check. The quote shows it is in the paper.
In the paper
“suggesting that the overtrained model will perform better on unseen data.”
§ A harmonized atlas of mouse spinal cord cell types and their spatial organization > Methods > Computational classification
hedgeddirect- Asserted: passes — The authors put it forward as true.
- Checkable: passes — It can be checked against evidence.
- Load-bearing: fails — The paper’s conclusions may not depend on it.
- Based: fails — The paper may give no reason why it holds.
Probably not a substantial claim. The paper’s conclusions may not depend on it. The paper may give no reason why it holds.
What the paper did — it cites no source for this, so there is none to check. The quote shows it is in the paper.
In the paper
“For both coarse cell types and clean neurons, 10% of cells were withheld as the query dataset, whilst the remaining were used as the reference dataset.”
§ A harmonized atlas of mouse spinal cord cell types and their spatial organization > Methods > Computational classification
plain- Asserted: passes — The authors put it forward as true.
- Checkable: passes — It can be checked against evidence.
- Load-bearing: fails — The paper’s conclusions may not depend on it.
- Based: passes — The paper gives a reason why it holds.
Probably not a substantial claim. The paper’s conclusions may not depend on it.
The paper relies on this without support.
There is no existing gold standard for spinal cord cell identities.
“because there is no existing gold standard for spinal cord cell identities”
The paper relies on this without support.
The harmonized analysis cell type labels are adequate as training labels for machine learning classifiers.
“each of these models were trained using cell type labels from the harmonized analysis”
The paper relies on this without support.
Perfect performance would require perfect and invariable biological data: discrete cell types that express completely distinct patterns of gene expression and experimental data without natural heterogeneity, doublets, low-quality cells, or other sources of indeterminate data.
“Perfect performance would require perfect and invariable biological data: discrete cell types that express completely distinct patterns of gene expression and experimental data without natural heterogeneity, doublets, low-quality cells, or other sources of indeterminate data.”
The paper relies on this without support.
Developmental lineage is a powerful and influential framework for categorizing spinal neurons.
“Developmental lineage has been a powerful and influential framework for categorizing spinal neurons, particularly within the ventral horn, and relies on the combinatorial expression code of transcription factors that specify distinct progenitor domains along the dorsal-ventral axis of the spinal cord.”
The paper relies on this without support.
There is no commonly accepted standard set of spinal cord cell types.
“In the absence of a commonly accepted standard set of spinal cord cell types, it is impossible to answer this question completely.”
The paper relies on this without support.
The rate of false-negative data in each cell and the requirement for statistical power necessitates analyzing many cells of each type and considering population-level shared patterns.
“Data is captured from thousands of individual cells, but the rate of false-negative data in each cell and the requirement for statistical power necessitates analyzing many cells of each type and considering population-level shared patterns.”
Claims other papers make about this one
Each is checked against this paper’s own text: does it say what the citing paper says it does?
In the citing paper
“Our taxonomy recapitulated the known hierarchical organization of neuronal subpopulations in the spinal cord9,12,31–33 (Extended Data Fig. 4a–g).”
From The neurons that restore walking after paralysis (2022) · cites this paper as [33]
Self-check
Percentages, sums and reported differences re-computed from the paper’s own numbers.
Each contradiction between two passages listed here was confirmed by an independent check.
Rated minor: it would not touch a result — a value no result rests on, a p-value that stays on the same side of the significance level, or a conflict that is clerical, resolved elsewhere in the paper, or outside its own findings.
In the paper
§ A harmonized atlas of mouse spinal cord cell types and their spatial organization > Results > Using machine learning to classify spinal cord cell types
“we still sought to determine a benchmark performance guide for the classification of adult mouse spinal cord neurons using neural network models and considered four metrics of cluster definition and separation.”
§ A harmonized atlas of mouse spinal cord cell types and their spatial organization > Results > Using machine learning to classify spinal cord cell types
“We examined the relationship between the model performance for each cluster (F1 score) and (1) the co-clustering frequency of each cell type across 100 clustering iterations, (2) how distant each cluster was from its nearest neighbor in principal component space, and (3) the confidence with which clusters could be distinguished based on in situ marker expression”
Citations
Cites
Comprehensive Integration of Single-Cell Data
Stuart, T., Butler, A., Hoffman, P., Hafemeister, C., Papalexi, E., Mauck, W. M., Hao, Y., Stoeckius, M., Smibert, P., & Satija, R. (2019) · Cell · doi:10.1016/j.cell.2019.05.031 · Cited by 15,453
Integrating single-cell transcriptomic data across different conditions, technologies, and species
Butler, A., Hoffman, P., Smibert, P., Papalexi, E., & Satija, R. (2018) · Nature Biotechnology · doi:10.1038/nbt.4096 · Cited by 13,174
Fast, sensitive and accurate integration of single-cell data with Harmony
Korsunsky, I., Millard, N., Fan, J., Slowikowski, K., Zhang, F., Wei, K., Baglaenko, Y., Brenner, M., Loh, P.-R., & Raychaudhuri, S. (2019) · Nature Methods · doi:10.1038/s41592-019-0619-0 · Cited by 10,488
Genome-wide atlas of gene expression in the adult mouse brain
Lein, E. S., Hawrylycz, M. J., Ao, N., Ayres, M., Bensinger, A., Bernard, A., Boe, A. F., Boguski, M. S., Brockway, K. S., Byrnes, E. J., et al. (2007) · Nature · doi:10.1038/nature05453 · Cited by 5,572
Zhang, Y., Chen, K., Sloan, S. A., Bennett, M. L., Scholze, A. R., O'Keeffe, S., Phatnani, H. P., Guarnieri, P., Caneda, C., Ruderisch, N., et al. (2014) · The Journal of Neuroscience · doi:10.1523/jneurosci.1860-14.2014 · Cited by 4,875
Central sensitization: implications for the diagnosis and treatment of pain
Woolf, C. J. (2011) · Pain · doi:10.1016/j.pain.2010.09.030 · Cited by 4,771
Molecular Architecture of the Mouse Nervous System
Zeisel, A., Hochgerner, H., Lönnerberg, P., Johnsson, A., Memic, F., van der Zwan, J., Häring, M., Braun, E., Borm, L. E., La Manno, G., et al. (2018) · Cell · doi:10.1016/j.cell.2018.06.021 · Cited by 2,552
Deep generative modeling for single-cell transcriptomics
Lopez, R., Regier, J., Cole, M. B., Jordan, M. I., & Yosef, N. (2018) · Nature Methods · doi:10.1038/s41592-018-0229-2 · Cited by 2,530
A gene expression atlas of the central nervous system based on bacterial artificial chromosomes
Gong, S., Zheng, C., Doughty, M. L., Losos, K., Didkovsky, N., Schambra, U. B., Nowak, N. J., Joyner, A., Leblanc, G., Hatten, M. E., et al. (2003) · Nature · doi:10.1038/nature02033 · Cited by 2,108
Central sensitization and LTP: do pain and memory share similar mechanisms?
Ji, R., Kohno, T., Moore, K. A., & Woolf, C. J. (2003) · Trends in Neurosciences · doi:10.1016/j.tins.2003.09.017 · Cited by 1,462
Research works printed but not linked: 2
- Blum, J. A. et al. Single-cell transcriptomic analysis of the adult mouse spinal cord reveals molecular diversity of autonomic and skeletal motor neurons. Nat. Neurosci. 24, 572–583 (2021). · DOI · Paper page
- Dubreuil, A., Valente, A., Beiran, M., Mastrogiuseppe, F. & Ostojic, S. Complementary roles of dimensionality and population structure in neural computations. bioRxiv https://www.biorxiv.org/content/10.1101/2020.07.03.185942v1.full?%3Fcollection= (2020). · DOI
Cited by
Sorted by citations
What is a cell type and how to define it?
Zeng, H. (2022) · Cell · doi:10.1016/j.cell.2022.06.031 · Cited by 439
The neurons that restore walking after paralysis
Kathe, C., Skinnider, M. A., Hutson, T. H., Regazzi, N., Gautier, M., Demesmaeker, R., Komi, S., Ceto, S., James, N. D., Cho, N., et al. (2022) · Nature · doi:10.1038/s41586-022-05385-7 · Cited by 304
Self-citationHarmonized cross-species cell atlases of trigeminal and dorsal root ganglia
Bhuiyan, S. A., Xu, M., Yang, L., Semizoglou, E., Bhatia, P., Pantaleo, K. I., Tochitsky, I., Jain, A., Erdoğan, B., Blair, S. J., et al. (2024) · Science Advances · doi:10.1126/sciadv.adj9173 · Cited by 260
A cellular taxonomy of the adult human spinal cord
Yadav, A., Matson, K. J. E., Li, L., Hua, I., Petrescu, J., Kang, K., Alkaslasi, M. R., Lee, D. I., Hasan, S., Galuta, A., et al. (2023) · Neuron · doi:10.1016/j.neuron.2023.01.007 · Cited by 220
Self-citationFerroptosis promotes T-cell activation-induced neurodegeneration in multiple sclerosis
Luoqian, J., Yang, W., Ding, X., Tuo, Q., Xiang, Z., Zheng, Z., Guo, Y., Li, L., Guan, P., Ayton, S., et al. (2022) · Cellular and Molecular Immunology · doi:10.1038/s41423-022-00883-0 · Cited by 189
Self-citation
Metadata
- Authors
- Russ, D. E., Cross, R. B. P., Li, L., Koch, S. C., Matson, K. J. E., Yadav, A., Alkaslasi, M. R., Lee, D. I., Le Pichon, C. E., Menon, V., & Levine, A. J.
- Affiliations
- National Institutes of Health (US)
- University College London (GB)
- Columbia University Irving Medical Center (US)
- Corresponding author
- Levine, Ariel J.
- ORCID
- Venue
- Nature Communications
- Published
- 2021-09-29
- Volume
- 12
- Issue
- 1
- Pages
- 5722-5722
- ISSN
- 2041-1723 (ISSN-L)
- PMC
- PMC8481483
- OpenAlex
- W3203053031
- Semantic Scholar
- 03161499e050a7dd458ea04c9067a30865a793fa
- Cited by
- 255
- References
- 131
- Citations by year
- 2026: 53 · 2025: 49 · 2024: 65 · 2023: 57 · 2022: 30 · 2021: 1
- FWCI
- 12.48
- Type
- journal article
- Language
- en
- Update notices
- Open access
- gold
- doi.org
- Locations
- Nature Communications (publishedVersion, cc-by)
- PubMed Central (publishedVersion, cc-by)
- PubMed (publishedVersion)
- RePEc: Research Papers in Economics (submittedVersion)
- DOAJ (DOAJ: Directory of Open Access Journals) (submittedVersion, cc-by-sa)
- UCL Discovery (University College London) (submittedVersion)
- Funders
- U.S. Department of Health & Human Services | NIH | National Institute of Neurological Disorders and Stroke (1ZIA NS003153)
- Topics
- Life Sciences › Biochemistry, Genetics and Molecular Biology › Molecular Biology › Single-cell and spatial transcriptomics
- Life Sciences › Biochemistry, Genetics and Molecular Biology › Molecular Biology › Developmental Biology and Gene Regulation
- Life Sciences › Biochemistry, Genetics and Molecular Biology › Biophysics › Cell Image Analysis Techniques
- Keywords
- mouse spinal cord, cell type atlas, single-cell transcriptomics, cell type classification, neurotransmitter identity, gene expression signatures
- MeSH terms
- RNA-Seq, Animals, Atlases as Topic, Cell Nucleus, Neurons, Spinal Cord, Mice, Single-Cell Analysis, Transcriptome, Spatial Analysis, Datasets as Topic
About these checks
Registry, retraction, Cites and statistics results are computed, not judged, with one exception: a printed reference that no index lists is read once by a model before it counts as a citation error. Claims are extracted by a model and kept only when their quote appears verbatim in the text; each cited source is then checked, with a model’s help, for whether it says what the claim relies on. Those verdicts can be wrong — read the claim’s quote and the cited source before relying on one.
A language model drew the claims from the paper on 2026-10-08, under version 3 of the claim definition (model deepseek-v4.1-flash, prompt extract-v3).
A second model labelled each claim on 2026-10-08 (model jev-1.13-20260917, definition revision gold-guideline-v0.2).
Cited sources are checked with a language model’s help (gpt-6-sol).
Statistics and arithmetic are recomputed, not judged.
Confidence bands are shown only for fields calibrated on our annotated test set. None is calibrated yet, so no band is shown.
What counts as a claim ›How we measure confidence ›How we check this ›
Are you an author, or do you see a problem with this page? Request a review
