

The DOI matches its Crossref record; 194 of the 194 references it cites were found in a registry or an index; 42 of the 154 sources its claims cite were checked for support.
BACE1: More than just a β‐secretase
Open accessAbstract
Summary: β‐site amyloid precursor protein cleaving enzyme‐1 (BACE1) research has historically focused on its actions as the β‐secretase responsible for the production of β‐amyloid beta, observed in Alzheimer's disease. Although the greatest expression of BACE1 is found in the brain, BACE1 mRNA and protein is also found in many cell types including pancreatic β‐cells, adipocytes, hepatocytes, and vascular cells. Pathologically elevated BACE1 expression in these cells has been implicated in the development of metabolic diseases, including type 2 diabetes, obesity, and cardiovascular disease. In this review, we examine key questions surrounding the BACE1 literature, including how is BACE1 regulated and how dysregulation may occur in disease, and understand how BACE1 regulates metabolism via cleavage of a myriad of substrates. The phenotype of the BACE1 knockout mice models, including reduced weight gain, increased energy expenditure, and enhanced leptin signaling, proposes a physiological role of BACE1 in regulating energy metabolism and homeostasis. Taken together with the weight loss observed with BACE1 inhibitors in clinical trials, these data highlight a novel role for BACE1 in regulation of metabolic physiology. Finally, this review aims to examine the possibility that BACE1 inhibitors could provide a innovative treatment for obesity and its comorbidities.
Overview
AI snapshot
Written from the paper’s full text.
TL;DR
BACE1 is best known as the β-secretase producing Aβ in Alzheimer’s disease, but this review argues it also has broad non-neuronal metabolic roles via cleavage of many substrates in insulin, leptin, adipose, vascular, and immune pathways. It proposes that existing BACE1 inhibitors, despite failing in AD trials, might be repurposed for obesity and cardiometabolic disease because weight loss was observed as a side effect.
Key findings
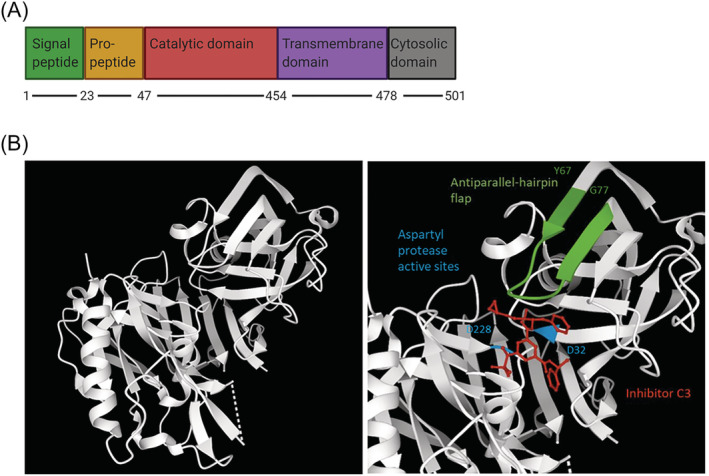
- BACE1 is a 501-amino-acid type 1 membrane aspartyl protease with five domains, active at optimal pH 4.5, and has nearly 70 identified substrates beyond APP; many are associated with non-neuronal functions including insulin signaling, inflammation, cardiovascular function, and glucose homeostasis.
- BACE1 knockout/inhibition phenotypes include reduced weight gain, increased energy expenditure, enhanced leptin signaling, and no change in daily food intake, suggesting weight effects occur through energy expenditure; BACE1 knock-in mice display AD-like pathology and systemic diabetes.
- In clinical trials, Verubecestat reduced cerebrospinal fluid Aβ levels by 63%–81% but did not improve cognition and caused adverse effects including weight loss and decreased appetite; Lanabecestat produced mean weight loss of −1.9 kg in the 50-mg group versus 0 with placebo, with more individuals losing at least 7% weight than placebo.
- The review links BACE1 to T2D and obesity via insulin receptor cleavage, Aβ-mediated insulin resistance, leptin resistance, BAT differentiation through the Dicer1/miR-328/BACE1 axis, and vascular/immune mechanisms; T2D sufferers have a 50% increased risk of developing AD.
Methods
- Narrative review synthesizing published literature on BACE1 structure, substrates, transcriptional/translational/post-translational regulation, metabolic physiology, disease associations, and therapeutic inhibition.
- Includes a table of confirmed non-neuronal BACE1 substrates and their experimental evidence, plus figures on BACE1 structure, isoforms, post-translational modifications, insulin/leptin pathways, BAT commitment, and vasculature.
- Discusses preclinical models (BACE1 knockout/knock-in, diet-induced obese mice, cell culture, zebrafish) and clinical trial data for BACE1 inhibitors including Verubecestat and Lanabecestat.
Limitations
- The authors state that the mechanisms linking BACE1 to leptin resistance are unclear, that BACE1-mediated proteolysis of the leptin receptor is yet to be determined, and that many areas require further investigation.
- The authors note contradictory findings, including that both Aβ and BACE1 inhibitors can inhibit angiogenesis in tumor models, and that plasma Aβ lacks consensus as an AD biomarker.
- Evident from the text: this is a narrative review without a stated systematic search strategy, and many conclusions rely on preclinical models or associative human data; the authors also note that identified BACE1 substrates are primarily neurological, possibly reflecting experimental design rather than true biological distribution.
Model-written summary. Check it against the paper before relying on it.
Integrity signals
Registry
Cites
Statistics
Figures
Verification
Claims the paper makes
47 Not checked yet · 31 Own interpretation · 18 No full text of the sources · 14 Partly supported · 13 Supported · 3 Not supported · 2 Supported so far · 2 Sources not found · 1 Mixed support · accuracy not yet measured
At least one cited source doesn’t support this claim or points to a different paper, and none confirmed it — see the verdicts below.
In the paper
“Some of the observed phenotypes, such as impaired axon guidance, are more severe when BACE1 is deficient in the developmental stages.”
§ BACE1: More than just a β‐secretase > CONSEQUENCES OF CHANGES IN BACE1 EXPRESSION AND ACTIVITY
What the sources say
- Disputedcites [43] Ou‐Yang MH, Kurz JE, Nomura T, et al. Axonal organization defects in the hippocampus of adult conditional BACE1 knockout mice. Sci Transl Med. 2018; 10(459): eaao5620. 30232227 PMC11017370 sourceExperimental — accuracy not yet measured
The Introduction (page not available) says that, unlike several other neurological phenotypes, hippocampal axonal disorganization showed no reduction in severity when BACE1 was deleted in adulthood. The Discussion likewise reports axonal disorganization after adult deletion. Thus, the paper does not support impaired axon guidance as an example of a phenotype more severe with developmental BACE1 deficiency. (LLM, conf=0.90)
Checked by a reasoning model — may be wrong.
plaincorrelational- Asserted: passes — The authors put it forward as true.
- Checkable: passes — It can be checked against evidence.
- Load-bearing: unclear — It is unclear whether the paper’s conclusions depend on it.
- Based: passes — The paper gives a reason why it holds.
- Disputed
At least one cited source doesn’t support this claim or points to a different paper, and none confirmed it — see the verdicts below.
In the paper
“In addition to regulation by transcription factors, BACE1 gene expression is positively regulated at the transcriptional level by the BACE1 antisense transcript (BACE1‐AS).”
§ BACE1: More than just a β‐secretase > REGULATION OF BACE1 AT THE TRANSCRIPTIONAL, TRANSLATIONAL, AND POST‐TRANSLATIONAL LEVEL
What the sources say
- Disputedcites [55] Faghihi MA, Modarresi F, Khalil AM, et al. Expression of a noncoding RNA is elevated in Alzheimer's disease and drives rapid feed‐forward regulation of beta‐secretase. Nat Med. 2008; 14(7): 723‐ 730. 18587408 PMC2826895 sourceExperimental — accuracy not yet measured
The Results show that BACE1-AS increases BACE1 mRNA stability, supporting positive regulation but not regulation at the transcriptional level. The Abstract explicitly describes the mechanism as post-transcriptional, contrary to the citing sentence. (LLM, conf=0.90)
Checked by a reasoning model — may be wrong.
plaindirect- Asserted: passes — The authors put it forward as true.
- Checkable: passes — It can be checked against evidence.
- Load-bearing: unclear — It is unclear whether the paper’s conclusions depend on it.
- Based: passes — The paper gives a reason why it holds.
- Disputed
Some cited sources support this claim and some don’t — read each source’s verdict below.
In the paper
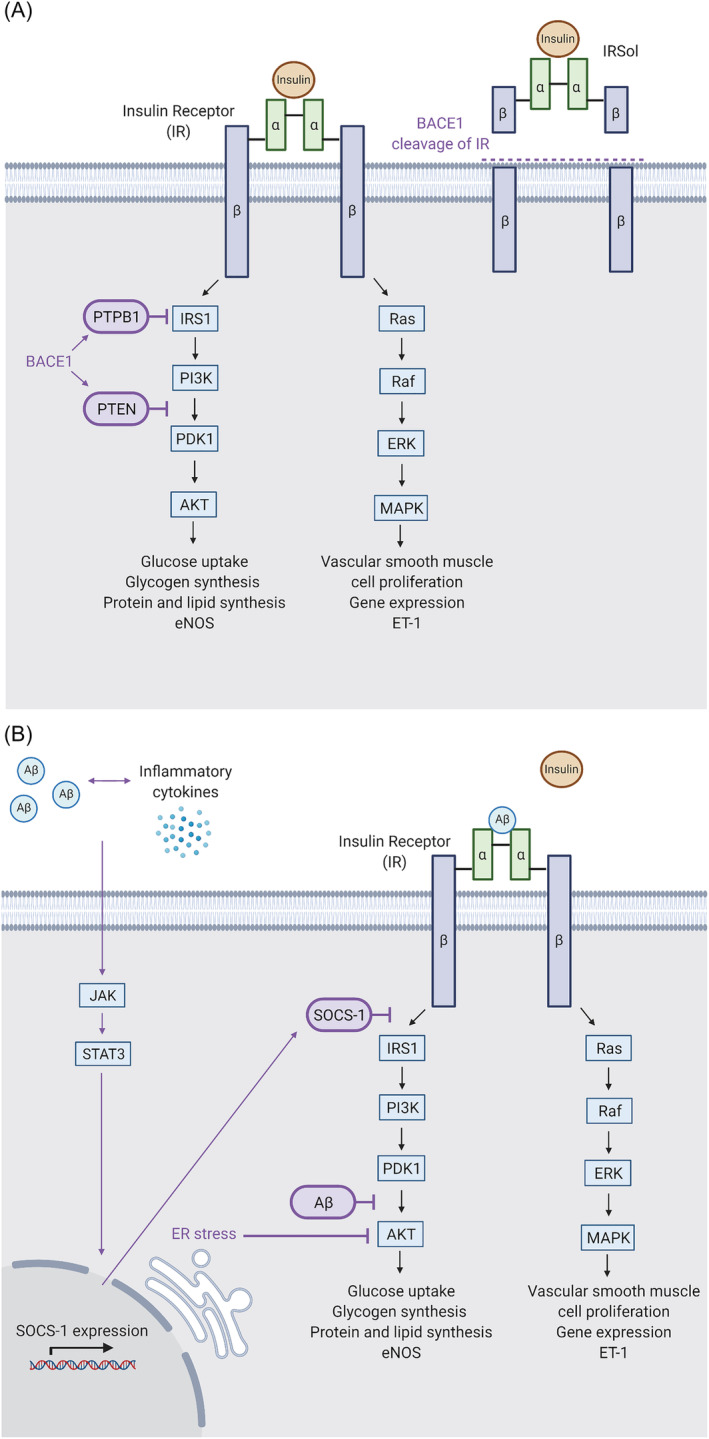
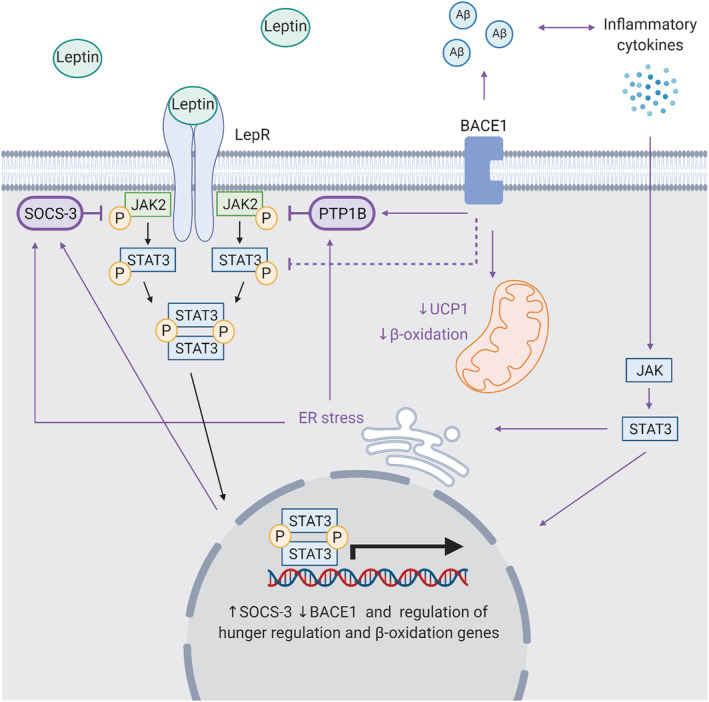
“The influence of BACE1 on insulin signaling is in part through negative regulators PTEN and PTP1B, which are found to decrease in response to BACE1 inhibition.”
§ BACE1: More than just a β‐secretase > BACE1 REGULATION OF INSULIN PATHWAYS
What the sources say
- Partly supportedcites [18] Meakin PJ, Mezzapesa A, Benabou E, et al. The beta secretase BACE1 regulates the expression of insulin receptor in the liver. Nat Commun. 2018; 9: 14. 29610518 PMC5880807 sourceExperimental — accuracy not yet measured
The Results and Discussion (pages unavailable in our copy) report reduced PTEN in BACE1−/− mouse livers and suggest that it contributes to enhanced insulin signaling. They do not report a decrease in PTP1B, and the PTEN finding concerns BACE1 deficiency rather than a measured response to inhibitor treatment. (LLM, conf=0.88)
- Disputedcites [19] Meakin PJ, Jalicy SM, Montagut G, et al. Bace1‐dependent amyloid processing regulates hypothalamic leptin sensitivity in obese mice. Sci Rep. 2018; 8(1): 1‐ 16. 29311632 PMC5758523 sourceExperimental — accuracy not yet measured
The Results section on reversal of hypothalamic leptin resistance reports that the BACE1 inhibitor M-3 had no effect on PTP1B protein levels in diet-induced obese mice, contrary to the claimed decrease with inhibition. A separate Results section reports lower PTP1B in Bace1 knockout mice, but the paper discusses this in relation to leptin signaling; our copy does not identify PTEN as part of an insulin-signaling mechanism. (LLM, conf=0.86)
Checked by a reasoning model — may be wrong.
plaindirect- Asserted: passes — The authors put it forward as true.
- Checkable: passes — It can be checked against evidence.
- Load-bearing: passes — The paper’s conclusions depend on it.
- Based: passes — The paper gives a reason why it holds.
- Partly supported
The cited sources support only part of this claim — read each source’s verdict below.
In the paper
“Through these additional substrates, BACE1 has been implicated in inflammation, cardiovascular function, glucose homeostasis, and insulin signaling”
§ BACE1: More than just a β‐secretase > NON‐NEURONAL BACE1 SUBSTRATES
What the sources say
- Partly supportedcites [18] Meakin PJ, Mezzapesa A, Benabou E, et al. The beta secretase BACE1 regulates the expression of insulin receptor in the liver. Nat Commun. 2018; 9: 14. 29610518 PMC5880807 sourceExperimental — accuracy not yet measured
The Introduction implicates BACE1 in glucose homeostasis and insulin signaling, and the Discussion identifies the insulin receptor as a BACE1 substrate. Our copy does not establish the claimed links to inflammation or cardiovascular function through additional BACE1 substrates; the passages have no page numbers. (LLM, conf=0.88)
- Partly supportedcites [34] Plucińska K, Dekeryte R, Koss D, et al. Neuronal human BACE1 knockin induces systemic diabetes in mice. Diabetologia. 2016; 59(7): 1513‐ 1523. 27138913 PMC4901117 sourceExperimental — accuracy not yet measured
The Introduction says BACE1 has substrates other than APP and reports brain inflammation in mice; the Results link neuronal BACE1 expression to glucose intolerance and altered insulin-related signalling. The paper does not establish that these effects occur through the additional substrates, and the passages do not implicate BACE1 in cardiovascular function. (LLM, conf=0.85)
- Could not verifycites [35] Moore KJ, El Khoury J, Medeiros LA, et al. A CD36‐initiated signaling cascade mediates inflammatory effects of beta‐amyloid. J Biol Chem. 2002; 277(49): 47373‐ 47379. 12239221 sourceExperimental — accuracy not yet measured
The Abstract describes β-amyloid triggering CD36-dependent inflammatory signaling, and a separate passage discusses CD36 in atherosclerosis. Searches for BACE1, its additional substrates, glucose homeostasis, and insulin signaling found no passage connecting BACE1 to the claimed functions. The cited paper therefore does not address the claim as attributed. (LLM, conf=0.76)
- Not checked — no full text of the sourcecites [36] Carrano A, Hoozemans JJM, van der Vies SM, Rozemuller AJM, van Horssen J, de Vries HE. Amyloid beta induces oxidative stress‐mediated blood‐brain barrier changes in capillary amyloid angiopathy. Antioxid Redox Signal. 2011; 15(5): 1167‐ 1178. 21294650 source
- Not checked — no full text of the sourcecites [37] Iadecola C, Zhang FY, Niwa K, et al. SOD1 rescues cerebral endothelial dysfunction in mice overexpressing amyloid precursor protein. Nat Neurosci. 1999; 2(2): 157‐ 161. 10195200 source
- Not checked — no full text of the sourcecites [38] Greco S, Zaccagnini G, Fuschi P, et al. Increased BACE1‐AS long noncoding RNA and β‐amyloid levels in heart failure. Cardiovasc Res. 2017; 113(5): 453‐ 463. 28158647 source
plaincorrelational- Asserted: passes — The authors put it forward as true.
- Checkable: passes — It can be checked against evidence.
- Load-bearing: passes — The paper’s conclusions depend on it.
- Based: passes — The paper gives a reason why it holds.
- Partly supported
The cited sources support only part of this claim — read each source’s verdict below.
In the paper
“In addition to its neuronal roles, changes in BACE1 activity have been associated with physiological functions including maintenance of the blood–brain barrier (BBB), angiogenesis, protection against obesity, immune and antimicrobial properties, inflammatory response, and tumor suppression.”
§ BACE1: More than just a β‐secretase > CONSEQUENCES OF CHANGES IN BACE1 EXPRESSION AND ACTIVITY
What the sources say
- Partly supportedcites [44] Botteri G, Salvadó L, Gumà A, et al. The BACE1 product sAPPβ induces ER stress and inflammation and impairs insulin signaling. Metabolism. 2018; 85: 59‐ 75. 29526536 sourceExperimental — accuracy not yet measured
The Discussion (p. 18) links increased BACE1 levels to inflammation in skeletal muscle cells. The Introduction (p. 5) reports protection against high-fat-diet-induced glucose intolerance in BACE1-deficient mice, not protection against obesity. The cited passages do not support the other listed functions: blood–brain barrier maintenance, angiogenesis, immune or antimicrobial properties, or tumor suppression. (LLM, conf=0.89)
- Not checked — no full text of the sourcecites [45] Devraj K, Poznanovic S, Spahn C, et al. BACE‐1 is expressed in the blood‐brain barrier endothelium and is upregulated in a murine model of Alzheimer's disease. J Cereb Blood Flow Metab. 2016; 36(7): 1281‐ 1294. 26661166 PMC4929696 source
- Partly supportedcites [46] Durrant CS, Ruscher K, Sheppard O, Coleman MP, Ozen I. Beta secretase 1‐dependent amyloid precursor protein processing promotes excessive vascular sprouting through NOTCH3 signalling. Cell Death Dis. 2020; 11(2): 15. 32029735 PMC7005019 sourceExperimental — accuracy not yet measured
The Results and Discussion (page unavailable) link BACE1 inhibition to changes in angiogenesis, and the Discussion reports that BACE1 inhibitors have been shown to inhibit tumour growth. The paper does not establish that changes in BACE1 activity maintain the blood–brain barrier, protect against obesity, or confer immune, antimicrobial, or inflammatory functions. (LLM, conf=0.88)
- Not checked — no full text of the sourcecites [47] Yaghoobi H, Azizi H, Banitalebi‐Dehkordi M, et al. Beta‐secretase 1 (BACE1) is down‐regulated in invasive ductal carcinoma of breast. Rep Biochem Mol Biol. 2019; 8(2): 200‐ 207. 31832446 PMC6844613
plaincorrelational- Asserted: passes — The authors put it forward as true.
- Checkable: passes — It can be checked against evidence.
- Load-bearing: passes — The paper’s conclusions depend on it.
- Based: passes — The paper gives a reason why it holds.
- Partly supported
Every source the paper cites for this claim was checked and supports it.
In the paper
“BACE1 cleavage of NRG1 regulates myelination,”
§ BACE1: More than just a β‐secretase > ESTABLISHED BACE1 SUBSTRATES AND FUNCTIONS
What the sources say
- Supportedcites [26] Fleck D, van Bebber F, Colombo A, et al. Dual cleavage of neuregulin 1 type III by BACE1 and ADAM17 liberates its EGF‐like domain and allows paracrine signaling. J Neurosci. 2013; 33(18): 7856‐ 7869. 23637177 PMC6618983 source
The Discussion states that BACE1-mediated shedding of NRG1 type III promotes peripheral nervous system myelination. It also describes partial rescue of the myelination defect in BACE1-deficient zebrafish by a soluble NRG1 domain. (LLM, conf=0.93)
- Supportedcites [27] Hu X, Hou H, Bastian C, et al. BACE1 regulates the proliferation and cellular functions of Schwann cells. Glia. 2017; 65(5): 712‐ 726. 28191691 PMC5357169 source
The Introduction states that hypomyelination in BACE1-null mice is partially attributed to loss of BACE1-mediated Nrg1 cleavage. The Discussion says BACE1 cleaves axonal Nrg1 and that this cleavage is important for myelination. No page numbers are provided in the supplied passages. (LLM, conf=0.94)
plaindirect- Asserted: passes — The authors put it forward as true.
- Checkable: passes — It can be checked against evidence.
- Load-bearing: unclear — It is unclear whether the paper’s conclusions depend on it.
- Based: passes — The paper gives a reason why it holds.
- Supported
The cited sources support only part of this claim — read each source’s verdict below.
In the paper
“and increased BACE1 cleavage of NRG1 has been implicated in the development of schizophrenia.”
§ BACE1: More than just a β‐secretase > ESTABLISHED BACE1 SUBSTRATES AND FUNCTIONS
What the sources say
- Partly supportedcites [28] Zhang Z, Huang J, Shen Y, Li R. BACE1‐dependent neuregulin‐1 signaling: an implication for schizophrenia. Front Mol Neurosci. 2017; 10: 302. 28993723 PMC5622153 sourceExperimental — accuracy not yet measured
The ‘NRG1 Proteolysis in Schizophrenia’ section reports an increased ratio of an NRG1 cleavage fragment to full-length NRG1 in one brain region of postmortem schizophrenia cases. It does not establish that BACE1 cleavage itself increased or that the increase contributed to the development of schizophrenia; the authors say BACE1-specific cleavage activity remains to be studied. No page number is available in our copy. (LLM, conf=0.84)
hedgedcorrelational- Asserted: passes — The authors put it forward as true.
- Checkable: passes — It can be checked against evidence.
- Load-bearing: unclear — It is unclear whether the paper’s conclusions depend on it.
- Based: passes — The paper gives a reason why it holds.
- Partly supported
Every source the paper cites for this claim was checked and supports it.
In the paper
“Substrates SEZ6, L1CAM, leucine rich repeat neuronal 1 (LRRN1), neurotrimin, and CHL1 are all involved in neurite outgrowth.”
§ BACE1: More than just a β‐secretase > ESTABLISHED BACE1 SUBSTRATES AND FUNCTIONS
What the sources say
- Supportedcites [23] Kuhn PH, Koroniak K, Hogl S, et al. Secretome protein enrichment identifies physiological BACE1 protease substrates in neurons. EMBO J. 2012; 31(14): 3157‐ 3168. 22728825 PMC3400020 source
The passage labeled “Isolation of primary neurons” explicitly lists SEZ6, L1, LRRN1, neurotrimin, and CHL1 among proteins implicated in neurite outgrowth. The citing sentence paraphrases that statement, using L1CAM for L1. (LLM, conf=0.93)
plaincorrelational- Asserted: passes — The authors put it forward as true.
- Checkable: passes — It can be checked against evidence.
- Load-bearing: unclear — It is unclear whether the paper’s conclusions depend on it.
- Based: passes — The paper gives a reason why it holds.
- Supported
The cited sources support only part of this claim — read each source’s verdict below.
In the paper
“through secretome enrichment experiments, nearly 70 BACE1 substrates have been identified to date.”
§ BACE1: More than just a β‐secretase > ESTABLISHED BACE1 SUBSTRATES AND FUNCTIONS
What the sources say
- Partly supportedcites [22] Njavro JR, Klotz J, Dislich B, et al. Mouse brain proteomics establishes MDGA1 and CACHD1 as in vivo substrates of the Alzheimer protease BACE1. FASEB K. 2020; 34(2): 2465‐ 2482. 31908000 sourceExperimental — accuracy not yet measured
The Introduction (page unavailable) says that more than 40 BACE1 substrates had been identified, mostly in cell lines and primary neurons. The Discussion describes proteomic studies of secreted BACE1 substrate fragments, but our copy does not give a count of nearly 70 or say that all were identified through secretome enrichment experiments. (LLM, conf=0.85)
- Partly supportedcites [23] Kuhn PH, Koroniak K, Hogl S, et al. Secretome protein enrichment identifies physiological BACE1 protease substrates in neurons. EMBO J. 2012; 31(14): 3157‐ 3168. 22728825 PMC3400020 sourceExperimental — accuracy not yet measured
The paper’s Abstract reports that secretome protein enrichment with click sugars (SPECS) identified 34 BACE1 substrates in primary neurons. This supports the identification method, but the paper does not substantiate the claim that nearly 70 substrates had been identified through secretome enrichment experiments to date. (LLM, conf=0.88)
- Partly supportedcites [24] Pigoni M, Wanngren J, Kuhn PH, et al. Seizure protein 6 and its homolog seizure 6‐like protein are physiological substrates of BACE1 in neurons. Mol Neurodegener. 2016; 11(1): 67. 27716410 PMC5053352 sourceExperimental — accuracy not yet measured
The Background and Discussion report that proteomic studies identified more than 40 potential BACE1 substrates, supporting the general point that many candidates had been found. They do not give a figure of nearly 70, and they say only a few candidates had been validated. (LLM, conf=0.86)
- Not checked — no full text of the sourcecites [25] Lichtenthaler SF, Dominguez DI, Westmeyer GG, et al. The cell adhesion protein P‐selectin glycoprotein ligand‐1 is a substrate for the aspartyl protease BACE1. J Biol Chem. 2003; 278(49): 48713‐ 48719. 14507929 source
plain- Asserted: passes — The authors put it forward as true.
- Checkable: passes — It can be checked against evidence.
- Load-bearing: unclear — It is unclear whether the paper’s conclusions depend on it.
- Based: passes — The paper gives a reason why it holds.
- Partly supported
Every source the paper cites for this claim was checked and supports it.
In the paper
“BACE1 cleavage of Jagged 1 (Jag1) regulates the Jag1‐Notch signaling pathway important in the control of astrogenesis and neurogenesis.”
§ BACE1: More than just a β‐secretase > ESTABLISHED BACE1 SUBSTRATES AND FUNCTIONS
What the sources say
- Supportedcites [29] Hu X, He W, Luo X, Tsubota KE, Yan R. BACE1 regulates hippocampal astrogenesis via the Jagged1‐notch pathway. Cell Rep. 2013; 4(1): 40‐ 49. 23831026 PMC3740554 source
The Discussion states that BACE1 cleaves Jag1 and that the resulting changes in Jag1 signaling regulate the Jag1-Notch pathway. The Abstract and Discussion link this pathway to the balance of astrogenesis and neurogenesis, particularly in the developing mouse hippocampus. (LLM, conf=0.94)
plaindirect- Asserted: passes — The authors put it forward as true.
- Checkable: passes — It can be checked against evidence.
- Load-bearing: unclear — It is unclear whether the paper’s conclusions depend on it.
- Based: passes — The paper gives a reason why it holds.
- Supported
- It may state two separate claims as one. 61
- Probably not a substantial claim. 10
At least one cited source doesn’t support this claim or points to a different paper, and none confirmed it — see the verdicts below.
In the paper
“Additionally, studies showed that NSAIDs, used to decrease inflammation, lower BACE1 activity, likely by reducing PPARy levels.”
§ BACE1: More than just a β‐secretase > REGULATION OF BACE1 AT THE TRANSCRIPTIONAL, TRANSLATIONAL, AND POST‐TRANSLATIONAL LEVEL
What the sources say
- Disputedcites [53] Sastre M, Dewachter I, Rossner S, et al. Nonsteroidal anti‐inflammatory drugs repress ‐secretase gene promoter activity by the activation of PPAR. Proc Natl Acad Sci. 2006; 103(2): 443‐ 448. 16407166 PMC1326151 sourceExperimental — accuracy not yet measured
The paper supports the claim that certain NSAIDs reduce BACE1 promoter activity, but it says they do so through PPARγ activation, not by reducing PPARγ levels. The Abstract states that NSAIDs suppress the decrease in PPARγ transcription caused by inflammatory cytokines; the Results report that ibuprofen, indomethacin, and naproxen repressed BACE1 promoter activity. (LLM, conf=0.90)
Checked by a reasoning model — may be wrong.
- Not checked yetcites [54] Rossner S, Sastre M, Bourne K, Lichtenthaler SF. Transcriptional and translational regulation of BACE1 expression—implications for Alzheimer's disease. Prog Neurobiol. 2006; 79(2): 95‐ 111. 16904810
hedgedconditional- Asserted: passes — The authors put it forward as true.
- Checkable: passes — It can be checked against evidence.
- Load-bearing: unclear — It is unclear whether the paper’s conclusions depend on it.
- Based: passes — The paper gives a reason why it holds.
It may state two separate claims as one.
- Disputed
Every source the paper cites for this claim was checked and supports it.
In the paper
“The action of BACE1‐AS has been implicated in AD pathology, with increased BACE‐AS in turn increasing BACE1 and Aβ‐42.”
§ BACE1: More than just a β‐secretase > REGULATION OF BACE1 AT THE TRANSCRIPTIONAL, TRANSLATIONAL, AND POST‐TRANSLATIONAL LEVEL
What the sources say
- Supportedcites [64] Li F, Wang Y, Yang H, et al. The effect of BACE1‐AS on β‐amyloid generation by regulating BACE1 mRNA expression. BMC Mol Biol. 2019; 20(1): 23. 31570097 PMC6771094 source
The Discussion links elevated BACE1-AS to AD pathogenesis and states that BACE1-AS stabilizes BACE1 mRNA, increasing BACE1 protein. It also describes a feed-forward mechanism that generates additional Aβ1-42. The paper’s own experiments measured Aβ1-40, but its Discussion supports the attributed Aβ1-42 point. (LLM, conf=0.91)
plaindirect- Asserted: passes — The authors put it forward as true.
- Checkable: passes — It can be checked against evidence.
- Load-bearing: unclear — It is unclear whether the paper’s conclusions depend on it.
- Based: passes — The paper gives a reason why it holds.
It may state two separate claims as one.
- Supported
Every source the paper cites for this claim was checked and supports it.
In the paper
“BACE1 inhibition can restore insulin signaling in this setting, while mimicked by sAPPβ.”
§ BACE1: More than just a β‐secretase > BACE1 REGULATION OF INSULIN PATHWAYS
What the sources say
- Supportedcites [44] Botteri G, Salvadó L, Gumà A, et al. The BACE1 product sAPPβ induces ER stress and inflammation and impairs insulin signaling. Metabolism. 2018; 85: 59‐ 75. 29526536 source
In Results section 3.2 (p. 12), BACE1 inhibition with M3 reversed palmitate’s reduction of insulin-stimulated Akt phosphorylation and prevented changes in other insulin-signaling markers. The Discussion (p. 18) says BACE1 inhibition attenuated palmitate-induced ER stress, inflammation, and insulin resistance, while sAPPβ mimicked most of palmitate’s effects. (LLM, conf=0.93)
plaindirect- Asserted: passes — The authors put it forward as true.
- Checkable: passes — It can be checked against evidence.
- Load-bearing: passes — The paper’s conclusions depend on it.
- Based: passes — The paper gives a reason why it holds.
It may state two separate claims as one.
- Supported
The cited sources support only part of this claim — read each source’s verdict below.
In the paper
“Insulin and Aβ have a similar tertiary structure and both bind to IR, making Aβ a competitive inhibitor able to reduce cellular insulin sensitivity”
§ BACE1: More than just a β‐secretase > BACE1 REGULATION OF INSULIN PATHWAYS
What the sources say
- Not checked — no full text of the sourcecites [93] Wang X, Yu S, Gao SJ, Hu JP, Wang Y, Liu HX. Insulin inhibits Abeta production through modulation of APP processing in a cellular model of Alzheimer's disease. Neuro Endocrinol Lett. 2014; 35(3): 224‐ 229. 24977973
- Partly supportedcites [94] Xie L, Helmerhorst E, Taddei K, Plewright B, Van Bronswijk W, Martins R. Alzheimer's beta‐amyloid peptides compete for insulin binding to the insulin receptor. J Neurosci. 2002; 22(10): Rc221. 12006603 PMC6757630 sourceExperimental — accuracy not yet measured
The Discussion reports that Aβ competes with insulin for receptor binding and inhibits insulin-promoted receptor autophosphorylation in vitro. It describes a shared sequence motif, not a demonstrated similarity in tertiary structure. Reduced cellular insulin sensitivity is a possible consequence, not a cellular effect established by these experiments. (LLM, conf=0.87)
plaindirect- Asserted: passes — The authors put it forward as true.
- Checkable: passes — It can be checked against evidence.
- Load-bearing: passes — The paper’s conclusions depend on it.
- Based: passes — The paper gives a reason why it holds.
It may state two separate claims as one.
Every source the paper cites for this claim was checked and supports it.
In the paper
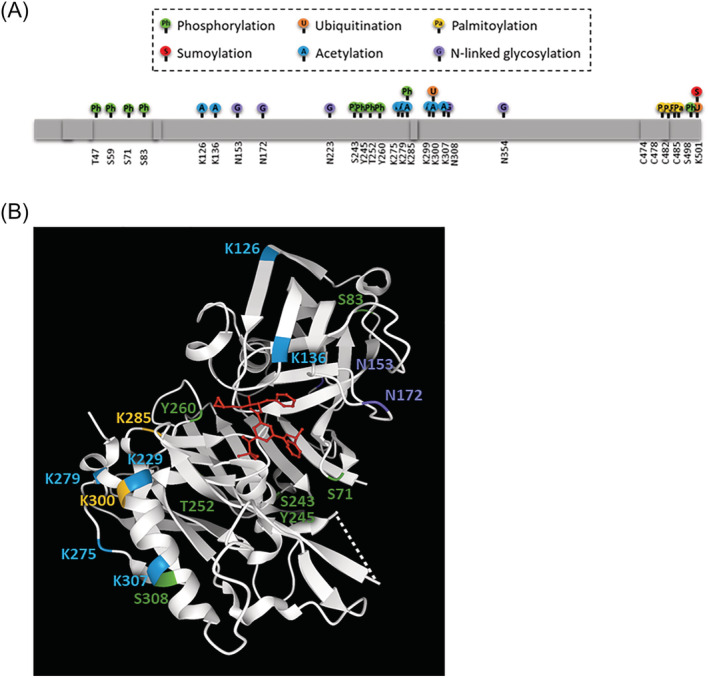
“BACE1 is also phosphorylated, with phosphorylation at threonine 252 via p25/Cdk5 pathways found to stimulate protease activity.”
§ BACE1: More than just a β‐secretase > REGULATION OF BACE1 AT THE TRANSCRIPTIONAL, TRANSLATIONAL, AND POST‐TRANSLATIONAL LEVEL
What the sources say
- Supportedcites [78] Song WJ, Son MY, Lee HW, Seo H, Kim JH, Chung SH. Enhancement of BACE1 activity by p25/Cdk5‐mediated phosphorylation in Alzheimer's disease. PLoS ONE. 2015; 10(8): 16. PMC4552876 26317805 source
The Results section, “BACE1 is phosphorylated by p25/Cdk5 at Thr252,” identifies Thr252 as the phosphorylation site. The Results section, “p25/Cdk5-mediated phosphorylation of BACE1 increases BACE1 activity,” reports that phosphorylated BACE1 had 20% higher enzymatic activity than unphosphorylated BACE1 in vitro. (LLM, conf=0.94)
plaindirect- Asserted: passes — The authors put it forward as true.
- Checkable: passes — It can be checked against evidence.
- Load-bearing: unclear — It is unclear whether the paper’s conclusions depend on it.
- Based: passes — The paper gives a reason why it holds.
It may state two separate claims as one.
- Supported
Every source the paper cites for this claim was checked and supports it.
In the paper
“Notably, JAK/STAT3 signaling is also regulated by leptin, providing a link to other aspects of the metabolic syndrome.”
§ BACE1: More than just a β‐secretase > BACE1 REGULATION OF INSULIN PATHWAYS
What the sources say
- Supportedcites [97] Gurzov EN, Stanley WJ, Pappas EG, Thomas HE, Gough DJ. The JAK/STAT pathway in obesity and diabetes. FEBS j. 2016; 283(16): 3002‐ 3015. 26972840 source
The ‘JAK-STAT signaling in the brain’ section states that leptin binding activates JAK2 and leads to STAT3 phosphorylation, linking leptin to this signaling pathway. Figure 2 further connects leptin signaling with satiety, energy expenditure, insulin secretion, and hypertension, supporting the claimed link to other aspects of metabolic syndrome. (LLM, conf=0.94)
plaincorrelational- Asserted: passes — The authors put it forward as true.
- Checkable: passes — It can be checked against evidence.
- Load-bearing: fails — The paper’s conclusions may not depend on it.
- Based: passes — The paper gives a reason why it holds.
Probably not a substantial claim. The paper’s conclusions may not depend on it. It may state two separate claims as one.
- Supported
Every source the paper cites for this claim was checked and supports it.
In the paper
“Isoform A is 501 amino acids long and is reported to have superior protease activity.”
§ BACE1: More than just a β‐secretase > REGULATION OF BACE1 AT THE TRANSCRIPTIONAL, TRANSLATIONAL, AND POST‐TRANSLATIONAL LEVEL
What the sources say
- Supportedcites [68] Mowrer KR, Wolfe MS. Promotion of BACE1 mRNA alternative splicing reduces amyloid beta‐peptide production. J Biol Chem. 2008; 283(27): 18694‐ 18701. 18468996 source
The paper identifies the full-length active BACE1 protein as 501 amino acids long (section labeled Abstract; page unavailable). In Results (page unavailable), it reports that the alternatively spliced isoforms have severely reduced protease activity compared with BACE1 501. The copy calls it BACE1 501 rather than “isoform A.” (LLM, conf=0.88)
plain- Asserted: passes — The authors put it forward as true.
- Checkable: passes — It can be checked against evidence.
- Load-bearing: unclear — It is unclear whether the paper’s conclusions depend on it.
- Based: passes — The paper gives a reason why it holds.
It may state two separate claims as one.
- Supported
Every source the paper cites for this claim was checked and supports it.
In the paper
“A greater number of individuals observed a weight loss of at least 7% when taking Lanabecestat, than individuals taking the placebo, with mean weight loss at −1.9 kg for the 50‐mg Lanabecestat group compared with 0 for the placebo group.”
§ BACE1: More than just a β‐secretase > THERAPEUTIC BACE1 INHIBITION
What the sources say
- Supportedcites [188] Wessels AM, Tariot PN, Zimmer JA, et al. Efficacy and safety of lanabecestat for treatment of early and mild Alzheimer disease: the AMARANTH and DAYBREAK‐ALZ randomized clinical trials. JAMA Neurol. 2020; 77(2): 199‐ 209. 31764959 PMC6902191 source
The Results, Safety and Tolerability section reports that weight loss of at least 7% occurred more often in lanabecestat groups than placebo groups in both studies. For patients who completed week 104 of AMARANTH, it reports mean weight changes of −1.9 kg with 50-mg lanabecestat and 0 kg with placebo. (LLM, conf=0.94)
plaindirect- Asserted: passes — The authors put it forward as true.
- Checkable: passes — It can be checked against evidence.
- Load-bearing: passes — The paper’s conclusions depend on it.
- Based: passes — The paper gives a reason why it holds.
It may state two separate claims as one.
- Supported
The cited sources support only part of this claim — read each source’s verdict below.
In the paper
“The BACE1 promotor has an NFκB binding site. When phosphorylated, NFκB increases BACE1 promotor activity and transcription.”
§ BACE1: More than just a β‐secretase > BACE1 IN IMMUNE FUNCTION
What the sources say
- Partly supportedcites [152] Chen CH, Zhou W, Liu S, et al. Increased NF‐κB signalling up‐regulates BACE1 expression and its therapeutic potential in Alzheimer's disease. Int J Neuropsychopharmacol. 2012; 15(1): 77‐ 90. 21329555 sourceExperimental — accuracy not yet measured
The sections on NF-κB-binding elements and BACE1 promoter activity report that NF-κB p65 binds elements in the human BACE1 promoter and increases its activity. The section on BACE1 gene transcription reports increased BACE1 mRNA with p65 expression. These passages do not establish that phosphorylation of NF-κB is the condition that produces those effects; page numbers were not supplied. (LLM, conf=0.88)
plaindirect- Asserted: passes — The authors put it forward as true.
- Checkable: passes — It can be checked against evidence.
- Load-bearing: passes — The paper’s conclusions depend on it.
- Based: passes — The paper gives a reason why it holds.
It may state two separate claims as one.
- Partly supported
The cited sources support only part of this claim — read each source’s verdict below.
In the paper
“By contrast, BACE2 knockout is associated with an adverse metabolic phenotype, including enhanced weight gain, hyperphagia, hyperinsulinemia, and leptin and insulin resistance.”
§ BACE1: More than just a β‐secretase > LEPTIN PATHWAY
What the sources say
- Partly supportedcites [116] Díaz‐Catalán D, Alcarraz‐Vizán G, Castaño C, et al. BACE2 suppression in mice aggravates the adverse metabolic consequences of an obesogenic diet. Mol Metab. 2021; 53: 101251. 34015524 PMC8190493 sourceExperimental — accuracy not yet measured
The Introduction and Discussion report greater weight gain, hyperphagia, hyperinsulinemia, and insulin resistance in BACE2-knockout mice fed a high-fat diet. The Results also report impaired leptin sensitivity. The claim omits the obesogenic-diet condition that bounds the reported adverse metabolic phenotype. (LLM, conf=0.88)
plaincorrelational- Asserted: passes — The authors put it forward as true.
- Checkable: passes — It can be checked against evidence.
- Load-bearing: passes — The paper’s conclusions depend on it.
- Based: passes — The paper gives a reason why it holds.
It may state two separate claims as one.
- Partly supported
The cited sources support only part of this claim — read each source’s verdict below.
In the paper
“Interestingly, both BACE1 knockout and inhibitor‐treated mice show no change in daily food intake while presenting with decreased body weight”
§ BACE1: More than just a β‐secretase > LEPTIN PATHWAY
What the sources say
- Partly supportedcites [4] Meakin PJ, Harper AJ, Hamilton DL, et al. Reduction in BACE1 decreases body weight, protects against diet‐induced obesity and enhances insulin sensitivity in mice. Biochem J. 2012; 441: 285‐ 296. 21880018 PMC3242510 sourceExperimental — accuracy not yet measured
The Results section ('BACE1−/− mice have decreased body weight and adiposity'; page unavailable) reports lower body mass and unchanged cumulative food intake in knockout mice. It does not establish unchanged daily intake or lower body weight in inhibitor-treated mice: the Methods ('Cell culture'; page unavailable) describe inhibitor treatment of cells, not mice. (LLM, conf=0.90)
- Supportedcites [19] Meakin PJ, Jalicy SM, Montagut G, et al. Bace1‐dependent amyloid processing regulates hypothalamic leptin sensitivity in obese mice. Sci Rep. 2018; 8(1): 1‐ 16. 29311632 PMC5758523 source
The Discussion states that Bace1 knockout mice had unchanged daily food intake on either regular chow or a high-fat diet despite lower body weight. The Results report that Bace1 inhibitor treatment reduced body weight without changing food intake in diet-induced obese mice. (LLM, conf=0.94)
plain- Asserted: passes — The authors put it forward as true.
- Checkable: passes — It can be checked against evidence.
- Load-bearing: passes — The paper’s conclusions depend on it.
- Based: passes — The paper gives a reason why it holds.
It may state two separate claims as one.
- Partly supported
The cited sources support only part of this claim — read each source’s verdict below.
In the paper
“Statins are associated with decreased Aβ formation, attributed to the reduction in cholesterol which in turn regulates BACE1.”
§ BACE1: More than just a β‐secretase > ACTION OF METABOLIC DRUGS ON BACE1
What the sources say
- Partly supportedcites [180] Zhang X, Wen J, Zhang Z. Statins use and risk of dementia: a dose‐response meta analysis. Medicine (Baltimore). 2018; 97(30): e11304. 30045255 PMC6078755 sourceExperimental — accuracy not yet measured
The Discussion says statins may reduce β-amyloid formation by lowering cholesterol. It does not mention BACE1 or establish that cholesterol regulates BACE1, so the claimed mechanism is unsupported by this paper. (LLM, conf=0.88)
- Not checked — no full text of the sourcecites [181] Sparks DL, Sabbagh MN, Connor DJ, et al. Atorvastatin for the treatment of mild to moderate Alzheimer disease: preliminary results. Arch Neurol. 2005; 62(5): 753‐ 757. 15883262 source
- Not checked — no full text of the sourcecites [182] Sparks DL, Kryscio RJ, Sabbagh MN, Connor DJ, Sparks LM, Liebsack C. Reduced risk of incident AD with elective statin use in a clinical trial cohort. Curr Alzheimer Res. 2008; 5(4): 416‐ 421. 18690839 source
plaincorrelational- Asserted: passes — The authors put it forward as true.
- Checkable: passes — It can be checked against evidence.
- Load-bearing: passes — The paper’s conclusions depend on it.
- Based: passes — The paper gives a reason why it holds.
It may state two separate claims as one.
- Partly supported
Every source the paper cites for this claim was checked and supports it.
In the paper
“Supporting this, BACE1 knock‐in was found to increase adipogenesis, hyperleptinemia, PTP1B, and ER stress.”
§ BACE1: More than just a β‐secretase > LEPTIN PATHWAY
What the sources say
- Supportedcites [34] Plucińska K, Dekeryte R, Koss D, et al. Neuronal human BACE1 knockin induces systemic diabetes in mice. Diabetologia. 2016; 59(7): 1513‐ 1523. 27138913 PMC4901117 source
The Discussion says neuronal hBACE1 expression promoted adipogenesis and induced hyperleptinaemia. The Results report upregulated PTP1B in PLB4 mouse liver and increased hypothalamic ER-stress markers compared with controls. (LLM, conf=0.93)
plaindirect- Asserted: passes — The authors put it forward as true.
- Checkable: passes — It can be checked against evidence.
- Load-bearing: passes — The paper’s conclusions depend on it.
- Based: passes — The paper gives a reason why it holds.
It may state two separate claims as one.
- Supported
In the paper
“L1 cell adhesion molecule (L1CAM) and neural cell adhesion molecule L1‐like protein (CHL1) are BACE1 substrates involved in axon guidance.”
§ BACE1: More than just a β‐secretase > ESTABLISHED BACE1 SUBSTRATES AND FUNCTIONS
What the sources say
- Not checked — no full text of the sourcecites [31] Zhou LJ, Barao S, Laga M, et al. The neural cell adhesion molecules L1 and CHL1 are cleaved by BACE1 protease in vivo. J Biol Chem. 2012; 287(31): 25927‐ 25940. 22692213 PMC3406677 source
plaincorrelational- Asserted: passes — The authors put it forward as true.
- Checkable: passes — It can be checked against evidence.
- Load-bearing: unclear — It is unclear whether the paper’s conclusions depend on it.
- Based: passes — The paper gives a reason why it holds.
It may state two separate claims as one.
In the paper
“P‐selectin glycoprotein ligand‐1 (PSGL‐1) is a BACE1 substrate that plays an important role in immune defenses by recruiting white blood cells to the site of infection.”
§ BACE1: More than just a β‐secretase > NON‐NEURONAL BACE1 SUBSTRATES
What the sources say
- Not checked — no full text of the sourcecites [25] Lichtenthaler SF, Dominguez DI, Westmeyer GG, et al. The cell adhesion protein P‐selectin glycoprotein ligand‐1 is a substrate for the aspartyl protease BACE1. J Biol Chem. 2003; 278(49): 48713‐ 48719. 14507929 source
plaindirect- Asserted: passes — The authors put it forward as true.
- Checkable: passes — It can be checked against evidence.
- Load-bearing: unclear — It is unclear whether the paper’s conclusions depend on it.
- Based: passes — The paper gives a reason why it holds.
It may state two separate claims as one.
None of the sources cited for this claim have been checked yet.
In the paper
“In a variety of pathological conditions, including AD, cerebral amyloid angiopathy, and metabolic diseases such as type 2 diabetes and obesity, BACE1 expression and activity are increased and drive disease progression.”
§ BACE1: More than just a β‐secretase > CONSEQUENCES OF CHANGES IN BACE1 EXPRESSION AND ACTIVITY
What the sources say
- Not checked yetcites [3] Vassar R. Beta‐secretase cleavage of Alzheimer's amyloid precursor protein by the transmembrane aspartic protease BACE. Science. 1999; 286(5440): 735‐ 741. 10531052
- Not checked yetcites [34] Plucińska K, Dekeryte R, Koss D, et al. Neuronal human BACE1 knockin induces systemic diabetes in mice. Diabetologia. 2016; 59(7): 1513‐ 1523. 27138913 PMC4901117 source
Checked before — its earlier verdict is held back until a new check runs.
- Not checked yetcites [39] Niwa K, Carlson GA, Iadecola C. Exogenous A beta1‐40 reproduces cerebrovascular alterations resulting from amyloid precursor protein overexpression in mice. J Cereb Blood Flow Metab. 2000; 20(12): 1659‐ 1668. 11129782 source
Checked before — its earlier verdict is held back until a new check runs.
- Not checked — no full text of the sourcecites [40] Alonzo NC, Hyman BT, Rebeck GW, Greenberg SM. Progression of cerebral amyloid angiopathy: accumulation of amyloid‐beta40 in affected vessels. J Neuropathol Exp Neurol. 1998; 57(4): 353‐ 359. 9600229 source
plaindirect- Asserted: passes — The authors put it forward as true.
- Checkable: passes — It can be checked against evidence.
- Load-bearing: passes — The paper’s conclusions depend on it.
- Based: passes — The paper gives a reason why it holds.
It may state two separate claims as one.
A conclusion the paper draws from its own results — it cites no other source for it, so there is none to check. The quote shows it is in the paper.
In the paper
“To date, the BACE1 substrates identified are primarily associated with neurological function and the central nervous system.”
§ BACE1: More than just a β‐secretase > ESTABLISHED BACE1 SUBSTRATES AND FUNCTIONS
plaincorrelational- Asserted: passes — The authors put it forward as true.
- Checkable: passes — It can be checked against evidence.
- Load-bearing: fails — The paper’s conclusions may not depend on it.
- Based: fails — The paper may give no reason why it holds.
Probably not a substantial claim. The paper’s conclusions may not depend on it. The paper may give no reason why it holds.
None of the sources cited for this claim have been checked yet.
In the paper
“The phenotype of the BACE1 knockout mice models, including reduced weight gain, increased energy expenditure, and enhanced leptin signaling, proposes a physiological role of BACE1 in regulating energy metabolism and homeostasis.”
§ BACE1: More than just a β‐secretase > Abstract
What the sources say
- Not checked yetcites [6] Wang H, Li R, Shen Y. β‐Secretase: its biology as a therapeutic target in diseases. Trends Pharmacol Sci. 2013; 34(4): 215‐ 225. 23452816 PMC3691103 source
Checked before — its earlier verdict is held back until a new check runs.
hedgeddirect- Asserted: passes — The authors put it forward as true.
- Checkable: passes — It can be checked against evidence.
- Load-bearing: passes — The paper’s conclusions depend on it.
- Based: passes — The paper gives a reason why it holds.
It may state two separate claims as one.
- Not checked yet
None of the sources cited for this claim have been checked yet.
In the paper
“Conversely, BACE1 knockout mice display reduced birth weight, hypomyelination, memory deficits, behavioral alterations, axon guidance impairment, impaired midbrain dopaminergic signaling, seizures, and abnormal electroencephalograms (EEGs).”
§ BACE1: More than just a β‐secretase > CONSEQUENCES OF CHANGES IN BACE1 EXPRESSION AND ACTIVITY
What the sources say
- Not checked — no full text of the sourcecites [42] Hu X, He W, Diaconu C, et al. Genetic deletion of BACE1 in mice affects remyelination of sciatic nerves. FASEB K. 2008; 22(8): 2970‐ 2980. PMC2493455 18413858 source
- Not checked yetcites [43] Ou‐Yang MH, Kurz JE, Nomura T, et al. Axonal organization defects in the hippocampus of adult conditional BACE1 knockout mice. Sci Transl Med. 2018; 10(459): eaao5620. 30232227 PMC11017370 source
plaindirect- Asserted: passes — The authors put it forward as true.
- Checkable: passes — It can be checked against evidence.
- Load-bearing: passes — The paper’s conclusions depend on it.
- Based: passes — The paper gives a reason why it holds.
It may state two separate claims as one.
In the paper
“Seizure protein 6 (SEZ6) and seizure‐like protein 6 (SEZ6L) proteins influence ER functions in neurons, control synaptic connectivity, and motor coordination and therefore may likely be responsible for the seizures, motor deficits, and reduced spinal deficiency observed in BACE1 null mice.”
§ BACE1: More than just a β‐secretase > ESTABLISHED BACE1 SUBSTRATES AND FUNCTIONS
What the sources say
- Not checked yetcites [24] Pigoni M, Wanngren J, Kuhn PH, et al. Seizure protein 6 and its homolog seizure 6‐like protein are physiological substrates of BACE1 in neurons. Mol Neurodegener. 2016; 11(1): 67. 27716410 PMC5053352 source
hedgedconditional- Asserted: passes — The authors put it forward as true.
- Checkable: passes — It can be checked against evidence.
- Load-bearing: unclear — It is unclear whether the paper’s conclusions depend on it.
- Based: passes — The paper gives a reason why it holds.
It may state two separate claims as one.
None of the sources cited for this claim have been checked yet.
In the paper
“Recent studies implicate BACE1 in alterations in insulin and leptin signaling, presenting BACE1 action as a potential link between AD and T2D.”
§ BACE1: More than just a β‐secretase > A METABOLIC ROLE OF BACE1: THE LINK BETWEEN TYPE 2 DIABETES AND AD?
What the sources say
- Not checked yetcites [83] Zhao WQ, Townsend M. Insulin resistance and amyloidogenesis as common molecular foundation for type 2 diabetes and Alzheimer's disease. Biochim Biophys Acta. 2009; 1792(5): 482‐ 496. 19026743 source
Checked before — its earlier verdict is held back until a new check runs.
hedgedcorrelational- Asserted: passes — The authors put it forward as true.
- Checkable: passes — It can be checked against evidence.
- Load-bearing: passes — The paper’s conclusions depend on it.
- Based: passes — The paper gives a reason why it holds.
It may state two separate claims as one.
- Not checked yet
None of the sources cited for this claim have been checked yet.
In the paper
“In addition to insulin signaling, other metabolic changes associated with BACE1 have been observed, including lowered plasma leptin and restored hypothalamic leptin sensitivity in obese mice.”
§ BACE1: More than just a β‐secretase > LEPTIN PATHWAY
What the sources say
- Not checked yetcites [19] Meakin PJ, Jalicy SM, Montagut G, et al. Bace1‐dependent amyloid processing regulates hypothalamic leptin sensitivity in obese mice. Sci Rep. 2018; 8(1): 1‐ 16. 29311632 PMC5758523 source
Checked before — its earlier verdict is held back until a new check runs.
plaincorrelational- Asserted: passes — The authors put it forward as true.
- Checkable: passes — It can be checked against evidence.
- Load-bearing: unclear — It is unclear whether the paper’s conclusions depend on it.
- Based: passes — The paper gives a reason why it holds.
It may state two separate claims as one.
- Not checked yet
None of the sources cited for this claim have been checked yet.
In the paper
“Glycosylation has also been implicated in the pathological increases in BACE1 stability seen in response to oxidative stress, with bisecting N‐acetylglucosamine (GlcNAc), catalyzed by GlcNAc transferase Gnt‐III having been shown to prevent lysosomal degradation of BACE1.”
§ BACE1: More than just a β‐secretase > REGULATION OF BACE1 AT THE TRANSCRIPTIONAL, TRANSLATIONAL, AND POST‐TRANSLATIONAL LEVEL
What the sources say
- Not checked yetcites [76] Kizuka Y, Kitazume S, Fujinawa R, et al. An aberrant sugar modification of BACE1 blocks its lysosomal targeting in Alzheimer's disease. EMBO Mol Med. 2015; 7(2): 175‐ 189. 25592972 PMC4328647 source
Checked before — its earlier verdict is held back until a new check runs.
- Not checked — no full text of the sourcecites [77] Kizuka Y, Nakano M, Kitazume S, Saito T, Saido TC, Taniguchi N. Bisecting GlcNAc modification stabilizes BACE1 protein under oxidative stress conditions. Biochem J. 2016; 473(1): 21‐ 30. 26467158 source
plaindirect- Asserted: passes — The authors put it forward as true.
- Checkable: passes — It can be checked against evidence.
- Load-bearing: unclear — It is unclear whether the paper’s conclusions depend on it.
- Based: passes — The paper gives a reason why it holds.
It may state two separate claims as one.
- Not checked yet
None of the sources cited for this claim have been checked yet.
In the paper
“Overexpression of BACE1 has been shown to decrease CREB phosphorylation, in turn decreasing protein kinase A (PKA) activity, and cyclic adenosine monophosphate (cAMP) levels.”
§ BACE1: More than just a β‐secretase > REGULATION OF BACE1 AT THE TRANSCRIPTIONAL, TRANSLATIONAL, AND POST‐TRANSLATIONAL LEVEL
What the sources say
- Not checked yetcites [50] Chen Y, Huang X, Zhang YW, et al. Alzheimer's ‐secretase (BACE1) regulates the cAMP/PKA/CREB pathway independently of ‐amyloid. J Neurosci. 2012; 32(33): 11390‐ 11395. 22895721 PMC3446780 source
Checked before — its earlier verdict is held back until a new check runs.
plaindirect- Asserted: passes — The authors put it forward as true.
- Checkable: passes — It can be checked against evidence.
- Load-bearing: unclear — It is unclear whether the paper’s conclusions depend on it.
- Based: passes — The paper gives a reason why it holds.
It may state two separate claims as one.
- Not checked yet
A conclusion the paper draws from its own results — it cites no other source for it, so there is none to check. The quote shows it is in the paper.
In the paper
“This may have important implications in the context of T2D and obesity, as well as providing a potential mechanistic explanation for the increased risk of AD in T2D patients.”
§ BACE1: More than just a β‐secretase > BACE1 REGULATION OF INSULIN PATHWAYS
hedgedconditional- Asserted: passes — The authors put it forward as true.
- Checkable: passes — It can be checked against evidence.
- Load-bearing: passes — The paper’s conclusions depend on it.
- Based: passes — The paper gives a reason why it holds.
It may state two separate claims as one.
A conclusion the paper draws from its own results — it cites no other source for it, so there is none to check. The quote shows it is in the paper.
In the paper
“The released soluble IR (IRsol) is able to bind insulin, reducing the abundance of bioavailable insulin, and further impairing insulin signaling.”
§ BACE1: More than just a β‐secretase > BACE1 REGULATION OF INSULIN PATHWAYS
plaindirect- Asserted: passes — The authors put it forward as true.
- Checkable: passes — It can be checked against evidence.
- Load-bearing: passes — The paper’s conclusions depend on it.
- Based: passes — The paper gives a reason why it holds.
It may state two separate claims as one.
None of the sources cited for this claim have been checked yet.
In the paper
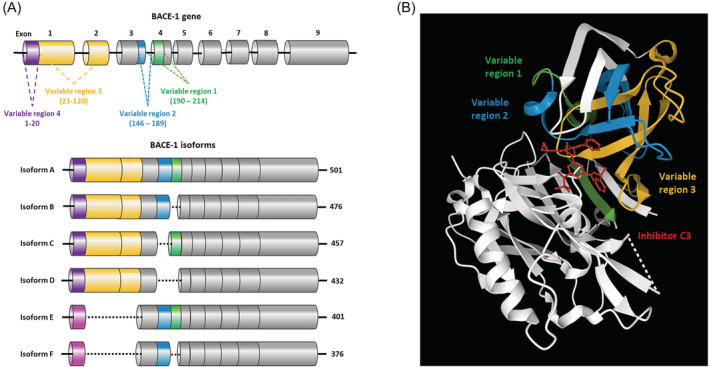
“There are six relatively established BACE1 isoforms (A–F), in addition to reports of various less well‐characterized forms including BACE1‐455 and BACE1‐127”
§ BACE1: More than just a β‐secretase > REGULATION OF BACE1 AT THE TRANSCRIPTIONAL, TRANSLATIONAL, AND POST‐TRANSLATIONAL LEVEL
What the sources say
- Not checked — no full text of the sourcecites [66] Tanahashi H, Tabira T. Three novel alternatively spliced isoforms of the human beta‐site amyloid precursor protein cleaving enzyme (BACE) and their effect on amyloid beta‐peptide production. Neurosci Lett. 2001; 307(1): 9‐ 12. 11516562 source
- Not checked — no full text of the sourcecites [67] Ehehalt R, Michel B, De Pietri Tonelli D, Zacchetti D, Simons K, Keller P. Splice variants of the beta‐site APP‐cleaving enzyme BACE1 in human brain and pancreas. Biochem Biophys Res Commun. 2002; 293(1): 30‐ 37. 12054559 source
- Not checked yetcites [68] Mowrer KR, Wolfe MS. Promotion of BACE1 mRNA alternative splicing reduces amyloid beta‐peptide production. J Biol Chem. 2008; 283(27): 18694‐ 18701. 18468996 source
Checked before — its earlier verdict is held back until a new check runs.
- Not checked — no full text of the sourcecites [69] Tanahashi H, Tabira T. A novel beta‐site amyloid precursor protein cleaving enzyme (BACE) isoform regulated by nonsense‐mediated mRNA decay and proteasome‐dependent degradation. Neurosci Lett. 2007; 428(2–3): 103‐ 108. 17961921 source
plain- Asserted: passes — The authors put it forward as true.
- Checkable: passes — It can be checked against evidence.
- Load-bearing: fails — The paper’s conclusions may not depend on it.
- Based: passes — The paper gives a reason why it holds.
Probably not a substantial claim. The paper’s conclusions may not depend on it.
None of the sources cited for this claim have been checked yet.
In the paper
“The BACE1 protein is also acetylated at seven different lysine residues mediated by CoA:lysine acetyltransferase 1 and 2 (ATase 1 and ATase 2), and ubiquitinated at K501 which causes translocation to the lysosomes for degradation.”
§ BACE1: More than just a β‐secretase > REGULATION OF BACE1 AT THE TRANSCRIPTIONAL, TRANSLATIONAL, AND POST‐TRANSLATIONAL LEVEL
What the sources say
- Not checked yetcites [6] Wang H, Li R, Shen Y. β‐Secretase: its biology as a therapeutic target in diseases. Trends Pharmacol Sci. 2013; 34(4): 215‐ 225. 23452816 PMC3691103 source
Checked before — its earlier verdict is held back until a new check runs.
plaindirect- Asserted: passes — The authors put it forward as true.
- Checkable: passes — It can be checked against evidence.
- Load-bearing: unclear — It is unclear whether the paper’s conclusions depend on it.
- Based: passes — The paper gives a reason why it holds.
It may state two separate claims as one.
- Not checked yet
In the paper
“Dysregulation of PTMs therefore has a substantial impact on BACE1, either altering enzyme activity or cellular localization, and may play an important role in alterations in BACE1 activity in response to physiological stimuli.”
§ BACE1: More than just a β‐secretase > REGULATION OF BACE1 AT THE TRANSCRIPTIONAL, TRANSLATIONAL, AND POST‐TRANSLATIONAL LEVEL
What the sources say
- Not checked yetcites [48] Araki W. Post‐translational regulation of the β‐secretase BACE1. Brain Res Bull. 2016; 126(Pt 2): 170‐ 177. 27086128
hedgedconditional- Asserted: passes — The authors put it forward as true.
- Checkable: passes — It can be checked against evidence.
- Load-bearing: passes — The paper’s conclusions depend on it.
- Based: passes — The paper gives a reason why it holds.
It may state two separate claims as one.
In the paper
“BACE1 activity is regulated at the transcriptional, post‐transcriptional, and translation level, with post‐translational modifications (PTMs) required to produce the mature BACE1 protein.”
§ BACE1: More than just a β‐secretase > REGULATION OF BACE1 AT THE TRANSCRIPTIONAL, TRANSLATIONAL, AND POST‐TRANSLATIONAL LEVEL
What the sources say
- Not checked yetcites [48] Araki W. Post‐translational regulation of the β‐secretase BACE1. Brain Res Bull. 2016; 126(Pt 2): 170‐ 177. 27086128
plaindirect- Asserted: passes — The authors put it forward as true.
- Checkable: passes — It can be checked against evidence.
- Load-bearing: unclear — It is unclear whether the paper’s conclusions depend on it.
- Based: passes — The paper gives a reason why it holds.
It may state two separate claims as one.
None of the sources cited for this claim have been checked yet.
In the paper
“Generally, a greater fat deposit in adipocytes results in greater leptin release, and therefore, theoretically, increased lipids should equate to decreased hunger.”
§ BACE1: More than just a β‐secretase > LEPTIN PATHWAY
What the sources say
- Not checked yetcites [104] Zhou Y, Rui L. Leptin signaling and leptin resistance. Front Med. 2013; 7(2): 207‐ 222. 23580174 PMC4069066 source
Checked before — its earlier verdict is held back until a new check runs.
- Not checked yetcites [105] Ahima RS. Revisiting leptin's role in obesity and weight loss. J Clin Invest. 2008; 118(7): 2380‐ 2383. 18568083 PMC2430504
- Not checked — no full text of the sourcecites [106] Frederich RC, Hamann A, Anderson S, Löllmann B, Lowell BB, Flier JS. Leptin levels reflect body lipid content in mice: evidence for diet‐induced resistance to leptin action. Nat Med. 1995; 1(12): 1311‐ 1314. 7489415 source
hedgeddirect- Asserted: passes — The authors put it forward as true.
- Checkable: passes — It can be checked against evidence.
- Load-bearing: fails — The paper’s conclusions may not depend on it.
- Based: passes — The paper gives a reason why it holds.
Probably not a substantial claim. The paper’s conclusions may not depend on it. It may state two separate claims as one.
- Not checked yet
In the paper
“Although not well characterized, the presence of a CREB binding site within the BACE1 promoter suggests that BACE1 regulation of the cAMP/PKA/CREB pathway, significant in glucose metabolism and lipid homeostasis, may feedback to regulation of BACE1 gene expression.”
§ BACE1: More than just a β‐secretase > REGULATION OF BACE1 AT THE TRANSCRIPTIONAL, TRANSLATIONAL, AND POST‐TRANSLATIONAL LEVEL
What the sources say
- Not checked — no full text of the sourcecites [51] Lahiri DK, Ge YW, Rogers JT, Sambamurti K, Greig NH, Maloney B. Taking down the unindicted co‐conspirators of amyloid beta‐peptide‐mediated neuronal death: shared gene regulation of BACE1 and APP genes interacting with CREB, Fe65 and YY1 transcription factors. Curr Alzheimer Res. 2006; 3(5): 475‐ 483. 17168646 source
hedgedconditional- Asserted: passes — The authors put it forward as true.
- Checkable: passes — It can be checked against evidence.
- Load-bearing: fails — The paper’s conclusions may not depend on it.
- Based: passes — The paper gives a reason why it holds.
Probably not a substantial claim. The paper’s conclusions may not depend on it.
In the paper
“APP, BACE1, and BACE2 are all expressed in the liver, and a 30% increase in circulating Aβ was observed when APP expression was restricted to hepatocytes in a mouse model.”
§ BACE1: More than just a β‐secretase > BACE1 REGULATION OF INSULIN PATHWAYS
What the sources say
- Not checked yetcites [90] Lam V, Takechi R, Hackett MJ, et al. Synthesis of human amyloid restricted to liver results in an Alzheimer disease‐like neurodegenerative phenotype. PLoS Biol. 2021; 19(9): e3001358. 34520451 PMC8439475 source
plaindirect- Asserted: passes — The authors put it forward as true.
- Checkable: passes — It can be checked against evidence.
- Load-bearing: passes — The paper’s conclusions depend on it.
- Based: passes — The paper gives a reason why it holds.
It may state two separate claims as one.
In the paper
“Metabolic dysfunction and type 2 diabetes mellitus (T2D) are long established risk factors for AD, with T2D sufferers having a 50% increased risk of developing AD.”
§ BACE1: More than just a β‐secretase > A METABOLIC ROLE OF BACE1: THE LINK BETWEEN TYPE 2 DIABETES AND AD?
What the sources say
- Not checked yetcites [82] WHO. Diabetes. https://www.who.int/news-room/fact-sheets/detail/diabetes. Published 2020. Accessed 24th February 2021.
boostedcorrelational- Asserted: passes — The authors put it forward as true.
- Checkable: passes — It can be checked against evidence.
- Load-bearing: fails — The paper’s conclusions may not depend on it.
- Based: passes — The paper gives a reason why it holds.
Probably not a substantial claim. The paper’s conclusions may not depend on it. It may state two separate claims as one.
None of the sources cited for this claim have been checked yet.
In the paper
“Furthermore, therapeutic inhibition of BACE2 in mice, has been linked to increased pancreatic β‐cell function and mass, enhanced insulin production and improved glucose homeostasis, likely via its role in the cleavage of Tmem27.”
§ BACE1: More than just a β‐secretase > BACE1 REGULATION OF INSULIN PATHWAYS
What the sources say
- Not checked yetcites [89] Esterházy D, Stützer I, Wang H, et al. Bace2 is a β cell‐enriched protease that regulates pancreatic β cell function and mass. Cell Metab. 2011; 14(3): 365‐ 377. 21907142 source
Checked before — its earlier verdict is held back until a new check runs.
hedgedcorrelational- Asserted: passes — The authors put it forward as true.
- Checkable: passes — It can be checked against evidence.
- Load-bearing: unclear — It is unclear whether the paper’s conclusions depend on it.
- Based: passes — The paper gives a reason why it holds.
It may state two separate claims as one.
- Not checked yet
A conclusion the paper draws from its own results — it cites no other source for it, so there is none to check. The quote shows it is in the paper.
In the paper
“BACE1 plays a pivotal role in effective insulin signaling, with high levels of BACE1 leading to reduced insulin signaling and glucose uptake, and vice versa.”
§ BACE1: More than just a β‐secretase > BACE1 REGULATION OF INSULIN PATHWAYS
plaindirect- Asserted: passes — The authors put it forward as true.
- Checkable: passes — It can be checked against evidence.
- Load-bearing: passes — The paper’s conclusions depend on it.
- Based: passes — The paper gives a reason why it holds.
It may state two separate claims as one.
In the paper
“The BACE1 protein has four N‐linked glycosylation sites, which are targeted in the Golgi and facilitate pro‐peptide processing, maturation, and transportation.”
§ BACE1: More than just a β‐secretase > REGULATION OF BACE1 AT THE TRANSCRIPTIONAL, TRANSLATIONAL, AND POST‐TRANSLATIONAL LEVEL
What the sources say
- Not checked yetcites [74] Cole SL, Vassar R. The basic biology of BACE1: a key therapeutic target for Alzheimer's disease. Curr Genomics. 2007; 8(8): 509‐ 530. 19415126 PMC2647160
plaindirect- Asserted: passes — The authors put it forward as true.
- Checkable: passes — It can be checked against evidence.
- Load-bearing: unclear — It is unclear whether the paper’s conclusions depend on it.
- Based: passes — The paper gives a reason why it holds.
It may state two separate claims as one.
In the paper
“The ubiquitination site at 501 is also competitively SUMOylated, which stabilizes the protein and promotes its activity.”
§ BACE1: More than just a β‐secretase > REGULATION OF BACE1 AT THE TRANSCRIPTIONAL, TRANSLATIONAL, AND POST‐TRANSLATIONAL LEVEL
What the sources say
- Not checked yetcites [72] Bao J, Qin M, Mahaman YAR, et al. BACE1 SUMOylation increases its stability and escalates the protease activity in Alzheimer's disease. Proc Natl Acad Sci USA. 2018; 115(15): 3954‐ 3959. 29581300 PMC5899489 source
plaindirect- Asserted: passes — The authors put it forward as true.
- Checkable: passes — It can be checked against evidence.
- Load-bearing: unclear — It is unclear whether the paper’s conclusions depend on it.
- Based: passes — The paper gives a reason why it holds.
It may state two separate claims as one.
None of the sources cited for this claim have been checked yet.
In the paper
“Tissue expression of BACE1 and plasma levels of the IRsol are higher in patients with T2D, supporting the theory that BACE1 cleavage of IR drives the disease.”
§ BACE1: More than just a β‐secretase > BACE1 REGULATION OF INSULIN PATHWAYS
What the sources say
- Not checked yetcites [4] Meakin PJ, Harper AJ, Hamilton DL, et al. Reduction in BACE1 decreases body weight, protects against diet‐induced obesity and enhances insulin sensitivity in mice. Biochem J. 2012; 441: 285‐ 296. 21880018 PMC3242510 source
Checked before — its earlier verdict is held back until a new check runs.
- Not checked yetcites [87] Soluble insulin receptor ectodomain is elevated in the plasma of patients with diabetes. Diabetes. 2007; 56(8): 2028‐ 2035. 17563065
plaindirect- Asserted: passes — The authors put it forward as true.
- Checkable: passes — It can be checked against evidence.
- Load-bearing: passes — The paper’s conclusions depend on it.
- Based: passes — The paper gives a reason why it holds.
It may state two separate claims as one.
- Not checked yet
A conclusion the paper draws from its own results — it cites no other source for it, so there is none to check. The quote shows it is in the paper.
In the paper
“This suggests that alternative splicing may be an important mechanism of regulation of BACE1 activity and may underlie cleavage of different substrates and tissue‐specific effects; however, this requires further investigation.”
§ BACE1: More than just a β‐secretase > REGULATION OF BACE1 AT THE TRANSCRIPTIONAL, TRANSLATIONAL, AND POST‐TRANSLATIONAL LEVEL
hedgedconditional- Asserted: passes — The authors put it forward as true.
- Checkable: passes — It can be checked against evidence.
- Load-bearing: fails — The paper’s conclusions may not depend on it.
- Based: passes — The paper gives a reason why it holds.
Probably not a substantial claim. The paper’s conclusions may not depend on it. It may state two separate claims as one.
A conclusion the paper draws from its own results — it cites no other source for it, so there is none to check. The quote shows it is in the paper.
In the paper
“This presents a role for the BACE1 in leptin sensitivity and responsible for energy expenditure and thermogenesis and suggests that the homologous BACE2 enzyme may also play an alternative role.”
§ BACE1: More than just a β‐secretase > LEPTIN PATHWAY
hedgeddirect- Asserted: passes — The authors put it forward as true.
- Checkable: passes — It can be checked against evidence.
- Load-bearing: passes — The paper’s conclusions depend on it.
- Based: passes — The paper gives a reason why it holds.
It may state two separate claims as one.
A conclusion the paper draws from its own results — it cites no other source for it, so there is none to check. The quote shows it is in the paper.
In the paper
“Given the extent of research into effective BACE1 inhibitors for AD, the repurposing of BACE1 inhibitory drugs for treatment of metabolic syndromes such as diabetes and obesity, or as a dual therapy against both diseases, could be a huge advancement in the treatment of metabolic disorders.”
§ BACE1: More than just a β‐secretase > THERAPEUTIC BACE1 INHIBITION
hedgedconditional- Asserted: passes — The authors put it forward as true.
- Checkable: fails — It may be too vague to check against evidence.
- Load-bearing: passes — The paper’s conclusions depend on it.
- Based: fails — The paper may give no reason why it holds.
Probably not a substantial claim. It may be too vague to check against evidence. The paper may give no reason why it holds. It may state two separate claims as one.
- Rests on an assumption: Findings from mouse models of BACE1 manipulation translate to human metabolic physiology and disease.
A conclusion the paper draws from its own results — it cites no other source for it, so there is none to check. The quote shows it is in the paper.
In the paper
“This presents an important metabolic role for BACE1 and highlights BACE1 as a potential therapeutic target for the treatment of obesity induced diabetes.”
§ BACE1: More than just a β‐secretase > THE ROLE OF BACE1 IN BAT DIFFERENTIATION
plaindirect- Asserted: passes — The authors put it forward as true.
- Checkable: passes — It can be checked against evidence.
- Load-bearing: passes — The paper’s conclusions depend on it.
- Based: passes — The paper gives a reason why it holds.
It may state two separate claims as one.
- Rests on an assumption: Findings from mouse models of BACE1 manipulation translate to human metabolic physiology and disease.
A conclusion the paper draws from its own results — it cites no other source for it, so there is none to check. The quote shows it is in the paper.
In the paper
“ST6Gal‐1 is found at decreased levels in atherosclerosis development, this suggests a role for BACE1 in its regulation.”
§ BACE1: More than just a β‐secretase > THE EFFECT OF BACE1 ON THE VASCULATURE
hedgedcorrelational- Asserted: passes — The authors put it forward as true.
- Checkable: passes — It can be checked against evidence.
- Load-bearing: passes — The paper’s conclusions depend on it.
- Based: passes — The paper gives a reason why it holds.
It may state two separate claims as one.
In the paper
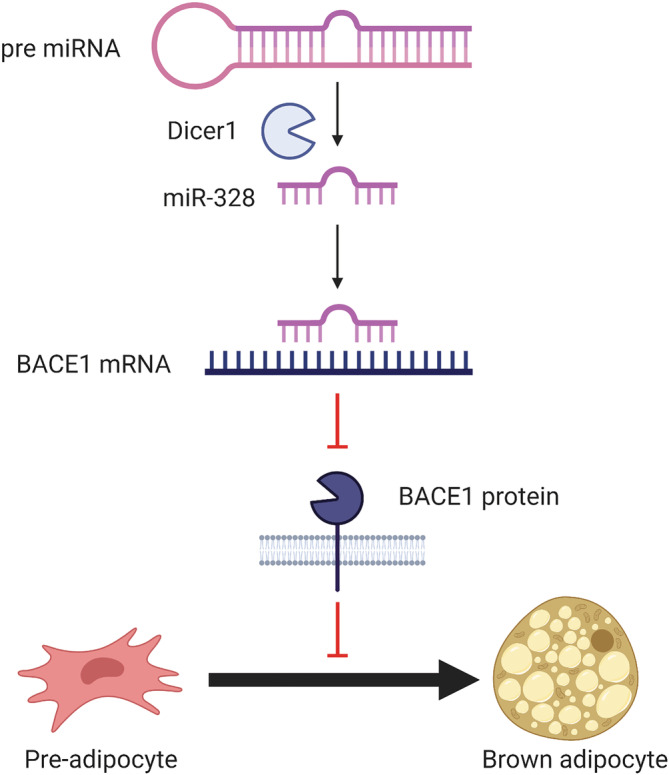
“In addition to β‐oxidation via leptin signaling, BACE1 has also been implicated in body weight regulation via thermogenesis and its role in BAT differentiation.”
§ BACE1: More than just a β‐secretase > THE ROLE OF BACE1 IN BAT DIFFERENTIATION
What the sources say
- Not checked — no full text of the sourcecites [124] Oliverio M, Schmidt E, Mauer J, et al. Dicer1‐miR‐328‐Bace1 signalling controls brown adipose tissue differentiation and function. Nat Cell Biol. 2016; 18(3): 328‐ 336. 26900752 source
hedgedcorrelational- Asserted: passes — The authors put it forward as true.
- Checkable: passes — It can be checked against evidence.
- Load-bearing: unclear — It is unclear whether the paper’s conclusions depend on it.
- Based: passes — The paper gives a reason why it holds.
It may state two separate claims as one.
None of the sources cited for this claim have been checked yet.
In the paper
“Furthermore, in vivo silencing of BACE1 was found to delay DIO induced weight gain, improve glucose tolerance, increase energy expenditure and insulin sensitivity, and elevate UCP1 expression in brown fat.”
§ BACE1: More than just a β‐secretase > THE ROLE OF BACE1 IN BAT DIFFERENTIATION
What the sources say
- Not checked yetcites [4] Meakin PJ, Harper AJ, Hamilton DL, et al. Reduction in BACE1 decreases body weight, protects against diet‐induced obesity and enhances insulin sensitivity in mice. Biochem J. 2012; 441: 285‐ 296. 21880018 PMC3242510 source
Checked before — its earlier verdict is held back until a new check runs.
plaindirect- Asserted: passes — The authors put it forward as true.
- Checkable: passes — It can be checked against evidence.
- Load-bearing: passes — The paper’s conclusions depend on it.
- Based: passes — The paper gives a reason why it holds.
It may state two separate claims as one.
- Not checked yet
In the paper
“Adverse side effects were seen including an increase in falls and injuries, sleep disturbance, suicidal thoughts, hair color change and weight loss along with decreased appetite.”
§ BACE1: More than just a β‐secretase > THERAPEUTIC BACE1 INHIBITION
What the sources say
- Not matchedcites [187] Egan MF, Mukai Y, Voss T, et al. Further analyses of the safety of verubecestat in the phase 3 EPOCH trial of mild‐to‐moderate Alzheimer's disease. Alzheimers Res Ther. 2019; 11(1): 68. 31387606 PMC6685277
Couldn’t be matched to a paper in Crossref, so it can’t be checked.
plaindirect- Asserted: passes — The authors put it forward as true.
- Checkable: passes — It can be checked against evidence.
- Load-bearing: unclear — It is unclear whether the paper’s conclusions depend on it.
- Based: passes — The paper gives a reason why it holds.
It may state two separate claims as one.
- Not matched
A conclusion the paper draws from its own results — it cites no other source for it, so there is none to check. The quote shows it is in the paper.
In the paper
“These effects likely occur through the action of BACE1 on the leptin pathway and insulin signaling pathway, and could revolutionize the treatment of metabolic dysfunction.”
§ BACE1: More than just a β‐secretase > THERAPEUTIC BACE1 INHIBITION
hedgedconditional- Asserted: passes — The authors put it forward as true.
- Checkable: passes — It can be checked against evidence.
- Load-bearing: passes — The paper’s conclusions depend on it.
- Based: fails — The paper may give no reason why it holds.
Probably not a substantial claim. The paper may give no reason why it holds.
A conclusion the paper draws from its own results — it cites no other source for it, so there is none to check. The quote shows it is in the paper.
In the paper
“Metabolic drugs are known to downregulate BACE1, including statins and metformin, and although it requires further investigation, it is possible the desired action of these drugs occurs via their impact on BACE1 expression.”
§ BACE1: More than just a β‐secretase > ACTION OF METABOLIC DRUGS ON BACE1
hedgedconditional- Asserted: passes — The authors put it forward as true.
- Checkable: passes — It can be checked against evidence.
- Load-bearing: passes — The paper’s conclusions depend on it.
- Based: passes — The paper gives a reason why it holds.
It may state two separate claims as one.
None of the sources cited for this claim have been checked yet.
In the paper
“There is evidence of an inverse relationship between BACE1 and leptin signaling. BACE1 expression is suppressed by leptin signaling, whereas BACE1 levels are increased by both obesity and T2D.”
§ BACE1: More than just a β‐secretase > LEPTIN PATHWAY
What the sources say
- Not checked yetcites [114] Marwarha G, Raza S, Meiers C, Ghribi O. Leptin attenuates BACE1 expression and amyloid‐β genesis via the activation of SIRT1 signaling pathway. Biochim Biophys Acta. 2014; 1842(9): 1587‐ 1595. 24874077 PMC4125440 source
Checked before — its earlier verdict is held back until a new check runs.
hedgeddirect- Asserted: passes — The authors put it forward as true.
- Checkable: passes — It can be checked against evidence.
- Load-bearing: passes — The paper’s conclusions depend on it.
- Based: passes — The paper gives a reason why it holds.
It may state two separate claims as one.
- Not checked yet
A conclusion the paper draws from its own results — it cites no other source for it, so there is none to check. The quote shows it is in the paper.
In the paper
“It is clear that the BACE1‐AS/BACE1/Aβ axis has important physiological functions outside the brain.”
§ BACE1: More than just a β‐secretase > FUTURE DIRECTIONS
boostedcorrelational- Asserted: passes — The authors put it forward as true.
- Checkable: passes — It can be checked against evidence.
- Load-bearing: passes — The paper’s conclusions depend on it.
- Based: fails — The paper may give no reason why it holds.
Probably not a substantial claim. The paper may give no reason why it holds.
None of the sources cited for this claim have been checked yet.
In the paper
“BACE1 regulates Notch3 signaling via direct cleavage of JAG1, in turn, increasing aberrant angiogenesis and vessel sprouting.”
§ BACE1: More than just a β‐secretase > THE EFFECT OF BACE1 ON THE VASCULATURE
What the sources say
- Not checked yetcites [131] He W, Hu J, Xia Y, Yan R. β‐site amyloid precursor protein cleaving enzyme 1(BACE1) regulates Notch signaling by controlling the cleavage of Jagged 1 (Jag1) and Jagged 2 (Jag2) proteins. J Biol Chem. 2014; 289(30): 20630‐ 20637. 24907271 PMC4110275 source
Checked before — its earlier verdict is held back until a new check runs.
plaindirect- Asserted: passes — The authors put it forward as true.
- Checkable: passes — It can be checked against evidence.
- Load-bearing: unclear — It is unclear whether the paper’s conclusions depend on it.
- Based: passes — The paper gives a reason why it holds.
It may state two separate claims as one.
- Not checked yet
A conclusion the paper draws from its own results — it cites no other source for it, so there is none to check. The quote shows it is in the paper.
In the paper
“suggesting Lanabecestat could treat excess weight observed in obesity, without causing extreme weight loss when BMI is reduced.”
§ BACE1: More than just a β‐secretase > THERAPEUTIC BACE1 INHIBITION
hedgedconditional- Asserted: passes — The authors put it forward as true.
- Checkable: passes — It can be checked against evidence.
- Load-bearing: passes — The paper’s conclusions depend on it.
- Based: passes — The paper gives a reason why it holds.
It may state two separate claims as one.
In the paper
“Several BACE1 inhibitory drugs have been developed, yet despite progression to phase 3 clinical trials, none have made it to wide clinical use.”
§ BACE1: More than just a β‐secretase > THERAPEUTIC BACE1 INHIBITION
What the sources say
- Not checked — no full text of the sourcecites [185] Moussa‐Pacha NM, Abdin SM, Omar HA, Alniss H, Al‐Tel TH. BACE1 inhibitors: current status and future directions in treating Alzheimer's disease. Med Res Rev. 2020; 40(1): 339‐ 384. 31347728 source
plain- Asserted: passes — The authors put it forward as true.
- Checkable: passes — It can be checked against evidence.
- Load-bearing: passes — The paper’s conclusions depend on it.
- Based: passes — The paper gives a reason why it holds.
It may state two separate claims as one.
A conclusion the paper draws from its own results — it cites no other source for it, so there is none to check. The quote shows it is in the paper.
In the paper
“This suggests that obesity induced Dicer1 downregulation decreases miR‐328, preventing BACE1 silencing and causing a decrease in BAT differentiation and thermogenesis as well as BACE1‐mediated impairments in glucose metabolism and homeostasis.”
§ BACE1: More than just a β‐secretase > THE ROLE OF BACE1 IN BAT DIFFERENTIATION
hedgeddirect- Asserted: passes — The authors put it forward as true.
- Checkable: passes — It can be checked against evidence.
- Load-bearing: passes — The paper’s conclusions depend on it.
- Based: passes — The paper gives a reason why it holds.
It may state two separate claims as one.
In the paper
“Despite showing a reduction in cerebrospinal fluid Aβ levels to 63%–81%, no beneficial effect on cognition was observed for Verubecestat.”
§ BACE1: More than just a β‐secretase > THERAPEUTIC BACE1 INHIBITION
What the sources say
- Not matchedcites [186] Egan MF, Kost J, Tariot PN, et al. Randomized trial of verubecestat for mild‐to‐moderate Alzheimer's disease. N Engl J Med. 2018; 378(18): 1691‐ 1703. 29719179 PMC6776074
Couldn’t be matched to a paper in Crossref, so it can’t be checked.
plaindirect- Asserted: passes — The authors put it forward as true.
- Checkable: passes — It can be checked against evidence.
- Load-bearing: passes — The paper’s conclusions depend on it.
- Based: passes — The paper gives a reason why it holds.
It may state two separate claims as one.
- Not matched
In the paper
“BACE1 protein is detectable in plasma and levels are significantly raised in patients with mild cognitive impairment, while also predicting conversion of MCI to AD.”
§ BACE1: More than just a β‐secretase > BACE1 AS A BIOMARKER
What the sources say
- Not checked yetcites [191] Shen Y, Wang H, Sun Q, et al. Increased plasma beta‐secretase 1 may predict conversion to Alzheimer's disease dementia in individuals with mild cognitive impairment. Biol Psychiatry. 2018; 83(5): 447‐ 455. 28359566 PMC5656540 source
plaincorrelational- Asserted: passes — The authors put it forward as true.
- Checkable: passes — It can be checked against evidence.
- Load-bearing: passes — The paper’s conclusions depend on it.
- Based: passes — The paper gives a reason why it holds.
It may state two separate claims as one.
A conclusion the paper draws from its own results — it cites no other source for it, so there is none to check. The quote shows it is in the paper.
In the paper
“Collectively, this points to BACE1 regulating immune cell function; however, this may be disease and/or stimulus dependent and warrants further investigation.”
§ BACE1: More than just a β‐secretase > BACE1 IN IMMUNE FUNCTION
hedgedconditional- Asserted: passes — The authors put it forward as true.
- Checkable: passes — It can be checked against evidence.
- Load-bearing: passes — The paper’s conclusions depend on it.
- Based: passes — The paper gives a reason why it holds.
It may state two separate claims as one.
A conclusion the paper draws from its own results — it cites no other source for it, so there is none to check. The quote shows it is in the paper.
In the paper
“Together, this presents an important physiological role for BACE1 within the cardiovascular system and as an important enzyme in cardiovascular disease.”
§ BACE1: More than just a β‐secretase > THE EFFECT OF BACE1 ON THE VASCULATURE
plaindirect- Asserted: passes — The authors put it forward as true.
- Checkable: passes — It can be checked against evidence.
- Load-bearing: passes — The paper’s conclusions depend on it.
- Based: passes — The paper gives a reason why it holds.
It may state two separate claims as one.
In the paper
“Furthermore, the dysregulation of the BACE1/BACE1‐AS/Aβ axis is associated with heart failure, with both BACE1‐AS and BACE1 found upregulated.”
§ BACE1: More than just a β‐secretase > THE EFFECT OF BACE1 ON THE VASCULATURE
What the sources say
- Not checked — no full text of the sourcecites [38] Greco S, Zaccagnini G, Fuschi P, et al. Increased BACE1‐AS long noncoding RNA and β‐amyloid levels in heart failure. Cardiovasc Res. 2017; 113(5): 453‐ 463. 28158647 source
plaincorrelational- Asserted: passes — The authors put it forward as true.
- Checkable: passes — It can be checked against evidence.
- Load-bearing: unclear — It is unclear whether the paper’s conclusions depend on it.
- Based: passes — The paper gives a reason why it holds.
It may state two separate claims as one.
A conclusion the paper draws from its own results — it cites no other source for it, so there is none to check. The quote shows it is in the paper.
In the paper
“Taken together, this suggests BACE1 is a pivotal enzyme in the development of cellular leptin resistance observed in obesity and T2D; however, the mechanism is unclear.”
§ BACE1: More than just a β‐secretase > LEPTIN PATHWAY
hedgeddirect- Asserted: passes — The authors put it forward as true.
- Checkable: passes — It can be checked against evidence.
- Load-bearing: passes — The paper’s conclusions depend on it.
- Based: passes — The paper gives a reason why it holds.
It may state two separate claims as one.
In the paper
“Furthermore, plasma BACE1 protein levels are elevated in people with T2D and correlate with glycemic control, independently of cognition.”
§ BACE1: More than just a β‐secretase > BACE1 AS A BIOMARKER
What the sources say
- Not checked — no full text of the sourcecites [192] Bao H, Liu Y, Zhang M, et al. Increased β‐site APP cleaving enzyme 1‐mediated insulin receptor cleavage in type 2 diabetes mellitus with cognitive impairment. Alzheimers Dement. 2021; 17(7): 1097‐ 1108. 33410588 source
plaincorrelational- Asserted: passes — The authors put it forward as true.
- Checkable: passes — It can be checked against evidence.
- Load-bearing: unclear — It is unclear whether the paper’s conclusions depend on it.
- Based: passes — The paper gives a reason why it holds.
It may state two separate claims as one.
None of the sources cited for this claim have been checked yet.
In the paper
“Inhibition of BACE1 in diet‐induced obese (DIO) mice normalized the STAT3 response, alongside improving glucose homeostasis, reducing hypothalamic inflammation, and normalizing hypothalamic leptin sensitivity via NPY, AgRP, and POMC signaling.”
§ BACE1: More than just a β‐secretase > LEPTIN PATHWAY
What the sources say
- Not checked yetcites [19] Meakin PJ, Jalicy SM, Montagut G, et al. Bace1‐dependent amyloid processing regulates hypothalamic leptin sensitivity in obese mice. Sci Rep. 2018; 8(1): 1‐ 16. 29311632 PMC5758523 source
Checked before — its earlier verdict is held back until a new check runs.
plaindirect- Asserted: passes — The authors put it forward as true.
- Checkable: passes — It can be checked against evidence.
- Load-bearing: passes — The paper’s conclusions depend on it.
- Based: passes — The paper gives a reason why it holds.
It may state two separate claims as one.
- Not checked yet
A conclusion the paper draws from its own results — it cites no other source for it, so there is none to check. The quote shows it is in the paper.
In the paper
“Thus, inflammation induced activation of NFκB, facilitates the upregulation of BACE1 expression, and subsequently increase Aβ production.”
§ BACE1: More than just a β‐secretase > BACE1 IN IMMUNE FUNCTION
plaindirect- Asserted: passes — The authors put it forward as true.
- Checkable: passes — It can be checked against evidence.
- Load-bearing: passes — The paper’s conclusions depend on it.
- Based: passes — The paper gives a reason why it holds.
It may state two separate claims as one.
In the paper
“The increasing evidence for insulin resistance and glucose metabolism playing an important role in dementia led to the investigation of metformin in AD treatment, where it was found to reduce neuronal insulin resistance and improve glucose uptake via activation of AMPK, IR, and PI3/Akt signaling, and attenuate production of Aβ.”
§ BACE1: More than just a β‐secretase > ACTION OF METABOLIC DRUGS ON BACE1
What the sources say
- Not checked — no full text of the sourcecites [175] Gupta A, Bisht B, Dey CS. Peripheral insulin‐sensitizer drug metformin ameliorates neuronal insulin resistance and Alzheimer's‐like changes. Neuropharmacology. 2011; 60(6): 910‐ 920. 21277873 source
plaindirect- Asserted: passes — The authors put it forward as true.
- Checkable: passes — It can be checked against evidence.
- Load-bearing: passes — The paper’s conclusions depend on it.
- Based: passes — The paper gives a reason why it holds.
It may state two separate claims as one.
None of the sources cited for this claim have been checked yet.
In the paper
“The lncRNA species BACE1‐AS strongly correlates with BACE1 expression and is also measurable in human plasma samples, with levels increased in patients with AD 193 and autism.”
§ BACE1: More than just a β‐secretase > BACE1 AS A BIOMARKER
What the sources say
- Not checked yetcites [193] Wang D, Wang P, Bian X, et al. Elevated plasma levels of exosomal BACE1‐AS combined with the volume and thickness of the right entorhinal cortex may serve as a biomarker for the detection of Alzheimer's disease. Mol Med Rep. 2020; 22(1): 227‐ 238. 32377715 PMC7248487 source
Checked before — its earlier verdict is held back until a new check runs.
- Not checked — no full text of the sourcecites [194] Ghafouri‐Fard S, Namvar A, Arsang‐Jang S, Komaki A, Taheri M. Expression analysis of BDNF, BACE1, and their natural occurring antisenses in autistic patients. J Mol Neurosci. 2020; 70(2): 194‐ 200. 31760580 source
boostedcorrelational- Asserted: passes — The authors put it forward as true.
- Checkable: passes — It can be checked against evidence.
- Load-bearing: passes — The paper’s conclusions depend on it.
- Based: passes — The paper gives a reason why it holds.
It may state two separate claims as one.
- Not checked yet
The paper relies on this without support.
Weight loss is observed with BACE1 inhibitors in clinical trials.
“Taken together with the weight loss observed with BACE1 inhibitors in clinical trials, these data highlight a novel role for BACE1 in regulation of metabolic physiology.”
The paper relies on this without support.
Obesity increases cdk5 and casein kinase 1 activity.
“Furthermore obesity increases cdk5 and casein kinase 1 activity is enhanced.”
The paper relies on this without support.
The weight loss observed with BACE1 inhibitors in clinical trials is due to BACE1 inhibition.
“Taken together with the weight loss observed with BACE1 inhibitors in clinical trials, these data highlight a novel role for BACE1 in regulation of metabolic physiology.”
The paper relies on this without support.
Findings from mouse models of BACE1 manipulation translate to human metabolic physiology and disease.
“This presents an important metabolic role for BACE1 and highlights BACE1 as a potential therapeutic target for the treatment of obesity induced diabetes.”
Self-check
Percentages, sums and reported differences re-computed from the paper’s own numbers.
Each contradiction between two passages listed here was confirmed by an independent check.
Rated minor: it would not touch a result — a value no result rests on, a p-value that stays on the same side of the significance level, or a conflict that is clerical, resolved elsewhere in the paper, or outside its own findings.
In the paper
§ BACE1: More than just a β‐secretase > NON‐NEURONAL BACE1 SUBSTRATES
“Another BACE1 substrate, interleukin‐1 receptor II (IL‐1R2), an interleukin‐1 decoy receptor”
§ BACE1: More than just a β‐secretase > NON‐NEURONAL BACE1 SUBSTRATES
“| IL‐1R2 | Interleukin‐1 receptor I |”
Rated minor: it would not touch a result — a value no result rests on, a p-value that stays on the same side of the significance level, or a conflict that is clerical, resolved elsewhere in the paper, or outside its own findings.
In the paper
§ BACE1: More than just a β‐secretase > REGULATION OF BACE1 AT THE TRANSCRIPTIONAL, TRANSLATIONAL, AND POST‐TRANSLATIONAL LEVEL
“The BACE1 protein is also acetylated at seven different lysine residues”
§ BACE1: More than just a β‐secretase > REGULATION OF BACE1 AT THE TRANSCRIPTIONAL, TRANSLATIONAL, AND POST‐TRANSLATIONAL LEVEL
“Acetylation (blue) at K126, K136, K275, K279, K285, K299, K300, and K307.”
Rated minor: it would not touch a result — a value no result rests on, a p-value that stays on the same side of the significance level, or a conflict that is clerical, resolved elsewhere in the paper, or outside its own findings.
In the paper
§ BACE1: More than just a β‐secretase > BACE1 REGULATION OF INSULIN PATHWAYS
“The influence of BACE1 on insulin signaling is in part through negative regulators PTEN and PTP1B”
§ BACE1: More than just a β‐secretase > BACE1 REGULATION OF INSULIN PATHWAYS
“BACE1 can impact insulin signaling through the negative regulators of the insulin signaling pathway, PTBP1 and PTEN (left)”
Cited works that were retracted
Works this paper cites that were later retracted, from the retraction notices publishers deposit. Major when the notice came out before this paper was published.
Rated major: it would touch a result — a value a result rests on, reported and recomputed p-values on opposite sides of the significance level, two passages that conflict with no sign which is right, or a cited work retracted before this paper was published.
In the paper
“10.1016/j.bbadis.2014.05.015”
Cited work 10.1016/j.bbadis.2014.05.015 · retracted 2014-09-01 · notice 10.1016/j.bbadis.2014.05.015 · this paper published 2022-02-04
Rated major: it would touch a result — a value a result rests on, reported and recomputed p-values on opposite sides of the significance level, two passages that conflict with no sign which is right, or a cited work retracted before this paper was published.
In the paper
“10.1016/j.expneurol.2006.03.019”
Cited work 10.1016/j.expneurol.2006.03.019 · retracted 2006-08-01 · notice 10.1016/j.expneurol.2006.03.019 · this paper published 2022-02-04
Citations
Cites
2 retracted
Ghribi, O., Larsen, B., Schrag, M., & Herman, M. M. (2006) · Experimental Neurology · doi:10.1016/j.expneurol.2006.03.019 · Cited by 151
RetractedMarwarha, G., Raza, S., Meiers, C., & Ghribi, O. (2014) · Biochimica et Biophysica Acta (BBA) - Molecular Basis of Disease · doi:10.1016/j.bbadis.2014.05.015 · Cited by 107
RetractedTissue-based map of the human proteome
Uhlén, M., Fagerberg, L., Hallström, B. M., Lindskog, C., Oksvold, P., Mardinoglu, A., Sivertsson, Å., Kampf, C., Sjöstedt, E., Asplund, A., et al. (2015) · Science · doi:10.1126/science.1260419 · Cited by 15,286
Vassar, R., Bennett, B. D., Babu-Khan, S., Kahn, S., Mendiaz, E. A., Denis, P., Teplow, D. B., Ross, S., Amarante, P., Loeloff, R., et al. (1999) · Science · doi:10.1126/science.286.5440.735 · Cited by 3,876
Inflammation as a central mechanism in Alzheimer's disease
Kinney, J. W., Bemiller, S. M., Murtishaw, A. S., Leisgang, A. M., Salazar, A. M., & Lamb, B. T. (2018) · Alzheimer's & Dementia: Translational Research & Clinical Interventions · doi:10.1016/j.trci.2018.06.014 · Cited by 2,253 · cited 1×
“AD is the most common form of dementia and presents with several physiological changes in addition to the accumulation of Aβ-42 into extracellular amyloid plaques, including neurofibrillary tangles (NFTs), chronic inflammation, synapse loss, neuronal death, and hypometabolism.(11,12) The accumulation Aβ-plaques disrup…”
BackgroundLocal and systemic insulin resistance resulting from hepatic activation of IKK-β and NF-κB
Cai, D., Yuan, M., Frantz, D. F., Melendez, P. A., Hansen, L., Lee, J., & Shoelson, S. E. (2005) · Nature Medicine · doi:10.1038/nm1166 · Cited by 2,245
Shibuya, M. (2011) · Genes & Cancer · doi:10.1177/1947601911423031 · Cited by 1,850
Frederich, R. C., Hamann, A., Anderson, S., Löllmann, B., Lowell, B. B., & Flier, J. S. (1995) · Nature Medicine · doi:10.1038/nm1295-1311 · Cited by 1,660
Insulin Receptor Signaling in Normal and Insulin-Resistant StatesPreprint
Boucher, J., Kleinridders, A., & Kahn, C. R. (2014) · Cold Spring Harbor Perspectives in Biology · doi:10.1101/cshperspect.a009191 · Cited by 1,550
Membrane-anchored aspartyl protease with Alzheimer's disease β-secretase activity
Yan, R., Bienkowski, M. J., Shuck, M. E., Miao, H., Tory, M. C., Pauley, A. M., Brashler, J. R., Stratman, N. C., Mathews, W. R., Buhl, A. E., et al. (1999) · Nature · doi:10.1038/990107 · Cited by 1,438
RAGE mediates amyloid-β peptide transport across the blood-brain barrier and accumulation in brain
Deane, R., Du Yan, S., Submamaryan, R. K., LaRue, B., Jovanovic, S., Hogg, E., Welch, D., Manness, L., Lin, C., Yu, J., et al. (2003) · Nature Medicine · doi:10.1038/nm890 · Cited by 1,426
Faghihi, M. A., Modarresi, F., Khalil, A. M., Wood, D. E., Sahagan, B. G., Morgan, T. E., Finch, C. E., St. Laurent III, G., Kenny, P. J., & Wahlestedt, C. (2008) · Nature Medicine · doi:10.1038/nm1784 · Cited by 1,416
Cerebral microvascular pathology in aging and Alzheimer's disease
Farkas, E., & Luiten, P. G. M. (2001) · Progress in Neurobiology · doi:10.1016/s0301-0082(00)00068-x · Cited by 1,102
Signaling pathways in insulin action: molecular targets of insulin resistance
Pessin, J. E., & Saltiel, A. R. (2000) · Journal of Clinical Investigation · doi:10.1172/jci10582 · Cited by 939
Endoplasmic Reticulum Stress Plays a Central Role in Development of Leptin Resistance
Ozcan, L., Ergin, A. S., Lu, A., Chung, J., Sarkar, S., Nie, D., Myers, M. G., & Ozcan, U. (2009) · Cell Metabolism · doi:10.1016/j.cmet.2008.12.004 · Cited by 875
Regulation of glucose transport by insulin: traffic control of GLUT4
Leto, D., & Saltiel, A. R. (2012) · Nature Reviews Molecular Cell Biology · doi:10.1038/nrm3351 · Cited by 848
Defective STAT signaling by the leptin receptor in diabetic mice.
Ghilardi, N., Ziegler, S., Wiestner, A., Stoffel, R., Heim, M. H., & Skoda, R. C. (1996) · Proceedings of the National Academy of Sciences · doi:10.1073/pnas.93.13.6231 · Cited by 795
Randomized trial of verubecestat for mild-to-moderate Alzheimer's disease
Egan, M. F., Kost, J., Tariot, P. N., Aisen, P. S., Cummings, J. L., Vellas, B., Sur, C., Mukai, Y., Voss, T., Furtek, C., et al. (2018) · New England Journal of Medicine · doi:10.1056/nejmoa1706441 · Cited by 685
Vassar, R., Kovacs, D. M., Yan, R., & Wong, P. C. (2009) · The Journal of Neuroscience · doi:10.1523/jneurosci.3657-09.2009 · Cited by 577
Generation of beta-amyloid in the secretory pathway in neuronal and nonneuronal cells.
Busciglio, J., Gabuzda, D. H., Matsudaira, P., & Yankner, B. A. (1993) · Proceedings of the National Academy of Sciences · doi:10.1073/pnas.90.5.2092 · Cited by 569
The Alzheimer's disease Beta-secretase enzyme, BACE1
Cole, S. L., & Vassar, R. (2007) · Molecular Neurodegeneration · doi:10.1186/1750-1326-2-22 · Cited by 550
Protective effects of NSAIDs on the development of Alzheimer disease
Vlad, S. C., Miller, D. R., Kowall, N. W., & Felson, D. T. (2008) · Neurology · doi:10.1212/01.wnl.0000311269.57716.63 · Cited by 535
Evidence for natural antisense transcript-mediated inhibition of microRNA function
Faghihi, M. A., Zhang, M., Huang, J., Modarresi, F., Van der Brug, M. P., Nalls, M. A., Cookson, M. R., St-Laurent, G., & Wahlestedt, C. (2010) · Genome Biology · doi:10.1186/gb-2010-11-5-r56 · Cited by 473
The molecular basis of JAK/STAT inhibition by SOCS1
Liau, N. P. D., Laktyushin, A., Lucet, I. S., Murphy, J. M., Yao, S., Whitlock, E., Callaghan, K., Nicola, N. A., Kershaw, N. J., & Babon, J. J. (2018) · Nature Communications · doi:10.1038/s41467-018-04013-1 · Cited by 456
Kent, S. A., Spires-Jones, T. L., & Durrant, C. S. (2020) · Acta Neuropathologica · doi:10.1007/s00401-020-02196-w · Cited by 446
Zhang, X., Zhou, K., Wang, R., Cui, J., Lipton, S. A., Liao, F.-F., Xu, H., & Zhang, Y.-W. (2007) · Journal of Biological Chemistry · doi:10.1074/jbc.m608856200 · Cited by 436
Chen, C.-H., Zhou, W., Liu, S., Deng, Y., Cai, F., Tone, M., Tone, Y., Tong, Y., & Song, W. (2012) · The International Journal of Neuropsychopharmacology · doi:10.1017/s1461145711000149 · Cited by 433
SOD1 rescues cerebral endothelial dysfunction in mice overexpressing amyloid precursor protein
Iadecola, C., Zhang, F., Niwa, K., Eckman, C., Turner, S. K., Fischer, E., Younkin, S., Borchelt, D. R., Hsiao, K. K., & Carlson, G. A. (1999) · Nature Neuroscience · doi:10.1038/5715 · Cited by 399
Chen, Y., Zhou, K., Wang, R., Liu, Y., Kwak, Y.-D., Ma, T., Thompson, R. C., Zhao, Y., Smith, L., Gasparini, L., et al. (2009) · Proceedings of the National Academy of Sciences · doi:10.1073/pnas.0807991106 · Cited by 390
Insulin Receptor Isoforms in Physiology and Disease: An Updated View
Belfiore, A., Malaguarnera, R., Vella, V., Lawrence, M. C., Sciacca, L., Frasca, F., Morrione, A., & Vigneri, R. (2017) · Endocrine Reviews · doi:10.1210/er.2017-00073 · Cited by 390
Efficacy of PPAR-γ agonist pioglitazone in mild Alzheimer disease
Sato, T., Hanyu, H., Hirao, K., Kanetaka, H., Sakurai, H., & Iwamoto, T. (2011) · Neurobiology of Aging · doi:10.1016/j.neurobiolaging.2009.10.009 · Cited by 387
Gao, Q., Wolfgang, M. J., Neschen, S., Morino, K., Horvath, T. L., Shulman, G. I., & Fu, X.-Y. (2004) · Proceedings of the National Academy of Sciences · doi:10.1073/pnas.0303992101 · Cited by 385
Brown fat as a therapy for obesity and diabetes
Cypess, A. M., & Kahn, C. R. (2010) · Current Opinion in Endocrinology, Diabetes & Obesity · doi:10.1097/med.0b013e328337a81f · Cited by 376
Sastre, M., Dewachter, I., Rossner, S., Bogdanovic, N., Rosen, E., Borghgraef, P., Evert, B. O., Dumitrescu-Ozimek, L., Thal, D. R., Landreth, G., et al. (2006) · Proceedings of the National Academy of Sciences · doi:10.1073/pnas.0503839103 · Cited by 373
Hsu, C.-C., Wahlqvist, M. L., Lee, M.-S., & Tsai, H.-N. (2011) · Journal of Alzheimer s Disease · doi:10.3233/jad-2011-101524 · Cited by 372
Leptin signaling and leptin resistance
Zhou, Y., & Rui, L. (2013) · Frontiers of Medicine · doi:10.1007/s11684-013-0263-5 · Cited by 358
Diabetes mellitus and Alzheimer's disease: shared pathology and treatment?
Akter, K., Lanza, E. A., Martin, S. A., Myronyuk, N., Rua, M., & Raffa, R. B. (2011) · British Journal of Clinical Pharmacology · doi:10.1111/j.1365-2125.2010.03830.x · Cited by 352
A CD36-initiated Signaling Cascade Mediates Inflammatory Effects of β-Amyloid
Moore, K. J., El Khoury, J., Medeiros, L. A., Terada, K., Geula, C., Luster, A. D., & Freeman, M. W. (2002) · Journal of Biological Chemistry · doi:10.1074/jbc.m208788200 · Cited by 327
Platelets Are the Primary Source of Amyloid β-Peptide in Human Blood
Chen, M., Inestrosa, N. C., Ross, G. S., & Fernandez, H. L. (1995) · Biochemical and Biophysical Research Communications · doi:10.1006/bbrc.1995.2103 · Cited by 320
Atorvastatin for the Treatment of Mild to Moderate Alzheimer Disease: Preliminary Results
Sparks, D. L., Sabbagh, M. N., Connor, D. J., Lopez, J., Launer, L. J., Browne, P., Wasser, D., Johnson-Traver, S., Lochhead, J., & Ziolwolski, C. (2005) · Archives of Neurology · doi:10.1001/archneur.62.5.753 · Cited by 319
Expression Analysis of BACE2 in Brain and Peripheral Tissues
Bennett, B. D., Babu-Khan, S., Loeloff, R., Louis, J.-C., Curran, E., Citron, M., & Vassar, R. (2000) · Journal of Biological Chemistry · doi:10.1074/jbc.m002688200 · Cited by 317
Vassar, R., Kuhn, P., Haass, C., Kennedy, M. E., Rajendran, L., Wong, P. C., & Lichtenthaler, S. F. (2014) · Journal of Neurochemistry · doi:10.1111/jnc.12715 · Cited by 311
Liraglutide for weight management: a critical review of the evidence
Mehta, A., Marso, S. P., & Neeland, I. J. (2017) · Obesity Science & Practice · doi:10.1002/osp4.84 · Cited by 311
Boissonneault, V., Plante, I., Rivest, S., & Provost, P. (2008) · Journal of Biological Chemistry · doi:10.1074/jbc.m807530200 · Cited by 304
Gupta, A., Bisht, B., & Dey, C. S. (2011) · Neuropharmacology · doi:10.1016/j.neuropharm.2011.01.033 · Cited by 302
Secretome protein enrichment identifies physiological BACE1 protease substrates in neurons
Kuhn, P., Koroniak, K., Hogl, S., Colombo, A., Zeitschel, U., Willem, M., Volbracht, C., Schepers, U., Imhof, A., Hoffmeister, A., et al. (2012) · The EMBO Journal · doi:10.1038/emboj.2012.173 · Cited by 301
Lipids as Modulators of Proteolytic Activity of BACE
Kalvodova, L., Kahya, N., Schwille, P., Ehehalt, R., Verkade, P., Drechsel, D. N., & Simons, K. (2005) · Journal of Biological Chemistry · doi:10.1074/jbc.m504484200 · Cited by 297
Carrano, A., Hoozemans, J. J. M., van der Vies, S. M., Rozemuller, A. J. M., van Horssen, J., & de Vries, H. E. (2011) · Antioxidants & Redox Signaling · doi:10.1089/ars.2011.3895 · Cited by 293
Zhao, W.-Q., & Townsend, M. (2009) · Biochimica et Biophysica Acta (BBA) - Molecular Basis of Disease · doi:10.1016/j.bbadis.2008.10.014 · Cited by 291
Alzheimer's β-Amyloid Peptides Compete for Insulin Binding to the Insulin Receptor
Xie, L., Helmerhorst, E., Taddei, K., Plewright, B., van Bronswijk, W., & Martins, R. (2002) · The Journal of Neuroscience · doi:10.1523/jneurosci.22-10-j0001.2002 · Cited by 291
Leptin and brain–adipose crosstalks
Caron, A., Lee, S., Elmquist, J. K., & Gautron, L. (2018) · Nature Reviews Neuroscience · doi:10.1038/nrn.2018.7 · Cited by 284
BACE1 inhibitors: Current status and future directions in treating Alzheimer's disease
Moussa‐Pacha, N. M., Abdin, S. M., Omar, H. A., Alniss, H., & Al‐Tel, T. H. (2020) · Medicinal Research Reviews · doi:10.1002/med.21622 · Cited by 274
The JAK / STAT pathway in obesity and diabetes
Gurzov, E. N., Stanley, W. J., Pappas, E. G., Thomas, H. E., & Gough, D. J. (2016) · The FEBS Journal · doi:10.1111/febs.13709 · Cited by 249
Hypoxia promotes stem cell phenotypes and poor prognosis through epigenetic regulation of DICER
van den Beucken, T., Koch, E., Chu, K., Rupaimoole, R., Prickaerts, P., Adriaens, M. E., Voncken, J. W., Harris, A. L., Buffa, F. M., Haider, S. A., et al. (2014) · Nature Communications · doi:10.1038/ncomms6203 · Cited by 229
Phosphorylation Regulates Intracellular Trafficking of β-Secretase
Walter, J., Fluhrer, R., Hartung, B., Willem, M., Kaether, C., Capell, A., Lammich, S., Multhaup, G., & Haass, C. (2001) · Journal of Biological Chemistry · doi:10.1074/jbc.m011116200 · Cited by 229
Fang, M., Wang, J., Zhang, X., Geng, Y., Hu, Z., Rudd, J. A., Ling, S., Chen, W., & Han, S. (2011) · Toxicology Letters · doi:10.1016/j.toxlet.2011.11.032 · Cited by 221
Revisiting leptin’s role in obesity and weight loss
Ahima, R. S. (2008) · Journal of Clinical Investigation · doi:10.1172/jci36284 · Cited by 209
Wessels, A. M., Tariot, P. N., Zimmer, J. A., Selzler, K. J., Bragg, S. M., Andersen, S. W., Landry, J., Krull, J. H., Downing, A. M., Willis, B. A., et al. (2020) · JAMA Neurology · doi:10.1001/jamaneurol.2019.3988 · Cited by 209
UCP1 deficiency increases susceptibility to diet‐induced obesity with age
Kontani, Y., Wang, Y., Kimura, K., Inokuma, K. ‐., Saito, M., Suzuki‐Miura, T., Wang, Z., Sato, Y., Mori, N., & Yamashita, H. (2005) · Aging Cell · doi:10.1111/j.1474-9726.2005.00157.x · Cited by 207
Lichtenthaler, S. F., Dominguez, D.-I., Westmeyer, G. G., Reiss, K., Haass, C., Saftig, P., De Strooper, B., & Seed, B. (2003) · Journal of Biological Chemistry · doi:10.1074/jbc.m303861200 · Cited by 206
Crystal Structure of an Active Form of BACE1, an Enzyme Responsible for Amyloid β Protein Production
Shimizu, H., Tosaki, A., Kaneko, K., Hisano, T., Sakurai, T., & Nukina, N. (2008) · Molecular and Cellular Biology · doi:10.1128/mcb.02185-07 · Cited by 205
MicroRNA-195 downregulates Alzheimer's disease amyloid-β production by targeting BACE1
Zhu, H.-C., Wang, L.-M., Wang, M., Song, B., Tan, S., Teng, J.-F., & Duan, D.-X. (2012) · Brain Research Bulletin · doi:10.1016/j.brainresbull.2012.05.018 · Cited by 204
Roßner, S., Sastre, M., Bourne, K. Z., & Lichtenthaler, S. F. (2006) · Progress in Neurobiology · doi:10.1016/j.pneurobio.2006.06.001 · Cited by 202
Marquer, C., Devauges, V., Cossec, J., Liot, G., Lécart, S., Saudou, F., Duyckaerts, C. J., Lévêque‐Fort, S., & Potier, M. (2011) · The FASEB Journal · doi:10.1096/fj.10-168633 · Cited by 196
Amyloid-β causes memory impairment by disturbing the JAK2/STAT3 axis in hippocampal neurons
Chiba, T., Yamada, M., Sasabe, J., Terashita, K., Shimoda, M., Matsuoka, M., & Aiso, S. (2009) · Molecular Psychiatry · doi:10.1038/mp.2008.105 · Cited by 194
Niwa, K., Carlson, G. A., & Iadecola, C. (2000) · Journal of Cerebral Blood Flow & Metabolism · doi:10.1097/00004647-200012000-00005 · Cited by 191
Mori, M. A., Thomou, T., Boucher, J., Lee, K. Y., Lallukka, S., Kim, J. K., Torriani, M., Yki‐Järvinen, H., Grinspoon, S. K., Cypess, A. M., et al. (2014) · Journal of Clinical Investigation · doi:10.1172/jci73468 · Cited by 189
Bourne, K. Z., Ferrari, D. C., Lange‐Dohna, C., Roßner, S., Wood, T. G., & Perez-Polo, J. R. (2007) · Journal of Neuroscience Research · doi:10.1002/jnr.21252 · Cited by 188
An aberrant sugar modification of BACE1 blocks its lysosomal targeting in Alzheimer's disease
Kizuka, Y., Kitazume, S., Fujinawa, R., Saito, T., Iwata, N., Saido, T. C., Nakano, M., Yamaguchi, Y., Hashimoto, Y., Staufenbiel, M., et al. (2015) · EMBO Molecular Medicine · doi:10.15252/emmm.201404438 · Cited by 185
The Insulin/Akt Signaling Pathway Is Targeted by Intracellular β-Amyloid
Lee, H.-K., Kumar, P., Fu, Q., Rosen, K. M., & Querfurth, H. W. (2009) · Molecular Biology of the Cell · doi:10.1091/mbc.e08-07-0777 · Cited by 185
Gene structure and organization of the human β‐secretase ( BACE ) promoter
Sambamurti, K., Kinsey, R., Maloney, B., Ge, Y., & Lahiri, D. K. (2004) · The FASEB Journal · doi:10.1096/fj.03-1378fje · Cited by 182
Aging leads to a programmed loss of brown adipocytes in murine subcutaneous white adipose tissue
Rogers, N. H., Landa, A., Park, S., & Smith, R. G. (2012) · Aging Cell · doi:10.1111/acel.12010 · Cited by 175
Shibata, N., Motoi, Y., Tomiyama, H., Ohnuma, T., Kuerban, B., Tomson, K., Komatsu, M., Shimazaki, H., Hattori, N., & Arai, H. (2013) · Dementia and Geriatric Cognitive Disorders Extra · doi:10.1159/000351419 · Cited by 171
The Neural Cell Adhesion Molecules L1 and CHL1 Are Cleaved by BACE1 Protease in Vivo
Zhou, L., Barão, S., Laga, M., Bockstael, K., Borgers, M., Gijsen, H., Annaert, W., Moechars, D., Mercken, M., Gevaer, K., et al. (2012) · Journal of Biological Chemistry · doi:10.1074/jbc.m112.377465 · Cited by 167
Hypothalamic mechanisms in cachexia
Grossberg, A. J., Scarlett, J. M., & Marks, D. L. (2010) · Physiology & Behavior · doi:10.1016/j.physbeh.2010.03.011 · Cited by 162
Genetic deletion of BACE1 in mice affects remyelination of sciatic nerves
Hu, X., He, W., Diaconu, C., Tang, X., Kidd, G. J., Macklin, W. B., Trapp, B. D., & Yan, R. (2008) · The FASEB Journal · doi:10.1096/fj.08-106666 · Cited by 155
The case for low-level BACE1 inhibition for the prevention of Alzheimer disease
McDade, E., Voytyuk, I., Aisen, P. S. S., Bateman, R. J., Carrillo, M. C., Strooper, B. D., Haass, C., Reiman, E. M., Sperling, R. A., Tariot, P. N., et al. (2021) · Nature Reviews Neurology · doi:10.1038/s41582-021-00545-1 · Cited by 151
Inhibition of Angiogenesis by Aβ Peptides
Paris, D., Townsend, K., Quadros, A., Humphrey, J., Sun, J., Brem, S., Wotoczek-Obadia, M., DelleDonne, A., Patel, N., Obregon, D. F., et al. (2004) · Angiogenesis · doi:10.1023/b:agen.0000037335.17717.bf · Cited by 148
Progression of Cerebral Amyloid Angiopathy: Accumulation of Amyloid-ß40 in Affected Vessels
Alonzo, N. C., Hyman, B. T., Rebeck, G. W., & Greenberg, S. M. (1998) · Journal of Neuropathology and Experimental Neurology · doi:10.1097/00005072-199804000-00008 · Cited by 146
Diabetes drugs in the fight against Alzheimer's disease
Boccardi, V., Murasecco, I., & Mecocci, P. (2019) · Ageing Research Reviews · doi:10.1016/j.arr.2019.100936 · Cited by 142
A High Fat Diet Impairs Stimulation of Glucose Transport in Muscle
Hansen, P. A., Han, D. H., Marshall, B. A., Nolte, L. A., Chen, M. M., Mueckler, M. M., & Holloszy, J. O. (1998) · Journal of Biological Chemistry · doi:10.1074/jbc.273.40.26157 · Cited by 142
Neuronal Nitric Oxide Synthase in Vascular Physiology and Diseases
Costa, E. D., Rezende, B. A., Côrtes, S. F., & Lemos, V. S. (2016) · Frontiers in Physiology · doi:10.3389/fphys.2016.00206 · Cited by 142
Bace2 Is a β Cell-Enriched Protease that Regulates Pancreatic β Cell Function and Mass
Esterházy, D., Stützer, I., Wang, H., Rechsteiner, M. P., Beauchamp, J., Döbeli, H., Hilpert, H., Matile, H., Prummer, M., Schmidt, A., et al. (2011) · Cell Metabolism · doi:10.1016/j.cmet.2011.06.018 · Cited by 135
Ip, B. C., Cilfone, N. A., Belkina, A. C., DeFuria, J., Jagannathan‐Bogdan, M., Zhu, M., Kuchibhatla, R., McDonnell, M. E., Xiao, Q., Kepler, T. B., et al. (2015) · Obesity · doi:10.1002/oby.21243 · Cited by 132
McClean, P. L., Jalewa, J., & Hölscher, C. (2015) · Behavioural Brain Research · doi:10.1016/j.bbr.2015.07.024 · Cited by 127
Pigoni, M., Wanngren, J., Kuhn, P.-H., Munro, K. M., Gunnersen, J. M., Takeshima, H., Feederle, R., Voytyuk, I., De Strooper, B., Levasseur, M. D., et al. (2016) · Molecular Neurodegeneration · doi:10.1186/s13024-016-0134-z · Cited by 125
Fleck, D., van Bebber, F., Colombo, A., Galante, C., Schwenk, B. M., Rabe, L., Hampel, H., Novak, B., Kremmer, E., Tahirovic, S., et al. (2013) · The Journal of Neuroscience · doi:10.1523/jneurosci.3372-12.2013 · Cited by 123
Shen, Y., Wang, H., Sun, Q., Yao, H., Keegan, A. P., Mullan, M., Wilson, J., Lista, S., Leyhe, T., Laske, C., et al. (2018) · Biological Psychiatry · doi:10.1016/j.biopsych.2017.02.007 · Cited by 123
Regulated Intramembrane Proteolysis of the Interleukin-1 Receptor II by α-, β-, and γ-Secretase
Kuhn, P.-H., Marjaux, E., Imhof, A., De Strooper, B., Haass, C., & Lichtenthaler, S. F. (2007) · Journal of Biological Chemistry · doi:10.1074/jbc.m700356200 · Cited by 120
Alzheimer's β-Secretase (BACE1) Regulates the cAMP/PKA/CREB Pathway Independently of β-Amyloid
Chen, Y., Huang, X., Zhang, Y.-W., Rockenstein, E., Bu, G., Golde, T. E., Masliah, E., & Xu, H. (2012) · The Journal of Neuroscience · doi:10.1523/jneurosci.0757-12.2012 · Cited by 117
Vascular Factors in Alzheimer’s Disease
Kalaria, R. N. (2003) · International Psychogeriatrics · doi:10.1017/s1041610203008950 · Cited by 117
Physiological Functions of the β-Site Amyloid Precursor Protein Cleaving Enzyme 1 and 2
Yan, R. (2017) · Frontiers in Molecular Neuroscience · doi:10.3389/fnmol.2017.00097 · Cited by 115
Hammond, T. C., Xing, X., Wang, C., Ma, D., Nho, K. T., Crane, P. K., Elahi, F. M., Ziegler, D. A., Liang, G., Cheng, Q. S., et al. (2020) · Communications Biology · doi:10.1038/s42003-020-1079-x · Cited by 115
Diet-induced obesity increases NF-κB signaling in reporter mice
Carlsen, H., Haugen, F., Zadelaar, S., Kleemann, R., Kooistra, T., Drevon, C. A., & Blomhoff, R. (2009) · Genes & Nutrition · doi:10.1007/s12263-009-0133-6 · Cited by 112
Notch3 signalling and vascular remodelling in pulmonary arterial hypertension
Morris, H. E., Neves, K. B., Montezano, A. C. I., MacLean, M. R., & Touyz, R. M. (2019) · Clinical Science · doi:10.1042/cs20190835 · Cited by 112
Barros-Viegas, A. T., Carmona, V., Ferreiro, E. B., Guedes, J. R., Cardoso, A. M., Cunha, P. S., de Almeida, L. P., Oliveira, C. R., Peça, J., Peça, J., et al. (2020) · Molecular Therapy — Nucleic Acids · doi:10.1016/j.omtn.2020.01.010 · Cited by 112
Characterization of α2,6-Sialyltransferase Cleavage by Alzheimer's β-Secretase (BACE1)
Kitazume, S., Tachida, Y., Oka, R., Kotani, N., Ogawa, K., Suzuki, M., Dohmae, N., Takio, K., Saido, T. C., & Hashimoto, Y. (2003) · Journal of Biological Chemistry · doi:10.1074/jbc.m206262200 · Cited by 110
Linking type 2 diabetes and Alzheimer's disease
Han, W., & Li, C. (2010) · Proceedings of the National Academy of Sciences · doi:10.1073/pnas.1002555107 · Cited by 109
The Basic Biology of BACE1: A Key Therapeutic Target for Alzheimers Disease
Vassar, R. J., & Cole, S. (2007) · Current Genomics · doi:10.2174/138920207783769512 · Cited by 108
Mechanisms of impaired brown adipose tissue recruitment in obesity
Alcalá, M., Calderon-Dominguez, M., Serra, D., Herrero, L., & Viana, M. (2019) · Frontiers in Physiology · doi:10.3389/fphys.2019.00094 · Cited by 106
Differential regulation of BACE1 expression by oxidative and nitrosative signals
Kwak, Y.-D., Wang, R., Li, J. J., Zhang, Y., Xu, H., & Liao, F. (2011) · Molecular Neurodegeneration · doi:10.1186/1750-1326-6-17 · Cited by 105
Meakin, P. J., Harper, A. J., Hamilton, D. L., Gallagher, J., McNeilly, A. D., Burgess, L. A., Vaanholt, L. M., Bannon, K. A., Latcham, J., Hussain, I., et al. (2012) · Biochemical Journal · doi:10.1042/bj20110512 · Cited by 103
Self-citationProteomic analysis of protein palmitoylation in adipocytes
Ren, W., Jhala, U. S., & Du, K. (2012) · Adipocyte · doi:10.4161/adip.22117 · Cited by 103
Costantini, C., Ko, M. H., Jonas, M. C., & Puglielli, L. (2007) · Biochemical Journal · doi:10.1042/bj20070040 · Cited by 99
Cho, H. J., Kim, S., Jin, S. M., Hwang, E., Kim, Y. S., Huh, K., & Mook‐Jung, I. (2007) · Glia · doi:10.1002/glia.20451 · Cited by 98
Patil, S. P., Sheng, L., Masserang, A., & Chan, C. (2006) · Neuroscience Letters · doi:10.1016/j.neulet.2006.07.015 · Cited by 95
Axonal organization defects in the hippocampus of adult conditional BACE1 knockout mice
Ou-Yang, M.-H., Kurz, J. E., Nomura, T., Popovic, J., Rajapaksha, T. W., Dong, H., Contractor, A., Chetkovich, D. M., Tourtellotte, W. G., & Vassar, R. (2018) · Science Translational Medicine · doi:10.1126/scitranslmed.aao5620 · Cited by 94
Impact of Notch Signaling on Inflammatory Responses in Cardiovascular Disorders
Quillard, T., & Charreau, B. L. (2013) · International Journal of Molecular Sciences · doi:10.3390/ijms14046863 · Cited by 94
Dicer1–miR-328–Bace1 signalling controls brown adipose tissue differentiation and function
Oliverio, M., Schmidt, E., Mauer, J., Baitzel, C., Hansmeier, N., Khani, S., Konieczka, S., Pradas-Juni, M., Brodesser, S., Van, T.-M., et al. (2016) · Nature Cell Biology · doi:10.1038/ncb3316 · Cited by 94
Increased BACE1-AS long noncoding RNA and β-amyloid levels in heart failure
Greco, S., Zaccagnini, G., Fuschi, P., Voellenkle, C., Carrara, M., Sadeghi, I., Bearzi, C., Maimone, B., Castelvecchio, S., Stellos, K., et al. (2017) · Cardiovascular Research · doi:10.1093/cvr/cvx013 · Cited by 94
Duarte, A. I., Candeias, E., Alves, I. N., Mena, D., da Silva, D. F., Machado, N. J., Campos, E. J., Santos, M. S., Oliveira, C. R., & Moreira, P. I. (2020) · International Journal of Molecular Sciences · doi:10.3390/ijms21051746 · Cited by 94
Tantiwong, P., Shanmugasundaram, K., Monroy, A., Ghosh, S., Li, M., DeFronzo, R. A., Cersósimo, E., Sriwijitkamol, A., Mohan, S., & Musi, N. (2010) · American Journal of Physiology-Endocrinology and Metabolism · doi:10.1152/ajpendo.00776.2009 · Cited by 93
Reduced Risk of Incident AD with Elective Statin Use in a Clinical Trial Cohort
Sparks, D., Kryscio, R., Sabbagh, M., Connor, D., Sparks, L., & Liebsack, C. (2008) · Current Alzheimer Research · doi:10.2174/156720508785132316 · Cited by 92
Amyloid-β Induces Hepatic Insulin Resistance by Activating JAK2/STAT3/SOCS-1 Signaling Pathway
Zhang, Y., Zhou, B., Zhang, F., Wu, J., Hu, Y., Liu, Y., & Zhai, Q. (2012) · Diabetes · doi:10.2337/db11-0499 · Cited by 92
Seok, H., Lee, M., Shin, E., Yun, M. R., Lee, Y., Moon, J. H., Kim, E., Lee, P. H., Lee, B., Kang, E. S., et al. (2019) · Scientific Reports · doi:10.1038/s41598-019-40736-x · Cited by 92
Wang, L., Liu, J., Wang, Q., Jiang, H., Zeng, L., Li, Z., & Liu, R. (2019) · Frontiers in Pharmacology · doi:10.3389/fphar.2019.00806 · Cited by 89
Bisecting GlcNAc modification stabilizes BACE1 protein under oxidative stress conditions
Kizuka, Y., Nakano, M., Kitazume, S., Saito, T., Saido, T. C., & Taniguchi, N. (2016) · Biochemical Journal · doi:10.1042/bj20150607 · Cited by 85
Farah, M. H., Pan, B., Hoffman, P. N., Ferraris, D. V., Tsukamoto, T., Nguyen, T., Wong, P. C., Price, D. L., Slusher, B. S., & Griffin, J. W. (2011) · Journal of Neuroscience · doi:10.1523/jneurosci.6810-10.2011 · Cited by 83
von Arnim, C. A. F., Tangredi, M. M., Peltan, I. D., Lee, B. M., Irizarry, M. C., Kinoshita, A., & Hyman, B. T. (2004) · Journal of Cell Science · doi:10.1242/jcs.01422 · Cited by 83
León‐Cabrera, S., Solís-Lozano, L., Suárez‐Álvarez, K., González-Chávez, A., Béjar-Ramírez, Y. L., Robles‐Díaz, G., & Escobedo, G. (2013) · Frontiers in Integrative Neuroscience · doi:10.3389/fnint.2013.00062 · Cited by 82
BACE1 Regulates Hippocampal Astrogenesis via the Jagged1-Notch Pathway
Hu, X., He, W., Luo, X., Tsubota, K. E., & Yan, R. (2013) · Cell Reports · doi:10.1016/j.celrep.2013.06.005 · Cited by 81
Egan, M. F., Mukai, Y., Voss, T., Kost, J., Stone, J., Furtek, C., Mahoney, E., Cummings, J. L., Tariot, P. N., Aisen, P. S., et al. (2019) · Alzheimer's Research & Therapy · doi:10.1186/s13195-019-0520-1 · Cited by 81
Lam, V., Takechi, R., Hackett, M. J., Francis, R., Bynevelt, M., Celliers, L. M., Nesbit, M., Mamsa, S., Arfuso, F., Das, S., et al. (2021) · PLOS Biology · doi:10.1371/journal.pbio.3001358 · Cited by 80
The beta secretase BACE1 regulates the expression of insulin receptor in the liver
Meakin, P. J., Mezzapesa, A., Benabou, E., Haas, M. E., Bonardo, B., Grino, M., Brunel, J.-M., Desbois-Mouthon, C., Biddinger, S. B., Govers, R., et al. (2018) · Nature Communications · doi:10.1038/s41467-018-03755-2 · Cited by 80
Self-citationmiR-34a-5p and miR-125b-5p attenuate Aβ-induced neurotoxicity through targeting BACE1
Li, P., Xu, Y., Wang, B., Huang, J., & Li, Q. (2020) · Journal of the Neurological Sciences · doi:10.1016/j.jns.2020.116793 · Cited by 80
In Vivo Cleavage of α2,6-Sialyltransferase by Alzheimer β-Secretase
Kitazume, S., Nakagawa, K., Oka, R., Tachida, Y., Ogawa, K., Luo, Y., Citron, M., Shitara, H., Taya, C., Yonekawa, H., et al. (2005) · Journal of Biological Chemistry · doi:10.1074/jbc.m409417200 · Cited by 79
The Anti-Diabetic Drug Metformin Reduces BACE1 Protein Level by Interfering with the MID1 Complex
Hettich, M. M., Matthes, F., Ryan, D. P., Griesche, N., Schröder, S., Dorn, S., Krauß, S., & Ehninger, D. (2014) · PLoS ONE · doi:10.1371/journal.pone.0102420 · Cited by 78
Statins use and risk of dementia: A dose–response meta analysis
Zhang, X., Wen, J., & Zhang, Z. (2018) · Medicine · doi:10.1097/md.0000000000011304 · Cited by 78
Are NSAIDs useful to treat Alzheimer’s disease or mild cognitive impairment
Imbimbo (2010) · Frontiers in Aging Neuroscience · doi:10.3389/fnagi.2010.00019 · Cited by 75
Kim, J. Y., Lee, H. J., Lee, S., Jung, Y. H., Yoo, D. Y., Hwang, I. K., Seong, J. K., Ryu, J. M., & Han, H. J. (2017) · Scientific Reports · doi:10.1038/s41598-017-04175-w · Cited by 72
Jung, S. M., Jandu, S. K., Steppan, J., Belkin, A. M., An, S. S., Pak, A., Choi, E. Y., Nyhan, D. P., Butlin, M., Viegas, K. D., et al. (2013) · American Journal of Physiology-Heart and Circulatory Physiology · doi:10.1152/ajpheart.00103.2013 · Cited by 71
β-Secretase: its biology as a therapeutic target in diseases
Wang, H., Li, R., & Shen, Y. (2013) · Trends in Pharmacological Sciences · doi:10.1016/j.tips.2013.01.008 · Cited by 69
Wang, D., Wang, P., Bian, X., Xu, S., Zhou, Q., Zhang, Y., Ding, M., Han, M., Huang, L., Bi, J., et al. (2020) · Molecular Medicine Reports · doi:10.3892/mmr.2020.11118 · Cited by 65
Commins, S. P., Watson, P. M., Frampton, I. C., & Gettys, T. W. (2001) · American Journal of Physiology-Endocrinology and Metabolism · doi:10.1152/ajpendo.2001.280.2.e372 · Cited by 64
Devraj, K., Poznanovic, S., Spahn, C., Schwall, G., Harter, P. N., Mittelbronn, M., Antoniello, K., Paganetti, P., Muhs, A., Heilemann, M., et al. (2016) · Journal of Cerebral Blood Flow & Metabolism · doi:10.1177/0271678x15606463 · Cited by 63
Immunity, atherosclerosis and cardiovascular disease
Greaves, D. R., & Gordon, S. (2001) · Trends in Immunology · doi:10.1016/s1471-4906(00)01848-2 · Cited by 61
Jantrapirom, S., Nimlamool, W., Chattipakorn, N., Chattipakorn, S., Temviriyanukul, P., Inthachat, W., Govitrapong, P., & Potikanond, S. (2020) · International Journal of Molecular Sciences · doi:10.3390/ijms21051725 · Cited by 60
Cholesterol, Statins, and Dementia: What the Cardiologist Should Know
Wanamaker, B. L., Swiger, K. J., Blumenthal, R. S., & Martin, S. S. (2015) · Clinical Cardiology · doi:10.1002/clc.22361 · Cited by 59
Tibolla, G., Norata, G. D., Meda, C., Arnaboldi, L., Uboldi, P., Piazza, F., Ferrarese, C., Corsini, A., Maggi, A. C., Vegeto, E., et al. (2009) · Atherosclerosis · doi:10.1016/j.atherosclerosis.2009.10.040 · Cited by 59
Bodendorf, U., Fischer, F., Bodian, D., Multhaup, G., & Paganetti, P. (2001) · Journal of Biological Chemistry · doi:10.1074/jbc.m008861200 · Cited by 58
Neuronal human BACE1 knockin induces systemic diabetes in mice
Plucińska, K., Dekeryte, R., Koss, D., Shearer, K., Mody, N., Whitfield, P. D., Doherty, M. K., Mingarelli, M., Welch, A., Riedel, G., et al. (2016) · Diabetologia · doi:10.1007/s00125-016-3960-1 · Cited by 58
Li, J., Zhang, N., Ye, B., Ju, W., Orser, B. A., Fox, J. E. M., Wheeler, M. B., Wang, Q., & Lu, W. (2007) · British Journal of Pharmacology · doi:10.1038/sj.bjp.0707259 · Cited by 53
The effect of BACE1-AS on β-amyloid generation by regulating BACE1 mRNA expression
Li, F., Wang, Y., Yang, H., Xu, Y., Zhou, X., Zhang, X., Xie, Z., & Bi, J. (2019) · BMC Molecular Biology · doi:10.1186/s12867-019-0140-0 · Cited by 52
Tanahashi, H., & Tabira, T. (2001) · Neuroscience Letters · doi:10.1016/s0304-3940(01)01912-7 · Cited by 51
Splice variants of the β-site APP-cleaving enzyme BACE1 in human brain and pancreas
Ehehalt, R., Michel, B., De Pietri Tonelli, D., Zacchetti, D., Simons, K., & Keller, P. (2002) · Biochemical and Biophysical Research Communications · doi:10.1016/s0006-291x(02)00169-9 · Cited by 51
BACE1 SUMOylation increases its stability and escalates the protease activity in Alzheimer’s disease
Bao, J., Qin, M., Mahaman, Y. A. R., Zhang, B., Huang, F., Zeng, K., Xia, Y., Ke, D., Wang, Q., Liu, R., et al. (2018) · Proceedings of the National Academy of Sciences · doi:10.1073/pnas.1800498115 · Cited by 50 · cited 1×
“The ubiquitination site at 501 is also competitively SUMOylated, which stabilizes the protein and promotes its activity.(72) Dysregulation of PTMs therefore has a substantial impact on BACE1, either altering”
BackgroundEnhancement of BACE1 Activity by p25/Cdk5-Mediated Phosphorylation in Alzheimer’s Disease
Song, W.-J., Son, M.-Y., Lee, H.-W., Seo, H., Kim, J. H., & Chung, S.-H. (2015) · PLOS ONE · doi:10.1371/journal.pone.0136950 · Cited by 50
Changes in insulin sensitivity during leptin replacement therapy in leptin-deficient patients
Paz-Filho, G., Esposito, K. F., Hurwitz, B. E., Sharma, A. M., Dong, C., Andreev, V., Delibaşı, T., Erol, H. K., Ayala, A. R., Wong, M., et al. (2008) · American Journal of Physiology-Endocrinology and Metabolism · doi:10.1152/ajpendo.90450.2008 · Cited by 50
Presence of BACE1 and BACE2 in muscle fibres of patients with sporadic inclusion-body myositis
Vattemi, G. N. A., Engel, W. K., McFerrin, J., Buxbaum, J. D., Pastorino, L., & Askanas, V. (2001) · The Lancet · doi:10.1016/s0140-6736(01)06969-0 · Cited by 48
Lixisenatide improves recognition memory and exerts neuroprotective actions in high-fat fed mice
Lennox, R., Flatt, P. R., & Gault, V. A. (2014) · Peptides · doi:10.1016/j.peptides.2014.08.014 · Cited by 47
Promotion of BACE1 mRNA Alternative Splicing Reduces Amyloid β-Peptide Production
Mowrer, K. R., & Wolfe, M. S. (2008) · Journal of Biological Chemistry · doi:10.1074/jbc.m801322200 · Cited by 45
Bao, H., Liu, Y., Zhang, M., Chen, Z., Zhang, W., Ge, Y., Kang, D., Gao, F., & Shen, Y. (2021) · Alzheimer's & Dementia · doi:10.1002/alz.12276 · Cited by 45
BACE1 and BACE2 in pathologic and normal human muscle
Vattemi, G. N. A., Engel, W. K., McFerrin, J., Pastorino, L., Buxbaum, J. D., & Askanas, V. (2003) · Experimental Neurology · doi:10.1016/s0014-4886(02)00025-0 · Cited by 44
Soluble Insulin Receptor Ectodomain Is Elevated in the Plasma of Patients With Diabetes
The Soluble Insulin Receptor Study Group (2007) · Diabetes · doi:10.2337/db07-0394 · Cited by 43
Cerebral amyloid angiopathy impact on endothelium
Grinberg, L. T., Korczyn, A. D., & Heinsen, H. (2012) · Experimental Gerontology · doi:10.1016/j.exger.2012.08.005 · Cited by 42
He, W., Hu, J., Xia, Y., & Yan, R. (2014) · Journal of Biological Chemistry · doi:10.1074/jbc.m114.579862 · Cited by 41
Platelet-generated amyloid beta peptides in Alzheimer's disease and glaucoma.
Inyushin, M. Y., Zayas‐Santiago, A., Rojas, L. V., Kucheryavykh, Y. V., & Kucheryavykh, L. Y. (2019) · PubMed · doi:10.14670/hh-18-111 · Cited by 40
Occludin deficiency with BACE1 elevation in cerebral amyloid angiopathy
Cheng, X., He, P., Yao, H., Dong, Q., Li, R., & Shen, Y. (2014) · Neurology · doi:10.1212/wnl.0000000000000403 · Cited by 39
The BACE1 product sAPPβ induces ER stress and inflammation and impairs insulin signaling
Botteri, G., Salvadó, L., Gumà, A., Lee Hamilton, D., Meakin, P. J., Montagut, G., Ashford, M. L. J., Ceperuelo-Mallafré, V., Fernández-Veledo, S., Vendrell, J., et al. (2018) · Metabolism · doi:10.1016/j.metabol.2018.03.005 · Cited by 39
Self-citationDurrant, C. S., Ruscher, K., Sheppard, O., Coleman, M. P., & Özen, I. (2020) · Cell Death & Disease · doi:10.1038/s41419-020-2288-4 · Cited by 39
Cholesterol-depletion corrects APP and BACE1 misstrafficking in NPC1-deficient cells
Malnar, M., Košiček, M., Lisica, A., Marjanović, M. P., Krolo, A., Njavro, J. R., Omerbašić, D., Tahirović, S., & Hecimovic, S. K. (2012) · Biochimica et Biophysica Acta (BBA) - Molecular Basis of Disease · doi:10.1016/j.bbadis.2012.04.002 · Cited by 36
Bace1-dependent amyloid processing regulates hypothalamic leptin sensitivity in obese mice
Meakin, P. J., Jalicy, S. M., Montagut, G., Allsop, D. J. P., Cavellini, D. L., Irvine, S. W., McGinley, C., Liddell, M. K., McNeilly, A. D., Parmionova, K., et al. (2018) · Scientific Reports · doi:10.1038/s41598-017-18388-6 · Cited by 36
Self-citationTan, X., Luo, Y., Pi, D.-F., Xia, L., Li, Z., & Tu, Q. (2020) · Current Neurovascular Research · doi:10.2174/1567202617666200117103931 · Cited by 36
Identification of BACE1 cleavage sites in human voltage-gated sodium channel beta 2 subunit
Gersbacher, M. T., Kim, D. Y., Bhattacharyya, R., & Kovacs, D. M. (2010) · Molecular Neurodegeneration · doi:10.1186/1750-1326-5-61 · Cited by 32
Attenuated atherogenesis in apolipoprotein E-deficient mice lacking amyloid precursor protein
van de Parre, T. J. L., Guns, P., Fransen, P. F., Martinet, W., Bult, H., Herman, A. G., & Meyer, G. R. Y. D. (2011) · Atherosclerosis · doi:10.1016/j.atherosclerosis.2011.01.032 · Cited by 31
Zohar, O., Cavallaro, S., D’Agata, V., & Alkon, D. L. (2003) · Molecular Brain Research · doi:10.1016/s0169-328x(03)00182-7 · Cited by 30
Par3 and aPKC regulate BACE1 endosome-to-TGN trafficking through PACS1
Sun, M., & Zhang, H. (2017) · Neurobiology of Aging · doi:10.1016/j.neurobiolaging.2017.08.024 · Cited by 30
Induction of angiogenesis in the ??-amyloid peptide-injected rat hippocampus
Zand, L., Ryu, J. K., & McLarnon, J. G. (2005) · Neuroreport · doi:10.1097/00001756-200502080-00011 · Cited by 28
Rudan Njavro, J., Klotz, J., Dislich, B., Wanngren, J., Shmueli, M. D., Herber, J., Kuhn, P., Kumar, R., Koeglsperger, T., Conrad, M., et al. (2020) · The FASEB Journal · doi:10.1096/fj.201902347r · Cited by 28
The regulation of β-secretase by cholesterol and statins in Alzheimer's disease
Sidera, C., Parsons, R. B., & Austen, B. (2004) · Journal of the Neurological Sciences · doi:10.1016/j.jns.2004.11.044 · Cited by 27
BACE1 regulates the proliferation and cellular functions of Schwann cells
Hu, X., Hou, H., Bastian, C., He, W., Qiu, S., Ge, Y., Yin, X., Kidd, G. J., Brunet, S., Trapp, B. D., et al. (2017) · Glia · doi:10.1002/glia.23122 · Cited by 27
Rizvi, S. M. D., Shaikh, S., Naaz, D., Shakil, S., Ahmad, A., Haneef, M., & Abuzenadah, A. M. (2016) · Neurochemical Research · doi:10.1007/s11064-016-1859-3 · Cited by 26
Post-translational regulation of the β-secretase BACE1
Araki, W. (2016) · Brain Research Bulletin · doi:10.1016/j.brainresbull.2016.04.009 · Cited by 26
Amyloid-β Increases Capillary Bed Density in the Adult Zebrafish Retina
Cunvong, K. P., Huffmire, D., Ethell, D. W., & Cameron, D. J. (2013) · Investigative Ophthalmology & Visual Science · doi:10.1167/iovs.12-10821 · Cited by 24
Lahiri, D., Ge, Y.-W., Rogers, J., Sambamurti, K., Greig, N., & Maloney, B. (2006) · Current Alzheimer Research · doi:10.2174/156720506779025224 · Cited by 24
BACE1-Dependent Neuregulin-1 Signaling: An Implication for Schizophrenia
Zhang, Z., Huang, J., Shen, Y., & Li, R. (2017) · Frontiers in Molecular Neuroscience · doi:10.3389/fnmol.2017.00302 · Cited by 23
ST6GAL1 negatively regulates monocyte transendothelial migration and atherosclerosis development
Zhang, J., Liu, Y., Deng, X., Chen, L., Yang, X., & Yu, C. (2018) · Biochemical and Biophysical Research Communications · doi:10.1016/j.bbrc.2018.04.053 · Cited by 23
Amtul, Z., Hill, D. J., Arany, E. J., & Cechetto, D. F. (2018) · Scientific Reports · doi:10.1038/s41598-018-22985-4 · Cited by 23
Distant Insulin Signaling Regulates Vertebrate Pigmentation through the Sheddase Bace2
Zhang, Y. M., Zimmer, M. A., Guardia, T., Callahan, S. J., Mondal, C., Di Martino, J., Takagi, T., Fennell, M., Garippa, R., Campbell, N. R., et al. (2018) · Developmental Cell · doi:10.1016/j.devcel.2018.04.025 · Cited by 22
Elevated circulating amyloid concentrations in obesity and diabetes promote vascular dysfunction
Meakin, P. J., Coull, B. M., Tuharska, Z., McCaffery, C., Akoumianakis, I., Antoniades, C., Brown, J., Griffin, K. J., Platt, F., Ozber, C. H., et al. (2020) · Journal of Clinical Investigation · doi:10.1172/jci122237 · Cited by 22
Self-citationSpatiotemporal processing of neural cell adhesion molecules 1 and 2 by BACE1 in vivo
Kim, W., Watanabe, H., Lomoio, S., & Tesco, G. (2021) · Journal of Biological Chemistry · doi:10.1016/j.jbc.2021.100372 · Cited by 21
Hamilton, D. L., Findlay, J. A., Montagut, G., Meakin, P. J., Bestow, D., Jalicy, S. M., & Ashford, M. L. J. (2014) · Diabetologia · doi:10.1007/s00125-014-3269-x · Cited by 20
Self-citationRoeben, B., the TREND study team, Maetzler, W., Vanmechelen, E., Schulte, C., Heinzel, S., Stellos, K., Godau, J., Huber, H., Brockmann, K., et al. (2016) · Journal of Alzheimer's Disease · doi:10.3233/jad-150575 · Cited by 19
Age-dependent differential expression of BACE splice variants in brain regions of tg2576 mice
Zohar, O., Pick, C. G., Cavallaro, S., Chapman, J., Katzav, A., Milman, A., & Alkon, D. L. (2005) · Neurobiology of Aging · doi:10.1016/j.neurobiolaging.2004.10.005 · Cited by 18
Zhu, H., Liu, Z.-P., Yang, W., Dong, D.-W., Zhao, Y. H., Yang, B. Y., Huang, L., Zhang, Y., & Xu, A.-D. (2018) · Frontiers in Neuroscience · doi:10.3389/fnins.2018.00962 · Cited by 17
Expression Analysis of BDNF, BACE1, and Their Natural Occurring Antisenses in Autistic Patients
Ghafouri-Fard, S., Namvar, A., Arsang-Jang, S., Komaki, A., & Taheri, M. (2020) · Journal of Molecular Neuroscience · doi:10.1007/s12031-019-01432-7 · Cited by 17
Pan, X., & Green, B. D. (2018) · Neuroscience · doi:10.1016/j.neuroscience.2018.11.031 · Cited by 16
Mazdeh, M., Komaki, A., Omrani, M. D., Gharzi, V., Sayad, A., Taheri, M., & Ghafouri-Fard, S. (2018) · Neurological Sciences · doi:10.1007/s10072-018-3458-3 · Cited by 15
The Alzheimer’s Disease–Associated Protein BACE1 Modulates T Cell Activation and Th17 Function
Hernandez-Mir, G., Raphael, I., Revu, S., Poholek, C. H., Avery, L., Hawse, W. F., Kane, L. P., & McGeachy, M. J. (2019) · The Journal of Immunology · doi:10.4049/jimmunol.1800363 · Cited by 14
Tanahashi, H., & Tabira, T. (2007) · Neuroscience Letters · doi:10.1016/j.neulet.2007.09.033 · Cited by 11
BACE2 suppression in mice aggravates the adverse metabolic consequences of an obesogenic diet
Díaz-Catalán, D., Alcarraz-Vizán, G., Castaño, C., de Pablo, S., Rodríguez-Comas, J., Fernández-Pérez, A., Vallejo, M., Ramírez, S., Claret, M., Parrizas, M., et al. (2021) · Molecular Metabolism · doi:10.1016/j.molmet.2021.101251 · Cited by 10
Expression of Bace1 is positive with the progress of atherosclerosis and formation of foam cell
Chen, L., Huang, Y., Guo, J., & Li, Y. (2020) · Biochemical and Biophysical Research Communications · doi:10.1016/j.bbrc.2020.05.190 · Cited by 2
(2014) · PubMed
(2019) · PubMed Central
Cited by
Sorted by citations
Afzal, S., Manap, A. S. A., Attiq, A., Albokhadaim, I. F., Kandeel, M. K., & Alhojaily, S. (2023) · Frontiers in Pharmacology · doi:10.3389/fphar.2023.1269581 · Cited by 482
Park, J. S., Rehman, I. U., Choe, K., Ahmad, R., Lee, H. J., & Kim, M. O. (2023) · Nutrients · doi:10.3390/nu15133059 · Cited by 80
Hong, H., Xu, L., Lu, Q., Huang, C., & Cui, Z. (2022) · Frontiers in Pharmacology · doi:10.3389/fphar.2022.1015035 · Cited by 61
Li, Z., Yin, B., Zhang, S., Lan, Z., & Zhang, L. (2023) · European Journal of Medicinal Chemistry · doi:10.1016/j.ejmech.2023.115817 · Cited by 54
Frick, E. A., Emilsson, V., Jónmundsson, Þ., Steindorsdottir, A. E., Johnson, E. C. B., Puerta, R., Dammer, E. B., Shantaraman, A., Cano, A. C., Boada, M., et al. (2024) · Nature Aging · doi:10.1038/s43587-024-00693-1 · Cited by 47
Metadata
- Authors
- Taylor, H. A., Przemylska, L., Clavane, E. M., & Meakin, P. J.
- Affiliations
- University of Leeds (GB)
- Discovery & Translational Science Department, Leeds Institute of Cardiovascular and Metabolic Medicine University of Leeds Leeds UK
- Corresponding author
- Meakin, Paul J.
- Venue
- Obesity Reviews
- Publisher
- Wiley
- Published
- 2022-02-04
- Volume
- 23
- Issue
- 7
- Pages
- e13430-e13430
- ISSN
- 1467-7881 (ISSN-L)
- 1467-789X
- PMC
- PMC9286785
- OpenAlex
- W4210406803
- Cited by
- 107
- References
- 194
- Citations by year
- 2026: 20 · 2025: 25 · 2024: 32 · 2023: 22 · 2022: 7
- FWCI
- 2.78
- Type
- journal article
- Language
- en
- Open access
- hybrid
- doi.org
- Licence
- Locations
- Obesity Reviews (publishedVersion, cc-by)
- PubMed Central (publishedVersion, cc-by)
- PubMed (publishedVersion)
- White Rose Research Online (University of Leeds, The University of Sheffield, University of York) (acceptedVersion)
- Funders
- Biotechnology and Biological Sciences Research Council (BB/V014358/1)
- British Heart Foundation (FS/18/38/33659, FS/4yPhD/F/20/34130)
- Topics
- Health Sciences › Medicine › Endocrinology, Diabetes and Metabolism › Adipokines, Inflammation, and Metabolic Diseases
- Life Sciences › Neuroscience › Cellular and Molecular Neuroscience › Alzheimer's disease research and treatments
- Life Sciences › Neuroscience › Endocrine and Autonomic Systems › Regulation of Appetite and Obesity
- Keywords
- BACE1, beta-secretase, BACE1 inhibitors, energy metabolism, obesity, type 2 diabetes, cardiovascular disease, leptin signaling, metabolic disorders, Alzheimer's disease, amyloid-beta
- MeSH terms
- Animals, Diabetes Mellitus, Type 2, Humans, Obesity, Amyloid beta-Peptides, Aspartic Acid Endopeptidases, Amyloid beta-Protein Precursor, Mice, Amyloid Precursor Protein Secretases
About these checks
Registry, retraction, Cites and statistics results are computed, not judged, with one exception: a printed reference that no index lists is read once by a model before it counts as a citation error. Claims are extracted by a model and kept only when their quote appears verbatim in the text; each cited source is then checked, with a model’s help, for whether it says what the claim relies on. Those verdicts can be wrong — read the claim’s quote and the cited source before relying on one.
A language model drew the claims from the paper on 2026-11-10, under version 3 of the claim definition (model deepseek-v4.1-flash, prompt extract-v3).
A second model labelled each claim on 2026-11-10 (model jev-1.13-20260917, definition revision gold-guideline-v0.2).
Cited sources are checked with a language model’s help (gpt-6-sol).
Statistics and arithmetic are recomputed, not judged.
Confidence bands are shown only for fields calibrated on our annotated test set. None is calibrated yet, so no band is shown.
What counts as a claim ›How we measure confidence ›How we check this ›
Are you an author, or do you see a problem with this page? Request a review
