

Fibromyalgia pathogenesis explained by a neuroendocrine multistable model
Open accessThe DOI matches its Crossref record; 166 of the 166 references it cites were found in a registry or an index; 74 of the 140 sources its claims cite were checked for support.
Abstract
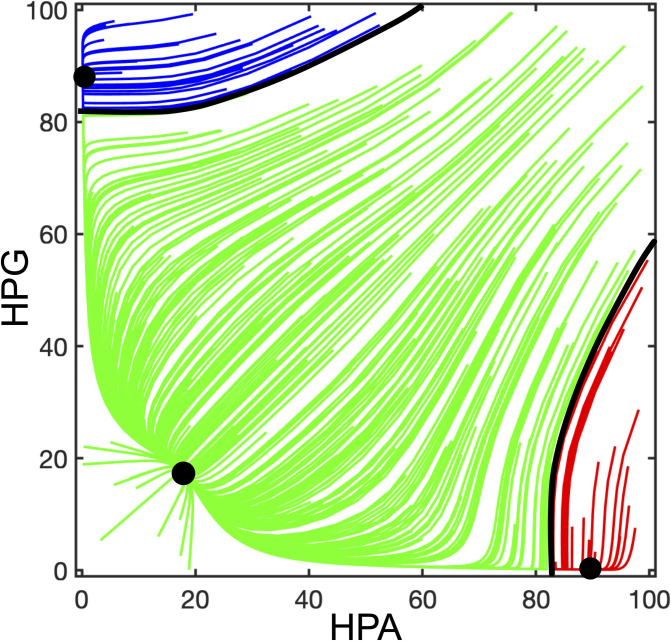
Fibromyalgia (FM) is a central disorder characterized by chronic pain, fatigue, insomnia, depression, and other minor symptoms. Knowledge about pathogenesis is lacking, diagnosis difficult, clinical approach puzzling, and patient management disappointing. We conducted a theoretical study based on literature data and computational analysis, aimed at developing a comprehensive model of FM pathogenesis and addressing suitable therapeutic targets. We started from the evidence that FM must involve a dysregulation of central pain processing, is female prevalent, suggesting a role for the hypothalamus-pituitary-gonadal (HPG) axis, and is stress-related, suggesting a role for the HP-adrenocortical (HPA) axis. Central pathogenesis was supposed to involve a pain processing loop system including the thalamic ventroposterolateral nucleus (VPL), the primary somatosensory cortex (SSC), and the thalamic reticular nucleus (TRN). For decreasing GABAergic and/or increasing glutamatergic transmission, the loop system crosses a bifurcation point, switching from monostable to bistable, and converging on a high-firing-rate steady state supposed to be the pathogenic condition. Thereafter, we showed that GABAergic transmission is positively correlated with gonadal-hormone-derived neurosteroids, notably allopregnanolone, whereas glutamatergic transmission is positively correlated with stress-induced glucocorticoids, notably cortisol. Finally, we built a dynamic model describing a multistable, double-inhibitory loop between HPG and HPA axes. This system has a high-HPA/low-HPG steady state, allegedly reached in females under combined premenstrual/postpartum brain allopregnanolone withdrawal and stress condition, driving the thalamocortical loop to the high-firing-rate steady state, and explaining the connection between endocrine and neural mechanisms in FM pathogenesis. Our model accounts for FM female prevalence and stress correlation, suggesting the use of neurosteroid drugs as a possible solution to currently unsolved problems in the clinical treatment of the disease.
Overview
CoChat Summary
TL;DR
The paper proposes a neuroendocrine multistable model in which combined HPG/HPA axis dynamics can weaken GABAergic and strengthen glutamatergic transmission, switching a thalamocortical pain loop to a high-firing-rate state that produces fibromyalgia. It predicts female prevalence and suggests GABAA-active neurosteroids as therapeutic candidates.
Key findings
- In the thalamocortical loop model, for maximal glutamatergic strength b = 1, the system is monostable for GABAergic strength a > 0.265; at a = 0.265 there is a bifurcation, and below this value the system becomes bistable, acquiring a high-firing-rate steady state assumed to represent FM chronic pain.
- Allopregnanolone withdrawal is estimated to reduce GABAergic strength to a ≈ 0.13; with physiological glutamatergic strength b = 0.5, the bifurcation point is close to but still below 0.13, whereas a 20% increase to b = 0.6 drives the bifurcation above 0.13, sufficient to induce the pathogenic state.
- The HPG-HPA double-inhibitory loop model has 3 stable equilibrium points; the high-HPA/low-HPG equilibrium is assumed to represent the functional state leading to FM onset and to drive the thalamocortical loop to its high-firing-rate state.
- The model predicts female prevalence: p_woman = 0.037 versus p_man = 0.005, yielding 87.2% women among FM patients, close to the reported 80–90% range; it suggests natural or synthetic GABAA-active neurosteroids as a possible new FM therapy.
Methods
- Theoretical study based on a PubMed literature search from inception through September 2023, using keywords for gonadal hormones, glucocorticoids, neurosteroids, and endocrine axes combined with “fibromyalgia,” “pain,” “glutamate,” “GABA,” and glutamate/GABA receptor names; combined with the authors’ previous thalamocortical loop model and FM-in-pregnancy review.
- Built a graphical and mathematical description of an endocrine loop representing HPG-HPA interaction and inferred its effects on the thalamocortical system; dynamics were analyzed using MATLAB version R2022a.
- Used systems of differential equations with increasing and decreasing Hill functions; parameters were derived from literature data and curve fitting, including median Hill parameters from allopregnanolone-GABAA and gonadal hormone/corticosteroid datasets.
Limitations
- The paper states the model is a hypothesis that must be tested in future research; numerical values were estimated from indirect data and are not expected to exactly measure real transition processes, and the model does not predict the frequency of such occurrences in the population.
- The paper states that existing symptomatic animal models (stress-based, acid saline, reserpine) disregard brain networks, the HPG axis, and HPA-HPG interaction, making them unsuitable as validating tests; lack of knowledge about FM pathogenesis hinders molecular and cellular models.
- Evident from the text: the study reports no new empirical or clinical data, relies on literature-derived representative values and assumptions (e.g., brain/plasma ratio estimates, finasteride-induced reduction), and does not clinically validate the proposed neurosteroid therapy in FM.
Model-written summary. Check it against the paper before relying on it.
Integrity signals
Registry
Cites
Statistics
Figures





Verification
Claims the paper makes
55 Valid · 2 Not valid · 33 Not checked · 48 Own results and interpretations
Some cited sources support this claim and some don’t — read each source’s verdict below.
In the paper
“For what concerns FM, both pharmacological and nonpharmacological therapies are generally disappointing, providing very limited benefit to FM patients [4,140,155,156].”
§ Fibromyalgia pathogenesis explained by a neuroendocrine multistable model > Discussion
What the sources say
- Disputedcites [4] I Demori, 2022, Online Questionnaire with Fibromyalgia Patients Reveals Correlations among Type of Pain, Psychological Alterations, and Effectiveness of Non-Pharmacological Therapies, Healthcare (Basel) sourceExperimental — accuracy not yet measured
The Discussion (§4.3) reports lower perceived effectiveness for pharmacological therapies, but it describes clear benefits from non-pharmacological interventions. The Conclusions (§5) report high self-perceived effectiveness for dietary interventions, relaxation techniques, and psychotherapy, contrary to the claim that both types of therapy provide very limited benefit. (LLM, conf=0.86)
Checked by a reasoning model — may be wrong.
- Partly supportedcites [140] R Tzadok, 2020, Current and Emerging Pharmacotherapy for Fibromyalgia, Pain Res Manag sourceExperimental — accuracy not yet measured
The Introduction says pharmacological treatment has had generally modest success, supporting that part of the claim. It recommends combining medication with nonpharmacological approaches, but does not say those approaches are generally disappointing or provide very limited benefit. Page numbers were not available in our copy. (LLM, conf=0.88)
- Disputedcites [155] AJ Busch, 2011, Exercise therapy for fibromyalgia, Curr Pain Headache Rep sourceExperimental — accuracy not yet measured
The Conclusions (page not supplied) say the benefits of exercise for people with fibromyalgia are well documented, including reduced pain and depression and improved physical function. The Benefits of Exercise section also says composite management programs have been shown effective. This contradicts the claim that nonpharmacological therapies generally provide very limited benefit; the paper does not establish a general verdict on pharmacological therapies. (LLM, conf=0.86)
Checked by a reasoning model — may be wrong.
- Partly supportedcites [156] FM Araujo, 2019, Physical therapy modalities for treating fibromyalgia, F1000Res sourceExperimental — accuracy not yet measured
The indexed text (labelled Abstract; no page given) says FM has no definitive cure, pharmacological therapy has side effects and a low recommendation level, and some physical therapies yield only small improvements. But it also says physical therapy seems to improve symptoms and reports benefits from several modalities. It does not support the blanket claim that both types of therapy generally provide very limited benefit. (LLM, conf=0.85)
plain- Asserted: passes — The authors put it forward as true.
- Checkable: passes — It can be checked against evidence.
- Load-bearing: passes — The paper’s conclusions depend on it.
- Based: passes — The paper gives a reason why it holds.
- Disputed
The cited sources support only part of this claim — read each source’s verdict below.
In the paper
“Repression of the HPA axis is due to inhibitory activities exerted by estrogens, androgens, progesterone, and their metabolites on neurons of the hypothalamic peri-paraventricular and paraventricular nuclei, and the anterior pituitary.”
§ Fibromyalgia pathogenesis explained by a neuroendocrine multistable model > Results > HPG and HPA axes as a loop system
What the sources say
- Partly supportedcites [72] MG Oyola, 2017, Hypothalamic-pituitary-adrenal and hypothalamic-pituitary-gonadal axes: sex differences in regulation of stress responsivity, Stress sourceExperimental — accuracy not yet measured
The sections on steroid metabolites and negative feedback describe inhibition of HPA activity by testosterone-derived metabolites and by estrogen-receptor-β activation near the PVN. But estrogen-receptor-α activation there increases HPA activity, and the pituitary-gland section says whether estrogen receptors regulate ACTH release at that level remains unknown. The copy does not establish that progesterone and all the listed hormones and metabolites inhibit the HPA axis through neurons at all three named sites; page numbers were not available. (LLM, conf=0.88)
plainstates a cause- Asserted: passes — The authors put it forward as true.
- Checkable: passes — It can be checked against evidence.
- Load-bearing: passes — The paper’s conclusions depend on it.
- Based: passes — The paper gives a reason why it holds.
- Partly supported
The cited sources support only part of this claim — read each source’s verdict below.
In the paper
“Accordingly, the first global effect of acute stress is a rapid decrease of GABAergic transmission together with an increase of glutamate transmission in brain areas involved in cognitive functions, such as prefrontal cortex and hippocampus [66,67].”
§ Fibromyalgia pathogenesis explained by a neuroendocrine multistable model > Results > New extended model: Involvement of endocrine axes in FM pathogenesis
What the sources say
- Not checked — no full text of the sourcecites [66] ML Barbaccia, 1996, Time-dependent changes in rat brain neuroactive steroid concentrations and GABAA receptor function after acute stress, Neuroendocrinology source
- Partly supportedcites [67] EY Yuen, 2009, Acute stress enhances glutamatergic transmission in prefrontal cortex and facilitates working memory, Proc Natl Acad Sci U S A sourceExperimental — accuracy not yet measured
The Results report that acute stress increased glutamatergic synaptic currents in rat prefrontal cortex. They do not establish a global effect or an increase in hippocampal glutamatergic transmission. Another Results passage reports no change in surface GABA-A receptor subunits, but does not measure the claimed rapid decrease in GABAergic transmission. Page numbers are unavailable in our copy. (LLM, conf=0.88)
plainstates a cause- Asserted: passes — The authors put it forward as true.
- Checkable: passes — It can be checked against evidence.
- Load-bearing: passes — The paper’s conclusions depend on it.
- Based: passes — The paper gives a reason why it holds.
The cited sources support only part of this claim — read each source’s verdict below.
In the paper
“Consistent with the correlation between FM and acute or chronic stress, the activation of the HPA axis is known to induce glutamatergic strengthening [59–61].”
§ Fibromyalgia pathogenesis explained by a neuroendocrine multistable model > Results > New extended model: Involvement of endocrine axes in FM pathogenesis
What the sources say
- Partly supportedcites [59] FL Groeneweg, 2011, Rapid non-genomic effects of corticosteroids and their role in the central stress response, J Endocrinol sourceExperimental — accuracy not yet measured
The Prefrontal cortex section reports that acute stress or corticosterone increased glutamatergic transmission, supporting the claim in that setting. But it also reports reduced plasticity under chronic stress, and the Regulation of the HPA-axis section describes corticosterone suppressing glutamatergic transmission in the hypothalamus. The unqualified claim that HPA-axis activation induces glutamatergic strengthening is therefore broader than the paper supports; page numbers were not available in our copy. (LLM, conf=0.86)
- Not checked — no full text of the sourcecites [60] B. Moghaddam, 1993, Stress preferentially increases extraneuronal levels of excitatory amino acids in the prefrontal cortex: comparison to hippocampus and basal ganglia, J Neurochem source
- Not checked — no full text of the sourcecites [61] C Venero, 1999, Rapid glucocorticoid effects on excitatory amino acid levels in the hippocampus: a microdialysis study in freely moving rats, Eur J Neurosci source
boostedstates a cause- Asserted: passes — The authors put it forward as true.
- Checkable: passes — It can be checked against evidence.
- Load-bearing: passes — The paper’s conclusions depend on it.
- Based: passes — The paper gives a reason why it holds.
- Partly supported
Every source the paper cites for this claim was checked and supports it.
In the paper
“Fifth, progesterone and testosterone, but not estradiol, seem to have a protective role in FM pain severity [33].”
§ Fibromyalgia pathogenesis explained by a neuroendocrine multistable model > Discussion
What the sources say
- Supportedcites [33] M Schertzinger, 2018, Daily Fluctuations of Progesterone and Testosterone Are Associated With Fibromyalgia Pain Severity, J Pain source
The Discussion reports that progesterone and testosterone were inversely associated with day-to-day fibromyalgia pain severity, while estradiol was not associated with it. The claim’s hedged wording is consistent with these findings; the paper does not establish that changing hormone levels would reduce pain. (LLM, conf=0.91)
hedgedstates a possible cause- Asserted: passes — The authors put it forward as true.
- Checkable: passes — It can be checked against evidence.
- Load-bearing: unclear — It is unclear whether the paper’s conclusions depend on it.
- Based: passes — The paper gives a reason why it holds.
- Supported
73 more claims · 25 with their cited sources checked
Create a free account to see all 138 claims and to verify the 11 references still open.
- It may state two separate claims as one. 41
- Probably not a substantial claim. 23
- The quote only partly states this claim. 1
Self-check
Percentages, sums and reported differences re-computed from the paper’s own numbers.
Each contradiction between two passages listed here was confirmed by an independent check.
Rated minor: it would not touch a result — a value no result rests on, a p-value that stays on the same side of the significance level, or a conflict that is clerical, resolved elsewhere in the paper, or outside its own findings.
In the paper
§ Fibromyalgia pathogenesis explained by a neuroendocrine multistable model > Results > HPG and HPA axes as a loop system
“Note: Units ang/mL bdimensionless.”
§ Fibromyalgia pathogenesis explained by a neuroendocrine multistable model > Results > HPG and HPA axes as a loop system
“A decreasing Hill function was fitted to data, whose function parameters were derived after data normalization on a 0–100 scale. (Table 4).”
Rated minor: it would not touch a result — a value no result rests on, a p-value that stays on the same side of the significance level, or a conflict that is clerical, resolved elsewhere in the paper, or outside its own findings.
In the paper
§ Fibromyalgia pathogenesis explained by a neuroendocrine multistable model > Results > HPG and HPA axes as a loop system
“Allopregnanolone has induced the GABAergic inhibition of HPA axis activation in female rats [93,94] and pregnant women [95].”
§ Fibromyalgia pathogenesis explained by a neuroendocrine multistable model > References
“Central opioid inhibition of neuroendocrine stress responses in pregnancy in the rat is induced by the neurosteroid allopregnanolone.”
Rated minor: it would not touch a result — a value no result rests on, a p-value that stays on the same side of the significance level, or a conflict that is clerical, resolved elsewhere in the paper, or outside its own findings.
In the paper
§ Fibromyalgia pathogenesis explained by a neuroendocrine multistable model > Results > New extended model: Involvement of endocrine axes in FM pathogenesis
“The values of e and af are expressed as ng/mL”
§ Fibromyalgia pathogenesis explained by a neuroendocrine multistable model > Results > New extended model: Involvement of endocrine axes in FM pathogenesis
“Therefore, by considering an average maximum increase of 150%, the value of a at the follicular phase (af) was derived from the equation af+1.5af = 1, yielding af = 0.4.”
Citations
Cites
2016 revisions to the 2010/2011 fibromyalgia diagnostic criteria
Wolfe, F., Clauw, D. J., Fitzcharles, M.-A., Goldenberg, D. L., Häuser, W., Katz, R. L., Mease, P. J., Russell, A. S., Russell, I. J., & Walitt, B. (2016) · Seminars in Arthritis and Rheumatism · doi:10.1016/j.semarthrit.2016.08.012 · Cited by 2,232
Endocrinology of the stress response
Charmandari, E., Tsigos, C., & Chrousos, G. (2005) · Annual Review of Physiology · doi:10.1146/annurev.physiol.67.040403.120816 · Cited by 1,799
Sex differences in HPA axis responses to stress: a review
Kudielka, B. M., & Kirschbaum, C. (2005) · Biological Psychology · doi:10.1016/j.biopsycho.2004.11.009 · Cited by 1,624
Paul, S. M., & Purdy, R. H. (1992) · The FASEB Journal · doi:10.1096/fasebj.6.6.1347506 · Cited by 1,319
Nociplastic pain: towards an understanding of prevalent pain conditions
Fitzcharles, M.-A., Cohen, S. P., Clauw, D. J., Littlejohn, G., Usui, C., & Häuser, W. (2021) · The Lancet · doi:10.1016/s0140-6736(21)00392-5 · Cited by 1,253
Dynamics of gonadotropin-releasing hormone release during a pulse.
Moenter, S. M., Brand, R. M., Midgley, A. R., & Karsch, F. J. (1992) · Endocrinology · doi:10.1210/endo.130.1.1727719 · Cited by 1,244
The Hill equation revisited: uses and misuses
Weiss, J. N. (1997) · The FASEB Journal · doi:10.1096/fasebj.11.11.9285481 · Cited by 1,000
Worldwide epidemiology of fibromyalgia
Queiroz, L. P. (2013) · Current Pain and Headache Reports · doi:10.1007/s11916-013-0356-5 · Cited by 826
Meltzer-Brody, S., Colquhoun, H., Riesenberg, R., Epperson, C. N., Deligiannidis, K. M., Rubinow, D. R., Li, H., Sankoh, A. J., Clemson, C., Schacterle, A., et al. (2018) · The Lancet · doi:10.1016/s0140-6736(18)31551-4 · Cited by 795
Fibromyalgia: an update on clinical characteristics, aetiopathogenesis and treatment
Sarzi-Puttini, P., Giorgi, V., Marotto, D., & Atzeni, F. (2020) · Nature Reviews Rheumatology · doi:10.1038/s41584-020-00506-w · Cited by 793
Functional Cross‐Talk Between the Hypothalamic‐Pituitary‐Gonadal and ‐Adrenal Axes
Viau, V. (2002) · Journal of Neuroendocrinology · doi:10.1046/j.1365-2826.2002.00798.x · Cited by 744
Oyola, M. G., & Handa, R. J. (2017) · Stress · doi:10.1080/10253890.2017.1369523 · Cited by 710
(2010) · Progress in Brain Research · doi:10.1016/b978-0-444-53630-3.00008-7 · Cited by 584
Moghaddam, B. (1993) · Journal of Neurochemistry · doi:10.1111/j.1471-4159.1993.tb13387.x · Cited by 567
GABAA receptor α4 subunit suppression prevents withdrawal properties of an endogenous steroid
Smith, S. S., Gong, Q. H., Hsu, F.-C., Markowitz, R. S., ffrench-Mullen, J. M. H., & Li, X. (1998) · Nature · doi:10.1038/31948 · Cited by 564
Rivier, C., Rivier, J., & Vale, W. (1986) · Science · doi:10.1126/science.3003907 · Cited by 531
Acute stress enhances glutamatergic transmission in prefrontal cortex and facilitates working memory
Yuen, E. Y., Liu, W., Karatsoreos, I. N., Feng, J., McEwen, B. S., & Yan, Z. (2009) · Proceedings of the National Academy of Sciences · doi:10.1073/pnas.0906791106 · Cited by 481
Silver, R. A. (2010) · Nature Reviews Neuroscience · doi:10.1038/nrn2864 · Cited by 481
Jones, G. T., Atzeni, F., Beasley, M., Flüß, E., Sarzi‐Puttini, P., & Macfarlane, G. J. (2015) · Arthritis & Rheumatology · doi:10.1002/art.38905 · Cited by 460
Rapid non-genomic effects of corticosteroids and their role in the central stress response
Groeneweg, F. L., Karst, H., de Kloet, E. R., & Joëls, M. (2011) · Journal of Endocrinology · doi:10.1530/joe-10-0472 · Cited by 414
Paul, S. M., & Purdy, R. H. (1992) · PubMed · Cited by 384
Characterization of Kiss1 neurons using transgenic mouse models
Cravo, R. M., Margatho, L. O., Osborne-Lawrence, S., Donato, J., Atkin, S., Bookout, A. L., Rovinsky, S., Frazão, R., Lee, C. E., Gautron, L., et al. (2011) · Neuroscience · doi:10.1016/j.neuroscience.2010.11.022 · Cited by 353
Clauw, D. J. (2009) · The American Journal of Medicine · doi:10.1016/j.amjmed.2009.09.006 · Cited by 350
Exercise therapy for fibromyalgia
Busch, A. J., Webber, S. C., Brachaniec, M., Bidonde, J., Bello-Haas, V. D., Danyliw, A. D., Overend, T. J., Richards, R. S., Sawant, A., & Schachter, C. L. (2011) · Current Pain and Headache Reports · doi:10.1007/s11916-011-0214-2 · Cited by 333
Neurosteroids as novel antidepressants and anxiolytics: GABA-A receptors and beyond
Zorumski, C. F., Paul, S. M., Covey, D. F., & Mennerick, S. (2019) · Neurobiology of Stress · doi:10.1016/j.ynstr.2019.100196 · Cited by 305
Barbaccia, M. L., Roscetti, G., Trabucchi, M., Mostallino, M. C., Concas, A., Purdy, R. H., & Biggio, G. (2008) · Neuroendocrinology · doi:10.1159/000126953 · Cited by 303
Steroid hormones and neurosteroids in normal and pathological aging of the nervous system
Schumacher, M., Weill-Engerer, S., Liere, P., Robert, F., Franklin, R. J. M., Garcia-Segura, L. M., Lambert, J. J., Mayo, W., Melcangi, R. C., Parducz, A., et al. (2003) · Progress in Neurobiology · doi:10.1016/j.pneurobio.2003.09.004 · Cited by 300
Excitatory neuronal connectivity in the barrel cortex
Feldmeyer, D. (2012) · Frontiers in Neuroanatomy · doi:10.3389/fnana.2012.00024 · Cited by 298
Fibromyalgia Pathogenesis and Treatment Options Update
Chinn, S., Caldwell, W., & Gritsenko, K. (2016) · Current Pain and Headache Reports · doi:10.1007/s11916-016-0556-x · Cited by 296
Musazzi, L., Milanese, M., Farisello, P., Zappettini, S., Tardito, D., Barbiero, V. S., Bonifacino, T., Mallei, A., Baldelli, P., Racagni, G., et al. (2010) · PLoS ONE · doi:10.1371/journal.pone.0008566 · Cited by 289
Patchev, V (1996) · Neuropsychopharmacology · doi:10.1016/s0893-133x(96)00096-6 · Cited by 283
Di, S., Malcher-Lopes, R., Marcheselli, V. L., Bazan, N. G., & Tasker, J. G. (2005) · Endocrinology · doi:10.1210/en.2005-0610 · Cited by 282
Role of GABA and Glutamate Circuitry in Hypothalamo‐Pituitary‐Adrenocortical Stress Integration
HERMAN, J. P., MUELLER, N. K., & FIGUEIREDO, H. (2004) · Annals of the New York Academy of Sciences · doi:10.1196/annals.1296.004 · Cited by 282
Venero, C., & Borrell, J. (1999) · European Journal of Neuroscience · doi:10.1046/j.1460-9568.1999.00668.x · Cited by 277
Functional role of local GABAergic influences on the HPA axis
Cullinan, W. E., Ziegler, D. R., & Herman, J. P. (2008) · Brain Structure and Function · doi:10.1007/s00429-008-0192-2 · Cited by 255
Modulation of the GABAA receptor by progesterone metabolites
Callachan, H., Cottrell, G. A., Hather, N. Y., Lambert, J. J., Nooney, J. M., & Peters, J. A. (1987) · Proceedings of the Royal Society of London. Series B. Biological Sciences · doi:10.1098/rspb.1987.0049 · Cited by 252
Karalis, K., Goodwin, G., & Majzoub, J. A. (1996) · Nature Medicine · doi:10.1038/nm0596-556 · Cited by 248
Bäckström, T., Zetterlund, B., Blom, S., & Romano, M. (1984) · Acta Neurologica Scandinavica · doi:10.1111/j.1600-0404.1984.tb07807.x · Cited by 242
Biology and therapy of fibromyalgia. Stress, the stress response system, and fibromyalgia
Martinez-Lavin, M. (2007) · Arthritis Research & Therapy · doi:10.1186/ar2146 · Cited by 234
Trial of SAGE-217 in Patients with Major Depressive Disorder
Gunduz-Bruce, H., Silber, C., Kaul, I., Rothschild, A. J., Riesenberg, R., Sankoh, A. J., Li, H., Lasser, R., Zorumski, C. F., Rubinow, D. R., et al. (2019) · New England Journal of Medicine · doi:10.1056/nejmoa1815981 · Cited by 232
Progesterone therapy in women with complex partial and secondary generalized seizures
Herzog, A. G. (1995) · Neurology · doi:10.1212/wnl.45.9.1660 · Cited by 218
Dubey, A. K., & Plant, T. M. (1985) · Biology of Reproduction · doi:10.1095/biolreprod33.2.423 · Cited by 217
Reduced insular γ‐aminobutyric acid in fibromyalgia
Foerster, B. R., Petrou, M., Edden, R. A. E., Sundgren, P. C., Schmidt‐Wilcke, T., Lowe, S. E., Harte, S. E., Clauw, D. J., & Harris, R. E. (2012) · Arthritis & Rheumatism · doi:10.1002/art.33339 · Cited by 212
Dual-phenotype GABA/glutamate neurons in adult preoptic area: sexual dimorphism and function
Ottem, E. N., Godwin, J. G., Krishnan, S., & Petersen, S. L. (2004) · The Journal of Neuroscience · doi:10.1523/jneurosci.2267-04.2004 · Cited by 201
One year in review 2021: fibromyalgia
Alciati, A., Nucera, V., Masala, I. F., Giallanza, M., La Corte, L., Giorgi, V., Sarzi-Puttini, P., & Atzeni, F. (2021) · Clinical and Experimental Rheumatology · doi:10.55563/clinexprheumatol/gz4i3i · Cited by 200
Hantsoo, L., & Epperson, C. N. (2020) · Neurobiology of Stress · doi:10.1016/j.ynstr.2020.100213 · Cited by 199
The molecular physiology of CRH neurons
Aguilera, G., & Liu, Y. (2012) · Frontiers in Neuroendocrinology · doi:10.1016/j.yfrne.2011.08.002 · Cited by 198
Neurosteroids and GABA-A Receptor Function
Wang, M. (2011) · Frontiers in Endocrinology · doi:10.3389/fendo.2011.00044 · Cited by 195
Progesterone and the premenstrual syndrome: a double blind crossover trial.
Dennerstein, L., Spencer-Gardner, C., Gotts, G., Brown, J. B., Smith, M. A., & Burrows, G. D. (1985) · BMJ · doi:10.1136/bmj.290.6482.1617 · Cited by 192
Responses to laboratory psychosocial stress in postpartum women
Altemus, M., Redwine, L. S., Leong, Y.-M., Frye, C. A., Porges, S. W., & Sue Carter, C. (2001) · Psychosomatic Medicine · doi:10.1097/00006842-200109000-00015 · Cited by 187
Neuroanatomy of the kisspeptin signaling system in mammals: comparative and developmental aspects
Lehman, M. N., Hileman, S. M., & Goodman, R. L. (2013) · Advances in Experimental Medicine and Biology · doi:10.1007/978-1-4614-6199-9_3 · Cited by 180
Neurosteroids: Endogenous allosteric modulators of GABAA receptors
Lambert, J. J., Cooper, M. A., Simmons, R. D. J., Weir, C. J., & Belelli, D. (2009) · Psychoneuroendocrinology · doi:10.1016/j.psyneuen.2009.08.009 · Cited by 180
Chronic pain: lost inhibition?
Henderson, L. A., Peck, C. C., Petersen, E. T., Rae, C. D., Youssef, A. M., Reeves, J. M., Wilcox, S. L., Akhter, R., Murray, G. M., & Gustin, S. M. (2013) · The Journal of Neuroscience · doi:10.1523/jneurosci.0174-13.2013 · Cited by 180
Reddy, D. S., & Jian, K. (2010) · The Journal of Pharmacology and Experimental Therapeutics · doi:10.1124/jpet.110.169854 · Cited by 178
Relationship Between Circulating Cortisol and Testosterone: Influence of Physical Exercise
The University of North Carolina at Chapel Hill University Libraries (2020) · PubMed · doi:10.17615/7407-3780 · Cited by 170
The role of neurosteroids in the pathophysiology and treatment of catamenial epilepsy
Reddy, D. S. (2009) · Epilepsy Research · doi:10.1016/j.eplepsyres.2009.02.017 · Cited by 167
Steroids, Pregnancy and Fetal Development
Solano, M. E., & Arck, P. C. (2020) · Frontiers in Immunology · doi:10.3389/fimmu.2019.03017 · Cited by 164
Testosterone suppression of CRH-stimulated cortisol in men
Rubinow, D. R., Roca, C. A., Schmidt, P. J., Danaceau, M. A., Putnam, K., Cizza, G., Chrousos, G., & Nieman, L. (2005) · Neuropsychopharmacology · doi:10.1038/sj.npp.1300742 · Cited by 163
Ehring, G. R., Kerschbaum, H. H., Eder, C., Neben, A. L., Fanger, C. M., Khoury, R. M., Negulescu, P. A., & Cahalan, M. D. (1998) · The Journal of Experimental Medicine · doi:10.1084/jem.188.9.1593 · Cited by 163
Neurosteroid Withdrawal Model of Perimenstrual Catamenial Epilepsy
Reddy, D. S., Kim, H., & Rogawski, M. A. (2001) · Epilepsia · doi:10.1046/j.1528-1157.2001.10100.x · Cited by 157
Levy, B. H., & Tasker, J. G. (2012) · Frontiers in Cellular Neuroscience · doi:10.3389/fncel.2012.00024 · Cited by 153
Fibromyalgia: Recent Advances in Diagnosis, Classification, Pharmacotherapy and Alternative Remedies
Maffei, M. E. (2020) · International Journal of Molecular Sciences · doi:10.3390/ijms21217877 · Cited by 150
Circadian Rhythm of Salivary Cortisol, 17α-Hydroxyprogesterone, and Progesterone in Healthy Children
Gröschl, M., Rauh, M., & Dörr, H.-G. (2003) · Clinical Chemistry · doi:10.1373/49.10.1688 · Cited by 145
Suppression of the Hypothalamic-Pituitary-Ovarian Axis in Normal Women by Glucocorticoids1
Saketos, M., Sharma, N., & Santoro, N. F. (1993) · Biology of Reproduction · doi:10.1095/biolreprod49.6.1270 · Cited by 144
The role of GABA in the regulation of GnRH neurons
Watanabe, M., Fukuda, A., & Nabekura, J. (2014) · Frontiers in Neuroscience · doi:10.3389/fnins.2014.00387 · Cited by 140
Low Serum Allopregnanolone Is Associated with Symptoms of Depression in Late Pregnancy
Hellgren, C., Åkerud, H., Skalkidou, A., Bäckström, T., & Sundström-Poromaa, I. (2014) · Neuropsychobiology · doi:10.1159/000358838 · Cited by 137
Goldenberg, D. L., Clauw, D. J., Palmer, R. E., & Clair, A. G. (2016) · Mayo Clinic Proceedings · doi:10.1016/j.mayocp.2016.02.002 · Cited by 131
Enhanced anticonvulsant activity of neuroactive steroids in a rat model of catamenial epilepsy
Reddy, D. S., & Rogawski, M. A. (2001) · Epilepsia · doi:10.1046/j.1528-1157.2001.10200.x · Cited by 130
The Role of HPA Axis and Allopregnanolone on the Neurobiology of Major Depressive Disorders and PTSD
Almeida, F. B., Pinna, G., & Barros, H. M. T. (2021) · International Journal of Molecular Sciences · doi:10.3390/ijms22115495 · Cited by 130
Brunton, P. J., McKay, A. J., Ochędalski, T., Piastowska, A., Rębas, E., Lachowicz, A., & Russell, J. A. (2009) · The Journal of Neuroscience · doi:10.1523/jneurosci.0708-09.2009 · Cited by 126
Arout, C. A., Sofuoglu, M., Bastian, L. A., & Rosenheck, R. A. (2018) · Journal of Women s Health · doi:10.1089/jwh.2017.6622 · Cited by 122
Current and Emerging Pharmacotherapy for Fibromyalgia
Tzadok, R., & Ablin, J. N. (2020) · Pain Research and Management · doi:10.1155/2020/6541798 · Cited by 122
Endogenous Circadian Regulation of Female Reproductive Hormones
Rahman, S. A., Grant, L. K., Gooley, J. J., Rajaratnam, S. M. W., Czeisler, C. A., & Lockley, S. W. (2019) · The Journal of Clinical Endocrinology & Metabolism · doi:10.1210/jc.2019-00803 · Cited by 118
Functional organization of the thalamic input to the thalamic reticular nucleus
Lam, Y.-W., & Sherman, S. M. (2011) · The Journal of Neuroscience · doi:10.1523/jneurosci.3073-10.2011 · Cited by 114 · cited 1×
“Excitatory, first order glutamatergic fibers of the VPL projects to SSC and TRN; glutamatergic fibers of the SSC project to first order neurons of VPL and to TRN, and inhibitory GABAergic fibers of the TRN project to VPL (Fig 1) [23].”
BackgroundCrowley, S. K., & Girdler, S. S. (2014) · Psychopharmacology · doi:10.1007/s00213-014-3572-8 · Cited by 111
Foerster, B. R., Nascimento, T. D., DeBoer, M., Bender, M. A., Rice, I. C., Truong, D. Q., Bikson, M., Clauw, D. J., Zubieta, J., Harris, R. E., et al. (2015) · Arthritis & Rheumatology · doi:10.1002/art.38945 · Cited by 105
Kisspeptin neurons from mice to men: similarities and differences
Goodman, R. L., & Lehman, M. N. (2012) · Endocrinology · doi:10.1210/en.2012-1550 · Cited by 103
Acute and Chronic Pain Processing in the Thalamocortical System of Humans and Animal Models
Groh, A., Krieger, P., Mease, R. A., & Henderson, L. (2018) · Neuroscience · doi:10.1016/j.neuroscience.2017.09.042 · Cited by 101
Hormonal, cardiovascular, and subjective responses to acute stress in smokers
Childs, E., & de Wit, H. (2009) · Psychopharmacology · doi:10.1007/s00213-008-1359-5 · Cited by 97
Fibromyalgia: the prototypical central sensitivity syndrome
Boomershine, C. (2015) · Current Rheumatology Reviews · doi:10.2174/1573397111666150619095007 · Cited by 96
Neurosteroid Actions in Memory and Neurologic/Neuropsychiatric Disorders
Ratner, M. H., Kumaresan, V., & Farb, D. H. (2019) · Frontiers in Endocrinology · doi:10.3389/fendo.2019.00169 · Cited by 96 · cited 1×
“Such a prediction is consistent with reported correlations between neurosteroids and a series of neurological disorders, including migraine, postpartum-depression, epilepsy, anxiety, cognitive and psychiatric disorders [56,144,145].”
ResultNoradrenaline is a stress-associated metaplastic signal at GABA synapses
Inoue, W., Baimoukhametova, D. V., Füzesi, T., Cusulin, J. I. W., Koblinger, K., Whelan, P. J., Pittman, Q. J., & Bains, J. S. (2013) · Nature Neuroscience · doi:10.1038/nn.3373 · Cited by 94
Chapter 2 Hypothalamic Neural Systems Controlling the Female Reproductive Life Cycle
(2009) · International Review of Cell and Molecular Biology · doi:10.1016/s1937-6448(08)02002-9 · Cited by 93
Thibier, M., & Rolland, O. (1976) · Theriogenology · doi:10.1016/0093-691x(76)90168-0 · Cited by 92
Huang, B., Lu, M., Jolly, M. K., Tsarfaty, I., Onuchic, J., & Ben-Jacob, E. (2014) · Scientific Reports · doi:10.1038/srep06449 · Cited by 91
Cortisol and testosterone dynamics following exhaustive endurance exercise
Anderson, T., Lane, A. R., & Hackney, A. C. (2016) · European Journal of Applied Physiology · doi:10.1007/s00421-016-3406-y · Cited by 91
Biological feedback control-Respect the loops
El-Samad, H. (2021) · Cell Systems · doi:10.1016/j.cels.2021.05.004 · Cited by 90
HPG-axis hormones during puberty: a study on the association with hypothalamic and pituitary volumes
Peper, J. S., Brouwer, R. M., van Leeuwen, M., Schnack, H. G., Boomsma, D. I., Kahn, R. S., & Hulshoff Pol, H. E. (2010) · Psychoneuroendocrinology · doi:10.1016/j.psyneuen.2009.05.025 · Cited by 88 · cited 1×
“It regulates reproductive activities and functions in both female and male individuals through the release into the plasma of gonadal steroids [32].”
BackgroundHenriksen, R., Groothuis, T. G. G., & Rettenbacher, S. (2011) · PLoS ONE · doi:10.1371/journal.pone.0023824 · Cited by 86
Evaluation of Hill Slopes and Hill Coefficients when the Saturation Binding or Velocity is not Known
ENDRENYI, L., KWONG, F. H. F., & FAJSZI, C. (1975) · European Journal of Biochemistry · doi:10.1111/j.1432-1033.1975.tb03931.x · Cited by 85
Gangisetty, O., & Reddy, D. S. (2010) · Neuroscience · doi:10.1016/j.neuroscience.2010.07.037 · Cited by 84
Feed-forward inhibition as a buffer of the neuronal input-output relation
Ferrante, M., Migliore, M., & Ascoli, G. A. (2009) · Proceedings of the National Academy of Sciences · doi:10.1073/pnas.0904784106 · Cited by 83
Daily Fluctuations of Progesterone and Testosterone Are Associated With Fibromyalgia Pain Severity
Schertzinger, M., Wesson-Sides, K., Parkitny, L., & Younger, J. (2018) · The Journal of Pain · doi:10.1016/j.jpain.2017.11.013 · Cited by 79
(2006) · PubMed · Cited by 77
Part of pain labelled neuropathic in rheumatic disease might be rather nociplastic
Bailly, F., Cantagrel, A., Bertin, P., Perrot, S., Thomas, T., Lansaman, T., Grange, L., Wendling, D., Dovico, C., & Trouvin, A.-P. (2020) · RMD Open · doi:10.1136/rmdopen-2020-001326 · Cited by 73
Neurosteroids and GABAergic signaling in health and disease
MacKenzie, G., & Maguire, J. (2013) · bmc · doi:10.1515/bmc-2012-0033 · Cited by 71
Mtchedlishvili, Z., Bertram, E. H., & Kapur, J. (2001) · The Journal of Physiology · doi:10.1111/j.1469-7793.2001.00453.x · Cited by 71
Animal models of fibromyalgia: What is the best choice?
Brum, E. S., Becker, G., Fialho, M. F. P., & Oliveira, S. M. (2022) · Pharmacology & Therapeutics · doi:10.1016/j.pharmthera.2021.107959 · Cited by 71
Haage, D., & Johansson, S. (1999) · Journal of Neurophysiology · doi:10.1152/jn.1999.82.1.143 · Cited by 69
Realising the therapeutic potential of neuroactive steroid modulators of the GABAA receptor
Belelli, D., Hogenkamp, D., Gee, K. W., & Lambert, J. J. (2020) · Neurobiology of Stress · doi:10.1016/j.ynstr.2019.100207 · Cited by 67
Tuveri, A., Paoletti, A. M., Orrù, M., Melis, G. B. B., Marotto, M. F., Zedda, P., Marrosu, F., Sogliano, C., Marra, C., Biggio, G., et al. (2008) · Epilepsia · doi:10.1111/j.1528-1167.2008.01555.x · Cited by 63
Wang, L., & Moenter, S. M. (2020) · Neuroendocrinology · doi:10.1159/000503006 · Cited by 63
Windows into stress: a glimpse at emerging roles for CRH PVN neurons
Rasiah, N. P., Loewen, S. P., & Bains, J. S. (2023) · Physiological Reviews · doi:10.1152/physrev.00056.2021 · Cited by 62
Neurosteroid modulation of allopregnanolone and GABA effect on the GABA-A receptor
Strömberg, J., Haage, D., Taube, M., Bäckström, T. C., & Lundgren, P. (2006) · Neuroscience · doi:10.1016/j.neuroscience.2006.07.031 · Cited by 59
Miller, B. H., & Gore, A. C. (2002) · Endocrinology · doi:10.1210/en.2002-220346 · Cited by 59
Liu, Q., Chang, Y. H., Schaffner, A. E., Smith, S. V., & Barker, J. L. (2002) · Journal of Neurophysiology · doi:10.1152/jn.00942.2001 · Cited by 58
Physical therapy modalities for treating fibromyalgia
Araújo, F. M., & DeSantana, J. M. (2019) · F1000Research · doi:10.12688/f1000research.17176.1 · Cited by 57
Stress biomarkers in individuals with fibromyalgia syndrome: a systematic review with meta-analysis
Beiner, E., Lucas, V., Reichert, J., Buhai, D.-V., Jesinghaus, M., Vock, S., Drusko, A., Baumeister, D., Eich, W., Friederich, H.-C., et al. (2023) · Pain · doi:10.1097/j.pain.0000000000002857 · Cited by 56 · cited 1×
“Alteration of endocrine stress biomarkers in consolidated FM conditions has been questioned [13], but on the other hand, FM patients show hypothalamus–pituitary–adrenocortical axis (HPA) dysfunction [14,15].”
BackgroundSingh, L., Kaur, A., Bhatti, M. S., & Bhatti, R. (2019) · Neurochemical Research · doi:10.1007/s11064-019-02805-5 · Cited by 55
Somvanshi, P. R., Mellon, S. H., Yehuda, R., Flory, J. D., Makotkine, I., Bierer, L., Marmar, C., Jett, M., & Doyle, F. J. (2020) · American Journal of Physiology-Endocrinology and Metabolism · doi:10.1152/ajpendo.00398.2019 · Cited by 55
A structural classification of candidate oscillatory and multistationary biochemical systems
Blanchini, F., Franco, E., & Giordano, G. (2014) · Bulletin of Mathematical Biology · doi:10.1007/s11538-014-0023-y · Cited by 54
Self-citationTurner, A. I., Hemsworth, P. H., Canny, B. J., & Tilbrook, A. J. (1999) · Biology of Reproduction · doi:10.1095/biolreprod61.3.614 · Cited by 54
Etches, R. J. (1979) · Poultry Science · doi:10.3382/ps.0580211 · Cited by 53
Stanton, S. J., Mullette-Gillman, O. A., & Huettel, S. A. (2011) · Physiology & Behavior · doi:10.1016/j.physbeh.2011.07.009 · Cited by 48
Kisspeptin-neuron control of LH pulsatility and ovulation
Stevenson, H., Bartram, S., Charalambides, M. M., Murthy, S., Petitt, T., Pradeep, A., Vineall, O., Abaraonye, I., Lancaster, A., Koysombat, K., et al. (2022) · Frontiers in Endocrinology · doi:10.3389/fendo.2022.951938 · Cited by 48
Pluchino, N., Ninni, F., Stomati, M., Freschi, L., Casarosa, E., Valentino, V., Luisi, S. V., Genazzani, A. D., Potì, E., & Genazzani, A. R. (2008) · Maturitas · doi:10.1016/j.maturitas.2008.02.004 · Cited by 44
Effect of adrenal steroids on testosterone and luteinizing hormone secretion in the ram
JUNIEWICZ, P. E., JOHNSON, B. H., & BOLT, D. J. (1987) · Journal of Andrology · doi:10.1002/j.1939-4640.1987.tb02430.x · Cited by 43
Hormonal pertubations in fibromyalgia syndrome
NEECK, G., & RIEDEL, W. (1999) · Annals of the New York Academy of Sciences · doi:10.1111/j.1749-6632.1999.tb07657.x · Cited by 43
Sex defines the age dependence of endogenous ACTH-cortisol dose responsiveness
Keenan, D. M., Roelfsema, F., Carroll, B. J., Iranmanesh, A., & Veldhuis, J. D. (2009) · American Journal of Physiology-Regulatory, Integrative and Comparative Physiology · doi:10.1152/ajpregu.00200.2009 · Cited by 41
Segebladh, B., Bannbers, E., Moby, L., Nyberg, S., Bixo, M., Bäckström, T. C., & Poromaa, I. S. (2013) · Archives of Women s Mental Health · doi:10.1007/s00737-013-0327-1 · Cited by 40
Chloride dynamics alter the input-output properties of neurons
Currin, C. B., Trevelyan, A. J., Akerman, C. J., & Raimondo, J. V. (2020) · PLOS Computational Biology · doi:10.1371/journal.pcbi.1007932 · Cited by 38
Fanelli, F., Cantù, M., Temchenko, A., Mezzullo, M., Lindner, J. M., Peitzsch, M., Hawley, J. M., Bruce, S., Binz, P.-A., Ackermans, M. T., et al. (2022) · Clinical Chemistry and Laboratory Medicine (CCLM) · doi:10.1515/cclm-2021-1028 · Cited by 36
Thalamic reticular nucleus in the thalamocortical loop
Takata, N. (2020) · Neuroscience Research · doi:10.1016/j.neures.2019.12.004 · Cited by 35
Sun, J.-Y., Zhao, S.-J., Wang, H.-B., Hou, Y.-J., Mi, Q.-J., Yang, M.-F., Yuan, H., Ni, Q.-B., Sun, B.-L., & Zhang, Z.-Y. (2021) · Translational Stroke Research · doi:10.1007/s12975-021-00906-4 · Cited by 34
Gender and Neurosteroids: Implications for Brain Function, Neuroplasticity and Rehabilitation
Raciti, L., Formica, C., Raciti, G., Quartarone, A., & Calabrò, R. S. (2023) · International Journal of Molecular Sciences · doi:10.3390/ijms24054758 · Cited by 33
Is There a Role for Opioids in the Treatment of Fibromyalgia?
Littlejohn, G. O., Guymer, E. K., & Ngian, G. (2016) · Pain Management · doi:10.2217/pmt-2016-0012 · Cited by 32
Ullah, R., Shen, Y., Zhou, Y.-D., Huang, K., Fu, J.-F., Wahab, F., & Shahab, M. (2016) · Neuropeptides · doi:10.1016/j.npep.2016.05.004 · Cited by 30
Nik, A. M., Pressly, B., Singh, V., Antrobus, S., Hulsizer, S., Rogawski, M. A., Wulff, H., & Pessah, I. N. (2017) · Molecular Pharmacology · doi:10.1124/mol.117.108563 · Cited by 30
Neurosteroids and neuropathic pain management: Basic evidence and therapeutic perspectives
Meyer, L., Taleb, O., Patte-Mensah, C., & Mensah-Nyagan, A.-G. (2019) · Frontiers in Neuroendocrinology · doi:10.1016/j.yfrne.2019.100795 · Cited by 30
The expression of GABAA receptor α2 subunit is upregulated by testosterone in rat cerebral cortex
Zhang, L., Chang, Y. H., Feldman, A. N., Ma, W., Lahjouji, F., Barker, J. L., Hu, Q., Maric, D., Li, B.-S., Li, W., et al. (1999) · Neuroscience Letters · doi:10.1016/s0304-3940(99)00193-7 · Cited by 28
A "Timed" Kiss Is Essential for Reproduction: Lessons from Mammalian Studies
Putteeraj, M., Soga, T., Ubuka, T., & Parhar, I. S. (2016) · Frontiers in Endocrinology · doi:10.3389/fendo.2016.00121 · Cited by 28
Aggregates of Monotonic Step Response Systems: A Structural Classification
Blanchini, F., Samaniego, C. C., Franco, E., & Giordano, G. (2018) · IEEE Transactions on Control of Network Systems · doi:10.1109/tcns.2017.2746343 · Cited by 26
Self-citationRunnebaum, B., Rieben, W. K., Münstermann, A.-M. B.-V., & Zander, J. (1972) · European Journal of Endocrinology · doi:10.1530/acta.0.0690731 · Cited by 25
Schloemer, N., Lenz, M., Tegenthoff, M., Dinse, H. R., & Höffken, O. (2020) · Scientific Reports · doi:10.1038/s41598-020-79389-6 · Cited by 25
Nyongesa, A. W., Patel, N. B., Onyango, D. W., et al. (2007) · Journal of Ethnopharmacology · doi:10.1016/j.jep.2007.11.022 · Cited by 24
Progesterone and Cortisol Levels in Blood and Hair of Wild Pregnant Red Deer (Cervus Elaphus) Hinds
Ventrella, D., Elmi, A., Bertocchi, M., Aniballi, C., Parmeggiani, A., Govoni, N., & Bacci, M. L. (2020) · Animals · doi:10.3390/ani10010143 · Cited by 24
Impact of endogenous and exogenous progesterone exposure on stress biomarkers: a systematic review
Stadler, A., Weidlinger, S., & Stute, P. (2019) · Climacteric · doi:10.1080/13697137.2019.1622085 · Cited by 23 · cited 1×
“Available data indicate that weak correlations are observed for circadian or follicular-to-luteal fluctuations of these axes, while significant negative correlations are found for wider fluctuations under stress conditions, perimenstrual, pregnancy, or pharmacological treatments [71].”
BackgroundFitzgerald, C. T., & Carter, L. P. (2011) · Medical Hypotheses · doi:10.1016/j.mehy.2011.05.031 · Cited by 22
Somvanshi, P. R., & Venkatesh, K. V. (2013) · Encyclopedia of Systems Biology · doi:10.1007/978-1-4419-9863-7_946 · Cited by 22
The relationship between GABA and stress: ’it’s complicated’
Maguire, J. (2018) · The Journal of Physiology · doi:10.1113/jp275937 · Cited by 21
Flores-Ramos, M., Alcauter, S., López-Titla, M., Bernal-Santamaría, N., Calva-Coraza, E., & Edden, R. A. E. (2019) · Journal of Affective Disorders · doi:10.1016/j.jad.2018.08.033 · Cited by 21
(2019) · PubMed · Cited by 20
Alciati, A., Cirillo, M., Masala, I. F., Sarzi‐Puttini, P., & Atzeni, F. (2021) · Stress and Health · doi:10.1002/smi.2992 · Cited by 20
(2009) · PubMed · Cited by 19
Donoso, A. O., & Banzan, A. M. (1986) · Psychoneuroendocrinology · doi:10.1016/0306-4530(86)90004-1 · Cited by 19
Chatterton, R. T., Kazer, R. R., & Rebar, R. W. (1991) · Fertility and Sterility · doi:10.1016/s0015-0282(16)54556-7 · Cited by 19
One year in review 2021: fibromyalgia
Alciati, A., Nucera, V., Masala, I. F., Giallanza, M., Corte, L. L., Giorgi, V., Sarzi‐Puttini, P., & Atzeni, F. (2021) · Zenodo (CERN European Organization for Nuclear Research) · doi:10.5281/zenodo.5811972 · Cited by 19
Junkermann, H., Mangold, H., Vecsei, P., et al. (1982) · European Journal of Endocrinology · doi:10.1530/acta.0.1010098 · Cited by 18
Demori, I., Molinari, E., Rapallo, F., Mucci, V., Marinelli, L., Losacco, S., & Burlando, B. (2022) · Healthcare · doi:10.3390/healthcare10101975 · Cited by 16
Self-citationFibromyalgia patients should always be screened for post-traumatic stress disorder
Nardi, A. E., Karam, E. G., & Carta, M. G. (2020) · Expert Review of Neurotherapeutics · doi:10.1080/14737175.2020.1794824 · Cited by 15
Westergard, T., Salari, R., Martin, J. V., & Brannigan, G. H. (2015) · PLoS ONE · doi:10.1371/journal.pone.0139072 · Cited by 14
Caufriez, A., Leproult, R., & Copinschi, G. (2017) · Chronobiology International · doi:10.1080/07420528.2017.1381971 · Cited by 14
Demori, I., Giordano, G., Mucci, V., Losacco, S., Marinelli, L., Massobrio, P., Blanchini, F., & Burlando, B. (2022) · Journal of Computational Neuroscience · doi:10.1007/s10827-022-00826-8 · Cited by 14
Self-citationFDA approves first oral drug for postpartum depression, but rejects it for major depressive disorder
Mullard, A. (2023) · Nature Reviews Drug Discovery · doi:10.1038/d41573-023-00134-5 · Cited by 14
ELSNER, C. W., BUSTER, J. E., PRESTON, D. L., & KILLAM, A. P. (1979) · The Journal of Clinical Endocrinology & Metabolism · doi:10.1210/jcem-49-1-30 · Cited by 10
Mucci, V., Demori, I., Browne, C. J., Deblieck, C., & Burlando, B. (2023) · Biomedicines · doi:10.3390/biomedicines11020615 · Cited by 9
Self-citationHypothalamic-pituitary axis response to a 0.25-MG dexamethasone test in women with fibromyalgia
González-Vives, S., Díaz-Marsá, M., De la Vega, I., Palomares, N., Vázquez, S., López-Villatoro, J. M., Palomo, T., & Carrasco, J. L. (2020) · Stress · doi:10.1080/10253890.2019.1678024 · Cited by 8 · cited 1×
“Alteration of endocrine stress biomarkers in consolidated FM conditions has been questioned [13], but on the other hand, FM patients show hypothalamus–pituitary–adrenocortical axis (HPA) dysfunction [14,15].”
BackgroundRF9 Rescues Cortisol-Induced Repression of Testosterone Levels in Adult Male Macaques
Ullah, R., Naz, R., Batool, A., Wazir, M., Rahman, T. U., Nabi, G., Wahab, F., Fu, J., & Shahab, M. (2021) · Frontiers in Physiology · doi:10.3389/fphys.2021.630796 · Cited by 8
New depression drug zuranolone one step closer to FDA ruling
Carvalho, T. (2023) · Nature Medicine · doi:10.1038/d41591-023-00032-8 · Cited by 6
A general hypothesis of multistable systems in pathophysiology.
Burlando, B. (2022) · F1000Research · doi:10.12688/f1000research.123183.3 · Cited by 5
Self-citationSerum Cortisol, Progesterone and Total Antioxidant Status of Students Pre-and Post-Examination
Awalu1, J. C., Onyenekwe1, C. C., Ukibe1, N. R., Ahaneku2, J. E., Ejemete3, S. E., Udeh2, T., & Ukibe4, E. G. (2020) · Indian Journal of Public Health Research & Development · doi:10.37506/ijphrd.v11i12.13238 · Cited by 3
Optogenetics studies of kisspeptin neurons
Ivanova, D., & O’Byrne, K. T. (2023) · Peptides · doi:10.1016/j.peptides.2023.170961 · Cited by 3
Impact of Fibromyalgia on Female Infertility
Koné, M. C., Kambiré, N. A., & Ahoua, Y. (2021) · Open Journal of Epidemiology · doi:10.4236/ojepi.2021.114037 · Cited by 2
A general hypothesis of multistable systems in pathophysiology
Burlando, B. (2022) · F1000Research · doi:10.12688/f1000research.123183.1 · Cited by 1
Self-citationA general hypothesis of multistable systems in pathophysiology
Burlando, B. (2022) · F1000Research · doi:10.12688/f1000research.123183.2
Self-citationRunnebaum, B., Holzmann, K., Münstermann, A.-M. B.-V., & Zander, J. (1972) · Acta Endocrinologica · doi:10.1530/acta.0.0690739
Cited by
Amzolini, A. M., Neagoe, C. D., Avramescu, T. E., Mitrea, A., Trăistaru, R., Micu, E. S., Ianoși, S. L., & Matei, D. V. (2024) · Healthcare · doi:10.3390/healthcare12191956 · Cited by 8
Riquelme-Aguado, V., González-Álvarez, M. E., Di‐Bonaventura, S., Rodríguez‐Lagos, L., Campo, A. Z.-D., Gómez‐Esquer, F., Díaz‐Gil, G., & Crujera, A. G. (2025) · European Journal of Pain · doi:10.1002/ejp.70201 · Cited by 8
“Although its aetiology remains unclear, evidence supports a multifactorial origin involving central sensitisation (Or-Borichev et al. 2025), neuroendocrine dysfunction (Demori et al. 2024), and immune alterations (Nizzero et al. 2025).”
Stroman, P. W., Staud, R. M., & Pukall, C. F. (2025) · PLoS ONE · doi:10.1371/journal.pone.0316672 · Cited by 10
Psychosomatic Disorders, Epigenome, and Gut Microbiota
Abdolmaleky, H. M., Pirani, A., & Pettinato, G. (2025) · Cells · doi:10.3390/cells14241959 · Cited by 6
“…resulting from stress can be categorized under this umbrella owing to overlapping mechanisms, including disruptions in the hypothalamic–pituitary–adrenal (HPA) axis [5,6], autonomic balance [7], and immune function [8,9] accompanied with abnormal changes in the gut microbiota (GM) composition [10].”
Mantle, D., Domingo, J. C., Golomb, B. A., & Castro‐Marrero, J. (2025) · International Journal of Molecular Sciences · doi:10.3390/ijms26189044 · Cited by 5
“There is also some evidence of altered hormone levels in FM and long COVID, although this is less well established [108,109].”
Metadata
- Authors
- Demori, I., Losacco, S., Giordano, G., Mucci, V., Blanchini, F., & Burlando, B.
- Affiliations
- University of Genoa (IT)
- University of Trento (IT)
- Western Sydney University (AU)
- University of Udine (IT)
- Corresponding author
- Giordano, Giulia
- Venue
- PLOS ONE
- Publisher
- Public Library of Science (PLoS)
- Published
- 2024-07-11
- Volume
- 19
- Issue
- 7
- Pages
- e0303573
- ISSN
- 1932-6203 (ISSN-L)
- PMC
- PMC11238986
- OpenAlex
- W4400527963
- Semantic Scholar
- 7cbfba1b61835ded046575f4481ce8fbdb946b50
- Cited by
- 14
- References
- 166
- Citations by year
- 2026: 5 · 2025: 7 · 2024: 2
- FWCI
- 4.09
- Type
- journal article
- Language
- en
- Open access
- gold
- doi.org
- Licence
- Locations
- PLoS ONE (publishedVersion, cc-by)
- PubMed Central (publishedVersion, cc-by)
- PubMed (publishedVersion)
- Institutional Research Information System (Università degli Studi di Trento) (submittedVersion, cc-by)
- DOAJ (DOAJ: Directory of Open Access Journals) (submittedVersion, cc-by-sa)
- CINECA IRIS Institutial Research Information System (University of Genoa) (submittedVersion, other-oa)
- Funders
- HORIZON EUROPE European Research Council (101076926)
- Topics
- Health Sciences › Medicine › Psychiatry and Mental health › Fibromyalgia and Chronic Fatigue Syndrome Research
- Health Sciences › Medicine › Physiology (medical) › Pain Mechanisms and Treatments
- Life Sciences › Neuroscience › Behavioral Neuroscience › Stress Responses and Cortisol
- Keywords
- fibromyalgia, pathogenesis, multistability, bistability, bifurcation, hypothalamic-pituitary-gonadal axis, hypothalamic-pituitary-adrenal axis, allopregnanolone, neurosteroids, cortisol, thalamocortical loop, ventroposterolateral thalamic nucleus, thalamic reticular nucleus, primary somatosensory cortex, GABAergic neurotransmission, glutamatergic neurotransmission, stress, sex differences, chronic pain
- MeSH terms
- Female, Fibromyalgia, Humans, Hypothalamo-Hypophyseal System, Models, Biological, Neurosecretory Systems, Pituitary-Adrenal System
About these checks
Registry, retraction, Cites and statistics results are computed, not judged, with one exception: a printed reference that no index lists is read once by a model before it counts as a citation error. Claims are extracted by a model and kept only when their quote appears verbatim in the text; each cited source is then checked, with a model’s help, for whether it says what the claim relies on. Those verdicts can be wrong — read the claim’s quote and the cited source before relying on one.
The claim verdicts this report counts are experimental: their accuracy is not yet measured.
A language model drew the claims from the paper on 2026-10-10, under version 3 of the claim definition (model deepseek-v4.1-flash, prompt extract-v3).
A second model labelled each claim on 2026-10-10 (model jev-1.13-20260917, definition revision gold-guideline-v0.2).
Cited sources are checked with a language model’s help (gpt-6-sol).
Statistics and arithmetic are recomputed, not judged.
Confidence bands are shown only for fields calibrated on our annotated test set. None is calibrated yet, so no band is shown.
What counts as a claim ›How we measure confidence ›How we check this ›
Are you an author, or do you see a problem with this page? Request a review
Data sources
Bibliographic data: Semantic Scholar, OpenAlex, Crossref.
Contains information from the Semantic Scholar Academic Graph Datasets, made available under the ODC Attribution License (ODC-BY 1.0).
Semantic Scholar’s data is described in: Kinney, R., et al. (2023). The Semantic Scholar Open Data Platform. arXiv:2301.10140.
