

The DOI matches its Crossref record; 163 of the 228 references it cites were found in a registry or an index; 189 of the 244 sources its claims cite were checked for support.
Mechanisms of Action of Hematopoietic Transcription Factor PU.1 in Initiation of T-Cell Development
Open accessAbstract
PU.1 is an ETS-family transcription factor that plays a broad range of roles in hematopoiesis. A direct regulator of myeloid, dendritic-cell, and B cell functional programs, and a well-known antagonist of terminal erythroid cell differentiation, it is also expressed in the earliest stages of T-cell development of each cohort of intrathymic pro-T cells. Its expression in this context appears to give T-cell precursors initial, transient access to myeloid and dendritic cell developmental competence and therefore to represent a source of antagonism or delay of T-cell lineage commitment. However, it has remained uncertain until recently why T-cell development is also intensely dependent upon PU.1. Here, we review recent work that sheds light on the molecular biology of PU.1 action across the genome in pro-T cells and identifies the genes that depend on PU.1 for their correct regulation. This work indicates modes of chromatin engagement, pioneering, and cofactor recruitment ("coregulator theft") by PU.1 as well as gene network interactions that not only affect specific target genes but also have system-wide regulatory consequences, amplifying the impact of PU.1 beyond its own direct binding targets. The genes directly regulated by PU.1 also suggest a far-reaching transformation of cell biology and signaling potential between the early stages of T-cell development when PU.1 is expressed and when it is silenced. These cell-biological functions can be important to distinguish fetal from adult T-cell development and have the potential to illuminate aspects of thymic function that have so far remained the most mysterious.
Overview
AI snapshot
Written from the paper’s full text.
TL;DR
PU.1 is transiently expressed in early pro-T cells, where it acts as a pioneer/cofactor-redistributing transcription factor that supports proliferation, delays commitment, and maintains a myeloid/dendritic-competence window constrained by Notch signaling. Its role is ontogenically scaled: largely dispensable in first-wave fetal T cells but important for later fetal and adult T-cell development.
Key findings
- PU.1 binds >30,000 genomic sites in the earliest pro-T cells, declining to ~5,000 sites by T-lineage commitment; its motifs are highly enriched at chromatin sites that lose accessibility during commitment, and acute PU.1 deletion leaves many of these sites less open.
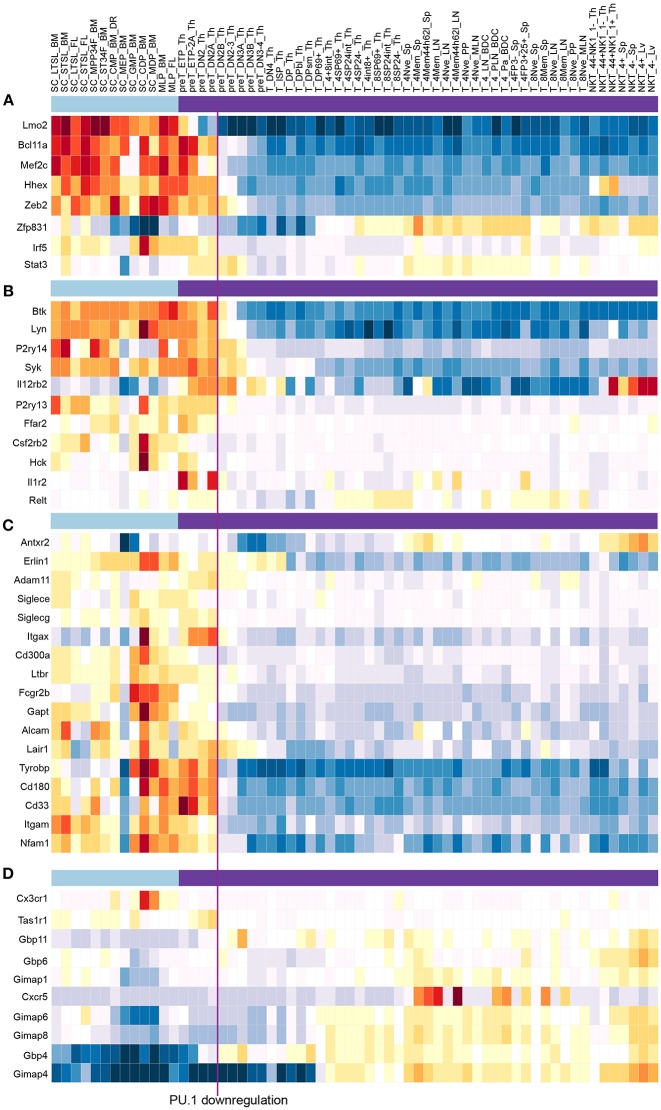
- Within the T-cell pathway, PU.1 slows differentiation while supporting proliferation: PU.1-disrupted precursors underwent fewer cycles and a larger fraction progressed to DN3 over the same absolute time; high-confidence targets include activated genes such as Mef2c, Lmo2, Bcl11a, and Hhex, and repressed genes such as E2f2.
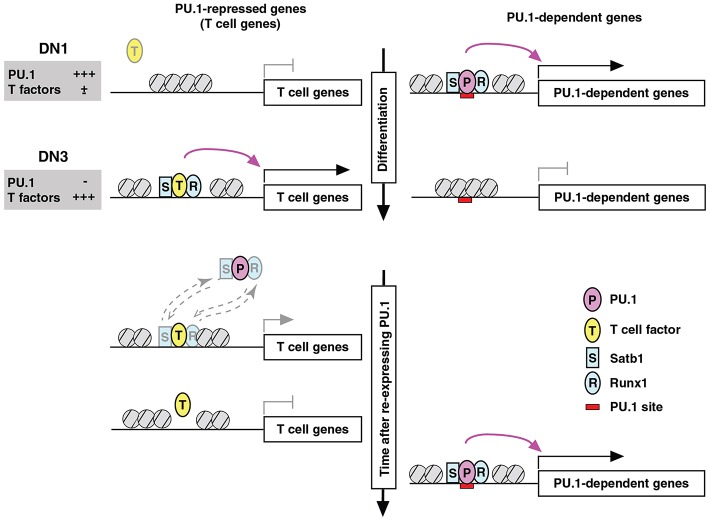
- PU.1 directly regulates many signaling/cell-biology genes—cytokine receptors, chemokine receptors, tyrosine kinases, G-protein-coupled receptors, adhesion and cytoskeletal molecules—more than transcription factor genes, and can repress indirectly by “coregulator theft,” redistributing Runx1 and Satb1 away from other functional sites.
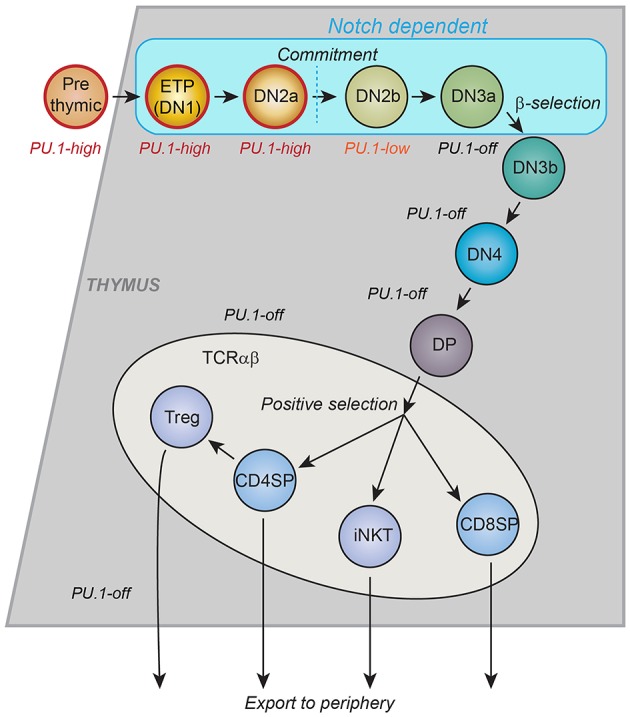
- Ontogeny: first-wave fetal T cells tolerate ~5-fold reduced PU.1 almost unchanged, whereas later fetal hematopoietic stem/progenitor cells show severe T-cell defects; the PU.1 phase lasts >10 days in young adult thymocytes but may last only 1–2 days in many first-wave fetal thymocytes.
Methods
- Review/synthesis of recent mouse T-cell development studies, mostly postnatal thymus or late fetal progenitors, using primary pro-T cells, OP9-DL1/DL4 stromal co-cultures, and the Scid.adh.2C2 pro-T-like cell line.
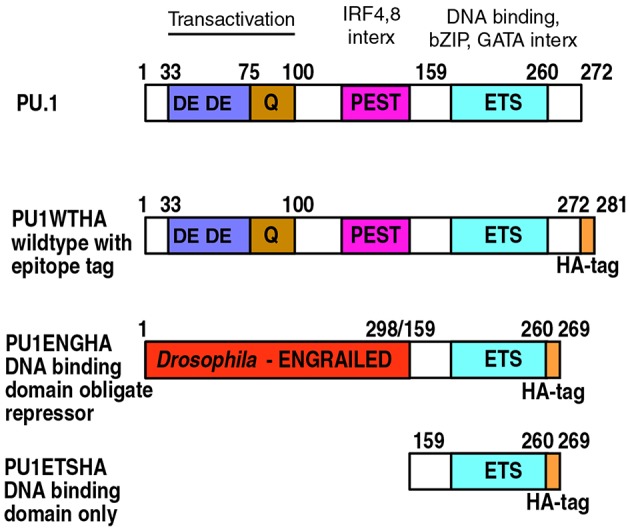
- Gain- and loss-of-function perturbations: retroviral PU.1 overexpression, Cre-mediated Spi1 deletion, Cas9/sgRNA Spi1 disruption, and dominant-negative PU.1-ENG; readouts include ChIP-seq, ATAC-seq, transcriptome, proteomics, and GO/PANTHER pathway analyses.
- High-confidence PU.1 target genes were defined as those showing reciprocal responses in gain- and loss-of-function perturbations within the DN2a–DN2b developmental interval.
Limitations
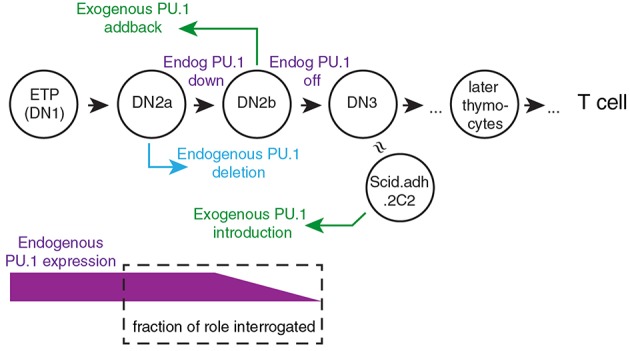
- Stated: biochemical mechanisms of PU.1/Notch effects remain to be fully defined; PU.1 small-molecule inhibitors have not yet been tested in normal T-cell development; long PU.1 protein half-life and asynchronous deletion make loss-of-function effects weak at <2 days and confounded by developmental progression at later timepoints.
- Stated: gain-of-function overexpression can inhibit Notch signaling and produce nonlinear, switch-like transdifferentiation, so some effects may be high-dose artifacts; Scid.adh.2C2 cells do not fully restore the ETP/DN2a chromatin landscape.
- Evident: the review is largely based on mouse systems and in vitro cultures, which the authors note may lack normal thymic environmental molecules; PU.1-high early stages are rare and difficult to study directly in vivo.
Model-written summary. Check it against the paper before relying on it.
Integrity signals
Registry
Cites
Statistics
Figures
Verification
Claims the paper makes
71 Partly supported · 54 Own interpretation · 39 Supported · 19 No basis given · 12 Own result · 7 No full text of the sources · 4 Mixed support · 3 Supported so far · 3 Own method · 2 Couldn’t confirm · 2 Not checked yet · 1 Not supported · accuracy not yet measured
Some cited sources support this claim and some don’t — read each source’s verdict below.
In the paper
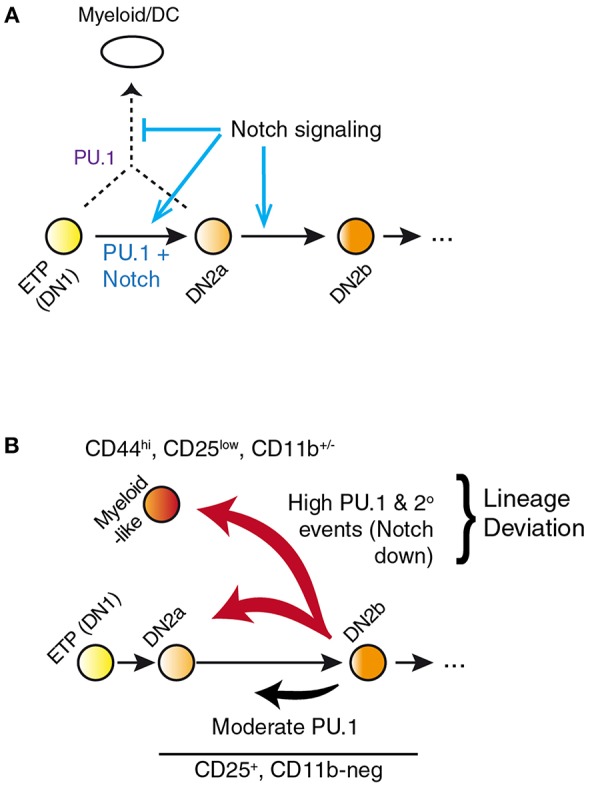
“Even artificially high-level PU.1 could only redirect the differentiation of the cells to myeloid or dendritic fates if Notch signaling were reduced (49, 50, 58).”
§ Mechanisms of Action of Hematopoietic Transcription Factor PU.1 in Initiation of T-Cell Development > Introduction > PU.1 as an Obstacle to T-Cell Lineage Commitment
What the sources say
- Partly supportedcites [49] Franco, 2006, Notch/Delta signaling constrains reengineering of pro-T cells by PU.1 sourceExperimental — accuracy not yet measured
The paper reports that Notch/Delta signaling prevents PU.1-driven myeloid diversion in T-lineage-specified pro-T cells (p. 1; Discussion, p. 5). But the Results (p. 4) show that earlier Thy-1-negative precursors generated myeloid-like cells after PU.1 expression even with Notch/Delta signaling. Thus the claim’s unqualified “only if” does not hold for all the cells studied. (LLM, conf=0.88)
- Supportedcites [50] Laiosa, 2006, Reprogramming of committed T cell progenitors to macrophages and dendritic cells by C/EBPα and PU.1 transcription factors source
The Results (page unavailable) report that Notch signaling completely inhibited PU.1-induced reprogramming of pre-T cells, while the Discussion says activated Notch prevented PU.1 from upregulating Mac-1. The paper also reports that coexpressing C/EBPα largely overcame this inhibition; the claim is supported for PU.1 acting alone. (LLM, conf=0.90)
- Disputedcites [58] Del Real, 2013, Architecture of a lymphomyeloid developmental switch controlled by PU.1, Notch and Gata3 sourceExperimental — accuracy not yet measured
The section ‘Pro-T cells with high levels of PU.1 protein are able to resist Mac1 upregulation in the presence of Notch signaling’ (page not provided) says Notch reduces the proportion of cells showing myeloid diversion, but Mac1 could still be induced at the highest PU.1 levels while Notch ligand was present. Thus, reduced Notch signaling was not an absolute requirement, contrary to ‘only if.’ (LLM, conf=0.87)
Checked by a reasoning model — may be wrong.
hedgedconditional- Asserted: passes — The authors put it forward as true.
- Checkable: passes — It can be checked against evidence.
- Load-bearing: passes — The paper’s conclusions depend on it.
- Based: passes — The paper gives a reason why it holds.
- Partly supported
Some cited sources support this claim and some don’t — read each source’s verdict below.
In the paper
“In primary pro-T cells and Scid.adh.2C2 cells, highly overexpressed PU.1 appears to inhibit Notch signaling, as measured by downregulation of Notch target genes and even Notch1 itself.”
§ Mechanisms of Action of Hematopoietic Transcription Factor PU.1 in Initiation of T-Cell Development > Defining the PU.1 Regulome in Early T-cell Precursors > Developmental Challenges: Implications of a Gene Regulatory Network Switch
What the sources say
- Disputedcites [49] Franco, 2006, Notch/Delta signaling constrains reengineering of pro-T cells by PU.1 sourceExperimental — accuracy not yet measured
In “Notch/Delta Signaling as a Specific Modifier of PU.1 Actions on Target” (p. 4), the paper says that Notch1 and Notch signal delivery were unaffected by PU.1 in Thy-1+ pro-T cells, and that two Notch target genes were virtually indifferent to PU.1. It does report PU.1 sensitivity of HES-1 and downregulation of Notch1 in a different, Thy-1-low subset, but those qualifications do not support the claimed inhibition in pro-T cells. The cited passages do not establish the claim for Scid.adh.2C2 cells. (LLM, conf=0.88)
Checked by a reasoning model — may be wrong.
- Supportedcites [58] Del Real, 2013, Architecture of a lymphomyeloid developmental switch controlled by PU.1, Notch and Gata3 source
The fetal-thymocyte gene-expression results (Fig. 2B–D; page unavailable) report that Notch target genes were inhibited by high-level PU.1. In Scid.adh.2C2 cells, the paper reports PU.1-mediated repression of several Notch targets and says that Notch1 itself was among the affected genes, with repression further increased by Gata3 knockdown (Additional information; page unavailable). This supports the citing sentence’s qualified description that overexpressed PU.1 appears to inhibit Notch signaling. (LLM, conf=0.86)
hedgedconditional- Asserted: passes — The authors put it forward as true.
- Checkable: passes — It can be checked against evidence.
- Load-bearing: passes — The paper’s conclusions depend on it.
- Based: passes — The paper gives a reason why it holds.
- Disputed
Some cited sources support this claim and some don’t — read each source’s verdict below.
In the paper
“So far the innate lymphoid cell developmental program in particular appears to resemble the intrathymic T-cell program in many respects (154–157), enough to raise the question of what makes T-cell precursors wait to activate genes like Tcf7 and Gata3 until they reach the thymus.”
§ Mechanisms of Action of Hematopoietic Transcription Factor PU.1 in Initiation of T-Cell Development > Conclusions and Future Questions
What the sources say
- Disputedcites [154] Shih, 2016, Developmental acquisition of regulomes underlies innate lymphoid cell functionality sourceExperimental — accuracy not yet measured
The Discussion section, “T cells and ILCs: Regulomes Converge following Infection” (page not provided), describes a “reasonably clear distinction” between ILC and T-cell development. The paper reports shared transcription factors and convergence of their regulomes after infection, but distinguishes those similarities from a resemblance between their developmental programs. (LLM, conf=0.83)
Checked by a reasoning model — may be wrong.
- Not matchedcites [155] Yu, 2016, Single-cell RNA-seq identifies a PD-1hi ILC progenitor and defines its development pathway
Couldn’t be matched to a paper in Crossref, so it can’t be checked.
- Not checked — no full text of the sourcecites [156] Cherrier, 2018, Innate lymphoid cell development: a T cell perspective source
- Supportedcites [157] Harly, 2018, Development and differentiation of early innate lymphoid progenitors source
The Discussion (page unavailable) identifies TCF-1, GATA-3, and Bcl11b as important in both early T-cell and ILC development and suggests that they may play similar roles. The Results also report expression of many T-cell-associated genes in early ILC progenitors. Together, these passages support the citing sentence’s hedged comparison of the developmental programs. (LLM, conf=0.88)
hedgedcorrelational- Asserted: passes — The authors put it forward as true.
- Checkable: passes — It can be checked against evidence.
- Load-bearing: unclear — It is unclear whether the paper’s conclusions depend on it.
- Based: passes — The paper gives a reason why it holds.
- Disputed
The cited sources support only part of this claim — read each source’s verdict below.
In the paper
“In myeloid, dendritic, and B lineage cells, PU.1 is a major contributor to the positive regulation of genes that establish lineage-specific identity (4, 17, 19).”
§ Mechanisms of Action of Hematopoietic Transcription Factor PU.1 in Initiation of T-Cell Development > Introduction > PU.1 Expression in Precursors of T Cells
What the sources say
- Not checked — no full text of the sourcecites [4] Friedman, 2007, Transcriptional control of granulocyte and monocyte development source
- Partly supportedcites [17] Natoli, 2011, The genomic landscapes of inflammation sourceExperimental — accuracy not yet measured
The section “The cis-regulatory repertoire of professional inflammatory cells” describes PU.1 as a lineage-determining factor that activates macrophage-specific enhancers and notes a distinct pattern of PU.1 binding in B cells. It does not establish the claimed positive regulation of lineage-identity genes across myeloid, dendritic, and B lineage cells; the evidence it discusses concerns enhancers, and it does not substantiate the dendritic-cell portion. (LLM, conf=0.84)
- Not checked — no full text of the sourcecites [19] Turkistany, 2011, The transcription factor PU.1 is a critical regulator of cellular communication in the immune system source
plaindirect- Asserted: passes — The authors put it forward as true.
- Checkable: passes — It can be checked against evidence.
- Load-bearing: unclear — It is unclear whether the paper’s conclusions depend on it.
- Based: passes — The paper gives a reason why it holds.
The sources with a verdict support this claim; the rest weren’t checked yet, have no full text we could read, or their verdicts aren’t rated yet.
In the paper
“the precursors that give rise to committed T cells express PU.1 at both RNA and protein levels for multiple cell divisions after these cells begin to differentiate in the thymus (32, 33).”
§ Mechanisms of Action of Hematopoietic Transcription Factor PU.1 in Initiation of T-Cell Development > Introduction > PU.1 Expression in Precursors of T Cells
What the sources say
- Not checked — no full text of the sourcecites [32] Tydell, 2007, Molecular dissection of prethymic progenitor entry into the T lymphocyte developmental pathway source
- Supportedcites [33] Yui, 2010, Fine-scale staging of T cell lineage commitment in adult mouse thymus source
The Results section on gene-expression changes reports PU.1 RNA in early thymic precursors and high PU.1 protein in ETP and DN2a cells, with reduced protein persisting in newly committed DN2b cells. The Results section on proliferation reports extensive division by ETP and DN2a cells and continued division by DN2b cells, supporting expression across multiple divisions after thymic differentiation begins. (LLM, conf=0.88)
plaincorrelational- Asserted: passes — The authors put it forward as true.
- Checkable: passes — It can be checked against evidence.
- Load-bearing: passes — The paper’s conclusions depend on it.
- Based: passes — The paper gives a reason why it holds.
The cited sources that could be checked couldn’t confirm or dispute this claim.
In the paper
“This expression timing relative to other developmentally regulated transcription factors is conserved between human and mouse (35, 36)”
§ Mechanisms of Action of Hematopoietic Transcription Factor PU.1 in Initiation of T-Cell Development > Introduction > PU.1 Expression in Precursors of T Cells
What the sources say
- Could not verifycites [35] Casero, 2015, Long non-coding RNA profiling of human lymphoid progenitor cells reveals transcriptional divergence of B cell and T cell lineages sourceExperimental — accuracy not yet measured
The Discussion describes a transcriptional map of human lymphoid progenitors but does not compare the timing of PU.1 expression in humans and mice. Searches for PU.1, SPI1, and conserved expression timing found no passage in our copy addressing that comparison. (LLM, conf=0.75)
- Could not verifycites [36] Ha, 2017, The T-ALL related gene BCL11B regulates the initial stages of human T-cell differentiation sourceExperimental — accuracy not yet measured
The Results section on BCL11B expression during human thymopoiesis describes when BCL11B appears in human progenitors, while the Discussion compares some BCL11B effects in humans and mice. Neither passage addresses PU.1 expression timing relative to other transcription factors across the two species; searches for PU.1 and SPI1 found no relevant passage. Page numbers were not available in our copy. (LLM, conf=0.72)
plain- Asserted: passes — The authors put it forward as true.
- Checkable: passes — It can be checked against evidence.
- Load-bearing: unclear — It is unclear whether the paper’s conclusions depend on it.
- Based: passes — The paper gives a reason why it holds.
- Could not verify
The cited sources support only part of this claim — read each source’s verdict below.
In the paper
“its action is also important or indispensable for sustained generation of all known hematopoietic precursors that have lymphoid developmental potentials (1–9).”
§ Mechanisms of Action of Hematopoietic Transcription Factor PU.1 in Initiation of T-Cell Development > Introduction > PU.1 Expression in Precursors of T Cells
What the sources say
- Not checked — no full text of the sourcecites [1] Singh, 1999, PU.1, a shared transcriptional regulator of lymphoid and myeloid cell fates source
- Partly supportedcites [2] Dakic, 2005, PU.1 regulates the commitment of adult hematopoietic progenitors and restricts granulopoiesis sourceExperimental — accuracy not yet measured
The Results section (‘PU.1 is required for the balanced production of multipotent bone marrow progenitors’; page unavailable) reports a dramatic loss of readily identifiable lymphoid progenitors after PU.1 deletion in adult mice. The Results section (‘PU.1-deficient stem cells do not generate lymphoid progeny’; page unavailable) also reports that deficient progenitors essentially could not contribute to B- or T-cell production. These findings support PU.1’s importance in the studied adult setting, but do not establish a requirement for the sustained generation of every known hematopoietic precursor with lymphoid potential. (LLM, conf=0.83)
- Partly supportedcites [3] Iwasaki, 2005, Distinctive and indispensable roles of PU.1 in maintenance of hematopoietic stem cells and their differentiation sourceExperimental — accuracy not yet measured
The Abstract reports that PU.1 is necessary to maintain the bone marrow HSC pool and that PU.1-deficient HSCs fail to generate the earliest lymphoid progenitors. The Discussion likewise reports that PU.1 disruption profoundly decreases common lymphoid progenitors. These passages support a role in sustained precursor generation, but the paper does not establish the claim for *all known* precursors with lymphoid developmental potential. (LLM, conf=0.84)
- Not checked — no full text of the sourcecites [4] Friedman, 2007, Transcriptional control of granulocyte and monocyte development source
- Partly supportedcites [5] Houston, 2007, Reduction in PU.1 activity results in a block to B-cell development, abnormal myeloid proliferation, and neonatal lethality sourceExperimental — accuracy not yet measured
The Abstract says PU.1 is required for lymphoid-lineage development, and the Discussion says high PU.1 activity is essential at the earliest stages of B-cell specification. The paper does not establish that PU.1 is important or indispensable for sustained generation of all known hematopoietic precursors with lymphoid developmental potential; its stated conclusion is narrower. (LLM, conf=0.85)
- Not checked — no full text of the sourcecites [6] Bonifer, 2008, How transcription factors program chromatin–lessons from studies of the regulation of myeloid-specific genes source
- Not checked — no full text of the sourcecites [7] Burda, 2010, The role of PU.1 and GATA-1 transcription factors during normal and leukemogenic hematopoiesis source
- Not checked — no full text of the sourcecites [8] Carotta, 2010, Surprising new roles for PU.1 in the adaptive immune response source
- Partly supportedcites [9] Imperato, 2015, The RUNX1-PU.1 axis in the control of hematopoiesis sourceExperimental — accuracy not yet measured
The sections “Developmental-stage-specific RUNX1 and PU.1 function” and “RUNX1 and PU.1 in T and B-cells” (page numbers unavailable) describe PU.1’s contribution to HSC maintenance and its importance in early T-cell development and B-cell progenitor formation. They do not establish that PU.1 is important or indispensable for the sustained generation of *all known* hematopoietic precursors with lymphoid potential. (LLM, conf=0.83)
plaindirect- Asserted: passes — The authors put it forward as true.
- Checkable: passes — It can be checked against evidence.
- Load-bearing: passes — The paper’s conclusions depend on it.
- Based: passes — The paper gives a reason why it holds.
The cited sources support only part of this claim — read each source’s verdict below.
In the paper
“it is known to be able to bind either as a pioneer factor which displaces nucleosomes to open sites for other factors (12)”
§ Mechanisms of Action of Hematopoietic Transcription Factor PU.1 in Initiation of T-Cell Development > Introduction > PU.1 Expression in Precursors of T Cells
What the sources say
- Partly supportedcites [12] Barozzi, 2014, Coregulation of transcription factor binding and nucleosome occupancy through DNA features of mammalian enhancers sourceExperimental — accuracy not yet measured
The Results ('Selective masking of engaged Pu.1 sites by nucleosomes'; page unavailable) report that PU.1 binding in macrophages correlated with nucleosome removal or partial displacement and the formation of nucleosome-depleted regions. The Introduction explains that pioneer factors increase DNA accessibility for other factors, but the paper does not establish that PU.1 itself causes nucleosome displacement to open sites for those factors. (LLM, conf=0.84)
boosteddirect- Asserted: passes — The authors put it forward as true.
- Checkable: passes — It can be checked against evidence.
- Load-bearing: unclear — It is unclear whether the paper’s conclusions depend on it.
- Based: passes — The paper gives a reason why it holds.
- Partly supported
The cited sources support only part of this claim — read each source’s verdict below.
In the paper
“there is good agreement between the cells' natural loss of access to the dendritic cell and granulocyte programs, on the one hand, and the timing of PU.1 downregulation, on the other hand (33, 39–42).”
§ Mechanisms of Action of Hematopoietic Transcription Factor PU.1 in Initiation of T-Cell Development > Introduction > PU.1 Expression in Precursors of T Cells
What the sources say
- Partly supportedcites [33] Yui, 2010, Fine-scale staging of T cell lineage commitment in adult mouse thymus sourceExperimental — accuracy not yet measured
The Results sections on DC and NK developmental potential and on non-T-cell genes (page unavailable) place loss of dendritic-cell potential and PU.1 downregulation at the DN2a-to-DN2b transition. The paper assays dendritic-cell and NK-cell potential, but does not establish the timing of lost granulocyte potential. (LLM, conf=0.87)
- Partly supportedcites [39] Masuda, 2007, T cell lineage determination precedes the initiation of TCRβ rearrangement sourceExperimental — accuracy not yet measured
The section on PU.1 downregulation reports that PU.1 becomes undetectable at the GFP-positive DN2 stage, when dendritic-cell potential is completely lost; the Discussion also describes the events as coincident (page numbers unavailable). The paper does not establish the timing of a loss of granulocyte potential, so that part of the claim is unsupported by this source. (LLM, conf=0.88)
- Not checked — no full text of the sourcecites [40] Bell, 2008, The earliest thymic progenitors for T cells possess myeloid lineage potential source
- Not checked — no full text of the sourcecites [41] Wada, 2008, Adult T-cell progenitors retain myeloid potential source
- Partly supportedcites [42] De Obaldia, 2013, Early T-cell progenitors are the major granulocyte precursors in the adult mouse thymus sourceExperimental — accuracy not yet measured
The Introduction (page unavailable) says mouse early T-cell progenitors gradually lose non-T-cell potentials, including dendritic-cell and myeloid potential, as they progress toward T-cell commitment. The Results (page unavailable) report that committed DN3 cells did not generate thymic granulocytes. Our copy does not establish the claimed agreement with the timing of PU.1 downregulation; searches for PU.1 and downregulation found no passage addressing it. (LLM, conf=0.85)
plaincorrelational- Asserted: passes — The authors put it forward as true.
- Checkable: passes — It can be checked against evidence.
- Load-bearing: unclear — It is unclear whether the paper’s conclusions depend on it.
- Based: passes — The paper gives a reason why it holds.
- Partly supported
The cited sources support only part of this claim — read each source’s verdict below.
In the paper
“Notch activated target genes like Hes1 are expressed throughout the pro-T cell phases (ETP to DN3), until T-cell receptor (TCR) gene rearrangement (62–64)”
§ Mechanisms of Action of Hematopoietic Transcription Factor PU.1 in Initiation of T-Cell Development > Introduction > PU.1 as an Obstacle to T-Cell Lineage Commitment
What the sources say
- Partly supportedcites [62] Koch, 2001, Subversion of the T/B lineage decision in the thymus by lunatic fringe- mediated inhibition of Notch-1 sourceExperimental — accuracy not yet measured
The paper’s Plasmids passage reports that activated Notch induced an HES-1 promoter reporter in NIH 3T3 cells. It does not report endogenous Hes1 expression throughout the ETP-to-DN3 pro-T phases or establish TCR gene rearrangement as its endpoint; searches for those stages and rearrangement found no such result. (LLM, conf=0.83)
- Not checked — no full text of the sourcecites [63] Yui, 2004, Deranged early T cell development in immunodeficient strains of nonobese diabetic mice source
- Not checked — no full text of the sourcecites [64] Geimer Le Lay, 2014, The tumor suppressor Ikaros shapes the repertoire of Notch target genes in T cells source
plain- Asserted: passes — The authors put it forward as true.
- Checkable: passes — It can be checked against evidence.
- Load-bearing: passes — The paper’s conclusions depend on it.
- Based: passes — The paper gives a reason why it holds.
- Partly supported
The cited sources support only part of this claim — read each source’s verdict below.
In the paper
“Population dynamic models imply that the stages when PU.1 is expressed occupy a minimum of 7–10 intrathymic cell divisions of pro-T cells (39, 66, 67).”
§ Mechanisms of Action of Hematopoietic Transcription Factor PU.1 in Initiation of T-Cell Development > Introduction > PU.1 as an Obstacle to T-Cell Lineage Commitment
What the sources say
- Partly supportedcites [39] Masuda, 2007, T cell lineage determination precedes the initiation of TCRβ rearrangement sourceExperimental — accuracy not yet measured
The PU.1 expression section reports expression through GFP-negative DN2 and loss at GFP-positive DN2. The Discussion reports more than 10 DN1–DN2 divisions, while the proliferation results estimate about four divisions after the transition; together these imply more than six divisions before PU.1 becomes undetectable. The paper does not establish the full stated 7–10-division range for PU.1-expressing stages. (LLM, conf=0.82)
- Not checked — no full text of the sourcecites [66] Lu, 2005, The earliest thymic progenitors in adults are restricted to T, NK, and dendritic cell lineage and have a potential to form more diverse TCRβ chains than fetal progenitors source
- Partly supportedcites [67] Manesso, 2013, Computational modelling of T-cell formation kinetics: output regulated by initial proliferation-linked deferral of developmental competence sourceExperimental — accuracy not yet measured
The Results (§2.3.3) report that, in the models, adult mouse DN1 cells began committing to DN2 after seven or ten divisions. The paper does not connect those divisions to PU.1 expression or establish a minimum duration for all stages in which PU.1 is expressed. (LLM, conf=0.87)
plain- Asserted: passes — The authors put it forward as true.
- Checkable: passes — It can be checked against evidence.
- Load-bearing: unclear — It is unclear whether the paper’s conclusions depend on it.
- Based: passes — The paper gives a reason why it holds.
- Partly supported
Every source the paper cites for this claim was checked and supports it.
In the paper
“it strongly inhibits the proliferation of pro-T cells under conditions that do not reward the cells for lineage switching (49).”
§ Mechanisms of Action of Hematopoietic Transcription Factor PU.1 in Initiation of T-Cell Development > Effects of PU.1 Loss on T-cell Development: the Cellular View > PU.1 Promotes Proliferation While Slowing Differentiation of Pro-T Cells
What the sources say
- Supportedcites [49] Franco, 2006, Notch/Delta signaling constrains reengineering of pro-T cells by PU.1 source
The Discussion (p. 5) says that forced PU.1 significantly hampers pro-T-cell proliferation even when Notch/Delta signaling prevents lineage diversion. This supports the claim that PU.1 inhibits proliferation under conditions that do not favor lineage switching. (LLM, conf=0.93)
boosteddirect- Asserted: passes — The authors put it forward as true.
- Checkable: passes — It can be checked against evidence.
- Load-bearing: passes — The paper’s conclusions depend on it.
- Based: passes — The paper gives a reason why it holds.
- Supported
The cited sources support only part of this claim — read each source’s verdict below.
In the paper
“PU.1-deficient cells underwent fewer cycles per unit time than controls both in ETP stage and in DN2a/2b stages (79)”
§ Mechanisms of Action of Hematopoietic Transcription Factor PU.1 in Initiation of T-Cell Development > Effects of PU.1 Loss on T-cell Development: the Cellular View > PU.1 Promotes Proliferation While Slowing Differentiation of Pro-T Cells
What the sources say
- Partly supportedcites [79] Champhekar, 2015, Regulation of early T-lineage gene expression and developmental progression by the progenitor cell transcription factor PU sourceExperimental — accuracy not yet measured
The Results section (‘PU.1 is required for DN progression and survival’) reports significantly less proliferation in PU.1-knockout DN2 cells than in controls after two and three days. It also describes less overall proliferation after deletion at ETP or DN2a, but does not establish fewer cell cycles specifically in ETP cells or separately in DN2b cells. (LLM, conf=0.84)
plaindirect- Asserted: passes — The authors put it forward as true.
- Checkable: passes — It can be checked against evidence.
- Load-bearing: passes — The paper’s conclusions depend on it.
- Based: passes — The paper gives a reason why it holds.
- Partly supported
The cited sources support only part of this claim — read each source’s verdict below.
In the paper
“PU.1 is directly required to maintain the expression of the cytokine receptor Flt3 that is indispensable for progenitors with B and T cell potentials (73).”
§ Mechanisms of Action of Hematopoietic Transcription Factor PU.1 in Initiation of T-Cell Development > Effects of PU.1 Loss on T-cell Development: the Cellular View > A Vital Role for PU.1 in Prethymic T-Cell Progenitors
What the sources say
- Partly supportedcites [73] Carotta, 2010, The transcription factor PU.1 controls dendritic cell development and Flt3 cytokine receptor expression in a dose-dependent manner sourceExperimental — accuracy not yet measured
The Discussion (page unavailable) states that PU.1 has an essential, direct role in regulating Flt3 expression in multipotent hematopoietic precursors and maintains its expression in formed dendritic cells. It says Flt3 plays an important role in lymphoid-primed multipotent and common lymphoid progenitors, but does not establish that Flt3 is indispensable for progenitors with B- and T-cell potential. (LLM, conf=0.84)
plaindirect- Asserted: passes — The authors put it forward as true.
- Checkable: passes — It can be checked against evidence.
- Load-bearing: passes — The paper’s conclusions depend on it.
- Based: passes — The paper gives a reason why it holds.
- Partly supported
Every source the paper cites for this claim was checked and supports it.
In the paper
“in postnatal mice, although T cell development is much more severely affected by PU.1 deletion than neutrophil development (2)”
§ Mechanisms of Action of Hematopoietic Transcription Factor PU.1 in Initiation of T-Cell Development > Effects of PU.1 Loss on T-cell Development: the Cellular View > A Vital Role for PU.1 in Prethymic T-Cell Progenitors
What the sources say
- Supportedcites [2] Dakic, 2005, PU.1 regulates the commitment of adult hematopoietic progenitors and restricts granulopoiesis source
In the Results section, PU.1-deficient progenitors were essentially unable to contribute to T-cell development, while mutant stem cells retained granulocyte-lineage production. The Discussion describes overwhelming granulocyte production, although the granulocytes matured abnormally. This supports the comparison for postnatal mice without implying that neutrophil development was normal. (LLM, conf=0.87)
plaindirect- Asserted: passes — The authors put it forward as true.
- Checkable: passes — It can be checked against evidence.
- Load-bearing: passes — The paper’s conclusions depend on it.
- Based: passes — The paper gives a reason why it holds.
- Supported
The cited sources support only part of this claim — read each source’s verdict below.
In the paper
“Notch ligands are the most important of all the environmental signals that the thymus stroma provides to developing T cells, apparently across all vertebrates (59–61)”
§ Mechanisms of Action of Hematopoietic Transcription Factor PU.1 in Initiation of T-Cell Development > Introduction > PU.1 as an Obstacle to T-Cell Lineage Commitment
What the sources say
- Not checked — no full text of the sourcecites [59] Radtke, 2004, Notch regulation of lymphocyte development and function source
- Not checked — no full text of the sourcecites [60] Petrie, 2007, Zoned out: functional mapping of stromal signaling microenvironments in the thymus source
- Partly supportedcites [61] Bajoghli, 2009, Evolution of genetic networks underlying the emergence of thymopoiesis in vertebrates sourceExperimental — accuracy not yet measured
The Introduction describes Dll4 as an essential, non-redundant ligand for T-cell specification, and the Discussion identifies specification through Notch receptors as a cardinal function of the thymic microenvironment. The paper does not rank Notch ligands above all other stromal signals; its account of a thymus concerns jawed vertebrates, not all vertebrates. (LLM, conf=0.87)
hedgeddirect- Asserted: passes — The authors put it forward as true.
- Checkable: passes — It can be checked against evidence.
- Load-bearing: passes — The paper’s conclusions depend on it.
- Based: passes — The paper gives a reason why it holds.
The cited sources support only part of this claim — read each source’s verdict below.
In the paper
“added PU.1 can enhance pro-T cell proliferation in response to cytokine cocktails containing high levels of Stem Cell Factor (Kit ligand) and Flt3 ligand or myeloid growth factors (38, 50)”
§ Mechanisms of Action of Hematopoietic Transcription Factor PU.1 in Initiation of T-Cell Development > Effects of PU.1 Loss on T-cell Development: the Cellular View > PU.1 Promotes Proliferation While Slowing Differentiation of Pro-T Cells
What the sources say
- Not checked — no full text of the sourcecites [38] Seki, 2017, Recurrent SPI1 (PU.1) fusions in high-risk pediatric T cell acute lymphoblastic leukemia source
- Partly supportedcites [50] Laiosa, 2006, Reprogramming of committed T cell progenitors to macrophages and dendritic cells by C/EBPα and PU.1 transcription factors sourceExperimental — accuracy not yet measured
The Results (page unavailable) report that PU.1-expressing T-lineage cells increased in number when cultured with myeloid cytokines, and that PU.1 increased cell numbers in another culture condition. They do not establish enhanced pro-T-cell proliferation specifically in response to high levels of SCF and Flt3 ligand; the reported increase in cell number is not itself a proliferation measurement. (LLM, conf=0.82)
plaindirect- Asserted: passes — The authors put it forward as true.
- Checkable: passes — It can be checked against evidence.
- Load-bearing: passes — The paper’s conclusions depend on it.
- Based: passes — The paper gives a reason why it holds.
The cited sources support only part of this claim — read each source’s verdict below.
In the paper
“PU.1 actions are Notch-sensitive.”
§ Mechanisms of Action of Hematopoietic Transcription Factor PU.1 in Initiation of T-Cell Development > Introduction > PU.1 as an Obstacle to T-Cell Lineage Commitment
What the sources say
- Supportedcites [49] Franco, 2006, Notch/Delta signaling constrains reengineering of pro-T cells by PU.1 source
The Results section (pp. 4–5) says Notch/Delta signaling generally blunted PU.1’s effects on gene expression and specifically controlled its effects on c-Myb, Gfi1, and Id2. The Discussion (p. 6) likewise describes target-gene-specific modulation of PU.1 activities by Notch/Delta signaling. (LLM, conf=0.94)
- Partly supportedcites [50] Laiosa, 2006, Reprogramming of committed T cell progenitors to macrophages and dendritic cells by C/EBPα and PU.1 transcription factors sourceExperimental — accuracy not yet measured
The Discussion reports that activated Notch completely inhibits PU.1-driven Mac-1 upregulation, supporting Notch sensitivity for that action. It also says Notch does not impair PU.1's ability to block T-cell differentiation, so the unqualified statement is broader than the finding. (LLM, conf=0.83)
- Supportedcites [58] Del Real, 2013, Architecture of a lymphomyeloid developmental switch controlled by PU.1, Notch and Gata3 source
In the section on PU.1 protein and Mac1 upregulation, the response to a given level of PU.1 depended strongly on Notch signaling, which raised the threshold for PU.1-induced Mac1 expression. The gene-expression dissection also reports that some PU.1 effects differed with Notch signaling, although not all did. (LLM, conf=0.94)
plaincorrelational- Asserted: passes — The authors put it forward as true.
- Checkable: passes — It can be checked against evidence.
- Load-bearing: passes — The paper’s conclusions depend on it.
- Based: passes — The paper gives a reason why it holds.
- Supported
Every source the paper cites for this claim was checked and supports it.
In the paper
“In primary fetal-derived pro-T cells and in a DN3-like cell line, the particular genes affected by a given, fixed level of PU.1 in the cells depended strongly on the strength of Notch signaling being induced in the cells at the time (58).”
§ Mechanisms of Action of Hematopoietic Transcription Factor PU.1 in Initiation of T-Cell Development > Introduction > PU.1 as an Obstacle to T-Cell Lineage Commitment
What the sources say
- Supportedcites [58] Del Real, 2013, Architecture of a lymphomyeloid developmental switch controlled by PU.1, Notch and Gata3 source
In “Notch signaling effects on initial changes in gene expression in fetal thymocyte responses to highlevel PU.1” (page unavailable), the paper reports gene-specific responses to PU.1 that differ with the presence of Notch signaling in fetal thymocytes. In “Dissection of PU.1-dependent gene expression effects in the presence and absence of Notch signaling” (page unavailable), it reports distinct gene-expression responses when PU.1 is combined with Notch activation or inhibition in the pro-T-cell line. (LLM, conf=0.92)
boostedcorrelational- Asserted: passes — The authors put it forward as true.
- Checkable: passes — It can be checked against evidence.
- Load-bearing: passes — The paper’s conclusions depend on it.
- Based: passes — The paper gives a reason why it holds.
- Supported
The cited sources support only part of this claim — read each source’s verdict below.
In the paper
“In both experimental setups, PU.1 disruption reduced T-cell precursor proliferation substantially as compared to controls.”
§ Mechanisms of Action of Hematopoietic Transcription Factor PU.1 in Initiation of T-Cell Development > Effects of PU.1 Loss on T-cell Development: the Cellular View > PU.1 Promotes Proliferation While Slowing Differentiation of Pro-T Cells
What the sources say
- Supportedcites [79] Champhekar, 2015, Regulation of early T-lineage gene expression and developmental progression by the progenitor cell transcription factor PU source
In the Results section on DN progression and survival (page not specified), PU.1-deleted fetal-liver precursors generated considerably fewer progeny than controls after 8–10 days, although their initial cell yield was not reduced. In the subsequent experiment with developing T-cell precursors, PU.1-knockout DN2 cells proliferated significantly less than wild-type cells on days 2 and 3. Together, these findings support reduced proliferation or expansion in both setups. (LLM, conf=0.88)
- Partly supportedcites [80] Hosokawa, 2018, Transcription factor PU.1 represses and activates gene expression in early T cells by redirecting partner transcription factor binding sourceExperimental — accuracy not yet measured
The Results section (“Functional gene response to endogenous PU.1 in pro-T cells”; page unavailable) says PU.1-sgRNA-treated cells proliferated significantly less than control-transduced cells. It describes this as consistent with Cre-dependent PU.1 deletion reported by Champhekar et al. (2015), but does not present proliferation results from a second experimental setup of its own. (LLM, conf=0.84)
plaindirect- Asserted: passes — The authors put it forward as true.
- Checkable: passes — It can be checked against evidence.
- Load-bearing: passes — The paper’s conclusions depend on it.
- Based: passes — The paper gives a reason why it holds.
- Supported
Every source the paper cites for this claim was checked and supports it.
In the paper
“of the cells that were generated from PU.1-disrupted precursors, a substantially larger fraction progressed to DN3 stage than in control cells, over the same length of absolute developmental time, suggesting that they were liberated from a differentiation constraint (79, 80).”
§ Mechanisms of Action of Hematopoietic Transcription Factor PU.1 in Initiation of T-Cell Development > Effects of PU.1 Loss on T-cell Development: the Cellular View > PU.1 Promotes Proliferation While Slowing Differentiation of Pro-T Cells
What the sources say
- Supportedcites [79] Champhekar, 2015, Regulation of early T-lineage gene expression and developmental progression by the progenitor cell transcription factor PU source
The Results section on DN progression reports that, over 3–5 days, cells deleted for PU.1 at the ETP or DN2a stage differentiated faster than controls and progressed more completely to DN3 by harvest. The finding applies to those starting stages; the paper reports no comparable difference after deletion at DN2b. (LLM, conf=0.93)
- Supportedcites [80] Hosokawa, 2018, Transcription factor PU.1 represses and activates gene expression in early T cells by redirecting partner transcription factor binding source
The Results section reports that, four days after transduction, PU.1-disrupted cells had progressed to DN3 faster than control-transduced cells. This supports the paraphrase that more of them reached DN3 over the same developmental time; the passage does not give a numerical fraction. No page number is available in our copy. (LLM, conf=0.87)
hedgeddirect- Asserted: passes — The authors put it forward as true.
- Checkable: passes — It can be checked against evidence.
- Load-bearing: passes — The paper’s conclusions depend on it.
- Based: passes — The paper gives a reason why it holds.
- Supported
The cited sources support only part of this claim — read each source’s verdict below.
In the paper
“All the hematopoietic progenitors that generate either B or T cells appear to originate from PU.1-expressing, PU.1-dependent prethymic cells (2, 27)”
§ Mechanisms of Action of Hematopoietic Transcription Factor PU.1 in Initiation of T-Cell Development > Effects of PU.1 Loss on T-cell Development: the Cellular View > A Vital Role for PU.1 in Prethymic T-Cell Progenitors
What the sources say
- Partly supportedcites [2] Dakic, 2005, PU.1 regulates the commitment of adult hematopoietic progenitors and restricts granulopoiesis sourceExperimental — accuracy not yet measured
The expression passage provided (p. unavailable) says PU.1 is expressed in adult hematopoietic stem cells and the earliest lymphoid progenitors. The Results section, “PU.1-deficient stem cells do not generate lymphoid progeny” (p. unavailable), reports that PU.1-deficient progenitors essentially could not contribute to B- or T-cell production, supporting an early PU.1-dependent origin. The paper studies adult mice and does not establish that *all* B- or T-cell-generating progenitors, across settings, pass through such cells. (LLM, conf=0.83)
- Not checked — no full text of the sourcecites [27] Arinobu, 2007, Reciprocal activation of GATA-1 and PU.1 marks initial specification of hematopoietic stem cells into myeloerythroid and myelolymphoid lineages source
hedgeddirect- Asserted: passes — The authors put it forward as true.
- Checkable: passes — It can be checked against evidence.
- Load-bearing: passes — The paper’s conclusions depend on it.
- Based: passes — The paper gives a reason why it holds.
- Partly supported
The cited sources support only part of this claim — read each source’s verdict below.
In the paper
“Instead of re-acquiring aspects of a progenitor-like state, the cells appear to trans-differentiate to a dendritic-cell or macrophage developmental program (48, 50, 58).”
§ Mechanisms of Action of Hematopoietic Transcription Factor PU.1 in Initiation of T-Cell Development > Defining the PU.1 Regulome in Early T-cell Precursors > Developmental Challenges: Implications of a Gene Regulatory Network Switch
What the sources say
- Partly supportedcites [48] Lefebvre, 2005, Enforced expression of Spi-B reverses T lineage commitment and blocks β-selection sourceExperimental — accuracy not yet measured
The section on stage-dependent effects reports that Spi-B-transduced, T-lineage-committed DN3 thymocytes up-regulated a dendritic-cell marker, consistent with diversion to the dendritic-cell lineage. But it also reports that some re-expressed CD44 and reverted to a DN2 phenotype, so it does not establish diversion *instead of* reacquiring progenitor-like features. The paper does not report diversion to a macrophage program. (LLM, conf=0.88)
- Partly supportedcites [50] Laiosa, 2006, Reprogramming of committed T cell progenitors to macrophages and dendritic cells by C/EBPα and PU.1 transcription factors sourceExperimental — accuracy not yet measured
The Discussion reports that committed pre-T cells transdifferentiated into macrophages after C/EBP expression, while PU.1 produced cells resembling myeloid dendritic cells. It rules out outgrowth of inadvertent myeloid progenitors, but does not establish that the reprogrammed cells never transiently re-acquired aspects of a progenitor-like state. (LLM, conf=0.82)
- Partly supportedcites [58] Del Real, 2013, Architecture of a lymphomyeloid developmental switch controlled by PU.1, Notch and Gata3 sourceExperimental — accuracy not yet measured
The Results section on diversion in Scid.adh.2C2 cells (page unavailable) reports that PU.1-diverted cells downregulated T-cell genes and upregulated macrophage-associated genes, supporting a shift toward a macrophage program. The passages do not establish diversion to a dendritic-cell program or show that the cells bypass re-acquisition of progenitor-like features. (LLM, conf=0.83)
hedgeddirect- Asserted: passes — The authors put it forward as true.
- Checkable: passes — It can be checked against evidence.
- Load-bearing: passes — The paper’s conclusions depend on it.
- Based: passes — The paper gives a reason why it holds.
- Partly supported
The cited sources support only part of this claim — read each source’s verdict below.
In the paper
“intracellular protein staining confirmed that some PU.1 expression is still detectable at later stages, in the same individual cells that go through T-cell commitment (marked by activation of the Bcl11b gene) (33, 93).”
§ Mechanisms of Action of Hematopoietic Transcription Factor PU.1 in Initiation of T-Cell Development > PU.1 Action on the Genome via Direct Binding > PU.1 Protein Is Stable and Active Across the Genome in Early T Cells
What the sources say
- Partly supportedcites [33] Yui, 2010, Fine-scale staging of T cell lineage commitment in adult mouse thymus sourceExperimental — accuracy not yet measured
The Results section ('Major changes in Notch-related genes follow declines in non-T cell genes at commitment'; page unavailable) reports intracellular staining showing reduced but detectable PU.1 protein in individual newly committed DN2b cells. The Results section ('T lineage identity genes'; page unavailable) places the major Bcl11b upregulation before commitment, but does not show Bcl11b activation and PU.1 expression measured in the same individual cells. (LLM, conf=0.84)
- Supportedcites [93] Rothenberg, 2016, Hematopoiesis and T-cell specification as a model developmental system source
In “Activation of the T-cell program,” the paper reports that single cells first activating Bcl11b still show detectable PU.1 reporter expression. It also reports single-cell fluorescent staining showing PU.1 protein in functionally committed DN2b cells. The paper describes these as two complementary observations, rather than saying protein staining itself measured Bcl11b activation in the same cells. (LLM, conf=0.91)
plaincorrelational- Asserted: passes — The authors put it forward as true.
- Checkable: passes — It can be checked against evidence.
- Load-bearing: passes — The paper’s conclusions depend on it.
- Based: passes — The paper gives a reason why it holds.
- Partly supported
The cited sources support only part of this claim — read each source’s verdict below.
In the paper
“PU.1 binding sites and PU.1 binding partners are not the same in early T-cell precursors as in myeloid cells or B lineage cells (13, 80, 84, 85)”
§ Mechanisms of Action of Hematopoietic Transcription Factor PU.1 in Initiation of T-Cell Development > Defining the PU.1 Regulome in Early T-cell Precursors > Cell Line and Primary-Cell Assay Systems for PU.1 Manipulation
What the sources say
- Partly supportedcites [13] Heinz, 2010, Simple combinations of lineage-determining transcription factors prime cis-regulatory elements required for macrophage and B cell identities sourceExperimental — accuracy not yet measured
The sections “Distinct PU.1 binding programs in macrophages and B cells” and “PU.1 binds in the vicinity of other lineage-determining transcription factors” report different PU.1 binding sites and nearby factor motifs in macrophages and B cells (page numbers unavailable). Our copy does not compare either lineage with early T-cell precursors, so it does not establish the claimed T-cell difference. (LLM, conf=0.86)
- Partly supportedcites [80] Hosokawa, 2018, Transcription factor PU.1 represses and activates gene expression in early T cells by redirecting partner transcription factor binding sourceExperimental — accuracy not yet measured
The Introduction (page unavailable) says common PU.1 collaborators are absent in most pro-T cells and that other partners are recruited; the Discussion identifies Satb1 and Runx1 as partners in early T cells. The paper describes PU.1 binding sites in early T cells, but the passages found do not compare those sites directly with sites in myeloid or B-lineage cells. (LLM, conf=0.83)
- Partly supportedcites [84] Zhang, 2012, Dynamic transformations of genome-wide epigenetic marking and transcriptional control establish T cell identity sourceExperimental — accuracy not yet measured
The Results section, “Early T-cell specific sites for PU.1: a positive role” (page not available), says PU.1 binding sites in early T-cell precursors differ from those reported in B cells and macrophages. It also reports different preferred sequence motifs, but does not establish that PU.1’s binding partners differ between those cell types. (LLM, conf=0.86)
- Supportedcites [85] Ungerbäck, 2018, Pioneering, chromatin remodeling, and epigenetic constraint in early T-cell gene regulation by SPI1 (PU.1) source
The opening section states that PU.1 occupies sites in DN1 and DN2a pro-T cells distinct from those occupied in B and myeloid cells. It also says that CEBP and IRF factors, which cooperate with PU.1 in myeloid and B cells, are expressed little if at all in early T-lineage cells; the Discussion identifies RUNX1 and SATB1 as PU.1 interaction partners in early pro-T cells. Page numbers are not provided in our copy. (LLM, conf=0.92)
plain- Asserted: passes — The authors put it forward as true.
- Checkable: passes — It can be checked against evidence.
- Load-bearing: passes — The paper’s conclusions depend on it.
- Based: passes — The paper gives a reason why it holds.
- Partly supported
Every source the paper cites for this claim was checked and supports it.
In the paper
“With the advent of ChIP-seq data, though, it was confirmed that endogenous, naturally expressed PU.1 is indeed a prominent actor across the genome in T-cell precursors before commitment.”
§ Mechanisms of Action of Hematopoietic Transcription Factor PU.1 in Initiation of T-Cell Development > PU.1 Action on the Genome via Direct Binding > PU.1 Protein Is Stable and Active Across the Genome in Early T Cells
What the sources say
- Supportedcites [84] Zhang, 2012, Dynamic transformations of genome-wide epigenetic marking and transcriptional control establish T cell identity source
The Results section, “Early T-cell specific sites for PU.1: a positive role” (page not supplied), reports approximately 34,000 PU.1 binding sites in DN T cells before commitment. It also describes PU.1 RNA and protein declining during commitment, supporting the claim that naturally expressed PU.1 has a prominent genome-wide presence in early T-cell precursors. (LLM, conf=0.92)
boostedcorrelational- Asserted: passes — The authors put it forward as true.
- Checkable: passes — It can be checked against evidence.
- Load-bearing: passes — The paper’s conclusions depend on it.
- Based: passes — The paper gives a reason why it holds.
- Supported
The cited sources support only part of this claim — read each source’s verdict below.
In the paper
“this gene network switch underlies the stochastic, switch-like behavior of individual pro-T or Scid.adh.2C2 cells when forced to express high-level PU.1 (47, 58).”
§ Mechanisms of Action of Hematopoietic Transcription Factor PU.1 in Initiation of T-Cell Development > Defining the PU.1 Regulome in Early T-cell Precursors > Developmental Challenges: Implications of a Gene Regulatory Network Switch
What the sources say
- Partly supportedcites [47] Dionne, 2005, Subversion of T lineage commitment by PU.1 in a clonal cell line system sourceExperimental — accuracy not yet measured
The Results and Discussion (page unavailable) describe a discontinuous, all-or-none response to forced PU.1 expression in individual SCID.adh cells, including the adh.2C2 clone. The section “Diversion: a discrete state of a bistable network” interprets this as a shift in gene-regulatory-network state, but the paper says the network controlling that choice remains to be elucidated; it does not establish that switch as the mechanism underlying the behavior in primary pro-T cells. (LLM, conf=0.84)
- Supportedcites [58] Del Real, 2013, Architecture of a lymphomyeloid developmental switch controlled by PU.1, Notch and Gata3 source
The section on pro-T cells with high PU.1 reports all-or-none choices between remaining Mac1-negative and diverting to a Mac1-positive state, even among cells with comparable PU.1 levels. The Scid.adh.2C2 experiments likewise find that only a fraction of PU.1-transduced cells divert, while the Introduction and Discussion describe the competing regulatory network underlying this choice. The paper supports the claim’s switch-like, cell-to-cell variation, although it does not use the word “stochastic.” (LLM, conf=0.86)
plaindirect- Asserted: passes — The authors put it forward as true.
- Checkable: passes — It can be checked against evidence.
- Load-bearing: passes — The paper’s conclusions depend on it.
- Based: passes — The paper gives a reason why it holds.
- Partly supported
Every source the paper cites for this claim was checked and supports it.
In the paper
“Ironically, because PU.1 protein can persist longer than a cell cycle (82), the very slowdown of cell division caused by deletion of Spi1 (see above) can also interfere with the dilution needed to complete the clearance of the PU.1 protein.”
§ Mechanisms of Action of Hematopoietic Transcription Factor PU.1 in Initiation of T-Cell Development > Defining the PU.1 Regulome in Early T-cell Precursors > Kinetic Challenges: Protein Half-Lives vs. Developmental Progression
What the sources say
- Supportedcites [82] Kueh, 2013, Positive feedback between PU.1 and the cell cycle controls myeloid differentiation source
The passage on PU.1 synthesis and removal (labeled Abstract in our copy) states that PU.1’s protein half-life is substantially longer than the progenitor cell-cycle length and that removal occurs predominantly through dilution during cell division. Citation (82) is attached to the protein-persistence clause; the subsequent inference about Spi1 deletion is not attributed to this source. (LLM, conf=0.93)
plaindirect- Asserted: passes — The authors put it forward as true.
- Checkable: passes — It can be checked against evidence.
- Load-bearing: passes — The paper’s conclusions depend on it.
- Based: passes — The paper gives a reason why it holds.
- Supported
The cited sources support only part of this claim — read each source’s verdict below.
In the paper
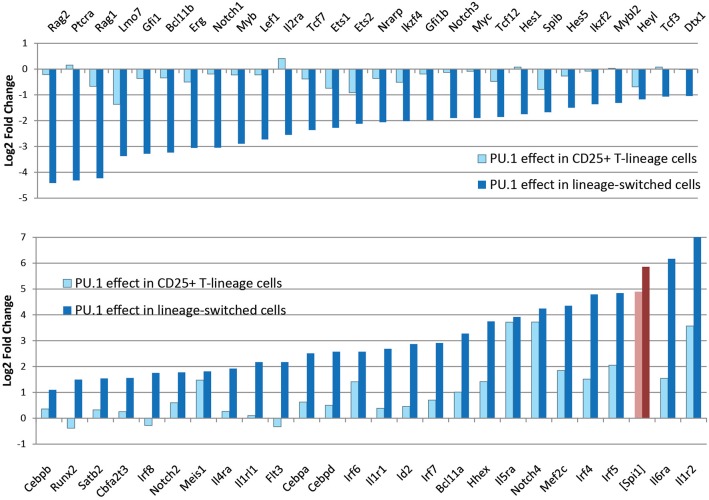
“In contrast, cells remaining within the T-cell pathway, continuing to express CD25 and remaining negative for CD11b, show relatively modest and selective changes in gene expression driven by upregulated PU.1, with minimal loss of T-cell regulatory gene expression (79, 85).”
§ Mechanisms of Action of Hematopoietic Transcription Factor PU.1 in Initiation of T-Cell Development > Defining the PU.1 Regulome in Early T-cell Precursors > Developmental Challenges: Implications of a Gene Regulatory Network Switch
What the sources say
- Partly supportedcites [79] Champhekar, 2015, Regulation of early T-lineage gene expression and developmental progression by the progenitor cell transcription factor PU sourceExperimental — accuracy not yet measured
The Results section on PU.1-Eng specificity identifies CD25 expression and absence of CD11b as markers of cells not diverted to a myeloid fate. But the Results section on negative regulation of T-cell development reports that overexpressed wild-type PU.1 down-regulated multiple T-lineage genes, including Tcf7, Gata3, Lef1, and Ikaros, with effects much greater than those of PU.1 deletion. Our copy does not establish that the CD25-positive, CD11b-negative cells specifically had modest expression changes or minimal loss of T-cell regulatory gene expression (page numbers unavailable). (LLM, conf=0.82)
- Partly supportedcites [85] Ungerbäck, 2018, Pioneering, chromatin remodeling, and epigenetic constraint in early T-cell gene regulation by SPI1 (PU.1) sourceExperimental — accuracy not yet measured
The Results section on chromatin opening identifies CD25+ cells as remaining within the T-cell pathway and reports PU.1-induced gene-expression changes in those cells. It also says most affected genes were up-regulated, consistent with selective effects. The passages do not establish that these cells remained CD11b-negative or specifically that T-cell regulatory genes showed minimal loss of expression. (LLM, conf=0.81)
plaindirect- Asserted: passes — The authors put it forward as true.
- Checkable: passes — It can be checked against evidence.
- Load-bearing: passes — The paper’s conclusions depend on it.
- Based: passes — The paper gives a reason why it holds.
- Partly supported
Every source the paper cites for this claim was checked and supports it.
In the paper
“Cas9-dependent acute deletion of the Spi1 locus can be fast and highly efficient due to the availability of Cas9-transgenic mice (92) and vectors that can be used for high-level, synchronous expression of guide RNAs.”
§ Mechanisms of Action of Hematopoietic Transcription Factor PU.1 in Initiation of T-Cell Development > Defining the PU.1 Regulome in Early T-cell Precursors > Kinetic Challenges: Protein Half-Lives vs. Developmental Progression
What the sources say
- Supportedcites [92] Platt, 2014, CRISPR-Cas9 knockin mice for genome editing and cancer modeling source
The citation is attached to the availability of Cas9-transgenic mice, not to the vectors or a demonstrated Spi1 deletion. In Results (“Generation of a Cre-Dependent Cas9 Knockin Transgenic Mouse”), the paper reports generating a Cas9-transgenic mouse; the Discussion also describes constitutive Cas9-expressing mice for in vivo genome editing. (LLM, conf=0.93)
plaindirect- Asserted: passes — The authors put it forward as true.
- Checkable: passes — It can be checked against evidence.
- Load-bearing: unclear — It is unclear whether the paper’s conclusions depend on it.
- Based: passes — The paper gives a reason why it holds.
- Supported
Every source the paper cites for this claim was checked and supports it.
In the paper
“PU.1 was found binding to >30,000 genomic sites in these cells at the earliest stages (84)”
§ Mechanisms of Action of Hematopoietic Transcription Factor PU.1 in Initiation of T-Cell Development > PU.1 Action on the Genome via Direct Binding > PU.1 Protein Is Stable and Active Across the Genome in Early T Cells
What the sources say
- Supportedcites [84] Zhang, 2012, Dynamic transformations of genome-wide epigenetic marking and transcriptional control establish T cell identity source
The Results section, under “Early T-cell specific sites for PU.1: a positive role,” reports that PU.1 bound approximately 34,000 sites in DN T cells. It identifies FLDN1 cells as an early stage in which PU.1 binding sites were observed, supporting the claim’s count and early-T-cell context. (LLM, conf=0.93)
plain- Asserted: passes — The authors put it forward as true.
- Checkable: passes — It can be checked against evidence.
- Load-bearing: passes — The paper’s conclusions depend on it.
- Based: passes — The paper gives a reason why it holds.
- Supported
The cited sources support only part of this claim — read each source’s verdict below.
In the paper
“However, in the pro-T cells, the genes that are repressed when exogenous PU.1 is introduced are not necessarily linked to the sites that the exogenous PU.1 actually binds.”
§ Mechanisms of Action of Hematopoietic Transcription Factor PU.1 in Initiation of T-Cell Development > PU.1 Action via Cofactor Recruitment > The Problem of Pro-T Cell Gene Repression by PU.1
What the sources say
- Partly supportedcites [79] Champhekar, 2015, Regulation of early T-lineage gene expression and developmental progression by the progenitor cell transcription factor PU sourceExperimental — accuracy not yet measured
The Results section on PU.1-Eng and endogenous PU.1 binding reports that repressed genes were enriched for associated PU.1-binding sites, though those sites were sometimes intronic or flanking rather than at promoters. The cited analysis measures endogenous PU.1 occupancy, not where the introduced PU.1-Eng actually binds, so it does not establish the claim about exogenous binding sites. (LLM, conf=0.78)
plaincorrelational- Asserted: passes — The authors put it forward as true.
- Checkable: passes — It can be checked against evidence.
- Load-bearing: passes — The paper’s conclusions depend on it.
- Based: passes — The paper gives a reason why it holds.
- Partly supported
Every source the paper cites for this claim was checked and supports it.
In the paper
“The sites where PU.1 binds are enriched for open chromatin as defined by DNase accessibility or ATAC-seq [assay of transposase-accessible chromatin (94)]”
§ Mechanisms of Action of Hematopoietic Transcription Factor PU.1 in Initiation of T-Cell Development > PU.1 Action on the Genome via Direct Binding > PU.1 Binding Site Characteristics
What the sources say
- Supportedcites [94] Buenrostro, 2013, Transposition of native chromatin for fast and sensitive epigenomic profiling of open chromatin, DNA-binding proteins and nucleosome position source
The citation is attached to the identification of ATAC-seq as an assay for open chromatin. The Introduction describes using ATAC-seq to identify regions of open chromatin, and the Results compare its accessibility measurements with DNase-seq. The cited paper need not establish the sentence’s separate PU.1-specific assertion to support this assay citation. (LLM, conf=0.92)
plaincorrelational- Asserted: passes — The authors put it forward as true.
- Checkable: passes — It can be checked against evidence.
- Load-bearing: passes — The paper’s conclusions depend on it.
- Based: passes — The paper gives a reason why it holds.
- Supported
The cited sources support only part of this claim — read each source’s verdict below.
In the paper
“First, as noted above, high-dose PU.1 can inhibit expression of multiple Notch target genes and Notch1 itself (58, 85).”
§ Mechanisms of Action of Hematopoietic Transcription Factor PU.1 in Initiation of T-Cell Development > PU.1 Action via Cofactor Recruitment > The Problem of Pro-T Cell Gene Repression by PU.1
What the sources say
- Partly supportedcites [58] Del Real, 2013, Architecture of a lymphomyeloid developmental switch controlled by PU.1, Notch and Gata3 sourceExperimental — accuracy not yet measured
The Results (RESEARCH ARTICLE, Fig. 2B–D; page unavailable) report that PU.1 inhibits several Notch target genes, including Nrarp, HEBalt and Hes1. The passages found do not report that PU.1 inhibits expression of Notch1 itself; the mention of Notch1 in the Dissection section concerns experimentally introduced active Notch1. (LLM, conf=0.85)
- Partly supportedcites [85] Ungerbäck, 2018, Pioneering, chromatin remodeling, and epigenetic constraint in early T-cell gene regulation by SPI1 (PU.1) sourceExperimental — accuracy not yet measured
The introductory passage (indexed under Abstract; page unavailable) says PU.1 antagonizes Notch signaling and delays activation of many T-cell genes. The Results section on pioneering in DN3-like cells reports that introduced PU.1 represses many genes, but the passages found do not identify multiple Notch target genes or show repression of Notch1 itself. (LLM, conf=0.83)
plaindirect- Asserted: passes — The authors put it forward as true.
- Checkable: passes — It can be checked against evidence.
- Load-bearing: passes — The paper’s conclusions depend on it.
- Based: passes — The paper gives a reason why it holds.
- Partly supported
The cited sources support only part of this claim — read each source’s verdict below.
In the paper
“This response is fast, reducing existing transcript pools for many repressed genes even before most positively regulated PU.1 target genes are seen to be turned on (80).”
§ Mechanisms of Action of Hematopoietic Transcription Factor PU.1 in Initiation of T-Cell Development > PU.1 Action via Cofactor Recruitment > The Problem of Pro-T Cell Gene Repression by PU.1
What the sources say
- Partly supportedcites [80] Hosokawa, 2018, Transcription factor PU.1 represses and activates gene expression in early T cells by redirecting partner transcription factor binding sourceExperimental — accuracy not yet measured
The Results section, “Repression is not preceded by transient PU.1 binding to ‘old’ Runx1 sites” (page unavailable), reports that most examined PU.1-repressed genes began reducing expression within 2 hours and were clearly repressed within 8 hours. It does not establish that existing transcript pools fell before most positively regulated PU.1 targets were turned on; that timing comparison is unsupported. (LLM, conf=0.84)
plaindirect- Asserted: passes — The authors put it forward as true.
- Checkable: passes — It can be checked against evidence.
- Load-bearing: passes — The paper’s conclusions depend on it.
- Based: passes — The paper gives a reason why it holds.
- Partly supported
Every source the paper cites for this claim was checked and supports it.
In the paper
“proteomic analysis provides support for a strong representation of Runx1 in PU.1-containing complexes formed in the pro-T cell like Scid.adh.2C2 cell line (80).”
§ Mechanisms of Action of Hematopoietic Transcription Factor PU.1 in Initiation of T-Cell Development > PU.1 Action via Cofactor Recruitment > System Consequences of Cofactor Recruitment: Repression by Theft
What the sources say
- Supportedcites [80] Hosokawa, 2018, Transcription factor PU.1 represses and activates gene expression in early T cells by redirecting partner transcription factor binding source
The Results section, “Satb1 and Runx1 interact with PU.1 in early T cells,” reports affinity purification of PU.1-containing complexes from Scid.adh.2c2 cells followed by mass spectrometry. Runx1 was repeatedly detected, its signals were among the highest, and its association with PU.1 was validated by co-immunoprecipitation. The supplied passage has no page number. (LLM, conf=0.94)
boostedcorrelational- Asserted: passes — The authors put it forward as true.
- Checkable: passes — It can be checked against evidence.
- Load-bearing: unclear — It is unclear whether the paper’s conclusions depend on it.
- Based: passes — The paper gives a reason why it holds.
- Supported
Every source the paper cites for this claim was checked and supports it.
In the paper
“Notably, PU.1 appears to be excluded from genomic regions that are packaged in Polycomb Repressive Complex 2-modified chromatin, as marked by trimethylation of Histone H3 Lysine 27 (H3K27me3) (84).”
§ Mechanisms of Action of Hematopoietic Transcription Factor PU.1 in Initiation of T-Cell Development > PU.1 Action on the Genome via Direct Binding > PU.1 Binding Site Characteristics
What the sources say
- Supportedcites [84] Zhang, 2012, Dynamic transformations of genome-wide epigenetic marking and transcriptional control establish T cell identity source
In Results, “Histone marking and modes of action” (page unavailable), the paper reports that PU.1 binding had little overlap with H3K27me3, even at silent genes. This supports the citing sentence’s hedged description of PU.1 as appearing to be excluded from H3K27me3-marked regions. (LLM, conf=0.91)
hedged- Asserted: passes — The authors put it forward as true.
- Checkable: passes — It can be checked against evidence.
- Load-bearing: passes — The paper’s conclusions depend on it.
- Based: passes — The paper gives a reason why it holds.
- Supported
The cited sources support only part of this claim — read each source’s verdict below.
In the paper
“PU.1 recognition motifs are the most highly enriched of all defined motifs at sites that start out highly accessible in early pro-T cell stages, when PU.1 is present, and lose accessibility during commitment, i.e., as PU.1 levels decline (44, 85, 95).”
§ Mechanisms of Action of Hematopoietic Transcription Factor PU.1 in Initiation of T-Cell Development > PU.1 Action on the Genome via Direct Binding > PU.1 Binding Site Characteristics
What the sources say
- Partly supportedcites [44] Hu, 2018, Transformation of accessible chromatin and 3D nucleome underlies lineage commitment of early T cells sourceExperimental — accuracy not yet measured
The Results section, “Regulome reorganization is associated to T cell commitment” (page unavailable), says sites losing accessibility in earlier stages were specifically enriched for the PU.1 binding motif. It does not establish that PU.1 was the most highly enriched of all defined motifs. (LLM, conf=0.83)
- Supportedcites [85] Ungerbäck, 2018, Pioneering, chromatin remodeling, and epigenetic constraint in early T-cell gene regulation by SPI1 (PU.1) source
The Results section on PU.1 affinity thresholds states that the canonical PU.1 motif was the most enriched at all classes of PU.1-occupied sites. The Results section on nonpromoter sites identifies a class accessible in early pro-T cells that loses accessibility during commitment as PU.1 expression declines. The paper gives no page numbers for these passages. (LLM, conf=0.87)
- Partly supportedcites [95] Johnson, 2018, Lineage-determining transcription factor TCF-1 initiates the epigenetic identity of T cells sourceExperimental — accuracy not yet measured
The Results sections on chromatin remodeling and TCF-1 enrichment report that many sites open at the early ETP stage later lose accessibility, and that early regulatory elements deactivated before maturation are enriched for PU.1 binding. Our copy does not establish that PU.1 recognition motifs are the most highly enriched of all defined motifs at those sites, or that their accessibility is lost specifically during commitment. (LLM, conf=0.86)
plaincorrelational- Asserted: passes — The authors put it forward as true.
- Checkable: passes — It can be checked against evidence.
- Load-bearing: passes — The paper’s conclusions depend on it.
- Based: passes — The paper gives a reason why it holds.
- Partly supported
Every source the paper cites for this claim was checked and supports it.
In the paper
“such sites, where PU.1 itself is important to maintain chromatin accessibility, are the ones most often linked to genes that are positively regulated in their expression by PU.1 (85).”
§ Mechanisms of Action of Hematopoietic Transcription Factor PU.1 in Initiation of T-Cell Development > PU.1 Action on the Genome via Direct Binding > PU.1 Binding Site Characteristics
What the sources say
- Supportedcites [85] Ungerbäck, 2018, Pioneering, chromatin remodeling, and epigenetic constraint in early T-cell gene regulation by SPI1 (PU.1) source
The Discussion states that positively regulated PU.1 targets in early pro-T cells are linked to nonpromoter binding sites that depend on PU.1 for ATAC accessibility. The Results section on nonpromoter PU.1 sites likewise reports that genes linked to these dynamic sites were more likely to lose expression as PU.1 declined than genes linked to constitutively accessible sites. (LLM, conf=0.93)
plaincorrelational- Asserted: passes — The authors put it forward as true.
- Checkable: passes — It can be checked against evidence.
- Load-bearing: passes — The paper’s conclusions depend on it.
- Based: passes — The paper gives a reason why it holds.
- Supported
Every source the paper cites for this claim was checked and supports it.
In the paper
“In pro-T cells, PU.1 binding sites in open chromatin genome-wide are highly enriched for Runx motifs, raising the possibility that Runx factors assist in the chromatin opening process (85)”
§ Mechanisms of Action of Hematopoietic Transcription Factor PU.1 in Initiation of T-Cell Development > PU.1 Action via Cofactor Recruitment > System Consequences of Cofactor Recruitment: Repression by Theft
What the sources say
- Supportedcites [85] Ungerbäck, 2018, Pioneering, chromatin remodeling, and epigenetic constraint in early T-cell gene regulation by SPI1 (PU.1) source
The Results section on PU.1 affinity thresholds reports high coenrichment of RUNX family motifs at PU.1-bound open sites. The Discussion also says PU.1 may cooperate with RUNX1 in causing chromatin to open, supporting the sentence’s stated possibility without presenting it as established. (LLM, conf=0.92)
plaincorrelational- Asserted: passes — The authors put it forward as true.
- Checkable: passes — It can be checked against evidence.
- Load-bearing: passes — The paper’s conclusions depend on it.
- Based: passes — The paper gives a reason why it holds.
- Supported
The cited sources support only part of this claim — read each source’s verdict below.
In the paper
“By the ability to enter closed chromatin at its own high-affinity sites, and by its functional role in controlling chromatin accessibility at other sites, PU.1 meets the criteria for “pioneer” factor activity in early pro-T cells (98)”
§ Mechanisms of Action of Hematopoietic Transcription Factor PU.1 in Initiation of T-Cell Development > PU.1 Action on the Genome via Direct Binding > PU.1 Binding Site Characteristics
What the sources say
- Partly supportedcites [98] Zaret, 2011, Pioneer transcription factors: establishing competence for gene expression sourceExperimental — accuracy not yet measured
The section “Initiating events in chromatin: pioneer factors bind first” describes PU.1 binding before Pax5 activation in B-cell development and says PU.1 can alter local chromatin. The paper also describes access to compacted chromatin as a pioneer-factor property. It does not establish PU.1 binding at its own high-affinity sites or controlling accessibility at other sites in early pro-T cells; no page numbers were supplied for these passages. (LLM, conf=0.85)
plaindirect- Asserted: passes — The authors put it forward as true.
- Checkable: passes — It can be checked against evidence.
- Load-bearing: passes — The paper’s conclusions depend on it.
- Based: passes — The paper gives a reason why it holds.
- Partly supported
Every source the paper cites for this claim was checked and supports it.
In the paper
“the evidence from both gain and loss of function studies shows that PU.1 is most associated with chromatin accessibility when it is binding at non-promoter sequences, within introns of genes or in intergenic regions.”
§ Mechanisms of Action of Hematopoietic Transcription Factor PU.1 in Initiation of T-Cell Development > PU.1 Action on the Genome via Direct Binding > PU.1 Binding Site Characteristics
What the sources say
- Supportedcites [85] Ungerbäck, 2018, Pioneering, chromatin remodeling, and epigenetic constraint in early T-cell gene regulation by SPI1 (PU.1) source
In Results, “Nonpromoter PU.1 sites control chromatin configuration and function” (page unavailable), the paper reports that PU.1 deletion reduced accessibility at many nonpromoter binding sites but had little effect at promoters. The same section concludes that PU.1 binding is more important for chromatin accessibility at nonpromoter regions than at promoters; the Discussion likewise places its chromatin-opening effects especially at nonpromoter sites. The citing sentence’s intronic and intergenic locations are examples of those nonpromoter regions. (LLM, conf=0.89)
plaincorrelational- Asserted: passes — The authors put it forward as true.
- Checkable: passes — It can be checked against evidence.
- Load-bearing: passes — The paper’s conclusions depend on it.
- Based: passes — The paper gives a reason why it holds.
- Supported
Every source the paper cites for this claim was checked and supports it.
In the paper
“PU.1 is a powerful organizer of the occupancy patterns of other transcription factors genome-wide. PU.1 binding shifts the disposition of other factors in the cell across the genome, even when their own expression levels and total numbers of binding sites remain essentially unchanged (80).”
§ Mechanisms of Action of Hematopoietic Transcription Factor PU.1 in Initiation of T-Cell Development > PU.1 Action via Cofactor Recruitment > System Consequences of Cofactor Recruitment: Repression by Theft
What the sources say
- Supportedcites [80] Hosokawa, 2018, Transcription factor PU.1 represses and activates gene expression in early T cells by redirecting partner transcription factor binding source
Split into 2 atoms — 2 confirmed, 0 partially supported, 0 disputed, 0 misattributed, 0 unverifiable. Expand the claim to see per-atom verdicts.
boosteddirect- Asserted: passes — The authors put it forward as true.
- Checkable: passes — It can be checked against evidence.
- Load-bearing: passes — The paper’s conclusions depend on it.
- Based: passes — The paper gives a reason why it holds.
- Supported
Every source the paper cites for this claim was checked and supports it.
In the paper
“when activated in primary cells, C/EBPα itself can also repress Notch1 (50).”
§ Mechanisms of Action of Hematopoietic Transcription Factor PU.1 in Initiation of T-Cell Development > PU.1 Action via Cofactor Recruitment > The Problem of Pro-T Cell Gene Repression by PU.1
What the sources say
- Supportedcites [50] Laiosa, 2006, Reprogramming of committed T cell progenitors to macrophages and dendritic cells by C/EBPα and PU.1 transcription factors source
The Results report that Notch1 appeared downregulated by day 2 in pre-T cells infected with C/EBPα. The Discussion also describes C/EBPα-induced Notch1 downregulation, while noting that its mechanism is unclear. (LLM, conf=0.91)
plaindirect- Asserted: passes — The authors put it forward as true.
- Checkable: passes — It can be checked against evidence.
- Load-bearing: unclear — It is unclear whether the paper’s conclusions depend on it.
- Based: passes — The paper gives a reason why it holds.
- Supported
The cited sources support only part of this claim — read each source’s verdict below.
In the paper
“PU.1 introduced into primary pro-T cells or Scid.adh.2C2 cells causes downregulation of many T-cell genes, especially those associated with Notch signaling and TCR gene rearrangement after commitment.”
§ Mechanisms of Action of Hematopoietic Transcription Factor PU.1 in Initiation of T-Cell Development > PU.1 Action via Cofactor Recruitment > The Problem of Pro-T Cell Gene Repression by PU.1
What the sources say
- Partly supportedcites [80] Hosokawa, 2018, Transcription factor PU.1 represses and activates gene expression in early T cells by redirecting partner transcription factor binding sourceExperimental — accuracy not yet measured
The Results sections on primary DN cells and endogenous PU.1 report that added PU.1 downregulated some T-cell-program genes in newly committed cells and inhibited a set of 564 genes in DN2b cells. The Scid.adh.2c2 Results section reports loss of a T-cell marker after PU.1 introduction and links displaced binding sites to T-cell genes including Rag1. Our copy does not establish that the downregulated genes were especially associated with Notch signaling and TCR gene rearrangement. (LLM, conf=0.85)
plaindirect- Asserted: passes — The authors put it forward as true.
- Checkable: passes — It can be checked against evidence.
- Load-bearing: passes — The paper’s conclusions depend on it.
- Based: passes — The paper gives a reason why it holds.
- Partly supported
Every source the paper cites for this claim was checked and supports it.
In the paper
“These sites in closed chromatin have particularly high-quality matches to the consensus PU.1 binding position weight matrix (85)”
§ Mechanisms of Action of Hematopoietic Transcription Factor PU.1 in Initiation of T-Cell Development > PU.1 Action on the Genome via Direct Binding > PU.1 Binding Site Characteristics
What the sources say
- Supportedcites [85] Ungerbäck, 2018, Pioneering, chromatin remodeling, and epigenetic constraint in early T-cell gene regulation by SPI1 (PU.1) source
In Results, under “Distinct PU.1 affinity thresholds in open and closed chromatin,” the authors score PU.1-occupied sites against a position weight matrix and report that sites in closed regions have higher motif-quality scores than those in open regions. This supports the claim for PU.1-occupied sites in the pro-T cells studied. (LLM, conf=0.94)
plaincorrelational- Asserted: passes — The authors put it forward as true.
- Checkable: passes — It can be checked against evidence.
- Load-bearing: passes — The paper’s conclusions depend on it.
- Based: passes — The paper gives a reason why it holds.
- Supported
Every source the paper cites for this claim was checked and supports it.
In the paper
“The results showed that PU.1 exerts its main functional regulatory impacts in pro-T cells via non-promoter sites, and especially via sites that are normally developmentally changing in chromatin accessibility (85) (Figure 6).”
§ Mechanisms of Action of Hematopoietic Transcription Factor PU.1 in Initiation of T-Cell Development > PU.1 Action via Cofactor Recruitment > Direct Gene Regulation by PU.1: Activation by Distal Enhancer Engagement and Opening
What the sources say
- Supportedcites [85] Ungerbäck, 2018, Pioneering, chromatin remodeling, and epigenetic constraint in early T-cell gene regulation by SPI1 (PU.1) source
The Discussion (Figure 6 discussion) says PU.1’s functional impact at promoters in pro-T cells is often weak or absent unless accompanied by nonpromoter binding, and that dynamic distal elements are best associated with function. The Results (‘Opening of closed chromatin by PU.1 mediates its developmental gene regulatory function’) link PU.1-driven transcriptional changes to nonpromoter sites whose accessibility normally changes with PU.1 expression. (LLM, conf=0.94)
plaindirect- Asserted: passes — The authors put it forward as true.
- Checkable: passes — It can be checked against evidence.
- Load-bearing: passes — The paper’s conclusions depend on it.
- Based: passes — The paper gives a reason why it holds.
- Supported
Every source the paper cites for this claim was checked and supports it.
In the paper
“it is important to note that the developmental speed-up observed in primary pro-T cells when PU.1 is knocked out also points to a normal PU.1 role as a brake on developmental progression (79).”
§ Mechanisms of Action of Hematopoietic Transcription Factor PU.1 in Initiation of T-Cell Development > PU.1 Action via Cofactor Recruitment > The Problem of Pro-T Cell Gene Repression by PU.1
What the sources say
- Supportedcites [79] Champhekar, 2015, Regulation of early T-lineage gene expression and developmental progression by the progenitor cell transcription factor PU source
The Results section (“PU.1 is required for DN progression and survival”) reports that primary early T cells with PU.1 deleted at the ETP or DN2a stage differentiated faster than controls. It concludes that PU.1 normally restrains differentiation, matching the claimed role as a brake on developmental progression; the effect was not seen with deletion at DN2b. (LLM, conf=0.94)
hedgeddirect- Asserted: passes — The authors put it forward as true.
- Checkable: passes — It can be checked against evidence.
- Load-bearing: passes — The paper’s conclusions depend on it.
- Based: passes — The paper gives a reason why it holds.
- Supported
Every source the paper cites for this claim was checked and supports it.
In the paper
“The “theft” mechanism of repression by partner factor redistribution is not unique to the PU.1-Runx1 pair.”
§ Mechanisms of Action of Hematopoietic Transcription Factor PU.1 in Initiation of T-Cell Development > PU.1 Action via Cofactor Recruitment > System Consequences of Cofactor Recruitment: Repression by Theft
What the sources say
- Supportedcites [80] Hosokawa, 2018, Transcription factor PU.1 represses and activates gene expression in early T cells by redirecting partner transcription factor binding source
The Abstract says PU.1 removes both Satb1 and Runx1 from their preferred binding sites and links this partner-factor ‘theft’ to repression. The Results section ‘Satb1 and Runx1 binding predicts PU.1-mediated gene regulation’ likewise identifies loss of either factor from old sites as a possible mechanism of indirect repression. The mechanism is therefore not limited to the PU.1–Runx1 pair. (LLM, conf=0.93)
- Supportedcites [117] Kanhere, 2012, T-bet and GATA3 orchestrate Th1 and Th2 differentiation through lineage-specific targeting of distal regulatory elements source
The Discussion describes T-bet redistributing GATA3 away from Th2 genes, preventing their activation in Th1 cells. The Results likewise associate this redistribution with repression of Th2-specific expression, providing another example of the mechanism described in the claim. (LLM, conf=0.91)
- Supportedcites [118] Evans, 2013, Transcription factor interplay in T helper cell differentiation source
In “Co-expression of FOXP3 with effector cell regulators” (page unavailable), the paper says FOXP3 interferes with RORγt activation and that their antagonism involves physical competition for their shared partner RUNX1. This supports the claim that repression through competition for a partner factor is not limited to the PU.1–RUNX1 pair. (LLM, conf=0.88)
plain- Asserted: passes — The authors put it forward as true.
- Checkable: passes — It can be checked against evidence.
- Load-bearing: unclear — It is unclear whether the paper’s conclusions depend on it.
- Based: passes — The paper gives a reason why it holds.
- Supported
The cited sources support only part of this claim — read each source’s verdict below.
In the paper
“the PU.1-repressed genes that appear to be responding to Satb1 loss are different from those that are most dependent on Runx1”
§ Mechanisms of Action of Hematopoietic Transcription Factor PU.1 in Initiation of T-Cell Development > PU.1 Action via Cofactor Recruitment > System Consequences of Cofactor Recruitment: Repression by Theft
What the sources say
- Partly supportedcites [80] Hosokawa, 2018, Transcription factor PU.1 represses and activates gene expression in early T cells by redirecting partner transcription factor binding sourceExperimental — accuracy not yet measured
In Results, under “Functional importance of Satb1 and Runx1 in gene regulation by PU.1” (page not available), the paper reports that many PU.1-repressed genes lose expression after Satb1 or Runx1 disruption. The passages do not establish that the genes responding to Satb1 loss are different from those most dependent on Runx1; the explicit statement about the factors having different effects concerns PU.1-activated genes. (LLM, conf=0.80)
hedged- Asserted: passes — The authors put it forward as true.
- Checkable: passes — It can be checked against evidence.
- Load-bearing: passes — The paper’s conclusions depend on it.
- Based: passes — The paper gives a reason why it holds.
- Partly supported
Every source the paper cites for this claim was checked and supports it.
In the paper
“A very similar phenomenon has been reported earlier by Jenner and colleagues for the effect of T-bet on GATA-3 in establishing the Th1 cell program (117, 118).”
§ Mechanisms of Action of Hematopoietic Transcription Factor PU.1 in Initiation of T-Cell Development > PU.1 Action via Cofactor Recruitment > System Consequences of Cofactor Recruitment: Repression by Theft
What the sources say
- Supportedcites [117] Kanhere, 2012, T-bet and GATA3 orchestrate Th1 and Th2 differentiation through lineage-specific targeting of distal regulatory elements source
The Results section (“T-bet causes GATA3 binding at Th1-specific sites”; page not provided) reports that T-bet is sufficient to induce GATA3 occupancy at those sites. The Discussion explains that this redistributes GATA3 away from Th2 genes, helping prevent their activation in Th1 cells. (LLM, conf=0.93)
- Supportedcites [118] Evans, 2013, Transcription factor interplay in T helper cell differentiation source
In “Interplay between T-bet, GATA3 and RORγt” (page not supplied), the authors report that T-bet induces redistribution of GATA3 to Th1-specific sites and away from Th2 genes. This supports the attributed effect of T-bet on GATA3 in the Th1 program. (LLM, conf=0.92)
plaindirect- Asserted: passes — The authors put it forward as true.
- Checkable: passes — It can be checked against evidence.
- Load-bearing: unclear — It is unclear whether the paper’s conclusions depend on it.
- Based: passes — The paper gives a reason why it holds.
- Supported
Every source the paper cites for this claim was checked and supports it.
In the paper
“As expected, PU.1 recruits Runx1 to sites where Runx1 exerts measurable functional collaboration with PU.1, mostly to help in the positive regulation of PU.1 targets (80).”
§ Mechanisms of Action of Hematopoietic Transcription Factor PU.1 in Initiation of T-Cell Development > PU.1 Action via Cofactor Recruitment > System Consequences of Cofactor Recruitment: Repression by Theft
What the sources say
- Supportedcites [80] Hosokawa, 2018, Transcription factor PU.1 represses and activates gene expression in early T cells by redirecting partner transcription factor binding source
The Results section, “PU.1 redirects transcription factor ensembles across the genome” (page unavailable), reports that PU.1 recruits Runx1 to new co-bound sites. “Functional importance of Satb1 and Runx1 in gene regulation by PU.1” (page unavailable) reports reduced activation of several PU.1-positive targets when Runx1 was disrupted and concludes that Runx1 collaborates functionally with PU.1 on many positive-regulation targets. (LLM, conf=0.90)
plaindirect- Asserted: passes — The authors put it forward as true.
- Checkable: passes — It can be checked against evidence.
- Load-bearing: passes — The paper’s conclusions depend on it.
- Based: passes — The paper gives a reason why it holds.
- Supported
The cited sources support only part of this claim — read each source’s verdict below.
In the paper
“In contrast, Gene Ontology and Pathway analyses as well as simple gene lists reveal that PU.1 directly controls major systems of cytokine receptors, chemokine receptors, tyrosine protein kinases, G-protein receptor signaling molecules, and adhesion or cytoskeletal system molecules (Table 2) (85).”
§ Mechanisms of Action of Hematopoietic Transcription Factor PU.1 in Initiation of T-Cell Development > The PU.1 Regulome in Early pro-T cells and Its physiological Roles > PU.1 as a Choreographer of Thymocyte Cell Biology
What the sources say
- Partly supportedcites [85] Ungerbäck, 2018, Pioneering, chromatin remodeling, and epigenetic constraint in early T-cell gene regulation by SPI1 (PU.1) sourceExperimental — accuracy not yet measured
The Results section ('PU.1 requires its non-DNA-binding domains to occupy sites in closed chromatin'; page not provided) identifies PU.1-regulated genes including Syk, Ffar2, Cd44, and Flt3. The Discussion also reports direct PU.1 targets in early pro-T cells. Our copy does not establish the claimed major systems across all five listed categories, particularly chemokine receptors, or report the stated Gene Ontology and Pathway findings. (LLM, conf=0.82)
plaindirect- Asserted: passes — The authors put it forward as true.
- Checkable: passes — It can be checked against evidence.
- Load-bearing: passes — The paper’s conclusions depend on it.
- Based: passes — The paper gives a reason why it holds.
- Partly supported
The cited sources support only part of this claim — read each source’s verdict below.
In the paper
“However, by far the most highly enriched sequence-specific transcription factor proteins interacting with PU.1 in these cells were Rest and Runx1 (80).”
§ Mechanisms of Action of Hematopoietic Transcription Factor PU.1 in Initiation of T-Cell Development > PU.1 Action via Cofactor Recruitment > System Consequences of Cofactor Recruitment: Repression by Theft
What the sources say
- Partly supportedcites [80] Hosokawa, 2018, Transcription factor PU.1 represses and activates gene expression in early T cells by redirecting partner transcription factor binding sourceExperimental — accuracy not yet measured
In Results (“Satb1 and Runx1 interact with PU.1 in early T cells”; page unavailable), the paper reports that Satb1 and Runx1 were repeatedly detected among PU.1-interacting proteins, with Runx1 signals among the highest. It names Satb1, not Rest, and does not establish that the named pair were ‘by far’ the most highly enriched sequence-specific factors. (LLM, conf=0.88)
plaincorrelational- Asserted: passes — The authors put it forward as true.
- Checkable: passes — It can be checked against evidence.
- Load-bearing: passes — The paper’s conclusions depend on it.
- Based: passes — The paper gives a reason why it holds.
- Partly supported
The cited sources support only part of this claim — read each source’s verdict below.
In the paper
“motif analysis shows that many of the Runx occupancy sites that are emptied when PU.1 is in the cell are high quality Runx sites in the upper half of the position weight matrix score distribution (80).”
§ Mechanisms of Action of Hematopoietic Transcription Factor PU.1 in Initiation of T-Cell Development > PU.1 Action via Cofactor Recruitment > System Consequences of Cofactor Recruitment: Repression by Theft
What the sources say
- Partly supportedcites [80] Hosokawa, 2018, Transcription factor PU.1 represses and activates gene expression in early T cells by redirecting partner transcription factor binding sourceExperimental — accuracy not yet measured
The Results section (“PU.1 redirects transcription factor ensembles across the genome”; page unavailable) says that the ‘old’ Runx1 sites diminished by PU.1 matched the Runx1 PWM much better than the newly occupied sites. This supports the higher-quality-site comparison, but our copy does not establish that many of those sites fell in the upper half of the PWM score distribution. (LLM, conf=0.84)
plaincorrelational- Asserted: passes — The authors put it forward as true.
- Checkable: passes — It can be checked against evidence.
- Load-bearing: passes — The paper’s conclusions depend on it.
- Based: passes — The paper gives a reason why it holds.
- Partly supported
The cited sources support only part of this claim — read each source’s verdict below.
In the paper
“When epitope-tagged PU.1 was introduced into Scid.adh.2C2 cells and the complexes were isolated for proteomic analysis, much enrichment was seen for SWI/SNF complex components as well as some other chromatin modifiers (80).”
§ Mechanisms of Action of Hematopoietic Transcription Factor PU.1 in Initiation of T-Cell Development > PU.1 Action via Cofactor Recruitment > System Consequences of Cofactor Recruitment: Repression by Theft
What the sources say
- Partly supportedcites [80] Hosokawa, 2018, Transcription factor PU.1 represses and activates gene expression in early T cells by redirecting partner transcription factor binding sourceExperimental — accuracy not yet measured
The Results section, “Satb1 and Runx1 interact with PU.1 in early T cells” (page not provided), reports affinity purification and mass spectrometry of tagged PU.1 complexes from Scid.adh.2c2 cells, with enrichment of proteins involved in chromatin remodeling. Our copy does not identify the enriched proteins as SWI/SNF complex components, so that specific part of the claim is not supported. (LLM, conf=0.84)
plaincorrelational- Asserted: passes — The authors put it forward as true.
- Checkable: passes — It can be checked against evidence.
- Load-bearing: passes — The paper’s conclusions depend on it.
- Based: passes — The paper gives a reason why it holds.
- Partly supported
Every source the paper cites for this claim was checked and supports it.
In the paper
“Although Runx1 can act as a global chromatin accessibility organizer (114), PU.1 itself does not depend on Runx1 for establishing permissive sites for its binding, even in the “blank slate” context of the Scid.adh.2C2 cells (85).”
§ Mechanisms of Action of Hematopoietic Transcription Factor PU.1 in Initiation of T-Cell Development > PU.1 Action via Cofactor Recruitment > System Consequences of Cofactor Recruitment: Repression by Theft
What the sources say
- Supportedcites [85] Ungerbäck, 2018, Pioneering, chromatin remodeling, and epigenetic constraint in early T-cell gene regulation by SPI1 (PU.1) source
In the Results section, the authors report that disrupting Runx1 in Scid.adh.2C2 cells left exogenous PU.1 binding essentially unchanged at both previously open and closed nonpromoter sites. They conclude that PU.1 does not depend on RUNX1 to establish its binding at those sites. (LLM, conf=0.92)
plain- Asserted: passes — The authors put it forward as true.
- Checkable: passes — It can be checked against evidence.
- Load-bearing: passes — The paper’s conclusions depend on it.
- Based: passes — The paper gives a reason why it holds.
- Supported
Every source the paper cites for this claim was checked and supports it.
In the paper
“GATA-3 also shifts, when PU.1 is added, to occupy sites together with PU.1 (80).”
§ Mechanisms of Action of Hematopoietic Transcription Factor PU.1 in Initiation of T-Cell Development > PU.1 Action via Cofactor Recruitment > System Consequences of Cofactor Recruitment: Repression by Theft
What the sources say
- Supportedcites [80] Hosokawa, 2018, Transcription factor PU.1 represses and activates gene expression in early T cells by redirecting partner transcription factor binding source
The Results section (‘PU.1 redirects transcription factor ensembles across the genome’; page not provided) reports that adding PU.1 partially displaced GATA3 from its previous sites and partially recruited it to PU.1-associated Group 1 sites. This supports the claimed shift, though the paper describes it as partial. (LLM, conf=0.91)
plaindirect- Asserted: passes — The authors put it forward as true.
- Checkable: passes — It can be checked against evidence.
- Load-bearing: passes — The paper’s conclusions depend on it.
- Based: passes — The paper gives a reason why it holds.
- Supported
The cited sources support only part of this claim — read each source’s verdict below.
In the paper
“Varied PU.1 gain and loss of function perturbations in the DN2-DN3 stages show that PU.1 does provide positive input into a discrete subset of Phase 1 regulatory genes, with Mef2c, Lmo2, Bcl11a, and often also Hhex responding over a range of different tests (58, 79, 80, 85).”
§ Mechanisms of Action of Hematopoietic Transcription Factor PU.1 in Initiation of T-Cell Development > The PU.1 Regulome in Early pro-T cells and Its physiological Roles > PU.1 Target Genes: Gene Network Roles and Developmental Timing
What the sources say
- Partly supportedcites [58] Del Real, 2013, Architecture of a lymphomyeloid developmental switch controlled by PU.1, Notch and Gata3 sourceExperimental — accuracy not yet measured
In the section on fetal-thymocyte responses to high-level PU.1 (page not supplied), the paper reports PU.1-dependent upregulation of Bcl11a and Hhex and effects on Lmo2 in DN2 cells; it says the Hhex and Lmo2 effects were not significant in DN3 cells. The cited copy does not show Mef2c responding or establish the claimed pattern across both gain- and loss-of-function tests. (LLM, conf=0.86)
- Partly supportedcites [79] Champhekar, 2015, Regulation of early T-lineage gene expression and developmental progression by the progenitor cell transcription factor PU sourceExperimental — accuracy not yet measured
The Results section on selective roles for PU.1 reports that added PU.1 up-regulated Bcl11a, Lmo2, and Mef2c, consistent with deletion and PU.1-Eng tests; the Discussion identifies them as a subset of phase 1 genes positively regulated by PU.1. The passages do not establish the claimed response of Hhex, and the reported deletion effects concern DN1 and early DN2 cells rather than DN2–DN3 stages throughout. No page numbers are available in our copy. (LLM, conf=0.88)
- Partly supportedcites [80] Hosokawa, 2018, Transcription factor PU.1 represses and activates gene expression in early T cells by redirecting partner transcription factor binding sourceExperimental — accuracy not yet measured
The Results section on functional gene responses (page unavailable) reports that disrupting PU.1 reduced expression of a set of positively controlled genes in pro-T cells, supporting the general claim of positive input. Our copy does not identify Mef2c, Lmo2, Bcl11a, or Hhex as responding genes, or establish that this particular subset responded across different tests; searches for those gene names found no matching passage. (LLM, conf=0.82)
plaindirect- Asserted: passes — The authors put it forward as true.
- Checkable: passes — It can be checked against evidence.
- Load-bearing: passes — The paper’s conclusions depend on it.
- Based: passes — The paper gives a reason why it holds.
- Partly supported
Every source the paper cites for this claim was checked and supports it.
In the paper
“However, PU.1 strongly affected the sites where Runx1 bound, resulting in a dramatic shift in Runx1 binding site choices in tests of gain of PU.1 function (80).”
§ Mechanisms of Action of Hematopoietic Transcription Factor PU.1 in Initiation of T-Cell Development > PU.1 Action via Cofactor Recruitment > System Consequences of Cofactor Recruitment: Repression by Theft
What the sources say
- Supportedcites [80] Hosokawa, 2018, Transcription factor PU.1 represses and activates gene expression in early T cells by redirecting partner transcription factor binding source
In the Results section, the PU.1-introduction experiment shows new Runx1 binding at non-promoter sites and reduced binding at about half of the non-promoter sites occupied in control cells. The paper also concludes that PU.1 caused Runx1 to leave higher-quality sites in favor of co-binding with PU.1 at lower-quality sites. (LLM, conf=0.93)
boosteddirect- Asserted: passes — The authors put it forward as true.
- Checkable: passes — It can be checked against evidence.
- Load-bearing: passes — The paper’s conclusions depend on it.
- Based: passes — The paper gives a reason why it holds.
- Supported
Every source the paper cites for this claim was checked and supports it.
In the paper
“Supporting the physiological relevance of this mechanism, many of the same genomic sites where Runx1 was shifted by PU.1 in Scid.adh.2C2 cells underwent the reverse changes in Runx1 occupancy in normal primary pro-T cells, as they progressed from PU.1-high to PU.1-low developmental stages.”
§ Mechanisms of Action of Hematopoietic Transcription Factor PU.1 in Initiation of T-Cell Development > PU.1 Action via Cofactor Recruitment > System Consequences of Cofactor Recruitment: Repression by Theft
What the sources say
- Supportedcites [80] Hosokawa, 2018, Transcription factor PU.1 represses and activates gene expression in early T cells by redirecting partner transcription factor binding source
The Results section, “PU.1 association shifts Satb1 and Runx1 binding patterns in primary DN cells” (page not provided), directly compares Runx1 peaks in primary DN1-to-DN3 cells with peaks in Scid.adh.2c2 cells after PU.1 introduction. It reports that the genomic sites were well correlated but shifted in opposite directions, matching the claim. (LLM, conf=0.94)
plaincorrelational- Asserted: passes — The authors put it forward as true.
- Checkable: passes — It can be checked against evidence.
- Load-bearing: passes — The paper’s conclusions depend on it.
- Based: passes — The paper gives a reason why it holds.
- Supported
Every source the paper cites for this claim was checked and supports it.
In the paper
“It has become clear that the progression of cells through T-cell commitment involves the ordered downregulation of a substantial set of progenitor-specific transcription factors, called “Phase 1” factors in this context, concomitant with the upregulation of T-lineage affiliated factors (34, 65, 84, 121, 122).”
§ Mechanisms of Action of Hematopoietic Transcription Factor PU.1 in Initiation of T-Cell Development > The PU.1 Regulome in Early pro-T cells and Its physiological Roles > PU.1 Target Genes: Gene Network Roles and Developmental Timing
What the sources say
- Supportedcites [34] Rothenberg, 2016, Forging T-Lymphocyte identity: intersecting networks of transcriptional control source
Section III.A identifies the downregulated stem-progenitor transcription factors as “phase 1” factors and describes successive rounds of their silencing, including during commitment. Section VI describes T-lineage regulators becoming active as progenitor factors are downregulated, supporting the concurrent progression in the claim. (LLM, conf=0.92)
- Supportedcites [65] Yui, 2014, Developmental gene networks: a triathlon on the course to T cell identity source
The Phase 1-restricted transcription factors section describes staggered losses of phase 1 genes as cells progress toward commitment. The Transition to phase 2 section says most phase 1 genes are silenced while Bcl11b and other T-lineage-associated factors are induced; Stages of early T-cell development likewise describes the commitment transition as both upregulation of T-cell genes and loss of progenitor-specific expression. (LLM, conf=0.94)
- Supportedcites [84] Zhang, 2012, Dynamic transformations of genome-wide epigenetic marking and transcriptional control establish T cell identity source
The Results section (“Transcription factor expression dynamics in T-lineage commitment”; page not provided) reports that many progenitor-associated regulatory genes decrease as T-lineage-associated factors increase between DN1 and DN2b. The Introduction describes an initial phase dominated by progenitor-cell regulatory genes that is dismantled as T-cell identity is established. (LLM, conf=0.91)
boostedcorrelational- Asserted: passes — The authors put it forward as true.
- Checkable: passes — It can be checked against evidence.
- Load-bearing: passes — The paper’s conclusions depend on it.
- Based: passes — The paper gives a reason why it holds.
- Supported
The cited sources support only part of this claim — read each source’s verdict below.
In the paper
“PU.1 has an even stronger effect on binding site choice of Satb1, another transcription factor that is expressed throughout early T-cell development”
§ Mechanisms of Action of Hematopoietic Transcription Factor PU.1 in Initiation of T-Cell Development > PU.1 Action via Cofactor Recruitment > System Consequences of Cofactor Recruitment: Repression by Theft
What the sources say
- Partly supportedcites [80] Hosokawa, 2018, Transcription factor PU.1 represses and activates gene expression in early T cells by redirecting partner transcription factor binding sourceExperimental — accuracy not yet measured
The Results section, “PU.1 redirects transcription factor ensembles across the genome” (page unavailable), reports that introducing PU.1 creates new Satb1 and Runx1 binding peaks and causes many old peaks to disappear. It does not establish the claimed comparison—that PU.1 affects Satb1 binding-site choice more strongly than Runx1 binding-site choice. (LLM, conf=0.82)
boosteddirect- Asserted: passes — The authors put it forward as true.
- Checkable: passes — It can be checked against evidence.
- Load-bearing: unclear — It is unclear whether the paper’s conclusions depend on it.
- Based: passes — The paper gives a reason why it holds.
- Partly supported
The cited sources that could be checked couldn’t confirm or dispute this claim.
In the paper
“Consistent with an evolutionarily conserved program in regulating these genes, the developmental expression patterns of these genes and PU.1 (Spi1) in human pro-T cells (Thy1—Thy4) are similar to their patterns in murine pro-T cells (35).”
§ Mechanisms of Action of Hematopoietic Transcription Factor PU.1 in Initiation of T-Cell Development > The PU.1 Regulome in Early pro-T cells and Its physiological Roles > PU.1 Target Genes: Gene Network Roles and Developmental Timing
What the sources say
- Could not verifycites [35] Casero, 2015, Long non-coding RNA profiling of human lymphoid progenitor cells reveals transcriptional divergence of B cell and T cell lineages sourceExperimental — accuracy not yet measured
The Results section on co-expression modules describes expression across human Thy1–Thy4 populations, but does not compare their developmental patterns with murine pro-T cells. Searches for PU.1/SPI1 and cross-species thymic expression found no passage in our copy establishing the claimed similarity (page unavailable). (LLM, conf=0.74)
plaincorrelational- Asserted: passes — The authors put it forward as true.
- Checkable: passes — It can be checked against evidence.
- Load-bearing: unclear — It is unclear whether the paper’s conclusions depend on it.
- Based: passes — The paper gives a reason why it holds.
- Could not verify
The cited sources support only part of this claim — read each source’s verdict below.
In the paper
“GATA-3 was expected to be present as well, and it was detectably enriched over background in these complexes.”
§ Mechanisms of Action of Hematopoietic Transcription Factor PU.1 in Initiation of T-Cell Development > PU.1 Action via Cofactor Recruitment > System Consequences of Cofactor Recruitment: Repression by Theft
What the sources say
- Partly supportedcites [80] Hosokawa, 2018, Transcription factor PU.1 represses and activates gene expression in early T cells by redirecting partner transcription factor binding sourceExperimental — accuracy not yet measured
The Results section, “PU.1 redirects transcription factor ensembles across the genome” (page unavailable), reports that GATA3 was partially recruited to PU.1-associated genomic sites. But the Results section on PU.1-containing complexes names Satb1 and Runx1—not GATA3—as detected by mass spectrometry; our copy does not establish that GATA3 was enriched over background in the purified complexes. (LLM, conf=0.78)
plaincorrelational- Asserted: passes — The authors put it forward as true.
- Checkable: passes — It can be checked against evidence.
- Load-bearing: unclear — It is unclear whether the paper’s conclusions depend on it.
- Based: passes — The paper gives a reason why it holds.
- Partly supported
The cited sources support only part of this claim — read each source’s verdict below.
In the paper
“Although Satb1 in DN2-DN3 stages appears to have weaker effects on gene expression than Runx1”
§ Mechanisms of Action of Hematopoietic Transcription Factor PU.1 in Initiation of T-Cell Development > PU.1 Action via Cofactor Recruitment > System Consequences of Cofactor Recruitment: Repression by Theft
What the sources say
- Partly supportedcites [80] Hosokawa, 2018, Transcription factor PU.1 represses and activates gene expression in early T cells by redirecting partner transcription factor binding sourceExperimental — accuracy not yet measured
The Results section, “Functional importance of Satb1 and Runx1 in gene regulation by PU.1” (page unavailable), explicitly says acute Runx1 disruption had stronger effects than Satb1 disruption. That direct comparison is from cell-line experiments; the paper’s primary DN-cell results discuss effects of both deletions but do not establish the same overall comparison specifically across DN2–DN3 stages. (LLM, conf=0.82)
hedged- Asserted: passes — The authors put it forward as true.
- Checkable: passes — It can be checked against evidence.
- Load-bearing: unclear — It is unclear whether the paper’s conclusions depend on it.
- Based: passes — The paper gives a reason why it holds.
- Partly supported
Every source the paper cites for this claim was checked and supports it.
In the paper
“In the case of PU.1, the change in its role occurs within fetal life, and this has now been sharply situated in the transition from precociously committed “first-wave” precursors to precursors that enter the thymus while still multipotent (147).”
§ Mechanisms of Action of Hematopoietic Transcription Factor PU.1 in Initiation of T-Cell Development > PU.1 and the Regulation of Lymphoid Development in Ontogeny
What the sources say
- Supportedcites [147] Montecino-Rodriguez, 2018, Differential expression of PU.1 and Key T lineage transcription factors distinguishes fetal and adult T Cell development source
The Introduction describes an early fetal wave whose thymus-seeding cells are T-lineage restricted and a second wave after E16 whose cells retain B and myeloid potential. The Discussion reports that early fetal thymopoiesis has a lower requirement for PU.1 than thymopoiesis in late gestation, placing the change in PU.1 requirement within fetal life. The evidence concerns the level of PU.1 required, rather than a complete switch from no role to a role. (LLM, conf=0.88)
boostedcorrelational- Asserted: passes — The authors put it forward as true.
- Checkable: passes — It can be checked against evidence.
- Load-bearing: passes — The paper’s conclusions depend on it.
- Based: passes — The paper gives a reason why it holds.
- Supported
The cited sources support only part of this claim — read each source’s verdict below.
In the paper
“Gene expression differences have been noted between the normal first-wave fetal and adult pro-T cells in the thymus at corresponding stages which indicate that the fetal program drives accelerated development (148, 149).”
§ Mechanisms of Action of Hematopoietic Transcription Factor PU.1 in Initiation of T-Cell Development > PU.1 and the Regulation of Lymphoid Development in Ontogeny
What the sources say
- Not checked — no full text of the sourcecites [148] David-Fung, 2006, Progression of regulatory gene expression states in fetal and adult pro-T-cell development source
- Partly supportedcites [149] Belyaev, 2012, Global transcriptional analysis of primitive thymocytes reveals accelerated dynamics of T cell specification in fetal stages sourceExperimental — accuracy not yet measured
The Results (Organization of transcriptional territories; page unavailable) report that fetal progenitors at corresponding stages have different gene-expression signatures and are more advanced in T-cell specification than adult progenitors. However, the cells analyzed were from E15.5 fetal thymi; the Results (Phenotypic and proliferative differences; page unavailable) distinguish them from the first wave of thymus-colonizing cells at E12.5. The paper therefore supports accelerated fetal development, but not the claim's specific identification of the compared cells as first-wave cells. (LLM, conf=0.82)
hedgeddirect- Asserted: passes — The authors put it forward as true.
- Checkable: passes — It can be checked against evidence.
- Load-bearing: passes — The paper’s conclusions depend on it.
- Based: passes — The paper gives a reason why it holds.
Every source the paper cites for this claim was checked and supports it.
In the paper
“Montecino-Rodriguez et al. point out that these differences conspicuously include reduced initial expression of multiple PU.1-dependent genes in the fetal cells (147).”
§ Mechanisms of Action of Hematopoietic Transcription Factor PU.1 in Initiation of T-Cell Development > PU.1 and the Regulation of Lymphoid Development in Ontogeny
What the sources say
- Supportedcites [147] Montecino-Rodriguez, 2018, Differential expression of PU.1 and Key T lineage transcription factors distinguishes fetal and adult T Cell development source
The Results section on differential regulation of fetal and adult T cell development (page unavailable) reports lower expression of Lmo2, Runx2, Mef2c, Gata2, and Tal1 in fetal early T cell progenitors and identifies many of the differing transcription-factor genes as PU.1-regulated. It also identifies Flt3 as a PU.1 target expressed at lower levels in fetal progenitors. The paper does not say that all PU.1 targets are reduced; some are higher in fetal cells, but the claim is limited to multiple genes. (LLM, conf=0.88)
plaincorrelational- Asserted: passes — The authors put it forward as true.
- Checkable: passes — It can be checked against evidence.
- Load-bearing: passes — The paper’s conclusions depend on it.
- Based: passes — The paper gives a reason why it holds.
- Supported
The paper states this without a source or data behind it here, so there is nothing to check it against. The quote shows it is in the paper.
In the paper
“PU.1 does not strongly upregulate transcription factors annotated as repressors, however, in cells remaining within the T-cell program (see below).”
§ Mechanisms of Action of Hematopoietic Transcription Factor PU.1 in Initiation of T-Cell Development > PU.1 Action via Cofactor Recruitment > The Problem of Pro-T Cell Gene Repression by PU.1
plain- Asserted: passes — The authors put it forward as true.
- Checkable: passes — It can be checked against evidence.
- Load-bearing: passes — The paper’s conclusions depend on it.
- Based: passes — The paper gives a reason why it holds.
A result the paper reports from its own data — it cites no other source for it, so there is none to check. The quote shows it is in the paper.
In the paper
“The genomic sites that were most highly associated with these responses in primary pro-T cells were developmentally dynamic in chromatin accessibility: normally open in early stages of T-cell development (endogenous PU.1-expressing) but closed once the cells went through commitment (endogenous PU.1-low or negative).”
§ Mechanisms of Action of Hematopoietic Transcription Factor PU.1 in Initiation of T-Cell Development > PU.1 Action via Cofactor Recruitment > Direct Gene Regulation by PU.1: Activation by Distal Enhancer Engagement and Opening
plaincorrelational- Asserted: passes — The authors put it forward as true.
- Checkable: passes — It can be checked against evidence.
- Load-bearing: passes — The paper’s conclusions depend on it.
- Based: passes — The paper gives a reason why it holds.
A result the paper reports from its own data — it cites no other source for it, so there is none to check. The quote shows it is in the paper.
In the paper
“The number of high confidence PU.1 target genes within the T-cell pathway that code for transcription factor genes is low (Figure 8A).”
§ Mechanisms of Action of Hematopoietic Transcription Factor PU.1 in Initiation of T-Cell Development > The PU.1 Regulome in Early pro-T cells and Its physiological Roles > PU.1 as a Choreographer of Thymocyte Cell Biology
plain- Asserted: passes — The authors put it forward as true.
- Checkable: passes — It can be checked against evidence.
- Load-bearing: passes — The paper’s conclusions depend on it.
- Based: passes — The paper gives a reason why it holds.
The paper states this without a source or data behind it here, so there is nothing to check it against. The quote shows it is in the paper.
In the paper
“Among the smaller number of genes that appear to be directly repressed by PU.1, most are specific for later stages of T-cell development.”
§ Mechanisms of Action of Hematopoietic Transcription Factor PU.1 in Initiation of T-Cell Development > The PU.1 Regulome in Early pro-T cells and Its physiological Roles > PU.1 Target Genes: Gene Network Roles and Developmental Timing
hedgedcorrelational- Asserted: passes — The authors put it forward as true.
- Checkable: passes — It can be checked against evidence.
- Load-bearing: unclear — It is unclear whether the paper’s conclusions depend on it.
- Based: passes — The paper gives a reason why it holds.
A result the paper reports from its own data — it cites no other source for it, so there is none to check. The quote shows it is in the paper.
In the paper
“Indeed, PU.1-activated target genes are preferentially expressed in the earliest stages of T-cell development (examples shown in Figure 8).”
§ Mechanisms of Action of Hematopoietic Transcription Factor PU.1 in Initiation of T-Cell Development > The PU.1 Regulome in Early pro-T cells and Its physiological Roles > PU.1 Target Genes: Gene Network Roles and Developmental Timing
plaincorrelational- Asserted: passes — The authors put it forward as true.
- Checkable: passes — It can be checked against evidence.
- Load-bearing: passes — The paper’s conclusions depend on it.
- Based: passes — The paper gives a reason why it holds.
A result the paper reports from its own data — it cites no other source for it, so there is none to check. The quote shows it is in the paper.
In the paper
“Many of them are expressed also in at least one of the other contexts where PU.1 is active: in myeloid and dendritic lineage cells, in B lineage cells, and particularly also in multipotent progenitor cells (Figure 8).”
§ Mechanisms of Action of Hematopoietic Transcription Factor PU.1 in Initiation of T-Cell Development > The PU.1 Regulome in Early pro-T cells and Its physiological Roles > PU.1 Target Genes: Gene Network Roles and Developmental Timing
plaincorrelational- Asserted: passes — The authors put it forward as true.
- Checkable: passes — It can be checked against evidence.
- Load-bearing: unclear — It is unclear whether the paper’s conclusions depend on it.
- Based: passes — The paper gives a reason why it holds.
A result the paper reports from its own data — it cites no other source for it, so there is none to check. The quote shows it is in the paper.
In the paper
“The cell cycle-regulatory locus E2f2, which is also upregulated during commitment, is rare among transcription factor coding genes in that it does appear to be under active repression by PU.1 until the transition to commitment.”
§ Mechanisms of Action of Hematopoietic Transcription Factor PU.1 in Initiation of T-Cell Development > The PU.1 Regulome in Early pro-T cells and Its physiological Roles > PU.1 Target Genes: Gene Network Roles and Developmental Timing
hedgedconditional- Asserted: passes — The authors put it forward as true.
- Checkable: passes — It can be checked against evidence.
- Load-bearing: unclear — It is unclear whether the paper’s conclusions depend on it.
- Based: passes — The paper gives a reason why it holds.
A conclusion the paper draws from its own results — it cites no other source for it, so there is none to check. The quote shows it is in the paper.
In the paper
“The genes directly regulated by PU.1 also suggest a far-reaching transformation of cell biology and signaling potential between the early stages of T-cell development when PU.1 is expressed and when it is silenced.”
§ Mechanisms of Action of Hematopoietic Transcription Factor PU.1 in Initiation of T-Cell Development > Abstract
hedgedcorrelational- Asserted: passes — The authors put it forward as true.
- Checkable: passes — It can be checked against evidence.
- Load-bearing: passes — The paper’s conclusions depend on it.
- Based: passes — The paper gives a reason why it holds.
A conclusion the paper draws from its own results — it cites no other source for it, so there is none to check. The quote shows it is in the paper.
In the paper
“as well as gene network interactions that not only affect specific target genes but also have system-wide regulatory consequences, amplifying the impact of PU.1 beyond its own direct binding targets.”
§ Mechanisms of Action of Hematopoietic Transcription Factor PU.1 in Initiation of T-Cell Development > Abstract
plaindirect- Asserted: passes — The authors put it forward as true.
- Checkable: passes — It can be checked against evidence.
- Load-bearing: passes — The paper’s conclusions depend on it.
- Based: passes — The paper gives a reason why it holds.
A result the paper reports from its own data — it cites no other source for it, so there is none to check. The quote shows it is in the paper.
In the paper
“This work indicates modes of chromatin engagement, pioneering, and cofactor recruitment (“coregulator theft”) by PU.1”
§ Mechanisms of Action of Hematopoietic Transcription Factor PU.1 in Initiation of T-Cell Development > Abstract
hedgeddirect- Asserted: passes — The authors put it forward as true.
- Checkable: passes — It can be checked against evidence.
- Load-bearing: passes — The paper’s conclusions depend on it.
- Based: passes — The paper gives a reason why it holds.
The paper states this without a source or data behind it here, so there is nothing to check it against. The quote shows it is in the paper.
In the paper
“it is also expressed in the earliest stages of T-cell development of each cohort of intrathymic pro-T cells.”
§ Mechanisms of Action of Hematopoietic Transcription Factor PU.1 in Initiation of T-Cell Development > Abstract
plaincorrelational- Asserted: passes — The authors put it forward as true.
- Checkable: passes — It can be checked against evidence.
- Load-bearing: passes — The paper’s conclusions depend on it.
- Based: passes — The paper gives a reason why it holds.
A conclusion the paper draws from its own results — it cites no other source for it, so there is none to check. The quote shows it is in the paper.
In the paper
“and therefore to represent a source of antagonism or delay of T-cell lineage commitment.”
§ Mechanisms of Action of Hematopoietic Transcription Factor PU.1 in Initiation of T-Cell Development > Abstract
hedgeddirect- Asserted: passes — The authors put it forward as true.
- Checkable: passes — It can be checked against evidence.
- Load-bearing: passes — The paper’s conclusions depend on it.
- Based: passes — The paper gives a reason why it holds.
A conclusion the paper draws from its own results — it cites no other source for it, so there is none to check. The quote shows it is in the paper.
In the paper
“Its expression in this context appears to give T-cell precursors initial, transient access to myeloid and dendritic cell developmental competence”
§ Mechanisms of Action of Hematopoietic Transcription Factor PU.1 in Initiation of T-Cell Development > Abstract
hedgeddirect- Asserted: passes — The authors put it forward as true.
- Checkable: passes — It can be checked against evidence.
- Load-bearing: passes — The paper’s conclusions depend on it.
- Based: passes — The paper gives a reason why it holds.
The paper states this without a source or data behind it here, so there is nothing to check it against. The quote shows it is in the paper.
In the paper
“The downregulation of PU.1 occurs during the transition to commitment, between the DN2 (DN = double negative for CD4 and CD8, and Kit+ CD44+ CD25+) and DN3 (DN, and Kitlow CD44low CD25+) stages.”
§ Mechanisms of Action of Hematopoietic Transcription Factor PU.1 in Initiation of T-Cell Development > Introduction > PU.1 Expression in Precursors of T Cells
plain- Asserted: passes — The authors put it forward as true.
- Checkable: passes — It can be checked against evidence.
- Load-bearing: passes — The paper’s conclusions depend on it.
- Based: passes — The paper gives a reason why it holds.
The paper states this without a source or data behind it here, so there is nothing to check it against. The quote shows it is in the paper.
In the paper
“the T-cell developmental gene network sharply downregulates Spi1 in precursors of αβ T cells before the expression of rearranged Tcrb genes”
§ Mechanisms of Action of Hematopoietic Transcription Factor PU.1 in Initiation of T-Cell Development > Introduction > PU.1 Expression in Precursors of T Cells
plaindirect- Asserted: passes — The authors put it forward as true.
- Checkable: passes — It can be checked against evidence.
- Load-bearing: passes — The paper’s conclusions depend on it.
- Based: passes — The paper gives a reason why it holds.
The paper states this without a source or data behind it here, so there is nothing to check it against. The quote shows it is in the paper.
In the paper
“Most mature T cells do not express any detectable PU.1 protein or Spi1 transcripts at all”
§ Mechanisms of Action of Hematopoietic Transcription Factor PU.1 in Initiation of T-Cell Development > Introduction > PU.1 Expression in Precursors of T Cells
plain- Asserted: passes — The authors put it forward as true.
- Checkable: passes — It can be checked against evidence.
- Load-bearing: passes — The paper’s conclusions depend on it.
- Based: passes — The paper gives a reason why it holds.
A claim is checked only against the cited paper’s full text, never its abstract, and none is available for its sources.
In the paper
“Disruption of PU.1 has long been known to eliminate or greatly inhibit T-cell development, based on the dramatic phenotypes from the first lines of PU.1-knockout (Spi1 knockout) mice with unconditional, germline mutations (68–71).”
§ Mechanisms of Action of Hematopoietic Transcription Factor PU.1 in Initiation of T-Cell Development > Effects of PU.1 Loss on T-cell Development: the Cellular View > A Vital Role for PU.1 in Prethymic T-Cell Progenitors
What the sources say
- Not checked — no full text of the sourcecites [68] Scott, 1994, Requirement of transcription factor PU.1 in the development of multiple hematopoietic lineages source
- Not checked — no full text of the sourcecites [69] McKercher, 1996, Targeted disruption of the PU.1 gene results in multiple hematopoietic abnormalities source
- Not checked — no full text of the sourcecites [70] Scott, 1997, PU.1 functions in a cell-autonomous manner to control the differentiation of multipotential lymphoid-myeloid progenitors source
- Not checked — no full text of the sourcecites [71] Spain, 1999, T cell development in PU.1-deficient mice source
boosteddirect- Asserted: passes — The authors put it forward as true.
- Checkable: passes — It can be checked against evidence.
- Load-bearing: passes — The paper’s conclusions depend on it.
- Based: passes — The paper gives a reason why it holds.
A conclusion the paper draws from its own results — it cites no other source for it, so there is none to check. The quote shows it is in the paper.
In the paper
“Thus, throughout the stages when PU.1 is expressed, the Notch signaling driven in the normal thymus environment could guarantee that PU.1 expression would confer only a potential for differentiation to alternative fates, which the cells would not actually follow unless the thymic environment were disrupted.”
§ Mechanisms of Action of Hematopoietic Transcription Factor PU.1 in Initiation of T-Cell Development > Introduction > PU.1 as an Obstacle to T-Cell Lineage Commitment
hedgedconditional- Asserted: passes — The authors put it forward as true.
- Checkable: passes — It can be checked against evidence.
- Load-bearing: passes — The paper’s conclusions depend on it.
- Based: passes — The paper gives a reason why it holds.
A conclusion the paper draws from its own results — it cites no other source for it, so there is none to check. The quote shows it is in the paper.
In the paper
“The silencing of Spi1 expression and permanent loss of PU.1 protein from the cells at a later stage of differentiation would then make their loss of myeloid potential unconditional.”
§ Mechanisms of Action of Hematopoietic Transcription Factor PU.1 in Initiation of T-Cell Development > Introduction > PU.1 as an Obstacle to T-Cell Lineage Commitment
hedgeddirect- Asserted: passes — The authors put it forward as true.
- Checkable: passes — It can be checked against evidence.
- Load-bearing: passes — The paper’s conclusions depend on it.
- Based: passes — The paper gives a reason why it holds.
A conclusion the paper draws from its own results — it cites no other source for it, so there is none to check. The quote shows it is in the paper.
In the paper
“Importantly, the combination of PU.1 with Notch signaling desensitization pushes the cells out of the T-cell program completely, rather than simply reversing their progression through the T-cell program.”
§ Mechanisms of Action of Hematopoietic Transcription Factor PU.1 in Initiation of T-Cell Development > Defining the PU.1 Regulome in Early T-cell Precursors > Developmental Challenges: Implications of a Gene Regulatory Network Switch
plaindirect- Asserted: passes — The authors put it forward as true.
- Checkable: passes — It can be checked against evidence.
- Load-bearing: passes — The paper’s conclusions depend on it.
- Based: passes — The paper gives a reason why it holds.
A conclusion the paper draws from its own results — it cites no other source for it, so there is none to check. The quote shows it is in the paper.
In the paper
“Thus, both too much and too little PU.1 can have negative impacts on proliferation of the cells within a similar developmental time window.”
§ Mechanisms of Action of Hematopoietic Transcription Factor PU.1 in Initiation of T-Cell Development > Effects of PU.1 Loss on T-cell Development: the Cellular View > PU.1 Promotes Proliferation While Slowing Differentiation of Pro-T Cells
plaindirect- Asserted: passes — The authors put it forward as true.
- Checkable: passes — It can be checked against evidence.
- Load-bearing: passes — The paper’s conclusions depend on it.
- Based: passes — The paper gives a reason why it holds.
A conclusion the paper draws from its own results — it cites no other source for it, so there is none to check. The quote shows it is in the paper.
In the paper
“The most pronounced effects of PU.1 are thus a nonlinear response to PU.1 dosage mediated through a gene network switch (Figure 3)”
§ Mechanisms of Action of Hematopoietic Transcription Factor PU.1 in Initiation of T-Cell Development > Defining the PU.1 Regulome in Early T-cell Precursors > Developmental Challenges: Implications of a Gene Regulatory Network Switch
plaindirect- Asserted: passes — The authors put it forward as true.
- Checkable: passes — It can be checked against evidence.
- Load-bearing: passes — The paper’s conclusions depend on it.
- Based: passes — The paper gives a reason why it holds.
A conclusion the paper draws from its own results — it cites no other source for it, so there is none to check. The quote shows it is in the paper.
In the paper
“the tradeoff between site accessibility and the affinity of binding needed for occupancy indicates that PU.1 itself is identifying these sites in closed chromatin to establish its occupancy.”
§ Mechanisms of Action of Hematopoietic Transcription Factor PU.1 in Initiation of T-Cell Development > PU.1 Action on the Genome via Direct Binding > PU.1 Binding Site Characteristics
hedgeddirect- Asserted: passes — The authors put it forward as true.
- Checkable: passes — It can be checked against evidence.
- Load-bearing: passes — The paper’s conclusions depend on it.
- Based: passes — The paper gives a reason why it holds.
A conclusion the paper draws from its own results — it cites no other source for it, so there is none to check. The quote shows it is in the paper.
In the paper
“These factors probably contribute independently to the repression of pro-T cell genes.”
§ Mechanisms of Action of Hematopoietic Transcription Factor PU.1 in Initiation of T-Cell Development > PU.1 Action via Cofactor Recruitment > The Problem of Pro-T Cell Gene Repression by PU.1
hedgedconditional- Asserted: passes — The authors put it forward as true.
- Checkable: passes — It can be checked against evidence.
- Load-bearing: unclear — It is unclear whether the paper’s conclusions depend on it.
- Based: passes — The paper gives a reason why it holds.
A conclusion the paper draws from its own results — it cites no other source for it, so there is none to check. The quote shows it is in the paper.
In the paper
“This suggests that closed chromatin may be less permissive to PU.1 binding than open chromatin, so that only high-affinity site recognition allows binding in closed regions.”
§ Mechanisms of Action of Hematopoietic Transcription Factor PU.1 in Initiation of T-Cell Development > PU.1 Action on the Genome via Direct Binding > PU.1 Binding Site Characteristics
hedgedconditional- Asserted: passes — The authors put it forward as true.
- Checkable: passes — It can be checked against evidence.
- Load-bearing: passes — The paper’s conclusions depend on it.
- Based: passes — The paper gives a reason why it holds.
A conclusion the paper draws from its own results — it cites no other source for it, so there is none to check. The quote shows it is in the paper.
In the paper
“However, the local impact of PU.1 binding is strongly biased toward activation of genes linked to the binding sites.”
§ Mechanisms of Action of Hematopoietic Transcription Factor PU.1 in Initiation of T-Cell Development > PU.1 Action via Cofactor Recruitment > The Problem of Pro-T Cell Gene Repression by PU.1
boosteddirect- Asserted: passes — The authors put it forward as true.
- Checkable: passes — It can be checked against evidence.
- Load-bearing: passes — The paper’s conclusions depend on it.
- Based: passes — The paper gives a reason why it holds.
A conclusion the paper draws from its own results — it cites no other source for it, so there is none to check. The quote shows it is in the paper.
In the paper
“This suggests that an additional process beyond simple DNA sequence recognition is required to establish PU.1 occupancy in closed chromatin, even without an overt change in chromatin accessibility as measured by ATAC-seq.”
§ Mechanisms of Action of Hematopoietic Transcription Factor PU.1 in Initiation of T-Cell Development > PU.1 Action on the Genome via Direct Binding > PU.1 Binding Site Characteristics
hedgeddirect- Asserted: passes — The authors put it forward as true.
- Checkable: passes — It can be checked against evidence.
- Load-bearing: passes — The paper’s conclusions depend on it.
- Based: passes — The paper gives a reason why it holds.
A conclusion the paper draws from its own results — it cites no other source for it, so there is none to check. The quote shows it is in the paper.
In the paper
“Thus, PU.1 action to keep sites open in chromatin may be an important way that it promotes transcriptional activation in pro-T cells.”
§ Mechanisms of Action of Hematopoietic Transcription Factor PU.1 in Initiation of T-Cell Development > PU.1 Action on the Genome via Direct Binding > PU.1 Binding Site Characteristics
hedgedconditional- Asserted: passes — The authors put it forward as true.
- Checkable: passes — It can be checked against evidence.
- Load-bearing: passes — The paper’s conclusions depend on it.
- Based: passes — The paper gives a reason why it holds.
A conclusion the paper draws from its own results — it cites no other source for it, so there is none to check. The quote shows it is in the paper.
In the paper
“Thus, the ternary (or higher-order) complexes nucleated by PU.1 are more favored binding sites for Runx1 when PU.1 is present than functionally relevant, high-quality Runx sites elsewhere.”
§ Mechanisms of Action of Hematopoietic Transcription Factor PU.1 in Initiation of T-Cell Development > PU.1 Action via Cofactor Recruitment > System Consequences of Cofactor Recruitment: Repression by Theft
plaindirect- Asserted: passes — The authors put it forward as true.
- Checkable: passes — It can be checked against evidence.
- Load-bearing: passes — The paper’s conclusions depend on it.
- Based: passes — The paper gives a reason why it holds.
A conclusion the paper draws from its own results — it cites no other source for it, so there is none to check. The quote shows it is in the paper.
In the paper
“However, given the high frequency of Runx factor utilization at multiple lymphoid enhancer sites, this kind of mechanism can propagate local PU.1 impacts to a much broader genomic scale.”
§ Mechanisms of Action of Hematopoietic Transcription Factor PU.1 in Initiation of T-Cell Development > PU.1 Action via Cofactor Recruitment > System Consequences of Cofactor Recruitment: Repression by Theft
plainconditional- Asserted: passes — The authors put it forward as true.
- Checkable: passes — It can be checked against evidence.
- Load-bearing: passes — The paper’s conclusions depend on it.
- Based: passes — The paper gives a reason why it holds.
A conclusion the paper draws from its own results — it cites no other source for it, so there is none to check. The quote shows it is in the paper.
In the paper
“PU.1 can indeed have negative regulatory effects on some of the T-cell factors that are upregulated during commitment, but these effects are greatly limited when the analysis is confined to PU.1 activities within the T-cell program.”
§ Mechanisms of Action of Hematopoietic Transcription Factor PU.1 in Initiation of T-Cell Development > The PU.1 Regulome in Early pro-T cells and Its physiological Roles > PU.1 Target Genes: Gene Network Roles and Developmental Timing
plaindirect- Asserted: passes — The authors put it forward as true.
- Checkable: passes — It can be checked against evidence.
- Load-bearing: passes — The paper’s conclusions depend on it.
- Based: passes — The paper gives a reason why it holds.
A conclusion the paper draws from its own results — it cites no other source for it, so there is none to check. The quote shows it is in the paper.
In the paper
“These patterns reinforce the case for PU.1's impact in shaping the developmental timecourse of gene expression in pro-T cells.”
§ Mechanisms of Action of Hematopoietic Transcription Factor PU.1 in Initiation of T-Cell Development > The PU.1 Regulome in Early pro-T cells and Its physiological Roles > PU.1 Target Genes: Gene Network Roles and Developmental Timing
plaincorrelational- Asserted: passes — The authors put it forward as true.
- Checkable: passes — It can be checked against evidence.
- Load-bearing: passes — The paper’s conclusions depend on it.
- Based: passes — The paper gives a reason why it holds.
A conclusion the paper draws from its own results — it cites no other source for it, so there is none to check. The quote shows it is in the paper.
In the paper
“Thus, “partner factor theft” can be an integral part of the machinery for program choice operated by lineage-determining transcription factors.”
§ Mechanisms of Action of Hematopoietic Transcription Factor PU.1 in Initiation of T-Cell Development > PU.1 Action via Cofactor Recruitment > System Consequences of Cofactor Recruitment: Repression by Theft
plaindirect- Asserted: passes — The authors put it forward as true.
- Checkable: passes — It can be checked against evidence.
- Load-bearing: passes — The paper’s conclusions depend on it.
- Based: passes — The paper gives a reason why it holds.
A conclusion the paper draws from its own results — it cites no other source for it, so there is none to check. The quote shows it is in the paper.
In the paper
“Finally, it is clear that this is a system-level mechanism. It is the limited pool of Runx1 operationally available for action across the genome that makes the impact of PU.1 a “zero-sum” outcome.”
§ Mechanisms of Action of Hematopoietic Transcription Factor PU.1 in Initiation of T-Cell Development > PU.1 Action via Cofactor Recruitment > System Consequences of Cofactor Recruitment: Repression by Theft
boosteddirect- Asserted: passes — The authors put it forward as true.
- Checkable: passes — It can be checked against evidence.
- Load-bearing: passes — The paper’s conclusions depend on it.
- Based: passes — The paper gives a reason why it holds.
The paper states this without a source or data behind it here, so there is nothing to check it against. The quote shows it is in the paper.
In the paper
“PU.1 itself is downregulated at stage when multiple other Phase 1 factors are downregulated”
§ Mechanisms of Action of Hematopoietic Transcription Factor PU.1 in Initiation of T-Cell Development > The PU.1 Regulome in Early pro-T cells and Its physiological Roles > PU.1 Target Genes: Gene Network Roles and Developmental Timing
plaincorrelational- Asserted: passes — The authors put it forward as true.
- Checkable: passes — It can be checked against evidence.
- Load-bearing: unclear — It is unclear whether the paper’s conclusions depend on it.
- Based: passes — The paper gives a reason why it holds.
A conclusion the paper draws from its own results — it cites no other source for it, so there is none to check. The quote shows it is in the paper.
In the paper
“Thus, the competition for Runx1 protein by PU.1 directly causes coupled positive and negative regulation, to cause a switch-like alteration in genome-wide cell state (Figure 7).”
§ Mechanisms of Action of Hematopoietic Transcription Factor PU.1 in Initiation of T-Cell Development > PU.1 Action via Cofactor Recruitment > System Consequences of Cofactor Recruitment: Repression by Theft
plaindirect- Asserted: passes — The authors put it forward as true.
- Checkable: passes — It can be checked against evidence.
- Load-bearing: passes — The paper’s conclusions depend on it.
- Based: passes — The paper gives a reason why it holds.
A conclusion the paper draws from its own results — it cites no other source for it, so there is none to check. The quote shows it is in the paper.
In the paper
“PU.1 globally regulates genes involved in multiple signaling and cell biological properties as well as other “phase 1” transcription factors across the stages when PU.1 is expressed.”
§ Mechanisms of Action of Hematopoietic Transcription Factor PU.1 in Initiation of T-Cell Development > The PU.1 Regulome in Early pro-T cells and Its physiological Roles > PU.1 Target Genes: Gene Network Roles and Developmental Timing
plaindirect- Asserted: passes — The authors put it forward as true.
- Checkable: passes — It can be checked against evidence.
- Load-bearing: passes — The paper’s conclusions depend on it.
- Based: passes — The paper gives a reason why it holds.
A conclusion the paper draws from its own results — it cites no other source for it, so there is none to check. The quote shows it is in the paper.
In the paper
“The result is that not only signaling capability but basic properties of adhesion, motility and chemoresponsiveness of the cells can be under PU.1 control in the early stages of T-cell development.”
§ Mechanisms of Action of Hematopoietic Transcription Factor PU.1 in Initiation of T-Cell Development > The PU.1 Regulome in Early pro-T cells and Its physiological Roles > PU.1 as a Choreographer of Thymocyte Cell Biology
hedgedconditional- Asserted: passes — The authors put it forward as true.
- Checkable: passes — It can be checked against evidence.
- Load-bearing: passes — The paper’s conclusions depend on it.
- Based: passes — The paper gives a reason why it holds.
A conclusion the paper draws from its own results — it cites no other source for it, so there is none to check. The quote shows it is in the paper.
In the paper
“Thus, the regulated level of Runx1 protein contributes to the switch-like impact made by the developmental shift from high-level PU.1 to PU.1 shutoff.”
§ Mechanisms of Action of Hematopoietic Transcription Factor PU.1 in Initiation of T-Cell Development > PU.1 Action via Cofactor Recruitment > System Consequences of Cofactor Recruitment: Repression by Theft
plaindirect- Asserted: passes — The authors put it forward as true.
- Checkable: passes — It can be checked against evidence.
- Load-bearing: passes — The paper’s conclusions depend on it.
- Based: passes — The paper gives a reason why it holds.
A conclusion the paper draws from its own results — it cites no other source for it, so there is none to check. The quote shows it is in the paper.
In the paper
“Thus, PU.1 is likely to be one of several important positive regulators for these genes.”
§ Mechanisms of Action of Hematopoietic Transcription Factor PU.1 in Initiation of T-Cell Development > The PU.1 Regulome in Early pro-T cells and Its physiological Roles > PU.1 Target Genes: Gene Network Roles and Developmental Timing
hedgedconditional- Asserted: passes — The authors put it forward as true.
- Checkable: passes — It can be checked against evidence.
- Load-bearing: passes — The paper’s conclusions depend on it.
- Based: passes — The paper gives a reason why it holds.
A conclusion the paper draws from its own results — it cites no other source for it, so there is none to check. The quote shows it is in the paper.
In the paper
“Through chromatin state placeholding and “coregulator theft” as well as through its own direct transcriptional activities, PU.1 pervades the regulatory state of early T cells as long as it is expressed.”
§ Mechanisms of Action of Hematopoietic Transcription Factor PU.1 in Initiation of T-Cell Development > Conclusions and Future Questions
plaindirect- Asserted: passes — The authors put it forward as true.
- Checkable: passes — It can be checked against evidence.
- Load-bearing: passes — The paper’s conclusions depend on it.
- Based: passes — The paper gives a reason why it holds.
The paper states this without a source or data behind it here, so there is nothing to check it against. The quote shows it is in the paper.
In the paper
“The thymus does not yet have a capsule to present a physical barrier, and the first-wave cells enter directly through the future outer cortex.”
§ Mechanisms of Action of Hematopoietic Transcription Factor PU.1 in Initiation of T-Cell Development > PU.1 and the Regulation of Lymphoid Development in Ontogeny
plain- Asserted: passes — The authors put it forward as true.
- Checkable: passes — It can be checked against evidence.
- Load-bearing: unclear — It is unclear whether the paper’s conclusions depend on it.
- Based: passes — The paper gives a reason why it holds.
The paper states this without a source or data behind it here, so there is nothing to check it against. The quote shows it is in the paper.
In the paper
“However, there are earlier hematopoietic progenitors in the embryo that derive from yolk sac, cells with varied developmental potentials but without true stem-cell self-renewal.”
§ Mechanisms of Action of Hematopoietic Transcription Factor PU.1 in Initiation of T-Cell Development > PU.1 and the Regulation of Lymphoid Development in Ontogeny
plain- Asserted: passes — The authors put it forward as true.
- Checkable: passes — It can be checked against evidence.
- Load-bearing: unclear — It is unclear whether the paper’s conclusions depend on it.
- Based: passes — The paper gives a reason why it holds.
A conclusion the paper draws from its own results — it cites no other source for it, so there is none to check. The quote shows it is in the paper.
In the paper
“This phase comes to an end when other transcription factors finally accumulate to the point where they can shut PU.1 off.”
§ Mechanisms of Action of Hematopoietic Transcription Factor PU.1 in Initiation of T-Cell Development > Conclusions and Future Questions
plaindirect- Asserted: passes — The authors put it forward as true.
- Checkable: passes — It can be checked against evidence.
- Load-bearing: passes — The paper’s conclusions depend on it.
- Based: passes — The paper gives a reason why it holds.
In the paper
“A wave of fetal T cell development can also, apparently, be generated without PU.1 (71).”
§ Mechanisms of Action of Hematopoietic Transcription Factor PU.1 in Initiation of T-Cell Development > PU.1 and the Regulation of Lymphoid Development in Ontogeny
What the sources say
- Not checked — no full text of the sourcecites [71] Spain, 1999, T cell development in PU.1-deficient mice source
hedged- Asserted: passes — The authors put it forward as true.
- Checkable: passes — It can be checked against evidence.
- Load-bearing: passes — The paper’s conclusions depend on it.
- Based: passes — The paper gives a reason why it holds.
A conclusion the paper draws from its own results — it cites no other source for it, so there is none to check. The quote shows it is in the paper.
In the paper
“However, the types of genes positively regulated by PU.1 are overwhelmingly in categories likely to be involved in mediating the interaction of the cells with very specific environments.”
§ Mechanisms of Action of Hematopoietic Transcription Factor PU.1 in Initiation of T-Cell Development > The PU.1 Regulome in Early pro-T cells and Its physiological Roles > PU.1 as a Choreographer of Thymocyte Cell Biology
hedgedcorrelational- Asserted: passes — The authors put it forward as true.
- Checkable: passes — It can be checked against evidence.
- Load-bearing: passes — The paper’s conclusions depend on it.
- Based: passes — The paper gives a reason why it holds.
A conclusion the paper draws from its own results — it cites no other source for it, so there is none to check. The quote shows it is in the paper.
In the paper
“However, it is clear that PU.1 also affects the activity of certain genes that it does not bind to directly, via creating preferential interaction sites for other factors that can deplete the regulatory elements of those factors' alternative target genes.”
§ Mechanisms of Action of Hematopoietic Transcription Factor PU.1 in Initiation of T-Cell Development > Conclusions and Future Questions
boosteddirect- Asserted: passes — The authors put it forward as true.
- Checkable: passes — It can be checked against evidence.
- Load-bearing: passes — The paper’s conclusions depend on it.
- Based: unclear — It is unclear why the paper says it holds.
None of the sources cited for this claim have been checked yet.
In the paper
“Remarkable differences have been reported between genetic requirements for T cell development derived from earlier and later waves of prethymic progenitors.”
§ Mechanisms of Action of Hematopoietic Transcription Factor PU.1 in Initiation of T-Cell Development > PU.1 and the Regulation of Lymphoid Development in Ontogeny
plaincorrelational- Asserted: passes — The authors put it forward as true.
- Checkable: passes — It can be checked against evidence.
- Load-bearing: passes — The paper’s conclusions depend on it.
- Based: passes — The paper gives a reason why it holds.
A conclusion the paper draws from its own results — it cites no other source for it, so there is none to check. The quote shows it is in the paper.
In the paper
“Importantly, the duration of the PU.1 activity phase is regulated to vary among different ontogenic waves of T cell development.”
§ Mechanisms of Action of Hematopoietic Transcription Factor PU.1 in Initiation of T-Cell Development > Conclusions and Future Questions
plaindirect- Asserted: passes — The authors put it forward as true.
- Checkable: passes — It can be checked against evidence.
- Load-bearing: passes — The paper’s conclusions depend on it.
- Based: passes — The paper gives a reason why it holds.
A conclusion the paper draws from its own results — it cites no other source for it, so there is none to check. The quote shows it is in the paper.
In the paper
“This difference in PU.1 dependence accompanies a subtly different T-cell developmental program.”
§ Mechanisms of Action of Hematopoietic Transcription Factor PU.1 in Initiation of T-Cell Development > PU.1 and the Regulation of Lymphoid Development in Ontogeny
plaincorrelational- Asserted: passes — The authors put it forward as true.
- Checkable: passes — It can be checked against evidence.
- Load-bearing: passes — The paper’s conclusions depend on it.
- Based: passes — The paper gives a reason why it holds.
A conclusion the paper draws from its own results — it cites no other source for it, so there is none to check. The quote shows it is in the paper.
In the paper
“Thus, they may not use the same interactions with basement membrane, endothelial cells, or chemokine gradients as any future wave of thymic precursors.”
§ Mechanisms of Action of Hematopoietic Transcription Factor PU.1 in Initiation of T-Cell Development > PU.1 and the Regulation of Lymphoid Development in Ontogeny
hedged- Asserted: passes — The authors put it forward as true.
- Checkable: passes — It can be checked against evidence.
- Load-bearing: unclear — It is unclear whether the paper’s conclusions depend on it.
- Based: passes — The paper gives a reason why it holds.
A conclusion the paper draws from its own results — it cites no other source for it, so there is none to check. The quote shows it is in the paper.
In the paper
“Thus, activity of PU.1 may be important, also, to block certain alternative differentiation paths for pro-T cells.”
§ Mechanisms of Action of Hematopoietic Transcription Factor PU.1 in Initiation of T-Cell Development > Conclusions and Future Questions
hedgedconditional- Asserted: passes — The authors put it forward as true.
- Checkable: passes — It can be checked against evidence.
- Load-bearing: passes — The paper’s conclusions depend on it.
- Based: passes — The paper gives a reason why it holds.
A conclusion the paper draws from its own results — it cites no other source for it, so there is none to check. The quote shows it is in the paper.
In the paper
“The mechanisms discussed in this review show that it establishes a pre-pattern that can influence the binding of the other transcription factors expressed in the cell throughout multiple cell cycles in the thymus.”
§ Mechanisms of Action of Hematopoietic Transcription Factor PU.1 in Initiation of T-Cell Development > Conclusions and Future Questions
plainconditional- Asserted: passes — The authors put it forward as true.
- Checkable: passes — It can be checked against evidence.
- Load-bearing: passes — The paper’s conclusions depend on it.
- Based: passes — The paper gives a reason why it holds.
A conclusion the paper draws from its own results — it cites no other source for it, so there is none to check. The quote shows it is in the paper.
In the paper
“This indicates that the specific constellation of functions that PU.1 serves in T-cell development is a module within the larger T-cell developmental program that can be deployed optionally to serve a particular role.”
§ Mechanisms of Action of Hematopoietic Transcription Factor PU.1 in Initiation of T-Cell Development > Conclusions and Future Questions
hedged- Asserted: passes — The authors put it forward as true.
- Checkable: passes — It can be checked against evidence.
- Load-bearing: passes — The paper’s conclusions depend on it.
- Based: passes — The paper gives a reason why it holds.
- It may state two separate claims as one. 80
- Probably not a substantial claim. 19
At least one cited source doesn’t support this claim or points to a different paper, and none confirmed it — see the verdicts below.
In the paper
“A very intriguing new prospect for fast antagonism of PU.1 activity is the discovery of small-molecule inhibitors, some of which are highly potent and specific at blocking PU.1 action in leukemia cells; however, these have not yet been tested for effects on normal T-cell development (89).”
§ Mechanisms of Action of Hematopoietic Transcription Factor PU.1 in Initiation of T-Cell Development > Defining the PU.1 Regulome in Early T-cell Precursors > Kinetic Challenges: Protein Half-Lives vs. Developmental Progression
What the sources say
- Disputedcites [89] Antony-Debré, 2017, Pharmacological inhibition of the transcription factor PU.1 in leukemia sourceExperimental — accuracy not yet measured
The Introduction supports the discovery of small-molecule PU.1 inhibitors that block PU.1 activity in AML cells. But the section “Inhibitors show on-target PU.1-inhibitory activity in AML cells” explicitly reports testing their effects on T-cell differentiation in OP9-Delta1 culture, contrary to the claim that they had not yet been tested for effects on normal T-cell development. (LLM, conf=0.92)
Checked by a reasoning model — may be wrong.
plain- Asserted: passes — The authors put it forward as true.
- Checkable: passes — It can be checked against evidence.
- Load-bearing: unclear — It is unclear whether the paper’s conclusions depend on it.
- Based: passes — The paper gives a reason why it holds.
It may state two separate claims as one.
- Disputed
Some cited sources support this claim and some don’t — read each source’s verdict below.
In the paper
“The best current candidates for this silencing activity include GATA-3 (104, 105), TCF-1 or LEF-1 (37), and especially Runx1 (80, 150–152), probably working in a dose-dependent combination, although the mechanism through which they finally achieve the ability to repress PU.1 has not yet been reported.”
§ Mechanisms of Action of Hematopoietic Transcription Factor PU.1 in Initiation of T-Cell Development > Conclusions and Future Questions
What the sources say
- Supportedcites [104] Scripture-Adams, 2014, GATA-3 dose-dependent checkpoints in early T cell commitment source
Split into 2 atoms — 2 confirmed, 0 partially supported, 0 disputed, 0 misattributed, 0 unverifiable. Expand the claim to see per-atom verdicts.
- Not checked — no full text of the sourcecites [105] Taghon, 2007, Mast cell lineage diversion of T lineage precursors by the essential T cell transcription factor GATA-3 source
- Not checked — no full text of the sourcecites [37] Rosenbauer, 2006, Lymphoid cell growth and transformation are suppressed by a key regulatory element of the gene encoding PU source
- Could not verifycites [80] Hosokawa, 2018, Transcription factor PU.1 represses and activates gene expression in early T cells by redirecting partner transcription factor binding sourceExperimental — accuracy not yet measured
The Results section on PU.1 association in primary DN cells says Runx1 becomes essential around the time PU.1 is downregulated, but does not say Runx1 silences PU.1. The Results and Discussion passages instead examine how PU.1 redirects Runx1 binding. Searches for Runx1-mediated PU.1 silencing and Spi1 downregulation found no passage supporting the proposed dose-dependent combination or the claim about its unknown mechanism. (LLM, conf=0.73)
- Not checked — no full text of the sourcecites [150] Huang, 2008, PU.1 is a major downstream target of AML1 (RUNX1) in adult mouse hematopoiesis source
- Disputedcites [151] Hoogenkamp, 2009, Early chromatin unfolding by RUNX1: a molecular explanation for differential requirements during specification versus maintenance of the hematopoietic gene expression program sourceExperimental — accuracy not yet measured
Split into 2 atoms — 0 confirmed, 0 partially supported, 1 disputed, 0 misattributed, 1 unverifiable. Expand the claim to see per-atom verdicts.
Checked by a reasoning model — may be wrong.
- Disputedcites [152] Zarnegar, 2010, Cell type-specific activation and repression of PU.1 by a complex of discrete, functionally specialized cis-regulatory elements sourceExperimental — accuracy not yet measured
Split into 2 atoms — 0 confirmed, 1 partially supported, 1 disputed, 0 misattributed, 0 unverifiable. Expand the claim to see per-atom verdicts.
Checked by a reasoning model — may be wrong.
hedgedconditional- Asserted: passes — The authors put it forward as true.
- Checkable: passes — It can be checked against evidence.
- Load-bearing: passes — The paper’s conclusions depend on it.
- Based: passes — The paper gives a reason why it holds.
It may state two separate claims as one.
- Supported
The cited sources support only part of this claim — read each source’s verdict below.
In the paper
“or as a collaboration-dependent partner in binding complexes, either with activation-dependent factors like NF-κB or with lineage-defining partners like C/EBPα (or β) or IRF4/8 (13–15)”
§ Mechanisms of Action of Hematopoietic Transcription Factor PU.1 in Initiation of T-Cell Development > Introduction > PU.1 Expression in Precursors of T Cells
What the sources say
- Partly supportedcites [13] Heinz, 2010, Simple combinations of lineage-determining transcription factors prime cis-regulatory elements required for macrophage and B cell identities sourceExperimental — accuracy not yet measured
The section “PU.1 binds in the vicinity of other lineage-determining transcription factors” (page unavailable) reports nearby PU.1 and C/EBPα/β binding sites and describes a PU.1–IRF4/8 ternary complex. “Combinatorial interplay delineates stage-specific cistromes” (page unavailable) further reports reciprocal effects of PU.1 and C/EBPβ on binding. For NF-κB, however, the paper reports nearby motifs and its activation in TLR4 signaling, not a collaboration-dependent PU.1–NF-κB binding complex. (LLM, conf=0.87)
- Partly supportedcites [14] Heinz, 2013, Effect of natural genetic variation on enhancer selection and function sourceExperimental — accuracy not yet measured
In “Variation and collaborative LDTF binding” (page not provided), the paper reports that C/EBPα motif mutations can reduce nearby PU.1 binding, supporting collaboration between those factors. In “LDTF motif mutations affect NF-κB binding” (page not provided), it instead describes NF-κB binding at sites already bound by PU.1 and/or C/EBPα; it does not establish that PU.1 binding depends on NF-κB. The supplied passages and searches do not support the specified C/EBPβ or IRF4/8 partnerships. (LLM, conf=0.86)
- Partly supportedcites [15] Ostuni, 2013, Latent enhancers activated by stimulation in differentiated cells sourceExperimental — accuracy not yet measured
The Mechanistic Aspects section (p. 163) describes PU.1 recruitment as potentially dependent on cooperation with a stimulus-activated partner or constitutively expressed transcription factors. The Introduction also links PU.1-controlled enhancers with recruitment of stimulus-induced NF-κB. Our copy does not identify C/EBPα/β or IRF4/8 as PU.1 binding partners, and the proposed cooperative mechanisms are not established for those named factors. (LLM, conf=0.86)
plaincorrelational- Asserted: passes — The authors put it forward as true.
- Checkable: passes — It can be checked against evidence.
- Load-bearing: unclear — It is unclear whether the paper’s conclusions depend on it.
- Based: passes — The paper gives a reason why it holds.
It may state two separate claims as one.
- Partly supported
The cited sources support only part of this claim — read each source’s verdict below.
In the paper
“PU.1 can work in an all-or-none gene network switch through mutual antagonism with GATA-1 (20–24)”
§ Mechanisms of Action of Hematopoietic Transcription Factor PU.1 in Initiation of T-Cell Development > Introduction > PU.1 Expression in Precursors of T Cells
What the sources say
- Partly supportedcites [20] Rekhtman, 1999, Direct interaction of hematopoietic transcription factors PU.1 and GATA-1: functional antagonism in erythroid cells sourceExperimental — accuracy not yet measured
The section “Mechanism of PU.1-mediated block to differentiation in erythroleukemia” (page unavailable) says PU.1 and GATA-1 can antagonize each other’s actions and suggests their relative levels could regulate lineage commitment. The paper does not establish an all-or-none gene-network switch; its lineage-commitment proposal is conditional. (LLM, conf=0.85)
- Partly supportedcites [21] Zhang, 1999, Negative cross-talk between hematopoietic regulators: GATA proteins repress PU sourceExperimental — accuracy not yet measured
The Results (page unavailable) show reciprocal inhibition: GATA-1 represses PU.1 transactivation, and PU.1 inhibits GATA-1 activation in reporter assays. The Discussion links this negative regulation to hematopoietic differentiation, but the paper does not establish an all-or-none gene-network switch. (LLM, conf=0.84)
- Not matchedcites [22] GATA-1 interacts with the myeloid PU.1 transcription factor and represses PU.1-dependent transcription254351 NerlovC QuerfurthE KulessaH GrafT 10753833Blood952000
Couldn’t be matched to a paper in Crossref, so it can’t be checked.
- Not matchedcites [23] PU.1 inhibits GATA-1 function and erythroid differentiation by blocking GATA-1 DNA binding264148 ZhangP ZhangX IwamaA YuC SmithKA MuellerBU 11023493Blood962000
Couldn’t be matched to a paper in Crossref, so it can’t be checked.
- Not checked — no full text of the sourcecites [24] Stopka, 2005, PU.1 inhibits the erythroid program by binding to GATA-1 on DNA and creating a repressive chromatin structure source
plaindirect- Asserted: passes — The authors put it forward as true.
- Checkable: passes — It can be checked against evidence.
- Load-bearing: fails — The paper’s conclusions may not depend on it.
- Based: passes — The paper gives a reason why it holds.
Probably not a substantial claim. The paper’s conclusions may not depend on it.
- Partly supported
The cited sources support only part of this claim — read each source’s verdict below.
In the paper
“This is part of a general downregulation of stem/progenitor associated regulatory genes (“phase 1 genes”) (34, 43) and a major reorganization of active chromatin and chromatin interactions, genome-wide, that occurs during this transition (44).”
§ Mechanisms of Action of Hematopoietic Transcription Factor PU.1 in Initiation of T-Cell Development > Introduction > PU.1 Expression in Precursors of T Cells
What the sources say
- Supportedcites [34] Rothenberg, 2016, Forging T-Lymphocyte identity: intersecting networks of transcriptional control source
Section III.A (page unavailable) describes silencing of stem-progenitor regulatory genes, including a round that occurs during commitment. In the citing sentence, the chromatin-reorganization claim is attached to citation 44, not to the citations for phase 1 gene downregulation, so it is not assessed here. (LLM, conf=0.90)
- Could not verifycites [43] Rothenberg, 2010, Multilayered specification of the T-cell lineage fate sourceExperimental — accuracy not yet measured
Citation (44) is attached to the claim of genome-wide reorganization of active chromatin and chromatin interactions. Our copy discusses downregulation of stem/progenitor-associated genes in “Unleashing the expression of T-cell identity by negative regulation?” and local chromatin opening at TCR loci in “Emergence of T-cell identity,” but neither establishes the cited genome-wide reorganization. Searches for chromatin reorganization and chromatin interactions found no passage addressing it; page numbers were unavailable. (LLM, conf=0.77)
- Supportedcites [44] Hu, 2018, Transformation of accessible chromatin and 3D nucleome underlies lineage commitment of early T cells source
The Discussion describes genome-wide reorganization of the regulome and 3D nucleome at the DN2-to-DN3 transition. The Results also report abrupt global changes in chromatin accessibility and TAD connectivity. This source is cited for the chromatin-reorganization clause; the phase 1 gene clause has separate citations. (LLM, conf=0.94)
plaincorrelational- Asserted: passes — The authors put it forward as true.
- Checkable: passes — It can be checked against evidence.
- Load-bearing: unclear — It is unclear whether the paper’s conclusions depend on it.
- Based: passes — The paper gives a reason why it holds.
It may state two separate claims as one.
- Supported
The sources with a verdict support this claim; the rest weren’t checked yet, have no full text we could read, or their verdicts aren’t rated yet.
In the paper
“typically (A/G)AGGAAGTG motifs [e.g., (10, 11)]”
§ Mechanisms of Action of Hematopoietic Transcription Factor PU.1 in Initiation of T-Cell Development > Introduction > PU.1 Expression in Precursors of T Cells
What the sources say
- Not checked — no full text of the sourcecites [10] Poon, 2004, A thermodynamic basis of DNA sequence selectivity by the ETS domain of murine PU source
- Supportedcites [11] Pham, 2013, Mechanisms of in vivo binding site selection of the hematopoietic master transcription factor PU.1 source
The Discussion (page unavailable) identifies AAAGAGGAAGTG as a PU.1 consensus sequence and reports that 80% of its genomic occurrences overlap PU.1 ChIP-seq peaks. That sequence contains GAGGAAGTG, one of the stated (A/G)AGGAAGTG motifs. The paper also notes that PU.1 recognizes many other sequences, so the motif is not exclusive. (LLM, conf=0.86)
plaincorrelational- Asserted: passes — The authors put it forward as true.
- Checkable: passes — It can be checked against evidence.
- Load-bearing: fails — The paper’s conclusions may not depend on it.
- Based: passes — The paper gives a reason why it holds.
Probably not a substantial claim. The paper’s conclusions may not depend on it.
The cited sources support only part of this claim — read each source’s verdict below.
In the paper
“re-expression of PU.1 after T-cell commitment turns on myeloid genes and readily transforms later pro-T cells into dendritic cells, macrophages, or promyelocytic-like cells (46–50).”
§ Mechanisms of Action of Hematopoietic Transcription Factor PU.1 in Initiation of T-Cell Development > Introduction > PU.1 as an Obstacle to T-Cell Lineage Commitment
What the sources say
- Not checked — no full text of the sourcecites [46] Anderson, 2002, Constitutive expression of PU.1 in fetal hematopoietic progenitors blocks T cell development at the pro-T cell stage source
- Partly supportedcites [47] Dionne, 2005, Subversion of T lineage commitment by PU.1 in a clonal cell line system sourceExperimental — accuracy not yet measured
The Results report that PU.1 induced myeloid-associated genes in a pro-T cell line, and the section on diverted gene expression reports that committed DN3 thymocytes acquired Mac1 expression and non-lymphoid morphology after PU.1 was restored. The paper describes this as diversion to a myeloid-like phenotype, not demonstrated transformation of later pro-T cells into dendritic cells, macrophages, or promyelocytic-like cells. Page numbers are unavailable in our copy. (LLM, conf=0.86)
- Partly supportedcites [48] Lefebvre, 2005, Enforced expression of Spi-B reverses T lineage commitment and blocks β-selection sourceExperimental — accuracy not yet measured
The organ-culture results (page not available) report that PU.1 expression induced a dendritic-cell marker and diverted thymocytes toward that lineage, but identify the affected DN1–DN2 cells as not yet committed to the T-cell lineage. The Discussion attributes diversion of committed DN3 cells to Spi-B, not PU.1. The paper does not establish that PU.1 re-expression in later committed pro-T cells activates myeloid genes or produces macrophages or promyelocytic-like cells. (LLM, conf=0.87)
- Partly supportedcites [49] Franco, 2006, Notch/Delta signaling constrains reengineering of pro-T cells by PU.1 sourceExperimental — accuracy not yet measured
In the Results (p. 4), PU.1-transduced pro-T and pre-T cells activate a broad spectrum of myeloid genes and can acquire myeloid markers. The paper does not establish that later committed cells readily become each of the three named cell types: it describes myeloid-like cells, cites earlier work for a dendritic-cell fate (p. 1), and reports that Notch/Delta signaling blocks diversion in the specified cells (p. 4). (LLM, conf=0.88)
- Partly supportedcites [50] Laiosa, 2006, Reprogramming of committed T cell progenitors to macrophages and dendritic cells by C/EBPα and PU.1 transcription factors sourceExperimental — accuracy not yet measured
The Discussion (page not available) says enforced PU.1 expression in committed pre-T cells induced cells resembling myeloid dendritic cells, and that PU.1 induces dendritic genes and a subset of myeloid genes. It distinguishes this from macrophage formation, which it attributes to C/EBPα and C/EBPβ; the cited passages do not report PU.1 producing promyelocytic-like cells. (LLM, conf=0.90)
plaindirect- Asserted: passes — The authors put it forward as true.
- Checkable: passes — It can be checked against evidence.
- Load-bearing: passes — The paper’s conclusions depend on it.
- Based: passes — The paper gives a reason why it holds.
It may state two separate claims as one.
The cited sources support only part of this claim — read each source’s verdict below.
In the paper
“if Spi1 is conditionally deleted in T-lineage cells only after the cells have passed the DN2 stage, there are very modest effects on T cells as a whole, apparently limited to selective reduction of IL-9-producing T-cells (74), and some loss of restraint on γδ T cells and T follicular helper cell activity (75, 76).”
§ Mechanisms of Action of Hematopoietic Transcription Factor PU.1 in Initiation of T-Cell Development > Effects of PU.1 Loss on T-cell Development: the Cellular View > A Vital Role for PU.1 in Prethymic T-Cell Progenitors
What the sources say
- Partly supportedcites [74] Chang, 2010, The transcription factor PU.1 is required for the development of IL-9-producing T cells and allergic inflammation sourceExperimental — accuracy not yet measured
The Results (‘PU.1 promotes the development of IL-9–secreting T cells’; page unavailable) report reduced IL-9 in PU.1-deficient T-cell cultures, supporting the finding attached to citation 74. But the Results (‘TH9 cells and allergic inflammation’) also report reduced production of the chemokines Ccl17 and Ccl22 from those T cells, so the effects are not shown to be limited to IL-9-producing cells. The γδ T-cell and Tfh findings are attached to other citations, not this one. (LLM, conf=0.84)
- Partly supportedcites [75] Jabeen, 2011, The transcription factor PU.1 regulates γδ T cell homeostasis sourceExperimental — accuracy not yet measured
The Results report that Lck-Cre deletion of Sfpi1 leaves αβ T-cell profiles largely unchanged but increases γδ T-cell numbers, supporting the portion attributed to this paper (Results, ‘γδ T cell numbers are expanded in the absence of PU.1’; page unavailable). The Discussion places deletion after Sfpi1 expression declines between DN1 and DN2, but does not establish that deletion occurs only after cells have passed DN2. The IL-9 and Tfh portions carry other citations in the citing sentence. (LLM, conf=0.82)
- Supportedcites [76] Awe, 2015, PU.1 Expression in T follicular helper cells limits CD40L-dependent germinal center B Cell development source
The Introduction states that Sfpi1 deletion with Lck-Cre occurs at DN3–DN4, after DN2, and that thymic and peripheral T-cell populations are normal. The Results report increased Tfh-cell numbers and activity after deletion, supporting the loss of restraint on Tfh activity attributed to this paper. The IL-9 and γδ T-cell points have separate citations in the citing sentence. (LLM, conf=0.91)
hedgeddirect- Asserted: passes — The authors put it forward as true.
- Checkable: passes — It can be checked against evidence.
- Load-bearing: passes — The paper’s conclusions depend on it.
- Based: passes — The paper gives a reason why it holds.
It may state two separate claims as one.
- Partly supported
The cited sources support only part of this claim — read each source’s verdict below.
In the paper
“PU.1 is indeed important within the T-cell program as well as before thymic entry, as shown by using in vitro differentiation to provide conditions where PU.1 could be removed acutely in a synchronized cohort of precursors and the fates of the cells could be monitored immediately afterwards.”
§ Mechanisms of Action of Hematopoietic Transcription Factor PU.1 in Initiation of T-Cell Development > Effects of PU.1 Loss on T-cell Development: the Cellular View > PU.1 Promotes Proliferation While Slowing Differentiation of Pro-T Cells
What the sources say
- Supportedcites [79] Champhekar, 2015, Regulation of early T-lineage gene expression and developmental progression by the progenitor cell transcription factor PU source
The Discussion states that endogenous PU.1 supports proliferation and regulates developmental timing within the early T-cell pathway, while the Abstract notes its importance in prethymic precursors. The Results describe deleting PU.1 at specific precursor stages in an in vitro T-cell differentiation culture and tracking subsequent development. (LLM, conf=0.93)
- Partly supportedcites [80] Hosokawa, 2018, Transcription factor PU.1 represses and activates gene expression in early T cells by redirecting partner transcription factor binding sourceExperimental — accuracy not yet measured
The Results section on endogenous PU.1 in pro-T cells reports that acute disruption during in vitro differentiation altered proliferation, developmental progression, and gene expression, supporting its importance within the T-cell program. The paper does not establish PU.1’s importance before thymic entry; its fetal-liver precursors were used to initiate cultures, but the reported disruption occurred when cells were at the DN1 stage. The cited Results passage also assesses cells four days after disruption, rather than immediately afterward. (LLM, conf=0.84)
boosteddirect- Asserted: passes — The authors put it forward as true.
- Checkable: passes — It can be checked against evidence.
- Load-bearing: passes — The paper’s conclusions depend on it.
- Based: passes — The paper gives a reason why it holds.
It may state two separate claims as one.
- Supported
The cited sources support only part of this claim — read each source’s verdict below.
In the paper
“Whereas ETP and DN2 cells can generate myeloid cells if removed from the thymus, pro-T cells that have differentiated past the stage of PU.1 expression in the thymus (i.e., from the DN2 stage to the DN3 stage or later) do not make myeloid cells under these conditions”
§ Mechanisms of Action of Hematopoietic Transcription Factor PU.1 in Initiation of T-Cell Development > Introduction > PU.1 as an Obstacle to T-Cell Lineage Commitment
What the sources say
- Partly supportedcites [33] Yui, 2010, Fine-scale staging of T cell lineage commitment in adult mouse thymus sourceExperimental — accuracy not yet measured
The Introduction says DN2 cells retain possible myeloid potential while DN3 cells are committed to the T lineage. The Results section on DC and NK potential reports that ETP and DN2a cells produce alternative lineages without Notch signaling, whereas DN2b and DN3a cells produce few, if any, DCs or NK cells. It does not directly test myeloid production at those stages, and the gene-expression Results place the first decline in PU.1 at DN2b, before DN3. (LLM, conf=0.84)
- Not checked — no full text of the sourcecites [40] Bell, 2008, The earliest thymic progenitors for T cells possess myeloid lineage potential source
- Not checked — no full text of the sourcecites [41] Wada, 2008, Adult T-cell progenitors retain myeloid potential source
- Partly supportedcites [51] Wu, 1996, Thymic dendritic cell precursors: relationship to the T lymphocyte lineage and phenotype of the dendritic cell progeny sourceExperimental — accuracy not yet measured
In ‘Development of Lymphoid and Myeloid Cells from Intrathymic Precursors’ (pp. 905–906), the authors report that after intravenous transfer, the early low-CD4 precursors produced no discrete myeloid population and the CD44+CD25+ pro-T precursors produced myeloid cells only at background levels. They also report that the later CD44−CD25+ pre-T population could not form myeloid cells. Thus the later-stage finding is supported, but the claimed myeloid capacity of the earlier cells under these conditions is contrary to the reported results; the copy does not establish a PU.1-defined boundary. (LLM, conf=0.88)
- Partly supportedcites [52] Lee, 2001, Generation of macrophages from early T progenitors in vitro sourceExperimental — accuracy not yet measured
The Results section ('Both Pro-T1 and T2 cells can generate macrophages'; page not supplied) reports that pro-T1 and pro-T2 cells generated macrophages in culture, whereas pro-T3 and pro-T4 cells did not under those conditions. The paper does not establish the claim's PU.1-expression boundary or test stages later than pro-T4. (LLM, conf=0.86)
- Partly supportedcites [53] King, 2002, Lineage infidelity in myeloid cells with TCR gene rearrangement: a latent developmental potential of proT cells revealed by ectopic cytokine receptor signaling sourceExperimental — accuracy not yet measured
The Results (page not specified) show that isolated proT1 and proT2 cells generated granulocyte/macrophage cells, whereas TN3 and TN4 cells did not, in the tested cultures. But proT2 myeloid development required ectopic IL-2 receptor expression and added human IL-2; removal from the thymus alone was not sufficient. The cited passages also do not establish PU.1 expression as the reason for the DN2-to-DN3 boundary. (LLM, conf=0.88)
- Not checked — no full text of the sourcecites [54] Balciunaite, 2005, The earliest subpopulation of mouse thymocytes contains potent T, significant macrophage, and natural killer cell but no B-lymphocyte potential source
- Not checked — no full text of the sourcecites [55] Ikawa, 2010, An essential developmental checkpoint for production of the T cell lineage source
- Partly supportedcites [56] Luc, 2012, The earliest thymic T cell progenitors sustain B cell and myeloid lineage potential sourceExperimental — accuracy not yet measured
The Results section on ETPs and bone-marrow progenitors reports that DN2 cells retain T-cell and granulocyte–monocyte potential, while DN3 cells are the first T-cell-restricted progenitors (page unavailable). The Results on neonatal ETPs demonstrate myeloid potential in cultures outside the thymus. Our copy does not establish that the DN2-to-DN3 change coincides with the end of PU.1 expression or directly test DN2 and DN3 cells under the same removal conditions. (LLM, conf=0.87)
plain- Asserted: passes — The authors put it forward as true.
- Checkable: passes — It can be checked against evidence.
- Load-bearing: passes — The paper’s conclusions depend on it.
- Based: passes — The paper gives a reason why it holds.
It may state two separate claims as one.
- Partly supported
Every source the paper cites for this claim was checked and supports it.
In the paper
“the effects on target gene regulation appear very weak at timepoints up to 2 days after PU.1 deletion, despite the fact that the reduced cell yields from the knockout cells show that PU.1 is biologically important (79).”
§ Mechanisms of Action of Hematopoietic Transcription Factor PU.1 in Initiation of T-Cell Development > Defining the PU.1 Regulome in Early T-cell Precursors > Kinetic Challenges: Protein Half-Lives vs. Developmental Progression
What the sources say
- Supportedcites [79] Champhekar, 2015, Regulation of early T-lineage gene expression and developmental progression by the progenitor cell transcription factor PU source
In Results (‘PU.1 temporally restricts activation of the T-lineage developmental program’), cells were analyzed two days after Cre transduction, and the paper describes the gene-expression effects of acute deletion as weak. Results (‘PU.1 is required for DN progression and survival of lymphoid precursors in T-cell differentiation culture’) reports that PU.1-deleted cells subsequently generated considerably fewer progeny; it does not say cell yield fell immediately after deletion. (LLM, conf=0.90)
hedged- Asserted: passes — The authors put it forward as true.
- Checkable: passes — It can be checked against evidence.
- Load-bearing: passes — The paper’s conclusions depend on it.
- Based: passes — The paper gives a reason why it holds.
It may state two separate claims as one.
- Supported
The cited sources support only part of this claim — read each source’s verdict below.
In the paper
“whereas PU.1 itself can upregulate progenitor-associated genes Bcl11a, Lmo2, Mef2c, and Hhex above their normal levels in DN2a and DN2b primary cells, PU.1-ENG can downregulate them (79).”
§ Mechanisms of Action of Hematopoietic Transcription Factor PU.1 in Initiation of T-Cell Development > Defining the PU.1 Regulome in Early T-cell Precursors > Kinetic Challenges: Protein Half-Lives vs. Developmental Progression
What the sources say
- Partly supportedcites [79] Champhekar, 2015, Regulation of early T-lineage gene expression and developmental progression by the progenitor cell transcription factor PU sourceExperimental — accuracy not yet measured
In Results, under “Selective roles for PU.1 in the progenitor-associated regulatory gene network” (page unavailable), the paper reports that added wild-type PU.1 up-regulated Bcl11a, Lmo2, and Mef2c, consistent with effects of PU.1-Eng. It does not name Hhex among those genes, so the claim about all four is not fully supported by our copy. (LLM, conf=0.86)
plaindirect- Asserted: passes — The authors put it forward as true.
- Checkable: passes — It can be checked against evidence.
- Load-bearing: passes — The paper’s conclusions depend on it.
- Based: passes — The paper gives a reason why it holds.
It may state two separate claims as one.
- Partly supported
The cited sources support only part of this claim — read each source’s verdict below.
In the paper
“However, deletion and clearance of PU.1 protein in this system still require analysis >2 days after introduction of the guide RNAs (80, 85), and the continuing developmental progression of both knockout samples and controls needs to be taken into account in interpreting the results.”
§ Mechanisms of Action of Hematopoietic Transcription Factor PU.1 in Initiation of T-Cell Development > Defining the PU.1 Regulome in Early T-cell Precursors > Kinetic Challenges: Protein Half-Lives vs. Developmental Progression
What the sources say
- Partly supportedcites [80] Hosokawa, 2018, Transcription factor PU.1 represses and activates gene expression in early T cells by redirecting partner transcription factor binding sourceExperimental — accuracy not yet measured
Split into 2 atoms — 1 confirmed, 1 partially supported, 0 disputed, 0 misattributed, 0 unverifiable. Expand the claim to see per-atom verdicts.
- Partly supportedcites [85] Ungerbäck, 2018, Pioneering, chromatin remodeling, and epigenetic constraint in early T-cell gene regulation by SPI1 (PU.1) sourceExperimental — accuracy not yet measured
Split into 2 atoms — 1 confirmed, 1 partially supported, 0 disputed, 0 misattributed, 0 unverifiable. Expand the claim to see per-atom verdicts.
plaindirect- Asserted: passes — The authors put it forward as true.
- Checkable: passes — It can be checked against evidence.
- Load-bearing: passes — The paper’s conclusions depend on it.
- Based: passes — The paper gives a reason why it holds.
It may state two separate claims as one.
- Partly supported
The cited sources support only part of this claim — read each source’s verdict below.
In the paper
“The gene expression profiles of cells losing CD25 and upregulating CD11b are radically transformed from the state of newly-committed pro-T cells within 2 days after transduction, with widespread repression of T-lineage-affiliated transcription factor genes and Notch target genes as well as upregulation of multiple Cebp and Irf family transcription factor genes (Figure 4) (85).”
§ Mechanisms of Action of Hematopoietic Transcription Factor PU.1 in Initiation of T-Cell Development > Defining the PU.1 Regulome in Early T-cell Precursors > Developmental Challenges: Implications of a Gene Regulatory Network Switch
What the sources say
- Partly supportedcites [85] Ungerbäck, 2018, Pioneering, chromatin remodeling, and epigenetic constraint in early T-cell gene regulation by SPI1 (PU.1) sourceExperimental — accuracy not yet measured
Split into 2 atoms — 0 confirmed, 2 partially supported, 0 disputed, 0 misattributed, 0 unverifiable. Expand the claim to see per-atom verdicts.
plaindirect- Asserted: passes — The authors put it forward as true.
- Checkable: passes — It can be checked against evidence.
- Load-bearing: passes — The paper’s conclusions depend on it.
- Based: passes — The paper gives a reason why it holds.
It may state two separate claims as one.
- Partly supported
The cited sources support only part of this claim — read each source’s verdict below.
In the paper
“This construct has been useful to reveal quick impacts on expression of positively regulated PU.1 target genes, many of which have been confirmed later by other approaches (85).”
§ Mechanisms of Action of Hematopoietic Transcription Factor PU.1 in Initiation of T-Cell Development > Defining the PU.1 Regulome in Early T-cell Precursors > Kinetic Challenges: Protein Half-Lives vs. Developmental Progression
What the sources say
- Partly supportedcites [85] Ungerbäck, 2018, Pioneering, chromatin remodeling, and epigenetic constraint in early T-cell gene regulation by SPI1 (PU.1) sourceExperimental — accuracy not yet measured
The Results section on PU.1’s non-DNA-binding domains (page unavailable) reports that PU1ENGHA represses several genes positively regulated by full-length PU.1. The Discussion (page unavailable) says that gain- and loss-of-function approaches defined a core group of positive PU.1 targets. Our copy does not establish that the PU.1-ENG construct revealed quick expression impacts or that many targets identified specifically through it were later confirmed by other approaches. (LLM, conf=0.78)
plaindirect- Asserted: passes — The authors put it forward as true.
- Checkable: passes — It can be checked against evidence.
- Load-bearing: unclear — It is unclear whether the paper’s conclusions depend on it.
- Based: passes — The paper gives a reason why it holds.
It may state two separate claims as one.
- Partly supported
Every source the paper cites for this claim was checked and supports it.
In the paper
“The sites occupied by exogenous PU.1 in Scid.adh.2C2 cells overlap highly with the sites occupied by endogenous PU.1 in normal pro-T cells, but the match is by no means complete (85).”
§ Mechanisms of Action of Hematopoietic Transcription Factor PU.1 in Initiation of T-Cell Development > Defining the PU.1 Regulome in Early T-cell Precursors > Cell Line and Primary-Cell Assay Systems for PU.1 Manipulation
What the sources say
- Supportedcites [85] Ungerbäck, 2018, Pioneering, chromatin remodeling, and epigenetic constraint in early T-cell gene regulation by SPI1 (PU.1) source
In Results, under “PU.1 requires its non-DNA-binding domains to occupy sites in closed chromatin” (page unavailable), the paper says full-length exogenous PU.1 in Scid.adh.2C2 cells bound normal pro-T-cell PU.1 sites and additional sites. This supports substantial, but incomplete, overlap with endogenous binding. (LLM, conf=0.89)
plaincorrelational- Asserted: passes — The authors put it forward as true.
- Checkable: passes — It can be checked against evidence.
- Load-bearing: passes — The paper’s conclusions depend on it.
- Based: passes — The paper gives a reason why it holds.
It may state two separate claims as one.
- Supported
The cited sources support only part of this claim — read each source’s verdict below.
In the paper
“The target genes stimulated by PU.1 include both pro-proliferative and G1-prolonging cell cycle effectors, whereas some important proliferative genes are repressed when PU.1 levels are high (82, 83).”
§ Mechanisms of Action of Hematopoietic Transcription Factor PU.1 in Initiation of T-Cell Development > Effects of PU.1 Loss on T-cell Development: the Cellular View > PU.1 Promotes Proliferation While Slowing Differentiation of Pro-T Cells
What the sources say
- Partly supportedcites [82] Kueh, 2013, Positive feedback between PU.1 and the cell cycle controls myeloid differentiation sourceExperimental — accuracy not yet measured
In the passage on regulatory gene expression (indexed as Abstract; page unavailable), PU.1 transduction reduced Cyclin D2, Cdc25a, Myb, and Myc, supporting the repression of proliferative genes. The paper says PU.1 promotes growth in some progenitors and notes that p21 and Gfi1 are up-regulated by PU.1 in stem cells, but it does not establish here that PU.1 stimulates both pro-proliferative and G1-prolonging target genes. (LLM, conf=0.87)
- Partly supportedcites [83] Staber, 2013, Sustained PU.1 levels balance cell-cycle regulators to prevent exhaustion of adult hematopoietic stem cells sourceExperimental — accuracy not yet measured
The Results section, “PU.1 Transcriptionally Induces Cell-Cycle Inhibitors and Represses Cell-Cycle Activators” (page unavailable), supports PU.1 stimulation of cell-cycle inhibitors and repression of proliferative genes. It does not support the additional claim that PU.1 stimulates pro-proliferative cell-cycle effectors; the activators examined here were repressed. (LLM, conf=0.88)
plaindirect- Asserted: passes — The authors put it forward as true.
- Checkable: passes — It can be checked against evidence.
- Load-bearing: passes — The paper’s conclusions depend on it.
- Based: passes — The paper gives a reason why it holds.
It may state two separate claims as one.
- Partly supported
The cited sources support only part of this claim — read each source’s verdict below.
In the paper
“Even with PU.1 transduction, Scid.adh.2C2 cells do not restore the full chromatin accessibility landscape of ETP and DN2a stage pro-T cells, and despite detectable upregulation of a few other early pro-T cell genes (e.g., Bcl11a and Lyl1), the transduced cells as a whole reactivate little of the program that forms the normal context for endogenous PU.1 activity in pro-T cells (58, 79, 85).”
§ Mechanisms of Action of Hematopoietic Transcription Factor PU.1 in Initiation of T-Cell Development > Defining the PU.1 Regulome in Early T-cell Precursors > Cell Line and Primary-Cell Assay Systems for PU.1 Manipulation
What the sources say
- Partly supportedcites [58] Del Real, 2013, Architecture of a lymphomyeloid developmental switch controlled by PU.1, Notch and Gata3 sourceExperimental — accuracy not yet measured
The section on the Scid.adh.2C2 cell line describes it as DN3-like and reports that PU.1 transduction upregulated Mac1 in only a fraction of cells. The paper also reports PU.1-dependent repression of T-cell genes, which is consistent with an incomplete early pro-T-cell response. But our copy does not compare these cells’ chromatin accessibility with ETP or DN2a cells, or establish how much of the normal early pro-T-cell program they reactivate. (LLM, conf=0.74)
- Could not verifycites [79] Champhekar, 2015, Regulation of early T-lineage gene expression and developmental progression by the progenitor cell transcription factor PU sourceExperimental — accuracy not yet measured
The Results section on PU.1-Eng specificity reports that wild-type PU.1 transduction of Adh.2C2 cells causes myeloid diversion and represses many T-cell genes. It does not assess whether those cells restore ETP/DN2a chromatin accessibility or how much of the early pro-T-cell program they reactivate. Searches for chromatin accessibility and early-program reactivation in Adh.2C2 cells did not find a passage establishing either point. (LLM, conf=0.73)
- Partly supportedcites [85] Ungerbäck, 2018, Pioneering, chromatin remodeling, and epigenetic constraint in early T-cell gene regulation by SPI1 (PU.1) sourceExperimental — accuracy not yet measured
The Results section on pioneering in DN3-like cells (page unavailable) shows that PU.1 transduction opens previously closed sites and activates some linked genes. The paper identifies Scid.adh.2C2 cells as DN3-like, but the passages do not establish that transduction fails to restore the full ETP/DN2a accessibility landscape or that the cells reactivate little of the normal early pro-T-cell program. (LLM, conf=0.76)
plain- Asserted: passes — The authors put it forward as true.
- Checkable: passes — It can be checked against evidence.
- Load-bearing: passes — The paper’s conclusions depend on it.
- Based: passes — The paper gives a reason why it holds.
It may state two separate claims as one.
- Partly supported
The cited sources support only part of this claim — read each source’s verdict below.
In the paper
“although the RNA transcript levels are modest in absolute terms, the impact of PU.1 on the cells can be magnified by the high stability of PU.1 protein (82).”
§ Mechanisms of Action of Hematopoietic Transcription Factor PU.1 in Initiation of T-Cell Development > PU.1 Action on the Genome via Direct Binding > PU.1 Protein Is Stable and Active Across the Genome in Early T Cells
What the sources say
- Partly supportedcites [82] Kueh, 2013, Positive feedback between PU.1 and the cell cycle controls myeloid differentiation sourceExperimental — accuracy not yet measured
The passage discussing PU.1 removal (Fig. 1E; page unavailable) says its protein half-life is substantially longer than the progenitor cell cycle. The passages discussing cell-cycle lengthening (Figs. 1F–H and 3C–D; page unavailable) show that PU.1 can accumulate to higher levels without increased synthesis, supporting the proposed magnifying effect. Our copy does not establish that PU.1 RNA transcript levels are modest in absolute terms. (LLM, conf=0.84)
plaindirect- Asserted: passes — The authors put it forward as true.
- Checkable: passes — It can be checked against evidence.
- Load-bearing: unclear — It is unclear whether the paper’s conclusions depend on it.
- Based: passes — The paper gives a reason why it holds.
It may state two separate claims as one.
- Partly supported
The cited sources support only part of this claim — read each source’s verdict below.
In the paper
“They respond in an all-or-none way to forced expression of PU.1, coordinately upregulating myeloid- or dendritic-cell associated genes and downregulating T-cell genes in a discrete fraction of the cells that increases with increasing levels of PU.1 (47, 58)”
§ Mechanisms of Action of Hematopoietic Transcription Factor PU.1 in Initiation of T-Cell Development > Defining the PU.1 Regulome in Early T-cell Precursors > Cell Line and Primary-Cell Assay Systems for PU.1 Manipulation
What the sources say
- Supportedcites [47] Dionne, 2005, Subversion of T lineage commitment by PU.1 in a clonal cell line system source
The Discussion (page unavailable) describes the response of cloned pre-T cells to PU.1 as an all-or-none choice. The Results and Fig. 3 report dose-dependent Mac1 upregulation and CD25 downregulation in a subset of adh.2C2 cells; the gene-expression analysis shows that diverted cells repress pro-T-cell genes while inducing Mac1 and other genes associated with diversion. The paper also notes that PU.1 level is not the only determinant of which cells divert. (LLM, conf=0.92)
- Partly supportedcites [58] Del Real, 2013, Architecture of a lymphomyeloid developmental switch controlled by PU.1, Notch and Gata3 sourceExperimental — accuracy not yet measured
The section on Scid.adh.2C2 cells reports an all-or-none response to forced PU.1, with Mac1 upregulated in a fraction of cells; the gene-expression sections link diversion to repression of T-cell genes and induction of myeloid markers (page unavailable in our copy). However, the passage relating PU.1 protein levels to the fraction of Mac1-positive cells concerns fetal thymocytes, not Scid.adh.2C2 cells. This source therefore does not establish that the responding fraction of Scid.adh.2C2 cells increases with PU.1 level. (LLM, conf=0.85)
plaindirect- Asserted: passes — The authors put it forward as true.
- Checkable: passes — It can be checked against evidence.
- Load-bearing: passes — The paper’s conclusions depend on it.
- Based: passes — The paper gives a reason why it holds.
It may state two separate claims as one.
- Supported
The cited sources support only part of this claim — read each source’s verdict below.
In the paper
“The obligate repressor should affect PU.1 positive regulation targets in the opposite direction from wildtype PU.1, and in theory should affect PU.1 negative regulation targets in the same direction, an “algebraic sign” distinction that could be used in principle to dissect indirect effects as well (79).”
§ Mechanisms of Action of Hematopoietic Transcription Factor PU.1 in Initiation of T-Cell Development > Defining the PU.1 Regulome in Early T-cell Precursors > Kinetic Challenges: Protein Half-Lives vs. Developmental Progression
What the sources say
- Partly supportedcites [79] Champhekar, 2015, Regulation of early T-lineage gene expression and developmental progression by the progenitor cell transcription factor PU sourceExperimental — accuracy not yet measured
The Results section describes PU.1-Eng as an obligate repressor that antagonizes PU.1-dependent activation, supporting the predicted opposite effect on positively regulated targets. In “Negative regulation of T-cell development by PU.1 is indirect” (page unavailable), it predicts the same effect as wild-type PU.1 only for directly repressed genes; genes repressed indirectly through an intermediate repressor would instead be up-regulated by PU.1-Eng. (LLM, conf=0.86)
hedgeddirect- Asserted: passes — The authors put it forward as true.
- Checkable: passes — It can be checked against evidence.
- Load-bearing: passes — The paper’s conclusions depend on it.
- Based: passes — The paper gives a reason why it holds.
Probably not a substantial claim. It may state two separate claims as one.
- Partly supported
The cited sources support only part of this claim — read each source’s verdict below.
In the paper
“However, PU.1-ENG also has some spurious effects and cannot access closed chromatin sites as well as full-length PU.1 (79, 85).”
§ Mechanisms of Action of Hematopoietic Transcription Factor PU.1 in Initiation of T-Cell Development > Defining the PU.1 Regulome in Early T-cell Precursors > Kinetic Challenges: Protein Half-Lives vs. Developmental Progression
What the sources say
- Partly supportedcites [79] Champhekar, 2015, Regulation of early T-lineage gene expression and developmental progression by the progenitor cell transcription factor PU sourceExperimental — accuracy not yet measured
The Discussion (page unavailable) acknowledges caveats of forced PU.1-Eng expression and reports that some genes bound by endogenous PU.1 were unaffected by PU.1-Eng. The Results section on specificity (page unavailable) tests for side effects but finds the construct selective. Neither passage establishes that PU.1-Eng has spurious effects or that its weaker response at some sites is due to an inability to access closed chromatin relative to full-length PU.1. (LLM, conf=0.82)
- Partly supportedcites [85] Ungerbäck, 2018, Pioneering, chromatin remodeling, and epigenetic constraint in early T-cell gene regulation by SPI1 (PU.1) sourceExperimental — accuracy not yet measured
The Results section on PU.1’s non-DNA-binding domains (page unavailable) reports that PU1ENGHA bound comparably to full-length PU.1 at open sites but much less at closed sites. The paper describes PU1ENGHA as primarily repressing targets rather than activating them, but the passages do not establish that it has spurious effects. (LLM, conf=0.86)
plaindirect- Asserted: passes — The authors put it forward as true.
- Checkable: passes — It can be checked against evidence.
- Load-bearing: unclear — It is unclear whether the paper’s conclusions depend on it.
- Based: passes — The paper gives a reason why it holds.
It may state two separate claims as one.
- Partly supported
The cited sources support only part of this claim — read each source’s verdict below.
In the paper
“These cells were a subclone derived from the Scid.adh cell line (87) and are similar to developmentally arrested versions of committed DN3 pro-T cells, lacking any expression of endogenous PU.1 (47).”
§ Mechanisms of Action of Hematopoietic Transcription Factor PU.1 in Initiation of T-Cell Development > Defining the PU.1 Regulome in Early T-cell Precursors > Cell Line and Primary-Cell Assay Systems for PU.1 Manipulation
What the sources say
- Partly supportedcites [47] Dionne, 2005, Subversion of T lineage commitment by PU.1 in a clonal cell line system sourceExperimental — accuracy not yet measured
The Introduction identifies adh.2C2 as a SCID.adh subclone with a DN3-like phenotype, and the Results describe the SCID.adh cells as arrested at a developmental stage. The Introduction says the subclone has ‘little if any’ endogenous PU.1 expression; the DN3-comparison section says it does not express PU.1 significantly. Those passages support very low expression, but not the categorical claim that it lacks any expression. (LLM, conf=0.82)
plaincorrelational- Asserted: passes — The authors put it forward as true.
- Checkable: passes — It can be checked against evidence.
- Load-bearing: passes — The paper’s conclusions depend on it.
- Based: passes — The paper gives a reason why it holds.
It may state two separate claims as one.
- Partly supported
Every source the paper cites for this claim was checked and supports it.
In the paper
“One problem is that the long half-life of PU.1 protein (82) can mask some loss effects at time points <2 days after deletion, while development of the pro-T cells can proceed to new stages if time windows are extended further.”
§ Mechanisms of Action of Hematopoietic Transcription Factor PU.1 in Initiation of T-Cell Development > Defining the PU.1 Regulome in Early T-cell Precursors > Kinetic Challenges: Protein Half-Lives vs. Developmental Progression
What the sources say
- Supportedcites [82] Kueh, 2013, Positive feedback between PU.1 and the cell cycle controls myeloid differentiation source
The citation is attached to the statement that PU.1 protein has a long half-life. The passage on PU.1 synthesis and removal states that its protein half-life is substantially longer than the progenitor cell-cycle length. The proposed masking of deletion effects and pro-T-cell development are the citing authors’ subsequent reasoning, not claims directly attributed by this citation. (LLM, conf=0.92)
plaindirect- Asserted: passes — The authors put it forward as true.
- Checkable: passes — It can be checked against evidence.
- Load-bearing: passes — The paper’s conclusions depend on it.
- Based: passes — The paper gives a reason why it holds.
It may state two separate claims as one.
- Supported
The cited sources support only part of this claim — read each source’s verdict below.
In the paper
“Second, in pro-T cells forced to express PU.1, those that make the lineage jump (i.e. lose CD25, gain CD11b) not only silence Notch1 but also activate myeloid regulatory genes (85).”
§ Mechanisms of Action of Hematopoietic Transcription Factor PU.1 in Initiation of T-Cell Development > PU.1 Action via Cofactor Recruitment > The Problem of Pro-T Cell Gene Repression by PU.1
What the sources say
- Partly supportedcites [85] Ungerbäck, 2018, Pioneering, chromatin remodeling, and epigenetic constraint in early T-cell gene regulation by SPI1 (PU.1) sourceExperimental — accuracy not yet measured
The Results section on PU.1 pioneering in DN3-like cells (page unavailable) reports that induced PU.1 lowers CD25 and later raises CD11b. The Discussion reports positive regulation of genes by PU.1 in pro-T cells, but our copy does not establish that the CD25-losing, CD11b-gaining cells silence Notch1 or activate myeloid regulatory genes specifically. (LLM, conf=0.84)
plaindirect- Asserted: passes — The authors put it forward as true.
- Checkable: passes — It can be checked against evidence.
- Load-bearing: passes — The paper’s conclusions depend on it.
- Based: passes — The paper gives a reason why it holds.
It may state two separate claims as one.
- Partly supported
The cited sources support only part of this claim — read each source’s verdict below.
In the paper
“Although PU.1 occupancy of genomic sites declines as development proceeds, PU.1 occupancy is still detectable through T-lineage commitment at ~5,000 sites before disappearing (84).”
§ Mechanisms of Action of Hematopoietic Transcription Factor PU.1 in Initiation of T-Cell Development > PU.1 Action on the Genome via Direct Binding > PU.1 Protein Is Stable and Active Across the Genome in Early T Cells
What the sources say
- Partly supportedcites [84] Zhang, 2012, Dynamic transformations of genome-wide epigenetic marking and transcriptional control establish T cell identity sourceExperimental — accuracy not yet measured
The Results section, “Early T-cell specific sites for PU.1: a positive role” (page unavailable), reports reduced PU.1 binding intensity in FLDN2b cells at T-lineage commitment and absence of PU.1 in later DP cells. It does not report approximately 5,000 occupied sites at commitment; the site count it gives is approximately 34,000 in DN T cells. (LLM, conf=0.88)
plaincorrelational- Asserted: passes — The authors put it forward as true.
- Checkable: passes — It can be checked against evidence.
- Load-bearing: passes — The paper’s conclusions depend on it.
- Based: passes — The paper gives a reason why it holds.
It may state two separate claims as one.
- Partly supported
Every source the paper cites for this claim was checked and supports it.
In the paper
“However, approximately half of the PU.1 occupancy sites in early pro-T cells appear to be relatively “inaccessible” in chromatin by the criterion of ATAC-seq at the stages when PU.1 is seen to be binding there, showing that PU.1 binding can occur without opening the chromatin.”
§ Mechanisms of Action of Hematopoietic Transcription Factor PU.1 in Initiation of T-Cell Development > PU.1 Action on the Genome via Direct Binding > PU.1 Binding Site Characteristics
What the sources say
- Supportedcites [85] Ungerbäck, 2018, Pioneering, chromatin remodeling, and epigenetic constraint in early T-cell gene regulation by SPI1 (PU.1) source
The Results section, “Dynamic PU.1 occupancy at open and closed chromatin sites in precommitment pro-T cells,” states that PU.1 occupied similar numbers of ATAC-closed and ATAC-open sites in DN1 and DN2a cells. It concludes that PU.1 binding does not always cause chromatin opening as scored by ATAC-seq. (LLM, conf=0.94)
hedgeddirect- Asserted: passes — The authors put it forward as true.
- Checkable: passes — It can be checked against evidence.
- Load-bearing: passes — The paper’s conclusions depend on it.
- Based: passes — The paper gives a reason why it holds.
It may state two separate claims as one.
- Supported
The cited sources support only part of this claim — read each source’s verdict below.
In the paper
“Full-length PU.1 binds closed sites nearly as well as open sites, whereas the isolated PU.1 DNA binding domain binds open sites as well as full-length but selectively fails to bind at closed sites (85) (Figure 6).”
§ Mechanisms of Action of Hematopoietic Transcription Factor PU.1 in Initiation of T-Cell Development > PU.1 Action on the Genome via Direct Binding > PU.1 Binding Site Characteristics
What the sources say
- Partly supportedcites [85] Ungerbäck, 2018, Pioneering, chromatin remodeling, and epigenetic constraint in early T-cell gene regulation by SPI1 (PU.1) sourceExperimental — accuracy not yet measured
In Results (‘PU.1 requires its non-DNA-binding domains to occupy sites in closed chromatin,’ Fig. 5E–F), the truncated constructs match full-length PU.1 at open sites but bind substantially less at closed sites. The claim that full-length PU.1 binds closed sites ‘nearly as well’ as open sites overstates the finding: the Results describe an affinity cost for entering closed chromatin. (LLM, conf=0.86)
plaincorrelational- Asserted: passes — The authors put it forward as true.
- Checkable: passes — It can be checked against evidence.
- Load-bearing: passes — The paper’s conclusions depend on it.
- Based: passes — The paper gives a reason why it holds.
It may state two separate claims as one.
- Partly supported
Every source the paper cites for this claim was checked and supports it.
In the paper
“while the obligate repressor downregulated genes that are positive regulatory targets of wildtype PU.1, it actually upregulated many genes that wildtype PU.1 represses, completely inconsistent with a direct repression mechanism (79).”
§ Mechanisms of Action of Hematopoietic Transcription Factor PU.1 in Initiation of T-Cell Development > PU.1 Action via Cofactor Recruitment > The Problem of Pro-T Cell Gene Repression by PU.1
What the sources say
- Supportedcites [79] Champhekar, 2015, Regulation of early T-lineage gene expression and developmental progression by the progenitor cell transcription factor PU source
The Results sections on PU.1-Eng target genes report that genes downregulated by the obligate repressor are enriched for direct, functional targets of endogenous PU.1. The Results section on T-lineage development says PU.1-Eng instead upregulates T-cell genes that endogenous PU.1 normally represses, supporting an indirect rather than direct repression mechanism. Page numbers are unavailable in our copy. (LLM, conf=0.91)
boosteddirect- Asserted: passes — The authors put it forward as true.
- Checkable: passes — It can be checked against evidence.
- Load-bearing: passes — The paper’s conclusions depend on it.
- Based: passes — The paper gives a reason why it holds.
It may state two separate claims as one.
- Supported
The cited sources support only part of this claim — read each source’s verdict below.
In the paper
“This is consistent with PU.1's activity as a site-specific chromatin opening factor in B cells (96, 97), with the ability of PU.1 to eject nucleosomes from sites where it binds in macrophage lines (12), and with its ability to cause rapid increases in ATAC accessibility at the sites it occupies when introduced into Scid.adh.2C2 cells (85).”
§ Mechanisms of Action of Hematopoietic Transcription Factor PU.1 in Initiation of T-Cell Development > PU.1 Action on the Genome via Direct Binding > PU.1 Binding Site Characteristics
What the sources say
- Supportedcites [96] Nikolajczyk, 1999, ETS protein-dependent accessibility changes at the immunoglobulin æ heavy chain enhancer source
This source is cited for the B-cell chromatin-opening clause, not the separate macrophage or ATAC-accessibility claims. In the Discussion (page not provided), the authors report that PU.1 increases accessibility at the IgH μ locus and propose that it opens the locus during B-cell development. (LLM, conf=0.87)
- Not checked — no full text of the sourcecites [97] Marecki, 2004, PU.1 as a chromatin accessibility factor for immunoglobulin genes source
- Partly supportedcites [12] Barozzi, 2014, Coregulation of transcription factor binding and nucleosome occupancy through DNA features of mammalian enhancers sourceExperimental — accuracy not yet measured
The Results section ('Selective masking of engaged Pu.1 sites by nucleosomes'; page unavailable) reports removal of a centrally positioned nucleosome at some Pu.1-bound sites, but only partial displacement and repositioning at others. The Introduction identifies the study system as primary mouse macrophages, not macrophage cell lines. The B-cell and Scid.adh.2C2 statements have separate citations and are not assessed here. (LLM, conf=0.87)
- Supportedcites [85] Ungerbäck, 2018, Pioneering, chromatin remodeling, and epigenetic constraint in early T-cell gene regulation by SPI1 (PU.1) source
Citation 85 supports the Scid.adh.2C2 clause, not the separately cited B-cell and macrophage clauses. In the Results section on pioneering in DN3-like cells (page unavailable), the paper reports that introduced PU1-ERT2 rapidly made occupied, previously closed sites ATAC-accessible, with the response maximal within 2 hours. (LLM, conf=0.94)
plaindirect- Asserted: passes — The authors put it forward as true.
- Checkable: passes — It can be checked against evidence.
- Load-bearing: passes — The paper’s conclusions depend on it.
- Based: passes — The paper gives a reason why it holds.
It may state two separate claims as one.
- Supported
Every source the paper cites for this claim was checked and supports it.
In the paper
“It is also reported to act as a repressor by direct recruitment of Dnmt3b (102).”
§ Mechanisms of Action of Hematopoietic Transcription Factor PU.1 in Initiation of T-Cell Development > PU.1 Action via Cofactor Recruitment > The Problem of Pro-T Cell Gene Repression by PU.1
What the sources say
- Supportedcites [102] de la Rica, 2013, PU.1 target genes undergo Tet2-coupled demethylation and DNMT3b-mediated methylation in monocyte-to-osteoclast differentiation source
The Discussion reports that PU.1 associates with genes repressed through hypermethylation and has a direct role in recruiting DNMT3b to target promoters during monocyte-to-osteoclast differentiation. The paper also describes a separate activating role for PU.1, but that does not conflict with the claim that it can act as a repressor. (LLM, conf=0.93)
hedgeddirect- Asserted: passes — The authors put it forward as true.
- Checkable: passes — It can be checked against evidence.
- Load-bearing: fails — The paper’s conclusions may not depend on it.
- Based: passes — The paper gives a reason why it holds.
Probably not a substantial claim. The paper’s conclusions may not depend on it.
- Supported
The cited sources support only part of this claim — read each source’s verdict below.
In the paper
“At high levels, PU.1 has been found to block DNA binding by GATA-1 (23), while at lower levels it is reported to antagonize GATA-1-mediated transactivation by forming complexes with it that recruit Rb through the PU.1 acidic transactivation domain (101).”
§ Mechanisms of Action of Hematopoietic Transcription Factor PU.1 in Initiation of T-Cell Development > PU.1 Action via Cofactor Recruitment > The Problem of Pro-T Cell Gene Repression by PU.1
What the sources say
- Not matchedcites [23] PU.1 inhibits GATA-1 function and erythroid differentiation by blocking GATA-1 DNA binding264148 ZhangP ZhangX IwamaA YuC SmithKA MuellerBU 11023493Blood962000
Couldn’t be matched to a paper in Crossref, so it can’t be checked.
- Supportedcites [101] Rekhtman, 2003, PU.1 and pRB interact and cooperate to repress GATA-1 and block erythroid differentiation source
The citation to this paper is attached to the lower-level mechanism, not the preceding high-level DNA-binding claim. The Results (pp. 3–5) describe PU.1 binding to GATA-1 on DNA and identify its acidic transactivation subdomain as necessary for pRB binding and GATA-1 repression. The Discussion model (p. 13) states that PU.1 tethers pRB to repress transcription. (LLM, conf=0.92)
hedgeddirect- Asserted: passes — The authors put it forward as true.
- Checkable: passes — It can be checked against evidence.
- Load-bearing: unclear — It is unclear whether the paper’s conclusions depend on it.
- Based: passes — The paper gives a reason why it holds.
It may state two separate claims as one.
- Not matched
The cited sources support only part of this claim — read each source’s verdict below.
In the paper
“For PU.1 in pro-T cells, IRF and C/EBP family partners are mostly not available, but a key positive regulatory partner is Runx1 (previously known as AML1 or CBFα2), which has long been known to interact with PU.1 (and C/EBPα) to form a functional complex at its myeloid positive regulatory target sites (9, 112, 113).”
§ Mechanisms of Action of Hematopoietic Transcription Factor PU.1 in Initiation of T-Cell Development > PU.1 Action via Cofactor Recruitment > System Consequences of Cofactor Recruitment: Repression by Theft
What the sources say
- Partly supportedcites [9] Imperato, 2015, The RUNX1-PU.1 axis in the control of hematopoiesis sourceExperimental — accuracy not yet measured
The ‘Developmental-stage-specific RUNX1 and PU.1 function’ section says RUNX1 and PU.1 form a synergistic complex in myeloid cells that regulates lineage-specific genes. The ‘RUNX1 and PU.1 in T and B-cells’ section discusses each factor’s role in early T-cell development but does not establish that RUNX1 is a key positive partner of PU.1 in pro-T cells. Page numbers are unavailable in our copy. (LLM, conf=0.86)
- Not checked yetcites [112] Petrovick, 1998, Multiple functional domains of AML1: PU
- Partly supportedcites [113] Leddin, 2011, Two distinct auto-regulatory loops operate at the PU.1 locus in B cells and myeloid cells sourceExperimental — accuracy not yet measured
The section on regulation of PU.1 in mice says RUNX1 activates the PU.1 upstream regulatory element early in development, supporting a positive regulatory role. It does not establish that Runx1 is a key PU.1 partner in pro-T cells or that the two form a functional complex at myeloid target sites; the paper examines regulation at the PU.1 locus in B and myeloid cells. Page numbers are unavailable in our copy. (LLM, conf=0.84)
boosteddirect- Asserted: passes — The authors put it forward as true.
- Checkable: passes — It can be checked against evidence.
- Load-bearing: passes — The paper’s conclusions depend on it.
- Based: passes — The paper gives a reason why it holds.
It may state two separate claims as one.
- Partly supported
Every source the paper cites for this claim was checked and supports it.
In the paper
“PU.1 itself is functionally important for the open status of these chromatin sites in the early stages, for many of these sites in fact do not remain as open if the PU.1 is removed acutely from primary pro-T cells by Cas9-mediated deletion (85).”
§ Mechanisms of Action of Hematopoietic Transcription Factor PU.1 in Initiation of T-Cell Development > PU.1 Action on the Genome via Direct Binding > PU.1 Binding Site Characteristics
What the sources say
- Supportedcites [85] Ungerbäck, 2018, Pioneering, chromatin remodeling, and epigenetic constraint in early T-cell gene regulation by SPI1 (PU.1) source
The Results section, Figure 2 legend (page not supplied), describes Cas9-mediated disruption of PU.1 in DN2 pro-T cells and identifies sites that lose accessibility after deletion. The Discussion (page not supplied) states that PU.1 is continuously required to maintain accessibility at many target sites. (LLM, conf=0.94)
plaindirect- Asserted: passes — The authors put it forward as true.
- Checkable: passes — It can be checked against evidence.
- Load-bearing: passes — The paper’s conclusions depend on it.
- Based: passes — The paper gives a reason why it holds.
It may state two separate claims as one.
- Supported
The sources with a verdict support this claim; the rest weren’t checked yet, have no full text we could read, or their verdicts aren’t rated yet.
In the paper
“Egr2, for example, can collaborate with PU.1 in positive regulation when co-bound with it (106), but has also been implicated as a PU.1-stimulated repressor of the mir17~92 complex (107).”
§ Mechanisms of Action of Hematopoietic Transcription Factor PU.1 in Initiation of T-Cell Development > PU.1 Action via Cofactor Recruitment > The Problem of Pro-T Cell Gene Repression by PU.1
What the sources say
- Not checked — no full text of the sourcecites [106] Krysinska, 2007, A two-step, PU.1 dependent, mechanism for developmentally regulated chromatin remodelling and transcription of the c-fms gene source
- Supportedcites [107] Pospisil, 2011, Epigenetic silencing of the oncogenic miR-17-92 cluster during PU.1-directed macrophage differentiation source
The Results section, “Downregulation of miR-17-92 is mediated by Egr2” (page not provided), reports that PU.1 activates Egr2 during macrophage differentiation and that Egr2 represses the miR-17-92 cluster. Citation 107 is attached to this repressor claim, not to the preceding claim about co-bound positive regulation. (LLM, conf=0.93)
plaindirect- Asserted: passes — The authors put it forward as true.
- Checkable: passes — It can be checked against evidence.
- Load-bearing: unclear — It is unclear whether the paper’s conclusions depend on it.
- Based: passes — The paper gives a reason why it holds.
It may state two separate claims as one.
Every source the paper cites for this claim was checked and supports it.
In the paper
“However, the aspect of this redistribution that is most notable is that Runx1 is depleted in the process from alternative sites, and the sites that it abandons are themselves highly functional sites.”
§ Mechanisms of Action of Hematopoietic Transcription Factor PU.1 in Initiation of T-Cell Development > PU.1 Action via Cofactor Recruitment > System Consequences of Cofactor Recruitment: Repression by Theft
What the sources say
- Supportedcites [80] Hosokawa, 2018, Transcription factor PU.1 represses and activates gene expression in early T cells by redirecting partner transcription factor binding source
In Results, “PU.1 redirects transcription factor ensembles across the genome” reports that introducing PU.1 reduced Runx1 binding at about half of the non-promoter sites occupied in control cells. “Functional importance of Satb1 and Runx1 in gene regulation by PU.1” links the abandoned ‘old’ sites to genes whose expression falls when Runx1 is disrupted, supporting their functional importance. Page numbers are not available in our copy. (LLM, conf=0.88)
plaindirect- Asserted: passes — The authors put it forward as true.
- Checkable: passes — It can be checked against evidence.
- Load-bearing: passes — The paper’s conclusions depend on it.
- Based: passes — The paper gives a reason why it holds.
It may state two separate claims as one.
- Supported
The cited sources support only part of this claim — read each source’s verdict below.
In the paper
“PU.1 is not uniquely responsible for the Phase 1 gene expression pattern, however, for other Phase 1 genes are either unaffected or moderately inhibited by PU.1, as discussed elsewhere (79, 123).”
§ Mechanisms of Action of Hematopoietic Transcription Factor PU.1 in Initiation of T-Cell Development > The PU.1 Regulome in Early pro-T cells and Its physiological Roles > PU.1 Target Genes: Gene Network Roles and Developmental Timing
What the sources say
- Partly supportedcites [79] Champhekar, 2015, Regulation of early T-lineage gene expression and developmental progression by the progenitor cell transcription factor PU sourceExperimental — accuracy not yet measured
The Discussion (page unavailable) rules out PU.1 as a global positive regulator of Phase 1 genes and says it blunts expression of one group. The Results section on the progenitor-associated regulatory gene network (page unavailable) likewise reports repression of several Phase 1 genes, but the cited passages do not establish that other Phase 1 genes are unaffected or that the inhibition is moderate. (LLM, conf=0.82)
- Partly supportedcites [123] Longabaugh, 2017, Bcl11b and combinatorial resolution of cell fate in the T-cell gene regulatory network sourceExperimental — accuracy not yet measured
In “Explaining Bcl11b Impact on Development” (page unavailable), the paper finds that PU.1-dependent genes form a subset of early-expressed genes and that PU.1 and Bcl11b provide mostly orthogonal inputs. It also reports weak PU.1 repression of Kit, but does not establish that the other Phase 1 genes are generally unaffected or moderately inhibited by PU.1. (LLM, conf=0.78)
plaindirect- Asserted: passes — The authors put it forward as true.
- Checkable: passes — It can be checked against evidence.
- Load-bearing: passes — The paper’s conclusions depend on it.
- Based: passes — The paper gives a reason why it holds.
It may state two separate claims as one.
- Partly supported
Every source the paper cites for this claim was checked and supports it.
In the paper
“First, PU.1 does not appear to bind, even transiently, at the sites from which Runx1 is lost: Runx1 is competitively redistributed, but is not displaced.”
§ Mechanisms of Action of Hematopoietic Transcription Factor PU.1 in Initiation of T-Cell Development > PU.1 Action via Cofactor Recruitment > System Consequences of Cofactor Recruitment: Repression by Theft
What the sources say
- Supportedcites [80] Hosokawa, 2018, Transcription factor PU.1 represses and activates gene expression in early T cells by redirecting partner transcription factor binding source
In Results, the paper reports that most sites losing Runx1 showed no direct PU.1 binding and that early transient PU.1 binding did not account for Runx1 removal. It concludes that PU.1 recruits Runx1 elsewhere rather than displacing it from the old sites. (LLM, conf=0.90)
hedged- Asserted: passes — The authors put it forward as true.
- Checkable: passes — It can be checked against evidence.
- Load-bearing: passes — The paper’s conclusions depend on it.
- Based: passes — The paper gives a reason why it holds.
It may state two separate claims as one.
- Supported
The cited sources support only part of this claim — read each source’s verdict below.
In the paper
“Additional factors also probably collaborate with PU.1 to fine-tune the responses of Mef2c and Lmo2, for they are already declining by the end of ETP stage, multiple cell cycles before DN2b stage when PU.1 itself declines (65, 67, 84, 121, 124) (Figure 8A).”
§ Mechanisms of Action of Hematopoietic Transcription Factor PU.1 in Initiation of T-Cell Development > The PU.1 Regulome in Early pro-T cells and Its physiological Roles > PU.1 Target Genes: Gene Network Roles and Developmental Timing
What the sources say
- Partly supportedcites [65] Yui, 2014, Developmental gene networks: a triathlon on the course to T cell identity sourceExperimental — accuracy not yet measured
The ‘Transition to phase 2’ section says Spi1 (PU.1) is turned off as cells progress through DN2b, and ‘Checkpoint failure and T-cell leukemias’ says some progenitor genes terminate expression within the ETP stage. Neither passage identifies Mef2c and Lmo2 as declining by the end of ETP or says that other factors collaborate with PU.1 to fine-tune their responses. The paper describes several cell cycles before DN2b in relation to TCF-1 and GATA-3 activation, not the proposed decline of those two genes. (LLM, conf=0.83)
- Could not verifycites [67] Manesso, 2013, Computational modelling of T-cell formation kinetics: output regulated by initial proliferation-linked deferral of developmental competence sourceExperimental — accuracy not yet measured
The Discussion describes division-linked changes in DN1 cells’ competence to progress to DN2, but does not address Mef2c or Lmo2 expression or PU.1’s decline. Searches for those factors and the claimed ETP-to-DN2b timing found no passage in our copy that verifies the comparison. (LLM, conf=0.75)
- Partly supportedcites [84] Zhang, 2012, Dynamic transformations of genome-wide epigenetic marking and transcriptional control establish T cell identity sourceExperimental — accuracy not yet measured
The Results section on transcription-factor expression dynamics reports that Mef2c, Lmo2, and Sfpi1 (PU.1) decrease between FLDN1 and FLDN2b. The Results section on early T-cell-specific PU.1 sites says PU.1 is markedly downregulated at DN2b, and the binding-dynamics section suggests PU.1 can act through combinations of binding complexes. Our copy does not establish that Mef2c and Lmo2 begin declining by the end of ETP, multiple cell cycles before PU.1, or that other factors specifically collaborate with PU.1 to regulate those two genes. (LLM, conf=0.83)
hedgedconditional- Asserted: passes — The authors put it forward as true.
- Checkable: passes — It can be checked against evidence.
- Load-bearing: unclear — It is unclear whether the paper’s conclusions depend on it.
- Based: passes — The paper gives a reason why it holds.
It may state two separate claims as one.
- Partly supported
The cited sources support only part of this claim — read each source’s verdict below.
In the paper
“However, cells in these stages are hard to visualize in the intact thymus, as only a few cells per day are granted regulated entry into the thymic antechamber (127), then migrate slowly through the cortex, dispersing among a vast excess of more advanced T-cell precursors, as they begin to differentiate toward commitment (128).”
§ Mechanisms of Action of Hematopoietic Transcription Factor PU.1 in Initiation of T-Cell Development > The PU.1 Regulome in Early pro-T cells and Its physiological Roles > PU.1 as a Choreographer of Thymocyte Cell Biology
What the sources say
- Partly supportedcites [127] Zietara, 2015, Multicongenic fate mapping quantification of dynamics of thymus colonization sourceExperimental — accuracy not yet measured
The Abstract (page unavailable) says that low numbers of progenitors enter the thymus, making them difficult to characterize, and describes thymus colonization as tightly controlled. Its estimate of 10–200 cells per day, however, is explicitly for irradiated adult thymi; it does not establish that daily rate for the intact, unirradiated thymus. The later migration through the cortex is attached to citation (128), not this source. (LLM, conf=0.84)
- Partly supportedcites [128] Lind, 2001, Mapping precursor movement through the postnatal thymus reveals specific microenvironments supporting defined stages of early lymphoid development sourceExperimental — accuracy not yet measured
The Discussion (page unavailable) reports that precursors migrate outward across the cortex while progressing through defined developmental stages, supporting the migration-and-differentiation portion attributed to this paper. It describes the stages as concentrated in distinct cortical regions, however, and does not establish that the cells disperse among a vast excess of more advanced precursors. The separate claim about a few cells entering per day is attached to citation 127, not this source. (LLM, conf=0.84)
plaindirect- Asserted: passes — The authors put it forward as true.
- Checkable: passes — It can be checked against evidence.
- Load-bearing: unclear — It is unclear whether the paper’s conclusions depend on it.
- Based: passes — The paper gives a reason why it holds.
It may state two separate claims as one.
- Partly supported
The cited sources support only part of this claim — read each source’s verdict below.
In the paper
“It probably extends for over 10 days for the thymocytes in young adult mice (153), where it is crucial for successful T-cell generation (2, 147).”
§ Mechanisms of Action of Hematopoietic Transcription Factor PU.1 in Initiation of T-Cell Development > Conclusions and Future Questions
What the sources say
- Partly supportedcites [153] Porritt, 2003, Kinetics of steady-state differentiation and mapping of intrathymic-signaling environments by stem cell transplantation in nonirradiated mice sourceExperimental — accuracy not yet measured
The Results and Discussion (page unavailable) report that thymic progenitors take about 15 days to reach the double-positive stage, supporting a developmental interval longer than 10 days. The paper does not establish that PU.1 remains active throughout that interval. The statement about PU.1 being crucial for T-cell generation is attached to other citations, not this one. (LLM, conf=0.85)
- Partly supportedcites [2] Dakic, 2005, PU.1 regulates the commitment of adult hematopoietic progenitors and restricts granulopoiesis sourceExperimental — accuracy not yet measured
The Results (‘PU.1-deficient stem cells do not generate lymphoid progeny’; page unavailable) report that PU.1-deficient progenitors were essentially unable to contribute to T-cell production, supporting its importance for T-cell generation. The paper does not establish that PU.1 remains active in thymocytes for over 10 days; the Results (‘Generation and validation of a PU.1 conditional allele’) instead state that most thymocytes do not express it. Its 10–14-day interval refers to when mice were analyzed after induced deletion, not a duration of thymocyte activity. (LLM, conf=0.87)
- Supportedcites [147] Montecino-Rodriguez, 2018, Differential expression of PU.1 and Key T lineage transcription factors distinguishes fetal and adult T Cell development source
The Discussion (page unavailable) reports that adult T-cell development requires higher PU.1 expression and that thymopoiesis was absent in adult mice with reduced PU.1 expression. This supports the claim that PU.1 is crucial for adult T-cell generation. The separate claim about activity lasting over 10 days is attributed to citation 153, not this source. (LLM, conf=0.91)
hedgedconditional- Asserted: passes — The authors put it forward as true.
- Checkable: passes — It can be checked against evidence.
- Load-bearing: passes — The paper’s conclusions depend on it.
- Based: passes — The paper gives a reason why it holds.
It may state two separate claims as one.
- Partly supported
Every source the paper cites for this claim was checked and supports it.
In the paper
“In postnatal mice, the entry point is thought to be formed by specialized endothelial cells at the cortical/medullary border of the thymus (129).”
§ Mechanisms of Action of Hematopoietic Transcription Factor PU.1 in Initiation of T-Cell Development > The PU.1 Regulome in Early pro-T cells and Its physiological Roles > PU.1 as a Choreographer of Thymocyte Cell Biology
What the sources say
- Supportedcites [129] Buono, 2016, A dynamic niche provides Kit ligand in a stage-specific manner to the earliest thymocyte progenitors source
The paper states that thymus-seeding progenitors enter at the cortico-medullary junction (Introduction; page unavailable). The Results identify a distinct vascular endothelial-cell subset on its cortical side, in the area of progenitor immigration, and the Discussion suggests that progenitors’ association with these cells may reflect their point of entry. This supports the citing sentence’s hedged description. (LLM, conf=0.86)
hedged- Asserted: passes — The authors put it forward as true.
- Checkable: passes — It can be checked against evidence.
- Load-bearing: fails — The paper’s conclusions may not depend on it.
- Based: passes — The paper gives a reason why it holds.
Probably not a substantial claim. The paper’s conclusions may not depend on it.
- Supported
The cited sources support only part of this claim — read each source’s verdict below.
In the paper
“Following an unknown triggering signal, after a variable delay (125), the cells in each cohort then begin to migrate centrifugally toward the outer thymic cortex, and cell surface marker expression patterns imply that it is somewhere midway in the course of this migration that the individual cells undergo lineage commitment [reviewed by (60, 130)].”
§ Mechanisms of Action of Hematopoietic Transcription Factor PU.1 in Initiation of T-Cell Development > The PU.1 Regulome in Early pro-T cells and Its physiological Roles > PU.1 as a Choreographer of Thymocyte Cell Biology
What the sources say
- Not checked — no full text of the sourcecites [60] Petrie, 2007, Zoned out: functional mapping of stromal signaling microenvironments in the thymus source
- Partly supportedcites [130] Love, 2011, Signal integration and crosstalk during thymocyte migration and emigration sourceExperimental — accuracy not yet measured
Split into 2 atoms — 0 confirmed, 2 partially supported, 0 disputed, 0 misattributed, 0 unverifiable. Expand the claim to see per-atom verdicts.
hedgedcorrelational- Asserted: passes — The authors put it forward as true.
- Checkable: passes — It can be checked against evidence.
- Load-bearing: fails — The paper’s conclusions may not depend on it.
- Based: passes — The paper gives a reason why it holds.
Probably not a substantial claim. The paper’s conclusions may not depend on it. It may state two separate claims as one.
The cited sources support only part of this claim — read each source’s verdict below.
In the paper
“This is now understood to be intrinsically programmed (136) and due to an altered pathway of differentiation in the first-wave cells, which results in T-cell lineage commitment even before entry into the thymus (137–139).”
§ Mechanisms of Action of Hematopoietic Transcription Factor PU.1 in Initiation of T-Cell Development > PU.1 and the Regulation of Lymphoid Development in Ontogeny
What the sources say
- Supportedcites [136] Yuan, 2012, Lin28b reprograms adult bone marrow hematopoietic progenitors to mediate fetal-like lymphopoiesis source
The citation to this paper is attached to the claim that the difference is intrinsically programmed, not to the later claim about T-cell commitment before thymus entry. In the Abstract, the paper states that fetal-liver HSCs are intrinsically programmed to generate B-1a B cells and Vγ3+ γδ T cells. (LLM, conf=0.90)
- Not checked — no full text of the sourcecites [137] Harman, 2005, T/B lineage choice occurs prior to intrathymic Notch signalling source
- Partly supportedcites [138] Masuda, 2005, Prethymic T-cell development defined by the expression of paired immunoglobulin-like receptors sourceExperimental — accuracy not yet measured
The Results report that commitment to the T/NK/DC lineage occurs in extrathymic organs, and the Discussion describes prethymic progenitors as genetically distinct from intrathymic ones. But the Discussion says these progenitors *may* represent the first phase of thymic immigration; it does not establish an altered differentiation pathway specific to first-wave cells or exclusive commitment to the T-cell lineage. The separate claim of intrinsic programming is attached to citation 136, not this source. (LLM, conf=0.85)
- Not checked — no full text of the sourcecites [139] Berthault, 2017, Asynchronous lineage priming determines commitment to T cell and B cell lineages in fetal liver source
plaindirect- Asserted: passes — The authors put it forward as true.
- Checkable: passes — It can be checked against evidence.
- Load-bearing: unclear — It is unclear whether the paper’s conclusions depend on it.
- Based: passes — The paper gives a reason why it holds.
It may state two separate claims as one.
- Supported
The cited sources support only part of this claim — read each source’s verdict below.
In the paper
“ETPs derived from these precursors naturally express lower levels of PU.1 than adult ETPs, but they are almost unchanged in their ability to generate early fetal T cells when the level of PU.1 is reduced still further (~5 fold) by deletion of the major upstream regulatory element of PU.1 (147).”
§ Mechanisms of Action of Hematopoietic Transcription Factor PU.1 in Initiation of T-Cell Development > PU.1 and the Regulation of Lymphoid Development in Ontogeny
What the sources say
- Partly supportedcites [147] Montecino-Rodriguez, 2018, Differential expression of PU.1 and Key T lineage transcription factors distinguishes fetal and adult T Cell development sourceExperimental — accuracy not yet measured
Split into 2 atoms — 1 confirmed, 1 partially supported, 0 disputed, 0 misattributed, 0 unverifiable. Expand the claim to see per-atom verdicts.
plain- Asserted: passes — The authors put it forward as true.
- Checkable: passes — It can be checked against evidence.
- Load-bearing: passes — The paper’s conclusions depend on it.
- Based: passes — The paper gives a reason why it holds.
It may state two separate claims as one.
- Partly supported
The cited sources support only part of this claim — read each source’s verdict below.
In the paper
“It has long been recognized that the earliest fetal thymocytes are different from later waves of developing thymocytes in terms of their abilities to generate particular classes of TCRγδ cells (134) and in terms of their extremely fast differentiation kinetics, both in vivo and in fetal thymic organ culture or stromal coculture systems (104, 133, 135).”
§ Mechanisms of Action of Hematopoietic Transcription Factor PU.1 in Initiation of T-Cell Development > PU.1 and the Regulation of Lymphoid Development in Ontogeny
What the sources say
- Not checked — no full text of the sourcecites [134] Ikuta, 1990, A developmental switch in thymic lymphocyte maturation potential occurs at the level of hematopoietic stem cells source
- Partly supportedcites [104] Scripture-Adams, 2014, GATA-3 dose-dependent checkpoints in early T cell commitment sourceExperimental — accuracy not yet measured
Split into 2 atoms — 0 confirmed, 1 partially supported, 0 disputed, 0 misattributed, 1 unverifiable. Expand the claim to see per-atom verdicts.
- Not checked — no full text of the sourcecites [133] Ramond, 2014, Two waves of distinct hematopoietic progenitor cells colonize the fetal thymus source
- Not checked — no full text of the sourcecites [135] Kawamoto, 1997, Hemopoietic progenitors in the murine fetal liver capable of rapidly generating T cells source
boostedcorrelational- Asserted: passes — The authors put it forward as true.
- Checkable: passes — It can be checked against evidence.
- Load-bearing: unclear — It is unclear whether the paper’s conclusions depend on it.
- Based: passes — The paper gives a reason why it holds.
It may state two separate claims as one.
The cited sources support only part of this claim — read each source’s verdict below.
In the paper
“These stages span multiple cell cycles in vivo and in vitro (33, 39, 67, 124).”
§ Mechanisms of Action of Hematopoietic Transcription Factor PU.1 in Initiation of T-Cell Development > The PU.1 Regulome in Early pro-T cells and Its physiological Roles > PU.1 as a Choreographer of Thymocyte Cell Biology
What the sources say
- Partly supportedcites [33] Yui, 2010, Fine-scale staging of T cell lineage commitment in adult mouse thymus sourceExperimental — accuracy not yet measured
The Results section, “DN2b cells are distinct from DN3 cells” (page unavailable), reports that cultured DN2b cells retained CD25 after 5–8 cell divisions, supporting the in vitro portion. Our copy does not establish that these stages span multiple cell cycles in vivo. (LLM, conf=0.84)
- Supportedcites [39] Masuda, 2007, T cell lineage determination precedes the initiation of TCRβ rearrangement source
The Discussion reports more than ten cell divisions during the DN1 and DN2 stages in fetal thymus, supporting the in vivo part. The in vitro transition experiments report approximately fourfold and fivefold increases in cell number during culture, supporting multiple divisions in vitro. Page numbers are not provided in our copy. (LLM, conf=0.90)
- Supportedcites [67] Manesso, 2013, Computational modelling of T-cell formation kinetics: output regulated by initial proliferation-linked deferral of developmental competence source
The Introduction states that cells undergo varying numbers of proliferation cycles within thymocyte developmental stages. Results §2.4 reports multiple divisions by DN1 cells over four days in vitro, while the paper’s in vivo model describes successive generations within the DN1 stage. Page numbers are unavailable in our copy. (LLM, conf=0.87)
plain- Asserted: passes — The authors put it forward as true.
- Checkable: passes — It can be checked against evidence.
- Load-bearing: fails — The paper’s conclusions may not depend on it.
- Based: passes — The paper gives a reason why it holds.
Probably not a substantial claim. The paper’s conclusions may not depend on it.
- Partly supported
The cited sources support only part of this claim — read each source’s verdict below.
In the paper
“For example, the crucial T-lineage transcription factor TCF-1, which plays roles in numerous phases of thymocyte development (95, 140–145), is essential to maintain adult T-cell production but dispensable in fetal and early postnatal T cell development (146).”
§ Mechanisms of Action of Hematopoietic Transcription Factor PU.1 in Initiation of T-Cell Development > PU.1 and the Regulation of Lymphoid Development in Ontogeny
What the sources say
- Partly supportedcites [146] Schilham, 1998, Critical involvement of Tcf-1 in expansion of thymocytes sourceExperimental — accuracy not yet measured
The Discussion reports a lack of adult T-cell production without Tcf-1, supporting the adult portion of the claim. But the ‘Rapid involution of the adult thymus with age’ section reports fewer fetal thymocytes and changes in thymocyte populations by day 10 after birth; the fetal-progenitor experiments also show a developmental defect. The paper therefore does not support calling Tcf-1 dispensable in fetal and early postnatal development. Page numbers were not available in our copy. (LLM, conf=0.90)
plaindirect- Asserted: passes — The authors put it forward as true.
- Checkable: passes — It can be checked against evidence.
- Load-bearing: unclear — It is unclear whether the paper’s conclusions depend on it.
- Based: passes — The paper gives a reason why it holds.
It may state two separate claims as one.
- Partly supported
The cited sources support only part of this claim — read each source’s verdict below.
In the paper
“In contrast, the same five-fold diminished level of PU.1 sharply degrades the ability of later fetal hematopoietic stem and progenitor cells to generate T cells at all, in vivo or in vitro, with functional and phenotypic defects evident in the mutants in both multipotent progenitors and newly-entered intrathymic ETPs, as early as in the late fetus.”
§ Mechanisms of Action of Hematopoietic Transcription Factor PU.1 in Initiation of T-Cell Development > PU.1 and the Regulation of Lymphoid Development in Ontogeny
What the sources say
- Partly supportedcites [147] Montecino-Rodriguez, 2018, Differential expression of PU.1 and Key T lineage transcription factors distinguishes fetal and adult T Cell development sourceExperimental — accuracy not yet measured
Split into 2 atoms — 0 confirmed, 2 partially supported, 0 disputed, 0 misattributed, 0 unverifiable. Expand the claim to see per-atom verdicts.
plaindirect- Asserted: passes — The authors put it forward as true.
- Checkable: passes — It can be checked against evidence.
- Load-bearing: passes — The paper’s conclusions depend on it.
- Based: passes — The paper gives a reason why it holds.
It may state two separate claims as one.
- Partly supported
The cited sources support only part of this claim — read each source’s verdict below.
In the paper
“In contrast, for many first-wave fetal thymocytes it may last only a day or two, and is mostly or entirely dispensable (71, 147).”
§ Mechanisms of Action of Hematopoietic Transcription Factor PU.1 in Initiation of T-Cell Development > Conclusions and Future Questions
What the sources say
- Not checked — no full text of the sourcecites [71] Spain, 1999, T cell development in PU.1-deficient mice source
- Partly supportedcites [147] Montecino-Rodriguez, 2018, Differential expression of PU.1 and Key T lineage transcription factors distinguishes fetal and adult T Cell development sourceExperimental — accuracy not yet measured
The Discussion (page unavailable) says the early fetal T-cell developmental wave is largely PU.1 independent, supporting the claim’s qualified dispensability point. The study used mice with reduced, not absent, PU.1 expression, and our copy does not establish that PU.1 activity lasts only a day or two in first-wave fetal thymocytes. (LLM, conf=0.86)
hedged- Asserted: passes — The authors put it forward as true.
- Checkable: passes — It can be checked against evidence.
- Load-bearing: passes — The paper’s conclusions depend on it.
- Based: passes — The paper gives a reason why it holds.
It may state two separate claims as one.
The cited sources support only part of this claim — read each source’s verdict below.
In the paper
“Indeed, pro-T cells that have PU.1 acutely deleted at an early stage do not only differentiate faster along the T lineage; they also tend to shift to a natural killer-like program more readily than controls (79).”
§ Mechanisms of Action of Hematopoietic Transcription Factor PU.1 in Initiation of T-Cell Development > Conclusions and Future Questions
What the sources say
- Partly supportedcites [79] Champhekar, 2015, Regulation of early T-lineage gene expression and developmental progression by the progenitor cell transcription factor PU sourceExperimental — accuracy not yet measured
The Results section reports that deleting PU.1 at the ETP or DN2a stage made early T cells differentiate faster than controls. It also reports greater NK-cell production under permissive conditions, but that result concerns progeny of PU.1-deficient fetal liver precursors, not the same early-stage pro-T cells. The claim conflates those populations and omits the NK-development condition. (LLM, conf=0.88)
plaindirect- Asserted: passes — The authors put it forward as true.
- Checkable: passes — It can be checked against evidence.
- Load-bearing: passes — The paper’s conclusions depend on it.
- Based: passes — The paper gives a reason why it holds.
It may state two separate claims as one.
- Partly supported
The paper states this without a source or data behind it here, so there is nothing to check it against. The quote shows it is in the paper.
In the paper
“The highest confidence list of potential PU.1 target genes in pro-T cells could be defined as genes that responded reciprocally to gain and loss of PU.1 function within the same DN2a-DN2b developmental interval, and these genes are listed in Table 1.”
§ Mechanisms of Action of Hematopoietic Transcription Factor PU.1 in Initiation of T-Cell Development > Defining the PU.1 Regulome in Early T-cell Precursors > Kinetic Challenges: Protein Half-Lives vs. Developmental Progression
hedgedcorrelational- Asserted: passes — The authors put it forward as true.
- Checkable: passes — It can be checked against evidence.
- Load-bearing: passes — The paper’s conclusions depend on it.
- Based: passes — The paper gives a reason why it holds.
Probably not a substantial claim.
A result the paper reports from its own data — it cites no other source for it, so there is none to check. The quote shows it is in the paper.
In the paper
“Genes responding to the addition of exogenous PU.1 usually had the exogenous PU.1 binding to distal (intronic or neighboring intergenic) sites, whereas genes that had PU.1 binding only to their promoter regions usually did not change expression at all.”
§ Mechanisms of Action of Hematopoietic Transcription Factor PU.1 in Initiation of T-Cell Development > PU.1 Action via Cofactor Recruitment > Direct Gene Regulation by PU.1: Activation by Distal Enhancer Engagement and Opening
plaincorrelational- Asserted: passes — The authors put it forward as true.
- Checkable: passes — It can be checked against evidence.
- Load-bearing: passes — The paper’s conclusions depend on it.
- Based: passes — The paper gives a reason why it holds.
It may state two separate claims as one.
The paper states this without a source or data behind it here, so there is nothing to check it against. The quote shows it is in the paper.
In the paper
“They also begin to express multiple transcription factors of the Egr and IRF families, and in the case of primary cells, they also upregulate C/EBP family factors.”
§ Mechanisms of Action of Hematopoietic Transcription Factor PU.1 in Initiation of T-Cell Development > PU.1 Action via Cofactor Recruitment > The Problem of Pro-T Cell Gene Repression by PU.1
plaindirect- Asserted: passes — The authors put it forward as true.
- Checkable: passes — It can be checked against evidence.
- Load-bearing: passes — The paper’s conclusions depend on it.
- Based: passes — The paper gives a reason why it holds.
It may state two separate claims as one.
A result the paper reports from its own data — it cites no other source for it, so there is none to check. The quote shows it is in the paper.
In the paper
“In the “blank slate” background of the Scid.adh.2C2 cell line, exogenous PU.1 binding opened chromatin at its non-promoter sites within 2 h, increasing the “activating” H3K27Ac marks at these sites a few hours later, and the linked genes were predominantly upregulated within 8–24 h.”
§ Mechanisms of Action of Hematopoietic Transcription Factor PU.1 in Initiation of T-Cell Development > PU.1 Action via Cofactor Recruitment > Direct Gene Regulation by PU.1: Activation by Distal Enhancer Engagement and Opening
plaindirect- Asserted: passes — The authors put it forward as true.
- Checkable: passes — It can be checked against evidence.
- Load-bearing: passes — The paper’s conclusions depend on it.
- Based: passes — The paper gives a reason why it holds.
It may state two separate claims as one.
A result the paper reports from its own data — it cites no other source for it, so there is none to check. The quote shows it is in the paper.
In the paper
“In the aggregate, most of the responses of genes linked directly to PU.1 binding sites were positive; direct repression targets were much rarer.”
§ Mechanisms of Action of Hematopoietic Transcription Factor PU.1 in Initiation of T-Cell Development > PU.1 Action via Cofactor Recruitment > Direct Gene Regulation by PU.1: Activation by Distal Enhancer Engagement and Opening
plaincorrelational- Asserted: passes — The authors put it forward as true.
- Checkable: passes — It can be checked against evidence.
- Load-bearing: passes — The paper’s conclusions depend on it.
- Based: passes — The paper gives a reason why it holds.
It may state two separate claims as one.
A result the paper reports from its own data — it cites no other source for it, so there is none to check. The quote shows it is in the paper.
In the paper
“Potentially important clues to PU.1 roles are the prominence among positively regulated PU.1 targets of genes encoding specific cytokine receptors not yet studied in T-cell biology (e.g., Pdgfrb); multiple protein tyrosine kinases (Btk, Syk, Hck, Lyn); and G-protein coupled receptors (Ffar2, P2ry13, P2ry14) and G protein signaling mediators (Gng2 and Rgs18); while PU.1 represses other G protein s”
§ Mechanisms of Action of Hematopoietic Transcription Factor PU.1 in Initiation of T-Cell Development > The PU.1 Regulome in Early pro-T cells and Its physiological Roles > PU.1 as a Choreographer of Thymocyte Cell Biology
hedgeddirect- Asserted: passes — The authors put it forward as true.
- Checkable: passes — It can be checked against evidence.
- Load-bearing: passes — The paper’s conclusions depend on it.
- Based: passes — The paper gives a reason why it holds.
It may state two separate claims as one.
The paper states this without a source or data behind it here, so there is nothing to check it against. The quote shows it is in the paper.
In the paper
“Hes1, Tcf12 (HEB), Ets1, and Lef1 are strongly affected in cells making a lineage switch, but none of these are measurably repressed in cells within the T-cell path.”
§ Mechanisms of Action of Hematopoietic Transcription Factor PU.1 in Initiation of T-Cell Development > The PU.1 Regulome in Early pro-T cells and Its physiological Roles > PU.1 Target Genes: Gene Network Roles and Developmental Timing
plain- Asserted: passes — The authors put it forward as true.
- Checkable: passes — It can be checked against evidence.
- Load-bearing: passes — The paper’s conclusions depend on it.
- Based: passes — The paper gives a reason why it holds.
It may state two separate claims as one.
A result the paper reports from its own data — it cites no other source for it, so there is none to check. The quote shows it is in the paper.
In the paper
“In addition, PU.1 directly promotes expression of cell surface molecules (CD33, CD34, CD44) used as markers for stages in early T-cell development, but which in vivo work to mediate environmental interactions, and it drives expression of adhesion molecules (integrins and Siglecs) as well as cytoskeletal components such as Coro2a and Myo1f.”
§ Mechanisms of Action of Hematopoietic Transcription Factor PU.1 in Initiation of T-Cell Development > The PU.1 Regulome in Early pro-T cells and Its physiological Roles > PU.1 as a Choreographer of Thymocyte Cell Biology
plaindirect- Asserted: passes — The authors put it forward as true.
- Checkable: passes — It can be checked against evidence.
- Load-bearing: passes — The paper’s conclusions depend on it.
- Based: passes — The paper gives a reason why it holds.
It may state two separate claims as one.
The paper states this without a source or data behind it here, so there is nothing to check it against. The quote shows it is in the paper.
In the paper
“It is a lineage-specifying transcription factor that positively regulates many genes in the macrophage, granulocyte, dendritic-cell and B-cell lineages.”
§ Mechanisms of Action of Hematopoietic Transcription Factor PU.1 in Initiation of T-Cell Development > Introduction > PU.1 Expression in Precursors of T Cells
plaindirect- Asserted: passes — The authors put it forward as true.
- Checkable: passes — It can be checked against evidence.
- Load-bearing: fails — The paper’s conclusions may not depend on it.
- Based: passes — The paper gives a reason why it holds.
Probably not a substantial claim. The paper’s conclusions may not depend on it. It may state two separate claims as one.
The paper states this without a source or data behind it here, so there is nothing to check it against. The quote shows it is in the paper.
In the paper
“Thus, B, NK, and T cell development are all affected by defects in PU.1 activity, despite partial complementation by the related factor SpiB”
§ Mechanisms of Action of Hematopoietic Transcription Factor PU.1 in Initiation of T-Cell Development > Introduction > PU.1 Expression in Precursors of T Cells
plaindirect- Asserted: passes — The authors put it forward as true.
- Checkable: passes — It can be checked against evidence.
- Load-bearing: unclear — It is unclear whether the paper’s conclusions depend on it.
- Based: passes — The paper gives a reason why it holds.
It may state two separate claims as one.
In the paper
“the downregulation of PU.1 is important to avoid malignancy in human T cells: a specifically aggressive class of human T-acute lymphoblastic leukemias results from translocations that promote abnormally sustained and elevated PU.1 expression (38).”
§ Mechanisms of Action of Hematopoietic Transcription Factor PU.1 in Initiation of T-Cell Development > Introduction > PU.1 Expression in Precursors of T Cells
What the sources say
- Not checked — no full text of the sourcecites [38] Seki, 2017, Recurrent SPI1 (PU.1) fusions in high-risk pediatric T cell acute lymphoblastic leukemia source
plaindirect- Asserted: passes — The authors put it forward as true.
- Checkable: passes — It can be checked against evidence.
- Load-bearing: unclear — It is unclear whether the paper’s conclusions depend on it.
- Based: passes — The paper gives a reason why it holds.
It may state two separate claims as one.
The paper states this without a source or data behind it here, so there is nothing to check it against. The quote shows it is in the paper.
In the paper
“PU.1, encoded by the Spi1 gene, is an ETS-family transcription factor with multiple roles in hematopoiesis.”
§ Mechanisms of Action of Hematopoietic Transcription Factor PU.1 in Initiation of T-Cell Development > Introduction > PU.1 Expression in Precursors of T Cells
plain- Asserted: passes — The authors put it forward as true.
- Checkable: passes — It can be checked against evidence.
- Load-bearing: fails — The paper’s conclusions may not depend on it.
- Based: passes — The paper gives a reason why it holds.
Probably not a substantial claim. The paper’s conclusions may not depend on it. It may state two separate claims as one.
A conclusion the paper draws from its own results — it cites no other source for it, so there is none to check. The quote shows it is in the paper.
In the paper
“It slows developmental progression of pro-T cells even as it supports their early proliferation.”
§ Mechanisms of Action of Hematopoietic Transcription Factor PU.1 in Initiation of T-Cell Development > Effects of PU.1 Loss on T-cell Development: the Cellular View > PU.1 Promotes Proliferation While Slowing Differentiation of Pro-T Cells
plaindirect- Asserted: passes — The authors put it forward as true.
- Checkable: passes — It can be checked against evidence.
- Load-bearing: passes — The paper’s conclusions depend on it.
- Based: passes — The paper gives a reason why it holds.
It may state two separate claims as one.
A conclusion the paper draws from its own results — it cites no other source for it, so there is none to check. The quote shows it is in the paper.
In the paper
“The effect of PU.1 on proliferation is conditional and dose-dependent, however.”
§ Mechanisms of Action of Hematopoietic Transcription Factor PU.1 in Initiation of T-Cell Development > Effects of PU.1 Loss on T-cell Development: the Cellular View > PU.1 Promotes Proliferation While Slowing Differentiation of Pro-T Cells
plainconditional- Asserted: passes — The authors put it forward as true.
- Checkable: passes — It can be checked against evidence.
- Load-bearing: passes — The paper’s conclusions depend on it.
- Based: passes — The paper gives a reason why it holds.
It may state two separate claims as one.
What the paper did — it cites no source for this, so there is none to check. The quote shows it is in the paper.
In the paper
“If timepoints are taken too long after deletion, the controls progress to the point when endogenous PU.1 is downregulated, so that any truly PU.1-dependent targets are expressed weakly in the controls, and comparisons with the knockout samples again lose statistical power.”
§ Mechanisms of Action of Hematopoietic Transcription Factor PU.1 in Initiation of T-Cell Development > Defining the PU.1 Regulome in Early T-cell Precursors > Kinetic Challenges: Protein Half-Lives vs. Developmental Progression
plaindirect- Asserted: passes — The authors put it forward as true.
- Checkable: passes — It can be checked against evidence.
- Load-bearing: passes — The paper’s conclusions depend on it.
- Based: passes — The paper gives a reason why it holds.
It may state two separate claims as one.
A conclusion the paper draws from its own results — it cites no other source for it, so there is none to check. The quote shows it is in the paper.
In the paper
“Thus, the effect of PU.1 expression per se may be part of the normal T-cell program, but under high-level expression conditions it combines with additional, conditionally induced mechanisms to produce a much broader spectrum of developmental effects that may not only be direct responses to PU.1 itself.”
§ Mechanisms of Action of Hematopoietic Transcription Factor PU.1 in Initiation of T-Cell Development > Defining the PU.1 Regulome in Early T-cell Precursors > Developmental Challenges: Implications of a Gene Regulatory Network Switch
hedgedconditional- Asserted: passes — The authors put it forward as true.
- Checkable: passes — It can be checked against evidence.
- Load-bearing: passes — The paper’s conclusions depend on it.
- Based: passes — The paper gives a reason why it holds.
It may state two separate claims as one.
The paper states this without a source or data behind it here, so there is nothing to check it against. The quote shows it is in the paper.
In the paper
“Cre-dependent deletion of a loxP-flanked Spi1 allele (Spi1fl.fl) is asynchronous, and in an early T-cell population with mixed degrees of Spi1 deletion, cells with inadequate PU.1 levels appear to be at a selective disadvantage, even in vitro.”
§ Mechanisms of Action of Hematopoietic Transcription Factor PU.1 in Initiation of T-Cell Development > Defining the PU.1 Regulome in Early T-cell Precursors > Kinetic Challenges: Protein Half-Lives vs. Developmental Progression
hedgeddirect- Asserted: passes — The authors put it forward as true.
- Checkable: passes — It can be checked against evidence.
- Load-bearing: passes — The paper’s conclusions depend on it.
- Based: passes — The paper gives a reason why it holds.
It may state two separate claims as one.
A result the paper reports from its own data — it cites no other source for it, so there is none to check. The quote shows it is in the paper.
In the paper
“In newly-committed primary pro-T cells forced to express PU.1, the cells crossing this developmental boundary are seen to downregulate the Notch-dependent DN2/DN3 stage marker, CD25 (Il2ra), and often upregulate the myeloid-associated marker CD11b (Mac1; Itgam).”
§ Mechanisms of Action of Hematopoietic Transcription Factor PU.1 in Initiation of T-Cell Development > Defining the PU.1 Regulome in Early T-cell Precursors > Developmental Challenges: Implications of a Gene Regulatory Network Switch
plaindirect- Asserted: passes — The authors put it forward as true.
- Checkable: passes — It can be checked against evidence.
- Load-bearing: passes — The paper’s conclusions depend on it.
- Based: passes — The paper gives a reason why it holds.
It may state two separate claims as one.
What the paper did — it cites no source for this, so there is none to check. The quote shows it is in the paper.
In the paper
“While this list under-represents some PU.1 targets that are only expressed in ETP stage”
§ Mechanisms of Action of Hematopoietic Transcription Factor PU.1 in Initiation of T-Cell Development > Defining the PU.1 Regulome in Early T-cell Precursors > Kinetic Challenges: Protein Half-Lives vs. Developmental Progression
plain- Asserted: passes — The authors put it forward as true.
- Checkable: passes — It can be checked against evidence.
- Load-bearing: fails — The paper’s conclusions may not depend on it.
- Based: passes — The paper gives a reason why it holds.
Probably not a substantial claim. The paper’s conclusions may not depend on it.
What the paper did — it cites no source for this, so there is none to check. The quote shows it is in the paper.
In the paper
“The strongest evidence for specific physiological PU.1 effects therefore comes from the consensus results from two or more of these perturbation systems.”
§ Mechanisms of Action of Hematopoietic Transcription Factor PU.1 in Initiation of T-Cell Development > Defining the PU.1 Regulome in Early T-cell Precursors > Kinetic Challenges: Protein Half-Lives vs. Developmental Progression
boostedcorrelational- Asserted: passes — The authors put it forward as true.
- Checkable: passes — It can be checked against evidence.
- Load-bearing: passes — The paper’s conclusions depend on it.
- Based: passes — The paper gives a reason why it holds.
Probably not a substantial claim.
A conclusion the paper draws from its own results — it cites no other source for it, so there is none to check. The quote shows it is in the paper.
In the paper
“rigorous definition of the genes that are directly regulated by PU.1 in pro-T cells has made it possible to investigate the range of mechanisms used by the PU.1 protein to exert these transcriptional effects.”
§ Mechanisms of Action of Hematopoietic Transcription Factor PU.1 in Initiation of T-Cell Development > Defining the PU.1 Regulome in Early T-cell Precursors > Kinetic Challenges: Protein Half-Lives vs. Developmental Progression
plaindirect- Asserted: passes — The authors put it forward as true.
- Checkable: passes — It can be checked against evidence.
- Load-bearing: passes — The paper’s conclusions depend on it.
- Based: passes — The paper gives a reason why it holds.
Probably not a substantial claim.
A conclusion the paper draws from its own results — it cites no other source for it, so there is none to check. The quote shows it is in the paper.
In the paper
“It is possible that the fast downregulation of Notch response genes, including Hes1, Nrarp, Dtx1, Lef1, and Il2ra, by overexpressed PU.1 is due to the loss of positive Notch signaling input rather than to a gene-specific mechanism.”
§ Mechanisms of Action of Hematopoietic Transcription Factor PU.1 in Initiation of T-Cell Development > PU.1 Action via Cofactor Recruitment > The Problem of Pro-T Cell Gene Repression by PU.1
hedgedconditional- Asserted: passes — The authors put it forward as true.
- Checkable: passes — It can be checked against evidence.
- Load-bearing: fails — The paper’s conclusions may not depend on it.
- Based: passes — The paper gives a reason why it holds.
Probably not a substantial claim. The paper’s conclusions may not depend on it.
A conclusion the paper draws from its own results — it cites no other source for it, so there is none to check. The quote shows it is in the paper.
In the paper
“This Notch-inhibitory mechanism is not operating in cells that remain within the T-cell pathway, but it becomes prominent in cells that PU.1 causes to transdifferentiate, and would be expected to affect all T-cell genes that use Notch signaling as an obligate positive input, whether or not PU.1 binds them directly.”
§ Mechanisms of Action of Hematopoietic Transcription Factor PU.1 in Initiation of T-Cell Development > PU.1 Action via Cofactor Recruitment > The Problem of Pro-T Cell Gene Repression by PU.1
hedgeddirect- Asserted: passes — The authors put it forward as true.
- Checkable: passes — It can be checked against evidence.
- Load-bearing: passes — The paper’s conclusions depend on it.
- Based: passes — The paper gives a reason why it holds.
It may state two separate claims as one.
None of the sources cited for this claim have been checked yet.
In the paper
“Data from multiple studies show that PU.1 regulates a subset of developmental control genes but is not alone in its actions.”
§ Mechanisms of Action of Hematopoietic Transcription Factor PU.1 in Initiation of T-Cell Development > The PU.1 Regulome in Early pro-T cells and Its physiological Roles > PU.1 Target Genes: Gene Network Roles and Developmental Timing
plaindirect- Asserted: passes — The authors put it forward as true.
- Checkable: passes — It can be checked against evidence.
- Load-bearing: passes — The paper’s conclusions depend on it.
- Based: passes — The paper gives a reason why it holds.
It may state two separate claims as one.
A claim is checked only against the cited paper’s full text, never its abstract, and none is available for its sources.
In the paper
“The PU.1-high stages of thymocyte development are relatively obscure in the context of the whole thymus, yet their accurate regulation is crucial for establishment of immune system homeostasis and avoidance of leukemia (125, 126).”
§ Mechanisms of Action of Hematopoietic Transcription Factor PU.1 in Initiation of T-Cell Development > The PU.1 Regulome in Early pro-T cells and Its physiological Roles > PU.1 as a Choreographer of Thymocyte Cell Biology
What the sources say
- Not checked — no full text of the sourcecites [125] Goldschneider, 2006, Cyclical mobilization and gated importation of thymocyte progenitors in the adult mouse: evidence for a thymus-bone marrow feedback loop source
- Not checked — no full text of the sourcecites [126] Martins, 2014, Cell competition is a tumour suppressor mechanism in the thymus source
plaindirect- Asserted: passes — The authors put it forward as true.
- Checkable: passes — It can be checked against evidence.
- Load-bearing: passes — The paper’s conclusions depend on it.
- Based: passes — The paper gives a reason why it holds.
It may state two separate claims as one.
A conclusion the paper draws from its own results — it cites no other source for it, so there is none to check. The quote shows it is in the paper.
In the paper
“Thus, within the T-cell pathway, PU.1 has a specific role in promoting maintenance of certain Phase 1 regulatory genes before commitment, but little role in repressing T-cell differentiation regulators directly.”
§ Mechanisms of Action of Hematopoietic Transcription Factor PU.1 in Initiation of T-Cell Development > The PU.1 Regulome in Early pro-T cells and Its physiological Roles > PU.1 Target Genes: Gene Network Roles and Developmental Timing
plaindirect- Asserted: passes — The authors put it forward as true.
- Checkable: passes — It can be checked against evidence.
- Load-bearing: passes — The paper’s conclusions depend on it.
- Based: passes — The paper gives a reason why it holds.
It may state two separate claims as one.
The paper states this without a source or data behind it here, so there is nothing to check it against. The quote shows it is in the paper.
In the paper
“With respect to PU.1-mediated repression, some T-cell factors are already upregulated while PU.1 is still highly expressed (GATA-3, TCF-1, and the Notch target Hes1), but others are upregulated only during the period when PU.1 declines (Bcl11b, Ets1, Lef1)”
§ Mechanisms of Action of Hematopoietic Transcription Factor PU.1 in Initiation of T-Cell Development > The PU.1 Regulome in Early pro-T cells and Its physiological Roles > PU.1 Target Genes: Gene Network Roles and Developmental Timing
plaincorrelational- Asserted: passes — The authors put it forward as true.
- Checkable: passes — It can be checked against evidence.
- Load-bearing: passes — The paper’s conclusions depend on it.
- Based: passes — The paper gives a reason why it holds.
It may state two separate claims as one.
A conclusion the paper draws from its own results — it cites no other source for it, so there is none to check. The quote shows it is in the paper.
In the paper
“While dysregulated PU.1 can cause trans-differentiation to myeloid or dendritic-cell fates, endogenous PU.1 normally plays a protracted role within early T-cell development.”
§ Mechanisms of Action of Hematopoietic Transcription Factor PU.1 in Initiation of T-Cell Development > Conclusions and Future Questions
plaindirect- Asserted: passes — The authors put it forward as true.
- Checkable: passes — It can be checked against evidence.
- Load-bearing: passes — The paper’s conclusions depend on it.
- Based: passes — The paper gives a reason why it holds.
It may state two separate claims as one.
A conclusion the paper draws from its own results — it cites no other source for it, so there is none to check. The quote shows it is in the paper.
In the paper
“PU.1 is a broad regulator of the properties of the cells that first enter the thymus, and it helps to determine their proliferation and rate of progression to commitment after they arrive.”
§ Mechanisms of Action of Hematopoietic Transcription Factor PU.1 in Initiation of T-Cell Development > Conclusions and Future Questions
plaindirect- Asserted: passes — The authors put it forward as true.
- Checkable: passes — It can be checked against evidence.
- Load-bearing: passes — The paper’s conclusions depend on it.
- Based: passes — The paper gives a reason why it holds.
It may state two separate claims as one.
The paper states this without a source or data behind it here, so there is nothing to check it against. The quote shows it is in the paper.
In the paper
“The first-wave precursor cells, also uniquely, enter the thymus by a different route than all subsequent waves. Instead of entering through the blood vessels near the cortical-medullary junction, these early cells migrate through cervical-region mesenchyme to the thymic anlage before it is vascularized.”
§ Mechanisms of Action of Hematopoietic Transcription Factor PU.1 in Initiation of T-Cell Development > PU.1 and the Regulation of Lymphoid Development in Ontogeny
plain- Asserted: passes — The authors put it forward as true.
- Checkable: passes — It can be checked against evidence.
- Load-bearing: unclear — It is unclear whether the paper’s conclusions depend on it.
- Based: passes — The paper gives a reason why it holds.
It may state two separate claims as one.
A conclusion the paper draws from its own results — it cites no other source for it, so there is none to check. The quote shows it is in the paper.
In the paper
“Its target genes are occasionally repressed but mostly activated by PU.1 binding, and they confer on the cells distinctive stage-specific transcription factor expression patterns as well as a rich array of stage-specific cell biological features that await proper functional analysis.”
§ Mechanisms of Action of Hematopoietic Transcription Factor PU.1 in Initiation of T-Cell Development > Conclusions and Future Questions
plaindirect- Asserted: passes — The authors put it forward as true.
- Checkable: passes — It can be checked against evidence.
- Load-bearing: passes — The paper’s conclusions depend on it.
- Based: passes — The paper gives a reason why it holds.
It may state two separate claims as one.
In the paper
“Because of the extreme rarity of these very immature cells relative to the later-stage thymocytes at any given time, they were almost impossible to study in depth before the development of in vitro culture systems (88), which have continued to be informative to the present.”
§ Mechanisms of Action of Hematopoietic Transcription Factor PU.1 in Initiation of T-Cell Development > The PU.1 Regulome in Early pro-T cells and Its physiological Roles > PU.1 as a Choreographer of Thymocyte Cell Biology
What the sources say
- Not checked — no full text of the sourcecites [88] Schmitt, 2002, Induction of T cell development from hematopoietic progenitor cells by Delta-like-1 in vitro source
plaindirect- Asserted: passes — The authors put it forward as true.
- Checkable: passes — It can be checked against evidence.
- Load-bearing: fails — The paper’s conclusions may not depend on it.
- Based: passes — The paper gives a reason why it holds.
Probably not a substantial claim. The paper’s conclusions may not depend on it.
A conclusion the paper draws from its own results — it cites no other source for it, so there is none to check. The quote shows it is in the paper.
In the paper
“Thus, not only is the first-wave fetal program less dependent on PU.1, but also it may rely on relatively low PU.1 activity for its very distinctiveness.”
§ Mechanisms of Action of Hematopoietic Transcription Factor PU.1 in Initiation of T-Cell Development > PU.1 and the Regulation of Lymphoid Development in Ontogeny
hedgedconditional- Asserted: passes — The authors put it forward as true.
- Checkable: passes — It can be checked against evidence.
- Load-bearing: passes — The paper’s conclusions depend on it.
- Based: passes — The paper gives a reason why it holds.
It may state two separate claims as one.
A conclusion the paper draws from its own results — it cites no other source for it, so there is none to check. The quote shows it is in the paper.
In the paper
“This positive regulatory role is one result of PU.1's strong pattern of binding across the genome, its prominent occupancy of open chromatin sites, and the evidence that it helps to maintain the open chromatin states at bound regulatory sites as long as it is expressed.”
§ Mechanisms of Action of Hematopoietic Transcription Factor PU.1 in Initiation of T-Cell Development > Conclusions and Future Questions
plaindirect- Asserted: passes — The authors put it forward as true.
- Checkable: passes — It can be checked against evidence.
- Load-bearing: passes — The paper’s conclusions depend on it.
- Based: passes — The paper gives a reason why it holds.
It may state two separate claims as one.
A conclusion the paper draws from its own results — it cites no other source for it, so there is none to check. The quote shows it is in the paper.
In the paper
“These results therefore support a role for PU.1 in delaying differentiation in order to allow more extended proliferation before commitment, showing how the importance of this role is ontogenically scaled to the needs of the developing organism.”
§ Mechanisms of Action of Hematopoietic Transcription Factor PU.1 in Initiation of T-Cell Development > PU.1 and the Regulation of Lymphoid Development in Ontogeny
plaindirect- Asserted: passes — The authors put it forward as true.
- Checkable: passes — It can be checked against evidence.
- Load-bearing: passes — The paper’s conclusions depend on it.
- Based: passes — The paper gives a reason why it holds.
It may state two separate claims as one.
A conclusion the paper draws from its own results — it cites no other source for it, so there is none to check. The quote shows it is in the paper.
In the paper
“Thus, postnatal thymocytes and any in vitro differentiation cultures seeded with cells from bone marrow or fetal liver from E15 onward are likely to come from true stem cell origins.”
§ Mechanisms of Action of Hematopoietic Transcription Factor PU.1 in Initiation of T-Cell Development > PU.1 and the Regulation of Lymphoid Development in Ontogeny
hedgedcorrelational- Asserted: passes — The authors put it forward as true.
- Checkable: passes — It can be checked against evidence.
- Load-bearing: unclear — It is unclear whether the paper’s conclusions depend on it.
- Based: passes — The paper gives a reason why it holds.
It may state two separate claims as one.
A conclusion the paper draws from its own results — it cites no other source for it, so there is none to check. The quote shows it is in the paper.
In the paper
“The tests of PU.1 function in these early pro-T cells that have been done so far present the cells with Notch ligands and cytokines, but could be fundamentally lacking in other molecules presented by the normal thymic environment.”
§ Mechanisms of Action of Hematopoietic Transcription Factor PU.1 in Initiation of T-Cell Development > The PU.1 Regulome in Early pro-T cells and Its physiological Roles > PU.1 as a Choreographer of Thymocyte Cell Biology
hedged- Asserted: passes — The authors put it forward as true.
- Checkable: passes — It can be checked against evidence.
- Load-bearing: fails — The paper’s conclusions may not depend on it.
- Based: passes — The paper gives a reason why it holds.
Probably not a substantial claim. The paper’s conclusions may not depend on it.
In the paper
“The cells used for in vitro differentiation as well as in vivo analysis in the work reviewed above have all been derived from waves of hematopoiesis that begin with definitive hematopoietic stem cells, which first appear in the mouse fetal liver by about day 11.5 of gestation and may be followed by additional stem-cell waves through the end of gestation (day 20) (131).”
§ Mechanisms of Action of Hematopoietic Transcription Factor PU.1 in Initiation of T-Cell Development > PU.1 and the Regulation of Lymphoid Development in Ontogeny
What the sources say
- Not checked — no full text of the sourcecites [131] Dzierzak, 2008, Of lineage and legacy: the development of mammalian hematopoietic stem cells source
hedged- Asserted: passes — The authors put it forward as true.
- Checkable: passes — It can be checked against evidence.
- Load-bearing: unclear — It is unclear whether the paper’s conclusions depend on it.
- Based: passes — The paper gives a reason why it holds.
It may state two separate claims as one.
A claim is checked only against the cited paper’s full text, never its abstract, and none is available for its sources.
In the paper
“The first wave of T cell development in the fetus is now thought to arise from these non-stem-cell precursors in the yolk sac (132, 133).”
§ Mechanisms of Action of Hematopoietic Transcription Factor PU.1 in Initiation of T-Cell Development > PU.1 and the Regulation of Lymphoid Development in Ontogeny
What the sources say
- Not checked — no full text of the sourcecites [132] Yoshimoto, 2012, Autonomous murine T-cell progenitor production in the extra-embryonic yolk sac before HSC emergence source
- Not checked — no full text of the sourcecites [133] Ramond, 2014, Two waves of distinct hematopoietic progenitor cells colonize the fetal thymus source
hedgeddirect- Asserted: passes — The authors put it forward as true.
- Checkable: passes — It can be checked against evidence.
- Load-bearing: fails — The paper’s conclusions may not depend on it.
- Based: passes — The paper gives a reason why it holds.
Probably not a substantial claim. The paper’s conclusions may not depend on it.
A conclusion the paper draws from its own results — it cites no other source for it, so there is none to check. The quote shows it is in the paper.
In the paper
“The number of genes that respond quickly to changes in PU.1 activity may only account for a minority of all the genomic sites where PU.1 is found engaged; at other sites, its role could be structural or redundant with other factors.”
§ Mechanisms of Action of Hematopoietic Transcription Factor PU.1 in Initiation of T-Cell Development > Conclusions and Future Questions
hedgedconditional- Asserted: passes — The authors put it forward as true.
- Checkable: passes — It can be checked against evidence.
- Load-bearing: passes — The paper’s conclusions depend on it.
- Based: passes — The paper gives a reason why it holds.
It may state two separate claims as one.
A conclusion the paper draws from its own results — it cites no other source for it, so there is none to check. The quote shows it is in the paper.
In the paper
“Not only are these cells intrinsically programmed to cut short the stages supported by PU.1-dependent transcriptional regulators, but also they can dispense with many of the cell biological tools that PU.1 may provide to later-wave successors to navigate the adult or late-fetal thymus.”
§ Mechanisms of Action of Hematopoietic Transcription Factor PU.1 in Initiation of T-Cell Development > PU.1 and the Regulation of Lymphoid Development in Ontogeny
plaindirect- Asserted: passes — The authors put it forward as true.
- Checkable: passes — It can be checked against evidence.
- Load-bearing: passes — The paper’s conclusions depend on it.
- Based: passes — The paper gives a reason why it holds.
It may state two separate claims as one.
A conclusion the paper draws from its own results — it cites no other source for it, so there is none to check. The quote shows it is in the paper.
In the paper
“The system-wide impact of PU.1 on other factors suggests that in scenarios where PU.1 is absent, the same T-cell transcription factors might initially choose different binding sites.”
§ Mechanisms of Action of Hematopoietic Transcription Factor PU.1 in Initiation of T-Cell Development > Conclusions and Future Questions
hedgedconditional- Asserted: passes — The authors put it forward as true.
- Checkable: passes — It can be checked against evidence.
- Load-bearing: passes — The paper’s conclusions depend on it.
- Based: passes — The paper gives a reason why it holds.
Probably not a substantial claim.
The paper states this without a source or data behind it here, so there is nothing to check it against. The quote shows it is in the paper.
In the paper
“Hematopoietic progenitors express PU.1 before they enter the thymus, but the pattern of its occupancy is not well defined at that stage, so the onset of PU.1's pioneering activity in precursors that will eventually generate T cells is not easy to study.”
§ Mechanisms of Action of Hematopoietic Transcription Factor PU.1 in Initiation of T-Cell Development > Conclusions and Future Questions
plain- Asserted: passes — The authors put it forward as true.
- Checkable: passes — It can be checked against evidence.
- Load-bearing: passes — The paper’s conclusions depend on it.
- Based: passes — The paper gives a reason why it holds.
Probably not a substantial claim. It may state two separate claims as one.
The paper relies on this without support.
Developmentally potent transcription factors often transform a cell's identity by positively or negatively regulating the expression of other transcription factors.
“Developmentally potent transcription factors often transform a cell's identity by positively or negatively regulating the expression of other transcription factors.”
Claims other papers make about this one
Each is checked against this paper’s own text: does it say what the citing paper says it does?
The source backs part of the claim, not all of it — or backs it for a different population, condition or comparison.
In the citing paper
“PU.1, a non-canonical pioneer transcription factor that functions as a master regulator of myeloid and lymphoid lineage differentiation18–20.”
From Lymphoid gene expression supports neuroprotective microglia function (2025) · cites this paper as [19]
Experimental — accuracy not yet measuredThe source backs part of the claim, not all of it — or backs it for a different population, condition or comparison.
In the citing paper
“PU.1 plays an important role in early T cell development, while in healthy adults, PU.1-directed actions are largely restricted to the myeloid and B cell compartment [11].”
From Ectopic PU.1 Expression Provides Chimeric Antigen Receptor (CAR) T Cells with Innate Cell Capacities Including IFN-β Release (2024) · cites this paper as [11]
Experimental — accuracy not yet measured
Citations
Cites
Heinz, S., Benner, C., Spann, N., Bertolino, E., Lin, Y. C., Laslo, P., Cheng, J. X., Murre, C., Singh, H., & Glass, C. K. (2010) · Molecular Cell · doi:10.1016/j.molcel.2010.05.004 · Cited by 13,382 · cited 1×
“1 binding partners are not the same in early T-cell precursors as in myeloid cells or B lineage cells (13, 80, 84, 85), a similar situation to its early role in erythroblasts (86).”
ResultBuenrostro, J. D., Giresi, P. G., Zaba, L. C., Chang, H. Y., & Greenleaf, W. J. (2013) · Nature Methods · doi:10.1038/nmeth.2688 · Cited by 6,422 · cited 1×
“1 binds are enriched for open chromatin as defined by DNase accessibility or ATAC-seq [assay of transposase-accessible chromatin (94)], and circumstantial evidence suggests that PU.”
BackgroundTranscription factors: from enhancer binding to developmental control
Spitz, F., & Furlong, E. E. M. (2012) · Nature Reviews Genetics · doi:10.1038/nrg3207 · Cited by 2,227
CRISPR-Cas9 Knockin Mice for Genome Editing and Cancer Modeling
Platt, R. J., Chen, S., Zhou, Y., Yim, M. J., Swiech, L., Kempton, H. R., Dahlman, J. E., Parnas, O., Eisenhaure, T. M., Jovanovic, M., et al. (2014) · Cell · doi:10.1016/j.cell.2014.09.014 · Cited by 2,001 · cited 1×
“Cas9-dependent acute deletion of the Spi1 locus can be fast and highly efficient due to the availability of Cas9-transgenicmice (92) and vectors that can be used for high-level, synchronous expression of guide RNAs.”
BackgroundThe Immunological Genome Project: networks of gene expression in immune cells
The Immunological Genome Project Consortium, Heng, T. S. P., Painter, M. W., Elpek, K., Lukacs-Kornek, V., Mauermann, N., Turley, S. J., Koller, D., Kim, F. S., Wagers, A. J., et al. (2008) · Nature Immunology · doi:10.1038/ni1008-1091 · Cited by 1,864
Pioneer transcription factors: establishing competence for gene expression
Zaret, K. S., & Carroll, J. S. (2011) · Genes & Development · doi:10.1101/gad.176826.111 · Cited by 1,589
Requirement of transcription factor PU.1 in the development of multiple hematopoietic lineages
Scott, E. W., Simon, M. C., Anastasi, J., & Singh, H. (1994) · Science · doi:10.1126/science.8079170 · Cited by 1,532
Targeted disruption of the PU.1 gene results in multiple hematopoietic abnormalities
McKercher, S. R., Torbett, B. E., Anderson, K. L., Henkel, G. W., Vestal, D. J., Baribault, H., Klemsz, M., Feeney, A. J., Wu, G. E., Paige, C. J., et al. (1996) · The EMBO Journal · doi:10.1002/j.1460-2075.1996.tb00949.x · Cited by 1,130
Induction of T Cell Development from Hematopoietic Progenitor Cells by Delta-like-1 In Vitro
Schmitt, T. M., & Zúñiga-Pflücker, J. C. (2002) · Immunity · doi:10.1016/s1074-7613(02)00474-0 · Cited by 1,120 · cited 3×
“1 into cells at a particular developmental stage, it has proven to be very useful to exploit the powerful in vitro T-cell development systems based on coculture of primary-cell precursors on OP9-DLL1 (aka OP9DL1) or OP9-DLL4 (OP9-DL4) stroma with IL-7 and Flt3L (78, 88), or similar systems using other stromal cell lin…”
BackgroundSoufi, A., Donahue, G., & Zaret, K. S. (2012) · Cell · doi:10.1016/j.cell.2012.09.045 · Cited by 933 · cited 1×
“This is a hallmark of pioneering activity in developmental gene regulation (98, 108), but in this case it exposes a particularly intricate post-transcriptional relationship between PU.”
Background
Research works printed but not linked: 1
- Petrovick, 1998, Multiple functional domains of AML1: PU, 3915
Cited by
Sorted by citations
How transcription factors drive choice of the T cell fate
Hosokawa, H., & Rothenberg, E. V. (2020) · Nature reviews. Immunology · doi:10.1038/s41577-020-00426-6 · Cited by 250
Self-citationDeep learning of immune cell differentiation
Maslova, A., Ramírez, R. N., Ma, K., Schmutz, H., Wang, C., Fox, C., Ng, B., Benoist, C. O., Mostafavi, S., & Immunological Genome Project (2020) · Proceedings of the National Academy of Sciences · doi:10.1073/pnas.2011795117 · Cited by 103
“Such negative influence may denote a feature of the in silico learning process but may also reflect the known need for Spi1 expression to be turned off for T cell differentiation to occur (23).”
BackgroundTranscription factor PU.1 and immune cell differentiation (Review)
Li, G., Hao, W., & Hu, W. (2020) · International Journal of Molecular Medicine · doi:10.3892/ijmm.2020.4763 · Cited by 98
“…mechanisms: It not only opens chromatin and nucleates with transcriptional co‑factors, such as Satb1 and Runx1 at its binding sites to form cooperative complexes, but also competitively redistributes its co-factors, often removing them from sites where they can regulate different genes (65,66).”
Obesity-Induced Changes in Bone Marrow Homeostasis
Beňová, A., & Tencerová, M. (2020) · Frontiers in Endocrinology · doi:10.3389/fendo.2020.00294 · Cited by 102
Programming for T-lymphocyte fates: modularity and mechanismsPreprint
Rothenberg, E. V. (2019) · Genes & Development · doi:10.1101/gad.327163.119 · Cited by 75
“…also naturally express substantial levels of the myeloid transcription factor PU.1, which is not only sustained through multiple cell divisions but also plays a necessary positive role in their early development (Dakic et al. 2005; Champhekar et al. 2015; for review, see Rothenberg et al. 2019).”
BackgroundSelf-citation
Metadata
- Authors
- Rothenberg, E. V., Hosokawa, H., & Ungerbäck, J.
- Affiliations
- California Institute of Technology (US)
- Corresponding author
- Rothenberg, Ellen V.
- Venue
- Frontiers in Immunology
- Publisher
- Frontiers Media SA
- Published
- 2019-02-20
- Volume
- 10
- Pages
- 228-228
- ISSN
- 1664-3224 (ISSN-L)
- PMC
- PMC6391351
- OpenAlex
- W2915813447
- Cited by
- 99
- References
- 228
- Citations by year
- 2026: 11 · 2025: 16 · 2024: 15 · 2023: 16 · 2022: 9 · 2021: 16 · 2020: 9 · 2019: 7
- FWCI
- 3.28
- Type
- journal article
- Language
- en
- Open access
- gold
- doi.org
- Licence
- Locations
- Frontiers in Immunology (publishedVersion, cc-by)
- PubMed (publishedVersion)
- Europe PMC (PubMed Central) (submittedVersion, cc-by)
- PubMed Central (submittedVersion, cc-by)
- CaltechAUTHORS (California Institute of Technology) (submittedVersion, cc-by)
- DOAJ (DOAJ: Directory of Open Access Journals) (submittedVersion, cc-by-sa)
- Funders
- U.S. Public Health Service (R01AI095943, R01HD076915)
- Manpei Suzuki Diabetes Foundation
- Topics
- Life Sciences › Immunology and Microbiology › Immunology › T-cell and B-cell Immunology
- Life Sciences › Biochemistry, Genetics and Molecular Biology › Molecular Biology › Genomics and Chromatin Dynamics
- Life Sciences › Biochemistry, Genetics and Molecular Biology › Molecular Biology › Developmental Biology and Gene Regulation
- Keywords
- PU.1, ETS transcription factors, T cell development, pro-T cells, T cell lineage commitment, coregulator recruitment, gene regulatory networks, thymus
- MeSH terms
- Proto-Oncogene Protein Spi-1, Animals, Cell Differentiation, Hematopoiesis, Humans, Proto-Oncogene Proteins, T-Lymphocytes, Transcription, Genetic, Trans-Activators, Hematopoietic Stem Cell Transplantation, Cell Lineage, Gene Regulatory Networks
About these checks
Registry, retraction, Cites and statistics results are computed, not judged, with one exception: a printed reference that no index lists is read once by a model before it counts as a citation error. Claims are extracted by a model and kept only when their quote appears verbatim in the text; each cited source is then checked, with a model’s help, for whether it says what the claim relies on. Those verdicts can be wrong — read the claim’s quote and the cited source before relying on one.
A language model drew the claims from the paper on 2026-10-21, under version 3 of the claim definition (model deepseek-v4.1-flash, prompt extract-v3).
A second model labelled each claim on 2026-10-21 (model jev-1.13-20260917, definition revision gold-guideline-v0.2).
Cited sources are checked with a language model’s help (gpt-6-sol).
Statistics and arithmetic are recomputed, not judged.
Confidence bands are shown only for fields calibrated on our annotated test set. None is calibrated yet, so no band is shown.
What counts as a claim ›How we measure confidence ›How we check this ›
Are you an author, or do you see a problem with this page? Request a review
