

The DOI matches its Crossref record; 609 of the 609 references it cites were found in a registry or an index; 147 of the 332 sources its claims cite were checked for support.
Quantitative mapping of the brain’s structural connectivity using diffusion MRI tractography: A review
Open accessAbstract
Diffusion magnetic resonance imaging (dMRI) tractography is an advanced imaging technique that enables in vivo reconstruction of the brain's white matter connections at macro scale. It provides an important tool for quantitative mapping of the brain's structural connectivity using measures of connectivity or tissue microstructure. Over the last two decades, the study of brain connectivity using dMRI tractography has played a prominent role in the neuroimaging research landscape. In this paper, we provide a high-level overview of how tractography is used to enable quantitative analysis of the brain's structural connectivity in health and disease. We focus on two types of quantitative analyses of tractography, including: 1) tract-specific analysis that refers to research that is typically hypothesis-driven and studies particular anatomical fiber tracts, and 2) connectome-based analysis that refers to research that is more data-driven and generally studies the structural connectivity of the entire brain. We first provide a review of methodology involved in three main processing steps that are common across most approaches for quantitative analysis of tractography, including methods for tractography correction, segmentation and quantification. For each step, we aim to describe methodological choices, their popularity, and potential pros and cons. We then review studies that have used quantitative tractography approaches to study the brain's white matter, focusing on applications in neurodevelopment, aging, neurological disorders, mental disorders, and neurosurgery. We conclude that, while there have been considerable advancements in methodological technologies and breadth of applications, there nevertheless remains no consensus about the "best" methodology in quantitative analysis of tractography, and researchers should remain cautious when interpreting results in research and clinical applications.
Overview
AI snapshot
Written from the paper’s full text.
TL;DR
This review provides a high-level overview of how diffusion MRI tractography is used for quantitative mapping of brain structural connectivity, organizing methods into tractography correction, segmentation, and quantification and reviewing applications across development, aging, neurological/mental disorders, and neurosurgery. It concludes that despite methodological and application advances, there is no consensus on the “best” methodology and results should be interpreted cautiously.
Key findings
- Quantitative tractography analyses are categorized into tract-specific, hypothesis-driven analyses of named fiber tracts and connectome-based, more data-driven analyses of whole-brain structural connectivity.
- The review identifies three common processing steps—tractography correction, tractography segmentation, and tractography quantification—and discusses methodological choices, popularity, and pros/cons for each.
- In applications, the review cites developmental tractography milestones including identification of fornix and cingulum parts at 13 weeks, part of the corpus callosum at 15 weeks, and prominent radial/tangential pathways at 17 weeks; it also notes parcellation scales ranging from tens to millions of parcels, with suggestions that >2000 parcels can benefit machine learning/statistical analysis and <200 parcels can improve connectome consistency.
- The review reports no consensus on the “best” methodology for quantitative tractography analysis and emphasizes caution in biological and clinical interpretation.
Methods
- Narrative review of dMRI tractography methods and applications, not an empirical study; no original sample or dataset is analyzed.
- The methodology review is organized around three processing steps: correction of tractography biases, segmentation/identification of white matter pathways, and extraction of quantitative measures.
- The applications review covers neurodevelopment, aging, neurological disorders (with multiple sclerosis and schizophrenia as exemplars), mental disorders, and neurosurgery.
Limitations
- The paper states that there remains no consensus about the “best” methodology in quantitative tractography analysis and that researchers should remain cautious when interpreting results in research and clinical applications.
- The paper states that reconstructed streamlines are simulated entities that do not correspond directly to nerve fibers and that basic diffusion metrics are inferences from local diffusion properties rather than direct tissue measures; it also notes ongoing false-positive and false-negative anatomical accuracy issues.
- Evident from the text: as a narrative review, it does not report a systematic search strategy, inclusion criteria, or quantitative synthesis.
Model-written summary. Check it against the paper before relying on it.
Integrity signals
Registry
Cites
Statistics
Figures
Verification
Claims the paper makes
60 Partly supported · 30 No basis given · 26 Sources not found · 22 Supported · 22 No full text of the sources · 22 Own interpretation · 19 Supported so far · 12 Not checked yet · 4 Couldn’t confirm · 1 Not supported · 1 Own method · 1 Own result · accuracy not yet measured
At least one cited source doesn’t support this claim or points to a different paper, and none confirmed it — see the verdicts below.
In the paper
“Despite focusing on different developmental ranges, these studies consistently observe significant age-related increases of FA and MD in widespread fiber tracts during postnatal growth in both cross-sectional and longitudinal population designs (Lebel and Deoni, 2018).”
§ Quantitative mapping of the brain’s structural connectivity using diffusion MRI tractography: A review > Applications of quantitative tractography analysis > Developmental tractography of the brain
What the sources say
- Disputedcites Lebel and Deoni, 2018 sourceExperimental — accuracy not yet measured
Section 3.3 (Developmental Timing; page not provided) reports that FA increases with age, but MD decreases—the opposite of the claimed MD increase. It also discusses longitudinal developmental curves, so the disagreement is specifically about MD's direction of change. (LLM, conf=0.90)
Checked by a reasoning model — may be wrong.
boosteddirect- Asserted: passes — The authors put it forward as true.
- Checkable: passes — It can be checked against evidence.
- Load-bearing: unclear — It is unclear whether the paper’s conclusions depend on it.
- Based: passes — The paper gives a reason why it holds.
- Disputed
The cited sources support only part of this claim — read each source’s verdict below.
In the paper
“actually none proved effective in discriminating between true and spurious connections in the connectome networks (Maier-Hein et al., 2017; Schiavi et al., 2020a).”
§ Quantitative mapping of the brain’s structural connectivity using diffusion MRI tractography: A review > Improving tractography quality: methods for tractography correction > False positive connections
What the sources say
- Partly supportedcites Maier-Hein et al., 2017 sourceExperimental — accuracy not yet measured
The Results (‘Tractograms contained more invalid than valid bundles’; page unavailable) report that tested tractography approaches produced more invalid than valid bundles, supporting the concern about spurious connections. But the Results (‘Statistical analysis of processing steps’; page unavailable) say filtering affected performance and one clustering approach achieved 92% validly connecting streamlines. The paper therefore does not establish that no knowledge- or data-driven filtering method proved effective at discrimination. (LLM, conf=0.85)
- Not matchedcites Schiavi et al., 2020a
Couldn’t be matched to a paper in Crossref, so it can’t be checked.
plain- Asserted: passes — The authors put it forward as true.
- Checkable: passes — It can be checked against evidence.
- Load-bearing: passes — The paper’s conclusions depend on it.
- Based: passes — The paper gives a reason why it holds.
- Partly supported
The cited sources that could be checked couldn’t confirm or dispute this claim.
In the paper
“It is important to note that tractography is known to be sensitive to the choice of the underlying fiber tracking algorithms, which can further affect any subsequent quantitative analyses using the tractography data.”
§ Quantitative mapping of the brain’s structural connectivity using diffusion MRI tractography: A review > Brief introduction to tractography
What the sources say
- Could not verifycites Afzali et al., 2020 sourceExperimental — accuracy not yet measured
The Microstructure models > Effect of model fitting passage mentions combining global tractography with microstructure estimation, but does not compare fiber-tracking algorithms or their effects on analyses of tractography data. Searches for tractography and tracking algorithms found no passage in our copy addressing that specific claim; pages were not provided. (LLM, conf=0.72)
- Not checked — no full text of the sourcecites Alexander, 2006 source
- Not checked — no full text of the sourcecites Panagiotaki et al., 2012 source
boostedconditional- Asserted: passes — The authors put it forward as true.
- Checkable: passes — It can be checked against evidence.
- Load-bearing: passes — The paper’s conclusions depend on it.
- Based: passes — The paper gives a reason why it holds.
- Could not verify
The sources with a verdict support this claim; the rest weren’t checked yet, have no full text we could read, or their verdicts aren’t rated yet.
In the paper
“the Anatomically-Constrained Tractography (ACT) framework (Smith et al., 2012) and similar methods (Girard and Descoteaux, 2012; Lemkaddem et al., 2014; Yeh et al., 2017) ensure that both streamline propagation and termination are constrained based on knowledge of where neuronal fibers locate, e.g., connecting between gray matter areas via the white matter.”
- Also stated in: § Termination bias · plain
“they do prevent the generation of streamlines that cannot possibly represent biological connectivity within the brain.”
§ Quantitative mapping of the brain’s structural connectivity using diffusion MRI tractography: A review > Improving tractography quality: methods for tractography correction > Termination bias
What the sources say
- Not checked — no full text of the sourcecites Smith et al., 2012 source
- Not matchedcites Girard and Descoteaux, 2012
Couldn’t be matched to a paper in Crossref, so it can’t be checked.
- Supportedcites Lemkaddem et al., 2014 source
The Introduction states that the method places fiber endpoints in gray matter and constrains the remaining spline control points to white matter. The Methods section says it filters out fibers ending prematurely in white matter because they do not represent anatomically valid connections. These passages support the claim about anatomically constrained paths and termination. (LLM, conf=0.88)
plaindirect- Asserted: passes — The authors put it forward as true.
- Checkable: passes — It can be checked against evidence.
- Load-bearing: passes — The paper’s conclusions depend on it.
- Based: passes — The paper gives a reason why it holds.
- Also stated in: § Termination bias · plain
The cited sources support only part of this claim — read each source’s verdict below.
In the paper
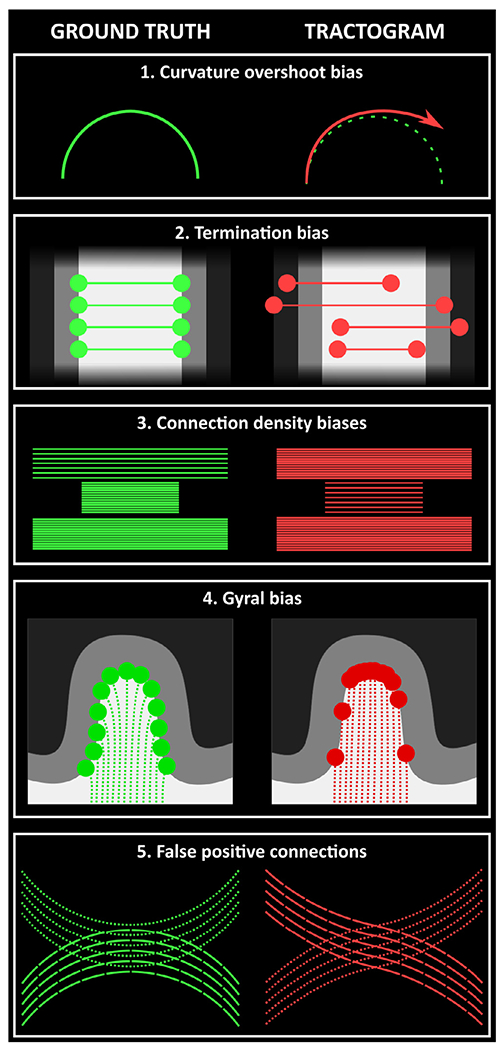
“Possibly the earliest bias established for dMRI tractography was the fact that if the streamline algorithm simply takes a step of finite size in the direction of the local fiber orientation at the current vertex (a so-called “first-order” method), streamlines in curved bundles will tend to under-estimate the curvature, resulting in erroneous trajectories (Tournier et al., 2002).”
§ Quantitative mapping of the brain’s structural connectivity using diffusion MRI tractography: A review > Improving tractography quality: methods for tractography correction > Curvature overshoot bias
What the sources say
- Partly supportedcites Tournier et al., 2002 sourceExperimental — accuracy not yet measured
The Tracking Algorithm section describes finite steps taken in the local major-eigenvector direction. Model A reports that larger steps increase endpoint offset and that tracks can depart systematically from an ideal curved path, especially without interpolation. The copy does not establish the claimed direction of the bias—that these tracks tend to underestimate curvature. (LLM, conf=0.85)
hedgeddirect- Asserted: passes — The authors put it forward as true.
- Checkable: passes — It can be checked against evidence.
- Load-bearing: unclear — It is unclear whether the paper’s conclusions depend on it.
- Based: passes — The paper gives a reason why it holds.
- Partly supported
The cited sources support only part of this claim — read each source’s verdict below.
In the paper
“In particular, it has been shown that tractography techniques suffer from a large number of false positives, i.e., streamlines that are reconstructed but do not correspond to real anatomical bundles”
§ Quantitative mapping of the brain’s structural connectivity using diffusion MRI tractography: A review > Improving tractography quality: methods for tractography correction > False positive connections
What the sources say
- Supportedcites Maier-Hein et al., 2017 source
The Results section (“Tractograms contained more invalid than valid bundles”) reports that 36 ± 17% of reconstructed streamlines connected regions not connected in the ground truth, and that invalid bundles outnumbered valid bundles. The Introduction likewise says most evaluated algorithms produced large amounts of false-positive bundles. (LLM, conf=0.92)
- Partly supportedcites Thomas et al., 2014 sourceExperimental — accuracy not yet measured
The Discussion (page unavailable) reports that high-sensitivity tractography tends to have a high false-positive rate, supporting the concern about reconstructed pathways without anatomical support. But the paper evaluates false positives by anatomical region, not by counting individual streamlines, and says some methods and settings can achieve much lower false-positive rates. The claim overgeneralizes those findings to tractography techniques as a whole. (LLM, conf=0.85)
boosted- Asserted: passes — The authors put it forward as true.
- Checkable: passes — It can be checked against evidence.
- Load-bearing: passes — The paper’s conclusions depend on it.
- Based: passes — The paper gives a reason why it holds.
- Supported
The cited sources support only part of this claim — read each source’s verdict below.
In the paper
“and that these erroneous connections can severely bias the estimation of connectivity (Drakesmith et al., 2015; Maier-Hein et al., 2017; Zalesky et al., 2016b).”
§ Quantitative mapping of the brain’s structural connectivity using diffusion MRI tractography: A review > Improving tractography quality: methods for tractography correction > False positive connections
What the sources say
- Supportedcites Drakesmith et al., 2015 source
The Introduction says inferred brain-network measures are sensitive to errors in edges, including false positives. In the Discussion’s “Effects of false positives” section (page not provided), the authors report that even a single false positive significantly affects inferred network metrics and that added false edges produce a strong bias in global efficiency. (LLM, conf=0.91)
- Supportedcites Maier-Hein et al., 2017 source
The Discussion (page unavailable) reports that 64% of the bundles systematically recovered by most submissions were absent from the ground truth. This supports the claim that false-positive connections can severely distort estimated connectivity, though the paper cautions that its simulation cannot quantify the effect on in vivo connectivity in absolute terms. (LLM, conf=0.90)
- Not matchedcites Zalesky et al., 2016b
Couldn’t be matched to a paper in Crossref, so it can’t be checked.
plaindirect- Asserted: passes — The authors put it forward as true.
- Checkable: passes — It can be checked against evidence.
- Load-bearing: passes — The paper’s conclusions depend on it.
- Based: passes — The paper gives a reason why it holds.
- Supported
The sources with a verdict support this claim; the rest weren’t checked yet, have no full text we could read, or their verdicts aren’t rated yet.
In the paper
“On one hand, tractography results may vary across the large set of available diffusion models (Afzali et al., 2020; Alexander, 2006; Panagiotaki et al., 2012; Yablonskiy and Sukstanskii, 2010) and tractography methods”
§ Quantitative mapping of the brain’s structural connectivity using diffusion MRI tractography: A review > Brief introduction to tractography
What the sources say
- Not checked — no full text of the sourcecites Basser et al., 2000 source
- Supportedcites Behrens et al., 2007 source
The Discussion (page not provided) compares single- and multi-fibre tractography and says they can give strikingly different results for non-dominant pathways. It also describes differences among diffusion-reconstruction techniques. This supports the claim that tractography results may vary with the model or method used. (LLM, conf=0.88)
- Supportedcites Descoteaux et al., 2008 source
The Introduction says diffusion-tensor-based tractography can produce false tracts or stop prematurely. The Discussion compares different tracking approaches and reports that they reconstruct different portions of fiber bundles, supporting the claim that results vary with the model and method used. Page numbers are not available in our copy. (LLM, conf=0.90)
hedgedconditional- Asserted: passes — The authors put it forward as true.
- Checkable: passes — It can be checked against evidence.
- Load-bearing: passes — The paper’s conclusions depend on it.
- Based: passes — The paper gives a reason why it holds.
Every source the paper cites for this claim was checked and supports it.
In the paper
“despite the fact that white matter fibers synapse in the gray matter (Daducci et al., 2016)”
§ Quantitative mapping of the brain’s structural connectivity using diffusion MRI tractography: A review > Improving tractography quality: methods for tractography correction > Termination bias
What the sources say
- Supportedcites Daducci et al., 2016 source
Section 2.4, “Partial fibers” (page unavailable), states that axons connect neurons located in gray matter and contrasts this with reconstructed tracts that stop prematurely in white matter. This supports the citing sentence’s point that white-matter fibers connect to neurons in gray matter. (LLM, conf=0.87)
plain- Asserted: passes — The authors put it forward as true.
- Checkable: passes — It can be checked against evidence.
- Load-bearing: passes — The paper’s conclusions depend on it.
- Based: passes — The paper gives a reason why it holds.
- Supported
The cited sources support only part of this claim — read each source’s verdict below.
In the paper
“On the other hand, tractography results can also be sensitive to the choice of parameters (such as seeding and stopping thresholds) within a certain algorithm (Chamberland et al., 2014; Côté et al., 2013; Gong et al., 2018; Moldrich et al., 2010; Xie et al., 2020).”
§ Quantitative mapping of the brain’s structural connectivity using diffusion MRI tractography: A review > Brief introduction to tractography
What the sources say
- Supportedcites Chamberland et al., 2014 source
Section 2.2 says subtle variations in tractography parameters can lead to different results and specifically discusses seeding strategies and stopping criteria. The Results (section 3.4) show that fixed parameter choices can produce misleading reconstructions, including spurious streamlines. (LLM, conf=0.94)
- Not matchedcites Côté et al., 2013
Couldn’t be matched to a paper in Crossref, so it can’t be checked.
- Supportedcites Gong et al., 2018 source
The Introduction states that varying tractography thresholds has a large impact on fiber tracking using UKFt near edema. The Discussion adds that reducing thresholds used to start and stop tractography can increase fiber-tract size, supporting the claim that results are sensitive to parameter choices within an algorithm. (LLM, conf=0.93)
plainconditional- Asserted: passes — The authors put it forward as true.
- Checkable: passes — It can be checked against evidence.
- Load-bearing: unclear — It is unclear whether the paper’s conclusions depend on it.
- Based: passes — The paper gives a reason why it holds.
- Supported
- It may state two separate claims as one. 69
- Probably not a substantial claim. 50
The cited sources support only part of this claim — read each source’s verdict below.
In the paper
“Gyral bias in tractography is the bias towards generating streamlines that terminate in gyri rather than sulci (Schilling et al., 2018a; Wu et al., 2020b), which reduces the agreement of the initiations or terminations of fiber streamlines with known ground truth from tracer studies and histology (Aydogan et al., 2018; Budde and Annese, 2013).”
§ Quantitative mapping of the brain’s structural connectivity using diffusion MRI tractography: A review > Improving tractography quality: methods for tractography correction > Gyral bias
What the sources say
- Not matchedcites Schilling et al., 2018a
Couldn’t be matched to a paper in Crossref, so it can’t be checked.
- Not matchedcites Wu et al., 2020b
Couldn’t be matched to a paper in Crossref, so it can’t be checked.
- Partly supportedcites Aydogan et al., 2018 sourceExperimental — accuracy not yet measured
The Introduction (page unavailable) reports imperfect overlap between mouse tractograms and tracer injections, supporting the general point that tractography can disagree with tracer ground truth. But the paper does not attribute that disagreement to gyral bias or preferential termination in gyri rather than sulci. The Discussion (page unavailable) describes validation using histology images as future work, not a result of this study. (LLM, conf=0.79)
plaindirect- Asserted: passes — The authors put it forward as true.
- Checkable: passes — It can be checked against evidence.
- Load-bearing: passes — The paper’s conclusions depend on it.
- Based: passes — The paper gives a reason why it holds.
It may state two separate claims as one.
- Not matched
The cited sources support only part of this claim — read each source’s verdict below.
In the paper
“Lastly, deep learning techniques have been increasingly applied for anatomical tract identification, showing high potential for future work and improvements in computational speed (Chen et al., 2021; Gupta et al., 2017a; 2018; 2017b; Lam et al., 2018; Reisert et al., 2018; Wasserthal et al., 2018; 2019; Xu et al., 2019; Zhang et al., 2020a).”
§ Quantitative mapping of the brain’s structural connectivity using diffusion MRI tractography: A review > Defining regions for quantitation: methods for tractography segmentation > Anatomical tract identification
What the sources say
- Supportedcites Chen et al., 2021 source
The Introduction describes deep learning as a promising direction for white matter fiber clustering, notes multiple existing methods for tractography segmentation, and says this paper's approach demonstrated efficiency. The Conclusion reports efficiency advantages over other algorithms and identifies directions for further improvement. (LLM, conf=0.92)
- Not matchedcites Gupta et al., 2017a
Couldn’t be matched to a paper in Crossref, so it can’t be checked.
- Not matchedcites Lam et al., 2018
Couldn’t be matched to a paper in Crossref, so it can’t be checked.
plaincorrelational- Asserted: passes — The authors put it forward as true.
- Checkable: passes — It can be checked against evidence.
- Load-bearing: fails — The paper’s conclusions may not depend on it.
- Based: passes — The paper gives a reason why it holds.
Probably not a substantial claim. The paper’s conclusions may not depend on it. It may state two separate claims as one.
- Supported
The cited sources support only part of this claim — read each source’s verdict below.
In the paper
“Manual streamline selection is considered to be the gold standard to delineate anatomical fiber tracts in tractography and has been widely used to validate other anatomical tract identification techniques (Poulin et al., 2019; Pujol et al., 2015; Xie et al., 2020).”
- Also stated in: § Anatomical tract identification · plain
“However, manual streamline selection is still considered to be the gold standard for benchmarked comparisons and algorithm training (Kreilkamp et al., 2019; Wasserthal et al., 2018; Zhang et al., 2010).”
§ Quantitative mapping of the brain’s structural connectivity using diffusion MRI tractography: A review > Defining regions for quantitation: methods for tractography segmentation > Anatomical tract identification
What the sources say
- Supportedcites Poulin et al., 2019 source
The paper calls expert-validated streamline annotations a medical-imaging “gold standard,” while distinguishing them from biological ground truth (Annotated Datasets and Evaluation Tools, p. 4). It also reviews annotated datasets used to train or validate tractography algorithms (p. 3) and describes manually validated bundles used to train and validate a tract-segmentation method (TractSeg, p. 9). (LLM, conf=0.87)
- Partly supportedcites Kreilkamp et al., 2019 sourceExperimental — accuracy not yet measured
The Introduction (page unavailable) describes manual techniques as closest to ground truth in the absence of histological data and as a benchmark for comparing automated tractography, supporting the core of the claim. It does not establish that manual selection has been widely used to validate other tract-identification techniques; it says recent automated methods have not been extensively validated. It also does not describe using manual selections for algorithm training. (LLM, conf=0.86)
- Partly supportedcites Wasserthal et al., 2018 sourceExperimental — accuracy not yet measured
The Introduction describes manual virtual dissection as the most commonly employed way to segment white matter tracts, and §3.3 compares manual dissections with TractSeg and other methods. But §4.2 says the paper’s reference tracts are not real ground truth. The paper supports manual delineation and its use in comparisons, not the unqualified description of manual selection as a gold standard. (LLM, conf=0.84)
plain- Asserted: passes — The authors put it forward as true.
- Checkable: passes — It can be checked against evidence.
- Load-bearing: unclear — It is unclear whether the paper’s conclusions depend on it.
- Based: passes — The paper gives a reason why it holds.
It may state two separate claims as one.
- Also stated in: § Anatomical tract identification · plain
The cited sources support only part of this claim — read each source’s verdict below.
In the paper
“In general, studies indicate that modern multi-fiber tractography is more sensitive when performing tractography and thus is more consistent across subjects and timepoints than traditional single-fiber DTI tractography (Bucci et al., 2013; Prčkovska et al., 2016).”
§ Quantitative mapping of the brain’s structural connectivity using diffusion MRI tractography: A review > Defining regions for quantitation: methods for tractography segmentation > Anatomical tract identification
What the sources say
- Partly supportedcites Bucci et al., 2013 sourceExperimental — accuracy not yet measured
The Discussion (‘Quantitative validation of fiber tracking methods’; page unavailable) reports significantly better sensitivity for q-ball than DTI, and ‘Implications for preoperative mapping’ calls probabilistic q-ball the most reproducible of the four methods tested. The paper does not establish consistency across subjects or timepoints, and cautions against generalizing from its small sample. (LLM, conf=0.88)
- Not checked — no full text of the sourcecites Prčkovska et al., 2016 source
hedgeddirect- Asserted: passes — The authors put it forward as true.
- Checkable: passes — It can be checked against evidence.
- Load-bearing: unclear — It is unclear whether the paper’s conclusions depend on it.
- Based: passes — The paper gives a reason why it holds.
It may state two separate claims as one.
- Partly supported
The cited sources support only part of this claim — read each source’s verdict below.
In the paper
“Most widely used approaches perform a linear registration (Garyfallidis et al., 2015; O’Donnell et al., 2012), while many studies have proposed to perform non-linear approaches to enable deformations of the streamlines (Benou et al., 2019; Chandio and Garyfallidis, 2020; Olivetti et al., 2016).”
§ Quantitative mapping of the brain’s structural connectivity using diffusion MRI tractography: A review > Defining regions for quantitation: methods for tractography segmentation > Anatomical tract identification
What the sources say
- Not checked — no full text of the sourcecites Garyfallidis et al., 2015 source
- Partly supportedcites O’Donnell et al., 2012 sourceExperimental — accuracy not yet measured
The Methods (section 2.3; page unavailable) describe this paper’s tractography registration as fully affine, supporting its use as an example of linear registration. The Introduction says alignment is often performed using transformations from image-based registration, but does not establish that linear approaches are the most widely used. The nonlinear-approaches clause is attributed to other citations in the sentence, not to this paper. (LLM, conf=0.82)
- Not checked — no full text of the sourcecites Benou et al., 2019 source
plain- Asserted: passes — The authors put it forward as true.
- Checkable: passes — It can be checked against evidence.
- Load-bearing: unclear — It is unclear whether the paper’s conclusions depend on it.
- Based: passes — The paper gives a reason why it holds.
It may state two separate claims as one.
Every source the paper cites for this claim was checked and supports it.
In the paper
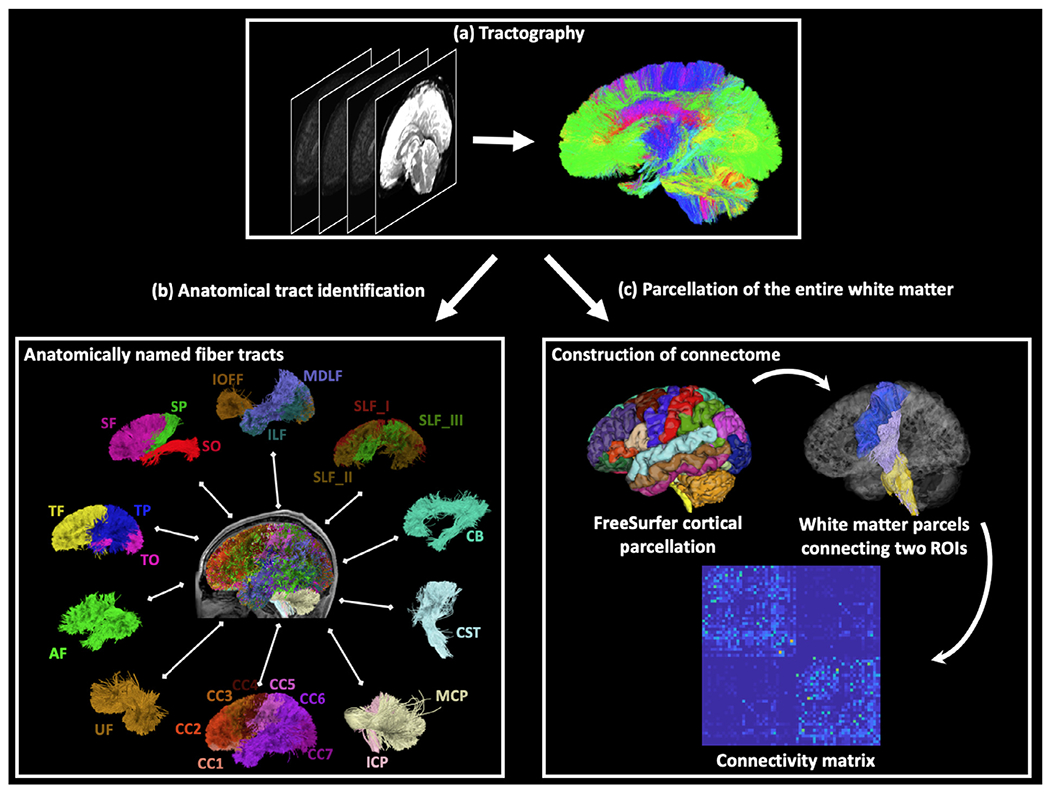
“There are generally two categories of methods: cortical-parcellation-based methods and fiber clustering methods (O’Donnell et al., 2013).”
§ Quantitative mapping of the brain’s structural connectivity using diffusion MRI tractography: A review > Defining regions for quantitation: methods for tractography segmentation > Parcellation of the whole-brain tractogram
What the sources say
- Supportedcites O’Donnell et al., 2013 source
The Introduction identifies parcellation-based and clustering methods as the two main categories, while also proposing hybrid methods as a third category. Section 2 explains that the former use cortical fiber endpoints and the latter group fiber trajectories, matching the citing sentence’s distinction. (LLM, conf=0.94)
plain- Asserted: passes — The authors put it forward as true.
- Checkable: passes — It can be checked against evidence.
- Load-bearing: fails — The paper’s conclusions may not depend on it.
- Based: passes — The paper gives a reason why it holds.
Probably not a substantial claim. The paper’s conclusions may not depend on it.
- Supported
Every source the paper cites for this claim was checked and supports it.
In the paper
“For example, the intermodality registration between dMRI and T1-weighted images can be affected by differences in image resolutions (Malinsky et al., 2013) and echo-planar imaging (EPI) distortion in dMRI data (Albi et al., 2018).”
§ Quantitative mapping of the brain’s structural connectivity using diffusion MRI tractography: A review > Defining regions for quantitation: methods for tractography segmentation > Anatomical tract identification
What the sources say
- Supportedcites Malinsky et al., 2013 source
The Background describes registration of high-resolution T1 images with low-resolution diffusion-derived FA images and says the data must be preprocessed to ensure identical resolution and voxel size. This supports the resolution-difference point attributed to Malinsky et al.; the EPI-distortion point is attributed to Albi et al. and is not assessed here. (LLM, conf=0.92)
- Supportedcites Albi et al., 2018 source
The Albi et al. citation is attached to EPI distortion in dMRI, not to the image-resolution difference. The Introduction states that EPI produces geometric distortions and displaces anatomical structures; the Methods describe registering DWI data to anatomical images to correct that distortion. (LLM, conf=0.92)
plainconditional- Asserted: passes — The authors put it forward as true.
- Checkable: passes — It can be checked against evidence.
- Load-bearing: unclear — It is unclear whether the paper’s conclusions depend on it.
- Based: passes — The paper gives a reason why it holds.
It may state two separate claims as one.
- Supported
The sources with a verdict support this claim; the rest weren’t checked yet, have no full text we could read, or their verdicts aren’t rated yet.
In the paper
“They group tractography streamlines according to their geometric trajectories, describing the structural connectivity according to the white matter anatomy (Avila et al., 2019; Chekir et al., 2014; Garyfallidis et al., 2018; Guevara et al., 2012; Li et al., 2010; O’Donnell and Westin, 2007; Román et al., 2017; Ros et al., 2013; Siless et al., 2018; 2020; Tunç et al., 2014; Vázquez et al., 2020; Wu”
§ Quantitative mapping of the brain’s structural connectivity using diffusion MRI tractography: A review > Defining regions for quantitation: methods for tractography segmentation > Parcellation of the whole-brain tractogram
What the sources say
- Not matchedcites Avila et al., 2019
Couldn’t be matched to a paper in Crossref, so it can’t be checked.
- Not checked — no full text of the sourcecites Chekir et al., 2014 source
- Supportedcites Garyfallidis et al., 2018 source
The Introduction describes streamline-based segmentation of tractograms into known anatomical bundles. Section 2.2 explains that RecoBundles clusters streamlines using a distance between their trajectories and recognizes bundles by their shape. Together, these passages support the cited description of grouping streamlines to characterize white-matter pathways; no page numbers were available in our copy. (LLM, conf=0.87)
plaindirect- Asserted: passes — The authors put it forward as true.
- Checkable: passes — It can be checked against evidence.
- Load-bearing: unclear — It is unclear whether the paper’s conclusions depend on it.
- Based: passes — The paper gives a reason why it holds.
It may state two separate claims as one.
- Not matched
The cited sources support only part of this claim — read each source’s verdict below.
In the paper
“Many cortical-parcellation-based methods have also used a functional cortical parcellation computed using functional MRI data (Eickhoff et al., 2005; Glasser et al., 2016; Schaefer et al., 2018; Yeo et al., 2011).”
§ Quantitative mapping of the brain’s structural connectivity using diffusion MRI tractography: A review > Defining regions for quantitation: methods for tractography segmentation > Parcellation of the whole-brain tractogram
What the sources say
- Not checked — no full text of the sourcecites Eickhoff et al., 2005 source
- Partly supportedcites Glasser et al., 2016 sourceExperimental — accuracy not yet measured
The Methods (‘Modalities for parcellation’) confirm that Glasser et al. used task and resting-state fMRI data to construct a cortical parcellation. But the parcellation was multi-modal: it also used architectural measures, so describing this source as an example of a functional parcellation omits a defining qualification. (LLM, conf=0.85)
- Not checked — no full text of the sourcecites Schaefer et al., 2018 source
plain- Asserted: passes — The authors put it forward as true.
- Checkable: passes — It can be checked against evidence.
- Load-bearing: fails — The paper’s conclusions may not depend on it.
- Based: passes — The paper gives a reason why it holds.
Probably not a substantial claim. The paper’s conclusions may not depend on it.
The sources with a verdict support this claim; the rest weren’t checked yet, have no full text we could read, or their verdicts aren’t rated yet.
In the paper
“The first category of quantitative measures are based on the tractography data alone, which are often used to define the connectivity strength (Jones, 2010; Smith et al., 2020a; Sotiropoulos and Zalesky, 2019; Yeh et al., 2020).”
§ Quantitative mapping of the brain’s structural connectivity using diffusion MRI tractography: A review > Performing quantitative analysis: methods for tractography quantification > Quantitative measures computed from tractography
What the sources say
- Not checked — no full text of the sourcecites Jones, 2010 source
- Not matchedcites Smith et al., 2020a
Couldn’t be matched to a paper in Crossref, so it can’t be checked.
- Supportedcites Sotiropoulos and Zalesky, 2019 source
In “Quantifying edges,” the paper says connection strength is most typically quantified using a function of tractography-derived streamline counts. This supports the claim that measures based on tractography data alone are used to define connectivity strength; “first category” is the citing authors’ framing. (LLM, conf=0.92)
plain- Asserted: passes — The authors put it forward as true.
- Checkable: passes — It can be checked against evidence.
- Load-bearing: unclear — It is unclear whether the paper’s conclusions depend on it.
- Based: passes — The paper gives a reason why it holds.
It may state two separate claims as one.
The cited sources support only part of this claim — read each source’s verdict below.
In the paper
“The most popularly used cortical parcellation is the Freesurfer Desikan-Killiany cortical parcellation (Desikan et al., 2006; Fischl, 2012), while many other cortical parcellation schemes have also been widely used (Destrieux et al., 2010; Shattuck et al., 2008; Tzourio-Mazoyer et al., 2002).”
§ Quantitative mapping of the brain’s structural connectivity using diffusion MRI tractography: A review > Defining regions for quantitation: methods for tractography segmentation > Parcellation of the whole-brain tractogram
What the sources say
- Not checked — no full text of the sourcecites Desikan et al., 2006 source
- Partly supportedcites Fischl, 2012 sourceExperimental — accuracy not yet measured
The Introduction (page not provided) identifies the Desikan et al. (2006) cortical parcellation as part of FreeSurfer, and the Contributors section says Desikan and Killiany developed it. Neither passage establishes that it is the most popularly used cortical parcellation. The later clause about other schemes is cited to other sources, not Fischl (2012). (LLM, conf=0.84)
- Supportedcites Destrieux et al., 2010 source
The Destrieux citation is attached to the clause about other cortical parcellation schemes, not to the claim that Desikan–Killiany is the most popular. The Abstract identifies this paper's distinct sulco-gyral parcellation as available in FreeSurfer, and the Discussion reports that FreeSurfer, including this or an earlier atlas, had been licensed 6,700 times. (LLM, conf=0.90)
plain- Asserted: passes — The authors put it forward as true.
- Checkable: passes — It can be checked against evidence.
- Load-bearing: fails — The paper’s conclusions may not depend on it.
- Based: passes — The paper gives a reason why it holds.
Probably not a substantial claim. The paper’s conclusions may not depend on it. It may state two separate claims as one.
The cited sources support only part of this claim — read each source’s verdict below.
In the paper
“Other quantitative measures can be computed directly from tractography, such as the volume and the length of a fiber tract (Bajada et al., 2019; Behrman-Lay et al., 2015; Catani et al., 2007; Chandio et al., 2020a; Colby et al., 2012a; Grinberg et al., 2018; Rheault et al., 2020a; Song et al., 2015; Yeatman et al., 2012), have also been used.”
§ Quantitative mapping of the brain’s structural connectivity using diffusion MRI tractography: A review > Performing quantitative analysis: methods for tractography quantification > Quantitative measures computed from tractography
What the sources say
- Partly supportedcites Bajada et al., 2019 sourceExperimental — accuracy not yet measured
Section 2.4 (Length mapping; page not supplied) says the authors calculated streamline lengths directly from tractography track files and used them to create cortical tract-length maps. Our copy does not report computing fiber-tract volume as a quantitative measure; its references to volume in Section 2.3 concern image space and subject brain volume. (LLM, conf=0.88)
- Partly supportedcites Behrman-Lay et al., 2015 sourceExperimental — accuracy not yet measured
Methods §2.5 says the authors computed mean track length from tractography-derived arc lengths and used it as a quantitative measure. It does not report computing fiber-tract volume; the volume mentioned there is intracranial volume, used to normalize length. (LLM, conf=0.88)
- Could not verifycites Catani et al., 2007 sourceExperimental — accuracy not yet measured
The tractography methods passage (Discussion; page unavailable) describes measuring the number of reconstructed pathways and fractional anisotropy, but not tract volume or length. Searches for tract volume and fiber length found no passage saying either was computed or used as a quantitative measure in this paper. (LLM, conf=0.75)
plain- Asserted: passes — The authors put it forward as true.
- Checkable: passes — It can be checked against evidence.
- Load-bearing: unclear — It is unclear whether the paper’s conclusions depend on it.
- Based: passes — The paper gives a reason why it holds.
It may state two separate claims as one.
- Partly supported
The cited sources support only part of this claim — read each source’s verdict below.
In the paper
“Due to these factors, several studies have demonstrated advantages of fiber clustering methods over the cortical-parcellation-based methods, including more consistent parcellation across subjects (Sydnor et al., 2018; Zhang et al., 2017) and a higher reproducibility between test-retest scans (Zhang et al., 2019).”
§ Quantitative mapping of the brain’s structural connectivity using diffusion MRI tractography: A review > Defining regions for quantitation: methods for tractography segmentation > Parcellation of the whole-brain tractogram
What the sources say
- Supportedcites Sydnor et al., 2018 source
Sydnor et al. is cited for more consistent parcellation across subjects, not for test–retest reproducibility, which the sentence attributes to Zhang et al. (2019). In the Discussion section, the paper reports that clustering produced the most consistent white matter tracts across subjects among the methods compared. (LLM, conf=0.92)
- Not matchedcites Zhang et al., 2017
Couldn’t be matched to a paper in Crossref, so it can’t be checked.
- Supportedcites Zhang et al., 2019 source
The Zhang et al. (2019) citation is attached specifically to the test–retest claim, not the separate claim about consistency across subjects. The Discussion reports significantly higher test–retest reproducibility for fiber clustering than for the cortical-parcellation-based method across all three datasets. (LLM, conf=0.94)
boostedcorrelational- Asserted: passes — The authors put it forward as true.
- Checkable: passes — It can be checked against evidence.
- Load-bearing: passes — The paper’s conclusions depend on it.
- Based: passes — The paper gives a reason why it holds.
It may state two separate claims as one.
- Supported
The cited sources support only part of this claim — read each source’s verdict below.
In the paper
“For example, researchers have used the longitudinal relaxation rate (R1), a measure sensitive to myelin, along the fiber tracts (Boshkovski et al., 2020a; Yeatman et al., 2012).”
§ Quantitative mapping of the brain’s structural connectivity using diffusion MRI tractography: A review > Performing quantitative analysis: methods for tractography quantification > Quantitative measures computed from tractography
What the sources say
- Not matchedcites Boshkovski et al., 2020a
Couldn’t be matched to a paper in Crossref, so it can’t be checked.
- Partly supportedcites Yeatman et al., 2012 sourceExperimental — accuracy not yet measured
The Methods section describes measuring fractional anisotropy (FA) at locations along fiber tracts, and the Discussion reports tract profiles of FA. The cited paper therefore supports the along-tract approach, but the passages do not establish that it used longitudinal relaxation rate (R1) or describe R1 as sensitive to myelin. (LLM, conf=0.88)
plain- Asserted: passes — The authors put it forward as true.
- Checkable: passes — It can be checked against evidence.
- Load-bearing: fails — The paper’s conclusions may not depend on it.
- Based: passes — The paper gives a reason why it holds.
Probably not a substantial claim. The paper’s conclusions may not depend on it.
- Not matched
The cited sources support only part of this claim — read each source’s verdict below.
In the paper
“Most often, data are averaged across corresponding points along each streamline in the pathway, such that data can be analyzed (e.g., an along-tract or along-pathway plot) versus streamline arc length or other parameterization (Colby et al., 2012b; Corouge et al., 2006; Yeatman et al., 2012).”
§ Quantitative mapping of the brain’s structural connectivity using diffusion MRI tractography: A review > Performing quantitative analysis: methods for tractography quantification > Domain of analysis: extraction of quantitative measures within white matter fiber pathways
What the sources say
- Not matchedcites Colby et al., 2012b
Couldn’t be matched to a paper in Crossref, so it can’t be checked.
- Supportedcites Corouge et al., 2006 source
Section 3.2.1 (p. 8) defines points at the same arc length along fibers as corresponding points. Section 3.3.1 (p. 10) computes a mean tensor at each corresponding location, and Fig. 4’s description (p. 12) says the resulting diffusion properties are plotted against location along the tract. This supports the cited paper as an example of the described approach. (LLM, conf=0.92)
- Supportedcites Yeatman et al., 2012 source
The Methods (Automated Fiber Quantification, Fiber Tract Quantification) say that each fiber is resampled to 100 equally spaced nodes. The Methods then describe averaging diffusion properties across fibers at each node to produce a tract profile, supporting the attributed along-tract analysis. (LLM, conf=0.89)
plain- Asserted: passes — The authors put it forward as true.
- Checkable: passes — It can be checked against evidence.
- Load-bearing: fails — The paper’s conclusions may not depend on it.
- Based: passes — The paper gives a reason why it holds.
Probably not a substantial claim. The paper’s conclusions may not depend on it.
- Not matched
The sources with a verdict support this claim; the rest weren’t checked yet, have no full text we could read, or their verdicts aren’t rated yet.
In the paper
“This sampling may be done by first generating a binary mask that defines the voxels through which streamlines pass and then sampling from an underlying microstructure image within this mask (Ciccarelli et al., 2003; Heiervang et al., 2006; Kunimatsu et al., 2004; Voineskos et al., 2010). The sampling may alternatively be done by sampling microstructural measures at each point of the streamlines”
§ Quantitative mapping of the brain’s structural connectivity using diffusion MRI tractography: A review > Performing quantitative analysis: methods for tractography quantification > Quantitative measures computed from tractography
What the sources say
- Not checked — no full text of the sourcecites Ciccarelli et al., 2003 source
- Not checked — no full text of the sourcecites Heiervang et al., 2006 source
- Supportedcites Kunimatsu et al., 2004 source
Split into 2 atoms — 2 confirmed, 0 partially supported, 0 disputed, 0 misattributed, 0 unverifiable. Expand the claim to see per-atom verdicts.
hedged- Asserted: passes — The authors put it forward as true.
- Checkable: passes — It can be checked against evidence.
- Load-bearing: fails — The paper’s conclusions may not depend on it.
- Based: passes — The paper gives a reason why it holds.
Probably not a substantial claim. The paper’s conclusions may not depend on it. It may state two separate claims as one.
The cited sources support only part of this claim — read each source’s verdict below.
In the paper
“Other approaches fit a medial surface representation to the pathway, such that sampled data can be represented in two dimensions and can be analyzed not only along the pathway but also across its cross-section (Chen et al., 2016b; Qiu et al., 2010; Yushkevich et al., 2009).”
§ Quantitative mapping of the brain’s structural connectivity using diffusion MRI tractography: A review > Performing quantitative analysis: methods for tractography quantification > Domain of analysis: extraction of quantitative measures within white matter fiber pathways
What the sources say
- Not matchedcites Chen et al., 2016b
Couldn’t be matched to a paper in Crossref, so it can’t be checked.
- Partly supportedcites Qiu et al., 2010 sourceExperimental — accuracy not yet measured
Methods §4.3 defines the tract surface as the boundary of its volume, not a medial surface. Methods §§4.4–4.5 describe a two-dimensional surface and mapping three-dimensional FA data onto it, supporting the dimensionality-reduction part of the claim. The cited paper does not describe analysis along the pathway and across its cross-section in those terms. Page numbers are unavailable in our copy. (LLM, conf=0.88)
- Not matchedcites Yushkevich et al., 2009
Couldn’t be matched to a paper in Crossref, so it can’t be checked.
plain- Asserted: passes — The authors put it forward as true.
- Checkable: passes — It can be checked against evidence.
- Load-bearing: fails — The paper’s conclusions may not depend on it.
- Based: passes — The paper gives a reason why it holds.
Probably not a substantial claim. The paper’s conclusions may not depend on it.
- Not matched
The cited sources support only part of this claim — read each source’s verdict below.
In the paper
“Such analyses have been applied to study, e.g., how white matter fiber tracts are affected in individuals with different disease severity (Cha et al., 2015; Chiang et al., 2016; Price et al., 2007), how tracts relate to cognitive and socio-emotional function (Zekelman et al., 2021), and how tracts are developing during human neurodevelopment and aging (Gertheiss et al., 2013; Hasan et al., 2009a;”
§ Quantitative mapping of the brain’s structural connectivity using diffusion MRI tractography: A review > Performing quantitative analysis: methods for tractography quantification > Tract-specific analysis using statistical or machine learning techniques
What the sources say
- Supportedcites Cha et al., 2015 source
The Effects of ADHD section reports reduced fronto-accumbal tract measures in children with ADHD compared with healthy controls. The Correlation with aggression section also reports that tract measures varied with aggression among children with ADHD, supporting this paper as an example of using tractography to examine differences associated with clinical severity. The later claims about cognition and development are attached to other citations, not Cha et al. (LLM, conf=0.88)
- Not checked — no full text of the sourcecites Chiang et al., 2016 source
- Partly supportedcites Price et al., 2007 sourceExperimental — accuracy not yet measured
Split into 3 atoms — 0 confirmed, 3 partially supported, 0 disputed, 0 misattributed, 0 unverifiable. Expand the claim to see per-atom verdicts.
plaincorrelational- Asserted: passes — The authors put it forward as true.
- Checkable: passes — It can be checked against evidence.
- Load-bearing: unclear — It is unclear whether the paper’s conclusions depend on it.
- Based: passes — The paper gives a reason why it holds.
It may state two separate claims as one.
- Supported
The cited sources support only part of this claim — read each source’s verdict below.
In the paper
“Over the last two decades, the study of the brain as a network has become increasingly popular in the neuroscience and neuroimaging communities, giving rise to the new fields of connectomics and network neuroscience (Bassett and Sporns, 2017; Fornito et al., 2013; 2015; 2016).”
§ Quantitative mapping of the brain’s structural connectivity using diffusion MRI tractography: A review > Performing quantitative analysis: methods for tractography quantification > Graph theoretical measures and advanced structural connectome measurements
What the sources say
- Supportedcites Bassett and Sporns, 2017 source
The Conclusion describes network neuroscience as a new field gaining momentum as networks have become ubiquitous in neurobiological research. The Network mapping and observation section identifies connectomics as the mapping of connections among neurons and brain areas. Together, these passages support the citing sentence’s broad account of growing network-based research and the emergence of these fields. (LLM, conf=0.88)
- Not matchedcites Fornito et al., 2013; 2015; 2016
Couldn’t be matched to a paper in Crossref, so it can’t be checked.
plaindirect- Asserted: passes — The authors put it forward as true.
- Checkable: passes — It can be checked against evidence.
- Load-bearing: fails — The paper’s conclusions may not depend on it.
- Based: passes — The paper gives a reason why it holds.
Probably not a substantial claim. The paper’s conclusions may not depend on it. It may state two separate claims as one.
- Supported
The cited sources support only part of this claim — read each source’s verdict below.
In the paper
“Additional studies have analyzed tracts represented as surfaces (Chen et al., 2016b; Qiu et al., 2010; Yushkevich et al., 2009) or performed data reduction techniques to reduce the dimensionality of the point-wise measurements along tracts (Ceschin et al., 2015; Chamberland et al., 2019; Geeraert et al., 2020).”
§ Quantitative mapping of the brain’s structural connectivity using diffusion MRI tractography: A review > Performing quantitative analysis: methods for tractography quantification > Tract-specific analysis using statistical or machine learning techniques
What the sources say
- Not matchedcites Chen et al., 2016b
Couldn’t be matched to a paper in Crossref, so it can’t be checked.
- Supportedcites Qiu et al., 2010 source
Qiu et al. is cited for the first part of the sentence: analyzing tracts represented as surfaces. The Introduction says the study introduced surface representations of 23 deep white matter tracts, and the Discussion identifies construction of those representations as its main contribution. The later clause about data-reduction techniques has different citations and is not attributed to Qiu et al. (LLM, conf=0.95)
- Not matchedcites Yushkevich et al., 2009
Couldn’t be matched to a paper in Crossref, so it can’t be checked.
plain- Asserted: passes — The authors put it forward as true.
- Checkable: passes — It can be checked against evidence.
- Load-bearing: unclear — It is unclear whether the paper’s conclusions depend on it.
- Based: passes — The paper gives a reason why it holds.
It may state two separate claims as one.
- Not matched
The cited sources support only part of this claim — read each source’s verdict below.
In the paper
“Construction of the connectivity matrix has been described in several reviews (Sotiropoulos et al., 2016; Yeh et al., 2020) and includes two major steps. First, parcellation of the whole-brain tractogram is needed to compute all possible fiber pathways in the brain, i.e., white matter parcels connecting all pairs of gray matter regions (as described in Section 4.2). Then, a metric of “connectivity”
§ Quantitative mapping of the brain’s structural connectivity using diffusion MRI tractography: A review > Performing quantitative analysis: methods for tractography quantification > Construction of a structural connectivity matrix
What the sources say
- Partly supportedcites Sotiropoulos et al., 2016 sourceExperimental — accuracy not yet measured
In Results, under “Preserving the fibre spreading pattern to the cortex supported by the 7T data” (Fig. 9; page unavailable), the paper describes constructing a connectome matrix by recording tractography-derived path probabilities between pairs of surface vertices. That supports using a connectivity metric for matrix entries, but the paper does not describe the claimed two-step procedure of parcellating a whole-brain tractogram into pathways between gray-matter regions and then assigning edge weights. It is an application of fibre-orientation estimation, not a review of connectivity-matrix construction. (LLM, conf=0.86)
- Not matchedcites Yeh et al., 2020
Couldn’t be matched to a paper in Crossref, so it can’t be checked.
plain- Asserted: passes — The authors put it forward as true.
- Checkable: passes — It can be checked against evidence.
- Load-bearing: fails — The paper’s conclusions may not depend on it.
- Based: passes — The paper gives a reason why it holds.
Probably not a substantial claim. The paper’s conclusions may not depend on it. It may state two separate claims as one.
- Partly supported
The cited sources support only part of this claim — read each source’s verdict below.
In the paper
“Another tract-specific analysis strategy is data-driven and uses machine learning techniques to perform tasks such as disease classification and prediction (Deng et al., 2019; O’Dwyer et al., 2012; Payabvash et al., 2019; Zhang et al., 2018a), as well as prediction of behavioral measures and traits (Seguin et al., 2020a; Tian et al., 2021).”
§ Quantitative mapping of the brain’s structural connectivity using diffusion MRI tractography: A review > Performing quantitative analysis: methods for tractography quantification > Tract-specific analysis using statistical or machine learning techniques
What the sources say
- Not checked — no full text of the sourcecites Deng et al., 2019 source
- Partly supportedcites O’Dwyer et al., 2012 sourceExperimental — accuracy not yet measured
The Methods and Discussion describe using diffusion data and a support vector machine to classify healthy young APOE4 carriers and non-carriers, and the Introduction says selected voxels were used for tractography. The Discussion also reports related work classifying older subjects as having mild cognitive impairment or being healthy. This paper itself did not classify disease or predict its onset; the later citations in the citing sentence, not O’Dwyer et al., are attached to behavioral measures and traits. (LLM, conf=0.85)
- Supportedcites Payabvash et al., 2019 source
Payabvash et al. is cited for disease classification and prediction, not for the separately cited prediction of behavioral traits. The Methods describe supervised machine-learning models using tract-based measures to classify children with sensory processing disorder, and the Results report their classification performance. (LLM, conf=0.93)
plaindirect- Asserted: passes — The authors put it forward as true.
- Checkable: passes — It can be checked against evidence.
- Load-bearing: unclear — It is unclear whether the paper’s conclusions depend on it.
- Based: passes — The paper gives a reason why it holds.
It may state two separate claims as one.
The sources with a verdict support this claim; the rest weren’t checked yet, have no full text we could read, or their verdicts aren’t rated yet.
In the paper
“The disciplines of graph theory and network science provide a framework to quantify network properties of brain connectivity (Rubinov and Sporns, 2010) and investigate whole-brain models of structural wiring (Betzel et al., 2016).”
§ Quantitative mapping of the brain’s structural connectivity using diffusion MRI tractography: A review > Performing quantitative analysis: methods for tractography quantification > Graph theoretical measures and advanced structural connectome measurements
What the sources say
- Not checked — no full text of the sourcecites Rubinov and Sporns, 2010 source
- Supportedcites Betzel et al., 2016 source
The citation to Betzel et al. is attached to investigating whole-brain models of structural wiring. In the Introduction, the paper describes fitting and comparing generative models of human connectomes to identify wiring rules that reproduce observed networks. (LLM, conf=0.93)
plain- Asserted: passes — The authors put it forward as true.
- Checkable: passes — It can be checked against evidence.
- Load-bearing: unclear — It is unclear whether the paper’s conclusions depend on it.
- Based: passes — The paper gives a reason why it holds.
It may state two separate claims as one.
The cited sources support only part of this claim — read each source’s verdict below.
In the paper
“Selection of tractography filtering strategies is important and has been shown to affect the analysis of the topology of brain networks (Civier et al., 2019; Frigo et al., 2020; Yeh et al., 2016a) and affect sensitivity and specificity when analyzing the connectomes (Zalesky et al., 2016a).”
§ Quantitative mapping of the brain’s structural connectivity using diffusion MRI tractography: A review > Performing quantitative analysis: methods for tractography quantification > Construction of a structural connectivity matrix
What the sources say
- Partly supportedcites Civier et al., 2019 sourceExperimental — accuracy not yet measured
The Introduction says methods used to construct graphs from tractograms can strongly influence connectome characteristics, and §3.2 reports that heavy pruning changes graph-theoretical metrics. But the paper tests removal of connectome connections, not a comparison of tractography filtering strategies; §4.8 says it cannot rule out effects of its fixed pipeline on topology. The sensitivity-and-specificity clause is attributed to Zalesky et al., not Civier et al. (LLM, conf=0.82)
- Supportedcites Frigo et al., 2020 source
The Abstract (Main Result) states that tractography filtering techniques change brain-network topology and alter network metrics. The Discussion and Conclusions likewise reports topological changes with SIFT2 and COMMIT. Frigo et al. is cited for this topology claim; the sentence cites Zalesky et al. separately for sensitivity and specificity. (LLM, conf=0.94)
- Not matchedcites Yeh et al., 2016a
Couldn’t be matched to a paper in Crossref, so it can’t be checked.
plaindirect- Asserted: passes — The authors put it forward as true.
- Checkable: passes — It can be checked against evidence.
- Load-bearing: passes — The paper’s conclusions depend on it.
- Based: passes — The paper gives a reason why it holds.
It may state two separate claims as one.
- Partly supported
The cited sources support only part of this claim — read each source’s verdict below.
In the paper
“This modular structure constrains the flow of information through the network in a manner thought to promote functional segregation and clusters of specialized information processing (Betzel et al., 2013).”
§ Quantitative mapping of the brain’s structural connectivity using diffusion MRI tractography: A review > Performing quantitative analysis: methods for tractography quantification > Graph theoretical measures and advanced structural connectome measurements
What the sources say
- Partly supportedcites Betzel et al., 2013 sourceExperimental — accuracy not yet measured
The Introduction describes communities as preferentially interconnected nodes that can trap the flow of random walkers, a model the paper says can represent information diffusion. The Discussion links connection topology to functional coupling, but our copy does not say that modular structure promotes specialized information processing or functional segregation in those terms. No page numbers were provided for these passages. (LLM, conf=0.82)
hedgedconditional- Asserted: passes — The authors put it forward as true.
- Checkable: passes — It can be checked against evidence.
- Load-bearing: fails — The paper’s conclusions may not depend on it.
- Based: passes — The paper gives a reason why it holds.
Probably not a substantial claim. The paper’s conclusions may not depend on it.
- Partly supported
The cited sources support only part of this claim — read each source’s verdict below.
In the paper
“Popular methods for community detection in structural brain networks include the Louvain algorithm and stochastic block models, though determining best practices around the utilization of these and other approaches remain an active topic of research (Fortunato and Hric, 2016).”
§ Quantitative mapping of the brain’s structural connectivity using diffusion MRI tractography: A review > Performing quantitative analysis: methods for tractography quantification > Graph theoretical measures and advanced structural connectome measurements
What the sources say
- Partly supportedcites Fortunato and Hric, 2016 sourceExperimental — accuracy not yet measured
The Methods section (p. 22) describes popular community-detection algorithms, and the paper discusses both the Louvain method (p. 30) and stochastic block models (p. 37). The Introduction (p. 2) also says there are no clear-cut guidelines for comparing methods. These passages do not establish that Louvain and stochastic block models are popular specifically for structural brain networks. (LLM, conf=0.86)
plain- Asserted: passes — The authors put it forward as true.
- Checkable: passes — It can be checked against evidence.
- Load-bearing: fails — The paper’s conclusions may not depend on it.
- Based: passes — The paper gives a reason why it holds.
Probably not a substantial claim. The paper’s conclusions may not depend on it.
- Partly supported
The sources with a verdict support this claim; the rest weren’t checked yet, have no full text we could read, or their verdicts aren’t rated yet.
In the paper
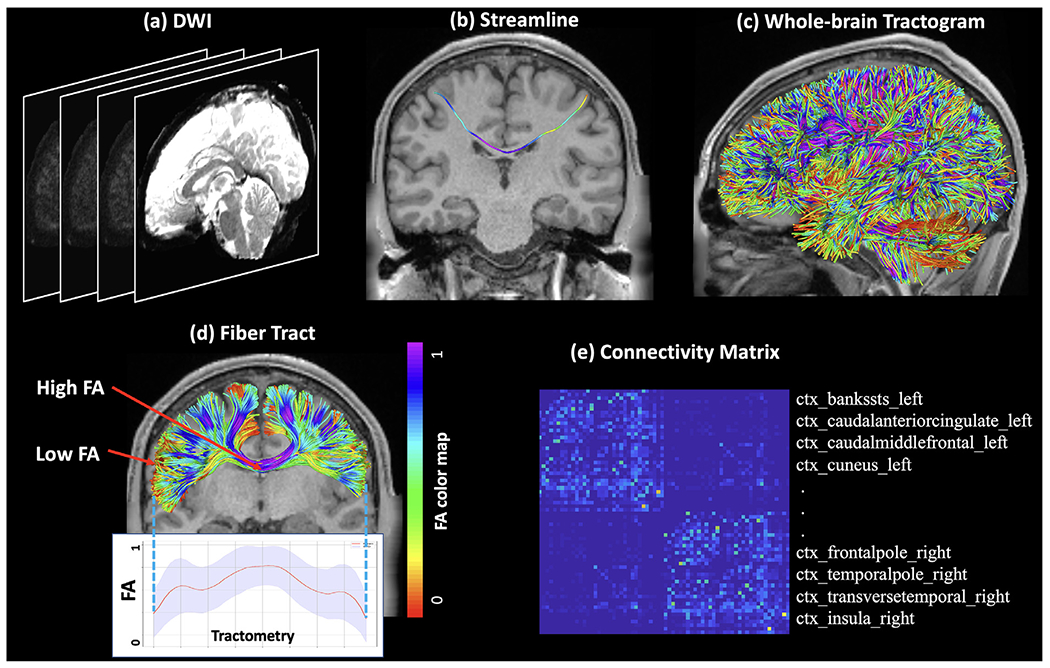
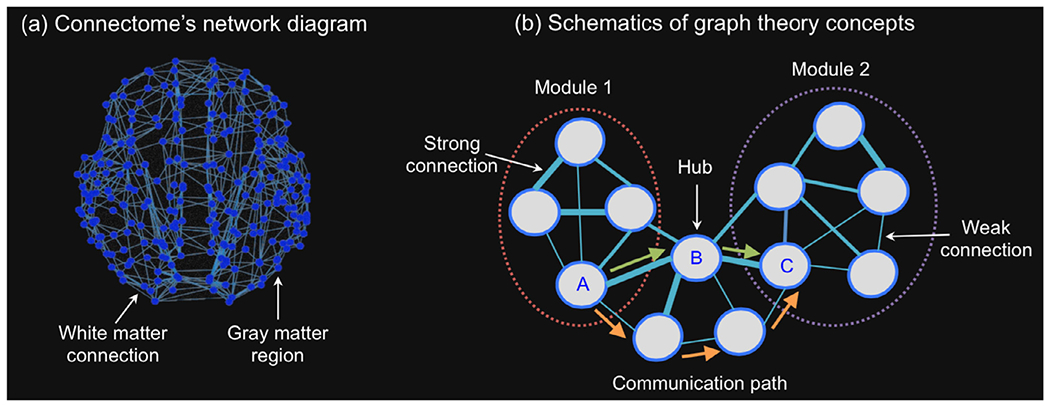
“Graph measures can be classified based on their resolution or scope—from local measures that quantify properties of individual ROIs (nodes), to mesoscale measures describing clusters of interconnected ROIs, to global measures that describe whole-brain connectivity properties (Betzel and Bassett, 2017; Fornito et al., 2016) such as network communication in the brain (Graham et al., 2020) (Fig. 4b).”
§ Quantitative mapping of the brain’s structural connectivity using diffusion MRI tractography: A review > Performing quantitative analysis: methods for tractography quantification > Graph theoretical measures and advanced structural connectome measurements
What the sources say
- Supportedcites Betzel and Bassett, 2017 source
Section 3, “Multi-scale network analysis,” distinguishes local measures of individual nodes, global measures of the network as a whole, and an intermediate mesoscale characterized by clusters of nodes. This supports the cited classification by scope; the citing sentence’s ROIs are its application of the paper’s nodes. (LLM, conf=0.94)
- Not checked — no full text of the sourcecites Fornito et al., 2016 source
- Supportedcites Graham et al., 2020 source
Graham et al. is cited for the example ‘network communication in the brain,’ not for the preceding classification of graph measures, which is cited to other works. The editorial’s Abstract explicitly discusses communication across whole-brain networks, so it supports that example. (LLM, conf=0.93)
plain- Asserted: passes — The authors put it forward as true.
- Checkable: passes — It can be checked against evidence.
- Load-bearing: fails — The paper’s conclusions may not depend on it.
- Based: passes — The paper gives a reason why it holds.
Probably not a substantial claim. The paper’s conclusions may not depend on it.
- Supported
The cited sources support only part of this claim — read each source’s verdict below.
In the paper
“In light of these shortcomings, recent work has stated to focus on alternative models of connectome communication, such as network diffusion (Estrada and Hatano, 2008; Goñi et al., 2014), linear transmission models (Mišić et al., 2015), and navigation (Seguin et al., 2018) (see Avena-Koenigsberger et al., 2018 for a review).”
§ Quantitative mapping of the brain’s structural connectivity using diffusion MRI tractography: A review > Performing quantitative analysis: methods for tractography quantification > Graph theoretical measures and advanced structural connectome measurements
What the sources say
- Partly supportedcites Estrada and Hatano, 2008 sourceExperimental — accuracy not yet measured
The section “Communicability as the Green’s function of networks” (p. 4) explicitly interprets the model as particle diffusion on a complex network, supporting its citation as an alternative to shortest-path communication. The paper does not study connectomes specifically, so it does not support that setting-specific part of the sentence. (LLM, conf=0.83)
- Not matchedcites Goñi et al., 2014
Couldn’t be matched to a paper in Crossref, so it can’t be checked.
- Not matchedcites Mišić et al., 2015
Couldn’t be matched to a paper in Crossref, so it can’t be checked.
plain- Asserted: passes — The authors put it forward as true.
- Checkable: passes — It can be checked against evidence.
- Load-bearing: fails — The paper’s conclusions may not depend on it.
- Based: passes — The paper gives a reason why it holds.
Probably not a substantial claim. The paper’s conclusions may not depend on it.
- Partly supported
The cited sources support only part of this claim — read each source’s verdict below.
In the paper
“In addition, connectome networks are known to strike a balance between wiring minimization (shortest paths) and formation of connections between brain regions with similar connectivity profiles (homophily) (Betzel et al., 2016).”
§ Quantitative mapping of the brain’s structural connectivity using diffusion MRI tractography: A review > Performing quantitative analysis: methods for tractography quantification > Graph theoretical measures and advanced structural connectome measurements
What the sources say
- Partly supportedcites Betzel et al., 2016 sourceExperimental — accuracy not yet measured
The Results section reports that the best-fitting model combines a penalty against long-distance connections with a greater probability of connecting regions that have similar connectivity profiles. However, the parenthetical “shortest paths” is inaccurate: the paper describes minimizing physical wiring distance, and its Results > Geometric model section says forming only the shortest connections increases characteristic path length. (LLM, conf=0.88)
boostedcorrelational- Asserted: passes — The authors put it forward as true.
- Checkable: passes — It can be checked against evidence.
- Load-bearing: fails — The paper’s conclusions may not depend on it.
- Based: passes — The paper gives a reason why it holds.
Probably not a substantial claim. The paper’s conclusions may not depend on it.
- Partly supported
Every source the paper cites for this claim was checked and supports it.
In the paper
“For instance, despite the inherent limitations of dMRI tractography in resolving axonal fiber directionality, graph measures computed on the undirected human connectome can reveal patterns of asymmetric communication, as evidenced by significant associations to the directionality of effective connectivity computed using dynamic causal modeling (Seguin et al., 2019).”
§ Quantitative mapping of the brain’s structural connectivity using diffusion MRI tractography: A review > Performing quantitative analysis: methods for tractography quantification > Graph theoretical measures and advanced structural connectome measurements
What the sources say
- Supportedcites Seguin et al., 2019 source
The Introduction states that communication measures applied to undirected brain networks reveal send-receive asymmetries in the human cortex, and that these asymmetries are significantly associated with effective-connectivity directionality derived from dynamic causal modeling. The Results section, “Senders, receivers, and effective connectivity,” reports significant correlations across pairs of subsystems, with the stated exception of the seven-subsystem partition. (LLM, conf=0.95)
plaincorrelational- Asserted: passes — The authors put it forward as true.
- Checkable: passes — It can be checked against evidence.
- Load-bearing: passes — The paper’s conclusions depend on it.
- Based: passes — The paper gives a reason why it holds.
It may state two separate claims as one.
- Supported
The cited sources support only part of this claim — read each source’s verdict below.
In the paper
“However, algorithmically, the identification of shortest paths demands individual regions to possess global knowledge of structural connectivity, a requirement unlikely to be met in decentralized systems such as the brain (Avena-Koenigsberger et al., 2019; Goñi et al., 2014; Seguin et al., 2018).”
§ Quantitative mapping of the brain’s structural connectivity using diffusion MRI tractography: A review > Performing quantitative analysis: methods for tractography quantification > Graph theoretical measures and advanced structural connectome measurements
What the sources say
- Partly supportedcites Avena-Koenigsberger et al., 2019 sourceExperimental — accuracy not yet measured
The Introduction says that routing along shortest paths relies on all elements having information about the network’s global topology. The Discussion, however, calls it an open question how a brain system gains that information and raises the possibility that it learns about its topology through feedback; it does not establish that the requirement is unlikely to be met. (LLM, conf=0.86)
- Not matchedcites Goñi et al., 2014
Couldn’t be matched to a paper in Crossref, so it can’t be checked.
- Supportedcites Seguin et al., 2018 source
The introductory passage (listed under Abstract; page not provided) says that identifying shortest paths requires individual elements of nervous systems to possess global knowledge of network topology, and that this requirement is challenged because nervous systems are decentralized. The Discussion section, “Biological Plausibility and Communication Efficiency” (page not provided), likewise describes the centralized knowledge needed to compute optimal routes as biologically implausible. (LLM, conf=0.94)
hedgeddirect- Asserted: passes — The authors put it forward as true.
- Checkable: passes — It can be checked against evidence.
- Load-bearing: passes — The paper’s conclusions depend on it.
- Based: passes — The paper gives a reason why it holds.
It may state two separate claims as one.
- Partly supported
The cited sources that could be checked couldn’t confirm or dispute this claim.
In the paper
“Similar studies also show that the radial and tangential pathways organization are prominent at 17 weeks but gradually disappear at later gestational ages, and all major structural pathways are already identifiable by term (Takahashi et al., 2002).”
§ Quantitative mapping of the brain’s structural connectivity using diffusion MRI tractography: A review > Applications of quantitative tractography analysis > Developmental tractography of the brain
What the sources say
- Could not verifycites Takahashi et al., 2002 sourceExperimental — accuracy not yet measured
The Results describe diffusion imaging of excised larval sea lamprey spinal cords, and the Discussion describes their axonal anatomy. Neither addresses gestational age or whether major structural pathways are identifiable by term. Searches for 17 weeks, radial and tangential pathways, and fetal development found no supporting passage. (LLM, conf=0.78)
plain- Asserted: passes — The authors put it forward as true.
- Checkable: passes — It can be checked against evidence.
- Load-bearing: fails — The paper’s conclusions may not depend on it.
- Based: passes — The paper gives a reason why it holds.
Probably not a substantial claim. The paper’s conclusions may not depend on it.
- Could not verify
The cited sources that could be checked couldn’t confirm or dispute this claim.
In the paper
“Similar studies also show that the radial and tangential pathways organization are prominent at 17 weeks but gradually disappear at later gestational ages, and all major structural pathways are already identifiable by term (Takahashi et al., 2002).”
§ Quantitative mapping of the brain’s structural connectivity using diffusion MRI tractography: A review > Applications of quantitative tractography analysis > Developmental tractography of the brain
What the sources say
- Could not verifycites Takahashi et al., 2002 sourceExperimental — accuracy not yet measured
The Results and Discussion describe diffusion measurements in excised larval sea lamprey spinal cord; no page numbers are available in our copy. Searches for radial and tangential pathways, 17 gestational weeks, and pathways identifiable by term found no passage addressing fetal development. The lamprey findings therefore cannot verify the attributed claim. (LLM, conf=0.76)
plaincorrelational- Asserted: passes — The authors put it forward as true.
- Checkable: passes — It can be checked against evidence.
- Load-bearing: unclear — It is unclear whether the paper’s conclusions depend on it.
- Based: passes — The paper gives a reason why it holds.
It may state two separate claims as one.
- Could not verify
The cited sources support only part of this claim — read each source’s verdict below.
In the paper
“For instance, using ex vivo dMRI scans on fetal brain samples, researchers are able to identify the major tract parts of the fornix and cingulum bundles at 13 weeks, but a part of the corpus callosum at 15 weeks (Huang et al., 2009).”
§ Quantitative mapping of the brain’s structural connectivity using diffusion MRI tractography: A review > Applications of quantitative tractography analysis > Developmental tractography of the brain
What the sources say
- Partly supportedcites Huang et al., 2009 sourceExperimental — accuracy not yet measured
The Results (White matter tracts) say the fornix is appreciable as a major tract at 13 weeks and the corpus callosum appears at 15 weeks. But they say the cingulum bundle can be traced only after 17 weeks, not at 13 weeks. The supplied passages do not give page numbers. (LLM, conf=0.93)
plain- Asserted: passes — The authors put it forward as true.
- Checkable: passes — It can be checked against evidence.
- Load-bearing: unclear — It is unclear whether the paper’s conclusions depend on it.
- Based: passes — The paper gives a reason why it holds.
It may state two separate claims as one.
- Partly supported
The cited sources support only part of this claim — read each source’s verdict below.
In the paper
“Due to recent advances in methodological progress such as motion correction algorithms, in vivo tractography on the fetal brain has become available and exhibit highly agreement with ex vivo and neuroanatomical studies (Christiaens et al., 2021; Khan et al., 2019), which indicates strong potential for future prenatal brain investigations.”
§ Quantitative mapping of the brain’s structural connectivity using diffusion MRI tractography: A review > Applications of quantitative tractography analysis > Developmental tractography of the brain
What the sources say
- Partly supportedcites Christiaens et al., 2021 sourceExperimental — accuracy not yet measured
The Discussion reports that the motion-correction framework has proved effective in fetal data, supporting the methodological-progress part of the attribution. But this paper analyzes scans acquired after birth (Data and preprocessing) and does not report in vivo fetal tractography or compare it with ex vivo or neuroanatomical studies. (LLM, conf=0.85)
- Partly supportedcites Khan et al., 2019 sourceExperimental — accuracy not yet measured
The Introduction (Fetal DTI; page unavailable) reports that motion-corrected in utero DTI enabled fetal tractography. The Conclusion (page unavailable) says the authors’ atlas portrayed developmental trends seen in prior ex vivo and in utero studies, but it does not establish high agreement specifically between in vivo tractography and ex vivo or neuroanatomical studies. (LLM, conf=0.83)
boostedcorrelational- Asserted: passes — The authors put it forward as true.
- Checkable: passes — It can be checked against evidence.
- Load-bearing: unclear — It is unclear whether the paper’s conclusions depend on it.
- Based: passes — The paper gives a reason why it holds.
It may state two separate claims as one.
- Partly supported
The cited sources support only part of this claim — read each source’s verdict below.
In the paper
“revealing a typical spatial degeneration pattern across brain systems in which prefrontal association tracts are the most vulnerable to aging, while cingulum, temporal and parietal-occipital commissural connections are relatively preserved.”
§ Quantitative mapping of the brain’s structural connectivity using diffusion MRI tractography: A review > Applications of quantitative tractography analysis > Aging and lifespan tractography of the brain
What the sources say
- Partly supportedcites Davis et al., 2009 sourceExperimental — accuracy not yet measured
The Discussion (Anterior-Posterior Gradient; page unavailable) ranks age-related FA differences highest in the genu and uncinate fasciculus and lowest in the cingulum bundle and splenium, supporting greater vulnerability of anterior tracts and relative preservation of some connections. But the same section reports appreciable effects in the inferior longitudinal fasciculus, including a stronger effect in its occipito-temporal segment; the Results (Anterior-posterior trend analysis; page unavailable) also find age effects in the cingulum. The claim overstates preservation across the named connections. (LLM, conf=0.88)
- Not matchedcites Stadlbauer et al., 2008a
Couldn’t be matched to a paper in Crossref, so it can’t be checked.
- Partly supportedcites Sullivan et al., 2010 sourceExperimental — accuracy not yet measured
The Results (section 3.3) identify the frontal forceps as having the most prominent age-related FA decrease, and the Discussion (section 4) describes greater susceptibility in anterior than posterior bundles. But the proposed preservation is too broad: section 4 reports age-related changes in the superior cingulum, while section 3.4 reports significant age effects in temporal and parietal callosal sectors. Page numbers are unavailable in our copy. (LLM, conf=0.87)
plaindirect- Asserted: passes — The authors put it forward as true.
- Checkable: passes — It can be checked against evidence.
- Load-bearing: passes — The paper’s conclusions depend on it.
- Based: passes — The paper gives a reason why it holds.
It may state two separate claims as one.
- Partly supported
The cited sources support only part of this claim — read each source’s verdict below.
In the paper
“Many studies have discovered largely adult-like topological structures including significant small-world, modular, and rich-club organization during the middle to final trimester of gestation”
§ Quantitative mapping of the brain’s structural connectivity using diffusion MRI tractography: A review > Applications of quantitative tractography analysis > Developmental tractography of the brain
What the sources say
- Not checked — no full text of the sourcecites Brown et al., 2014 source
- Partly supportedcites Song et al., 2017 sourceExperimental — accuracy not yet measured
The Results report small-world organization in fetal structural networks at 20, 35, and 40 postmenstrual weeks (Figures 6–7; page not provided). The passages do not establish modular or rich-club organization, or characterize the topology as broadly adult-like. (LLM, conf=0.88)
- Partly supportedcites Tymofiyeva et al., 2013 sourceExperimental — accuracy not yet measured
The Results (Changes in Global Topological Properties with Age) report small-world properties at all studied ages and assess modularity. But the study examined premature and term-born neonates, infants, and adults—not fetuses during gestation—and the cited passages do not establish rich-club organization or statistical significance for every claimed property. (LLM, conf=0.86)
boostedcorrelational- Asserted: passes — The authors put it forward as true.
- Checkable: passes — It can be checked against evidence.
- Load-bearing: unclear — It is unclear whether the paper’s conclusions depend on it.
- Based: passes — The paper gives a reason why it holds.
It may state two separate claims as one.
The cited sources support only part of this claim — read each source’s verdict below.
In the paper
“tractography studies show that the basic layouts of the brain’s structural network are largely preserved until old age, such as the economical small-world character, the modular organization and rich club organization”
§ Quantitative mapping of the brain’s structural connectivity using diffusion MRI tractography: A review > Applications of quantitative tractography analysis > Aging and lifespan tractography of the brain
What the sources say
- Not matchedcites Gong et al., 2009b
Couldn’t be matched to a paper in Crossref, so it can’t be checked.
- Not matchedcites Li et al., 2020c
Couldn’t be matched to a paper in Crossref, so it can’t be checked.
- Partly supportedcites Wen et al., 2011 sourceExperimental — accuracy not yet measured
The Small-world properties section reports that all studied subjects’ structural networks had small-world architecture, and the Discussion says this property was preserved despite individual variation. The paper does not establish preservation across the lifespan until old age, and the passages found do not report preserved modular or rich-club organization. (LLM, conf=0.88)
plain- Asserted: passes — The authors put it forward as true.
- Checkable: passes — It can be checked against evidence.
- Load-bearing: unclear — It is unclear whether the paper’s conclusions depend on it.
- Based: passes — The paper gives a reason why it holds.
It may state two separate claims as one.
- Not matched
The sources with a verdict support this claim; the rest weren’t checked yet, have no full text we could read, or their verdicts aren’t rated yet.
In the paper
“although most tracts show increased FA during childhood and adolescence and decreased FA at older ages”
§ Quantitative mapping of the brain’s structural connectivity using diffusion MRI tractography: A review > Applications of quantitative tractography analysis > Aging and lifespan tractography of the brain
What the sources say
- Supportedcites Hasan et al., 2010 source
The Results, under “Age effects” (page not supplied), report an inverted U-shaped FA trajectory for all measured pathways in both males and females. This supports increasing FA at younger ages followed by decreasing FA at older ages within the study’s 6–68-year age range. (LLM, conf=0.93)
- Not matchedcites 2009b
Couldn’t be matched to a paper in Crossref, so it can’t be checked.
- Not checked — no full text of the sourcecites Lebel et al., 2010 source
plaindirect- Asserted: passes — The authors put it forward as true.
- Checkable: passes — It can be checked against evidence.
- Load-bearing: unclear — It is unclear whether the paper’s conclusions depend on it.
- Based: passes — The paper gives a reason why it holds.
It may state two separate claims as one.
- Supported
The cited sources support only part of this claim — read each source’s verdict below.
In the paper
“After birth until adulthood, the brain network reshapes to improve integration capacity with the reconfigurations of decreased modularity and decreased small-worldness”
§ Quantitative mapping of the brain’s structural connectivity using diffusion MRI tractography: A review > Applications of quantitative tractography analysis > Developmental tractography of the brain
What the sources say
- Partly supportedcites Chen et al., 2013 sourceExperimental — accuracy not yet measured
The Results (Global network properties and their age-related trajectories; page unavailable) report increased global efficiency and decreased modularity from early to late childhood, with both measures then stabilizing. The Results (Small-world efficiency of developing WM networks; page unavailable) show small-worldness values that fluctuate across age groups rather than a sustained decrease. The study begins at age 6, so it does not establish a trajectory from birth. (LLM, conf=0.88)
- Partly supportedcites Dennis et al., 2013 sourceExperimental — accuracy not yet measured
The Discussion reports decreasing small-worldness and modularity with age and says the network changes suggest increased structural integration. But the study examined people aged 12–30, so it does not establish that this pattern occurs throughout the period from birth to adulthood. (LLM, conf=0.87)
- Partly supportedcites Hagmann et al., 2010 sourceExperimental — accuracy not yet measured
The Results report increasing network efficiency and a generally decreasing small-world index with age. But the Modularity and Module Composition results say modularity showed no consistent significant age trend, rather than a decrease. The study examined ages 2–18, not the full period from birth to adulthood. (LLM, conf=0.91)
plaindirect- Asserted: passes — The authors put it forward as true.
- Checkable: passes — It can be checked against evidence.
- Load-bearing: unclear — It is unclear whether the paper’s conclusions depend on it.
- Based: passes — The paper gives a reason why it holds.
It may state two separate claims as one.
- Partly supported
Every source the paper cites for this claim was checked and supports it.
In the paper
“For instance, in Parkinson’s disease, researchers found that DBS on sub-thalamic nucleus linking to the supplementary motor area is associated with improvement in bradykinesia and rigidity, while DBS on nucleus structurally commenting to M1 is associated with improvement in tremor (Akram et al., 2017).”
§ Quantitative mapping of the brain’s structural connectivity using diffusion MRI tractography: A review > Applications of quantitative tractography analysis > Tractography in neurosurgery
What the sources say
- Supportedcites Akram et al., 2017 source
Split into 2 atoms — 2 confirmed, 0 partially supported, 0 disputed, 0 misattributed, 0 unverifiable. Expand the claim to see per-atom verdicts.
plaincorrelational- Asserted: passes — The authors put it forward as true.
- Checkable: passes — It can be checked against evidence.
- Load-bearing: passes — The paper’s conclusions depend on it.
- Based: passes — The paper gives a reason why it holds.
It may state two separate claims as one.
- Supported
Every source the paper cites for this claim was checked and supports it.
In the paper
“Therefore, tractography in native space becomes suitable for MS patients because it is free of registration and allows inter-subject variability of tract location and shape (Lipp et al., 2020).”
§ Quantitative mapping of the brain’s structural connectivity using diffusion MRI tractography: A review > Applications of quantitative tractography analysis > Tractography in neurological and mental brain disorders
What the sources say
- Supportedcites Lipp et al., 2020 source
The Methods (Data analysis) state that tractography was performed in native space for MS patients. The Introduction contrasts individual tractography with probability-map methods that require inter-subject registration and assume consistent tract anatomy; the Discussion (Anatomical generalisability) says tractography is robust to individual differences in tract size and shape. Thus, “free of registration” is supported in the sense of not requiring inter-subject registration for native-space tractography, not as a claim that the study performed no registration for other analyses. (LLM, conf=0.87)
plaindirect- Asserted: passes — The authors put it forward as true.
- Checkable: passes — It can be checked against evidence.
- Load-bearing: passes — The paper’s conclusions depend on it.
- Based: passes — The paper gives a reason why it holds.
It may state two separate claims as one.
- Supported
Every source the paper cites for this claim was checked and supports it.
In the paper
“Furthermore, connectomic neuromodulation may contribute to identifying specific networks that lead to symptom-specific treatments, paving the way for personalized therapy (Horn and Fox, 2020).”
§ Quantitative mapping of the brain’s structural connectivity using diffusion MRI tractography: A review > Applications of quantitative tractography analysis > Tractography in neurosurgery
What the sources say
- Supportedcites Horn and Fox, 2020 source
Opportunity #3 (“symptom specific networks”) explicitly says connectomic neuromodulation may identify networks that lead to symptom-specific treatments and that stimulating different networks for different symptoms could pave the way for personalized therapy. The citing sentence preserves the paper’s tentative wording. (LLM, conf=0.95)
hedgedconditional- Asserted: passes — The authors put it forward as true.
- Checkable: passes — It can be checked against evidence.
- Load-bearing: fails — The paper’s conclusions may not depend on it.
- Based: passes — The paper gives a reason why it holds.
Probably not a substantial claim. The paper’s conclusions may not depend on it.
- Supported
The cited sources support only part of this claim — read each source’s verdict below.
In the paper
“The reconstructed streamlines are only simulated entities that do not correspond directly to nerve fibers (Jeurissen et al., 2019; Yeh et al., 2020)”
§ Quantitative mapping of the brain’s structural connectivity using diffusion MRI tractography: A review > Discussion and conclusion
What the sources say
- Supportedcites Jeurissen et al., 2019 source
Section 2.3, “The virtual nature of fiber tracking,” explicitly distinguishes physical nerve fibers from reconstructed streamlines, calling the latter virtual entities related only indirectly to nerve fibers. This supports the citing sentence’s paraphrase. (LLM, conf=0.95)
- Not matchedcites Yeh et al., 2020
Couldn’t be matched to a paper in Crossref, so it can’t be checked.
plain- Asserted: passes — The authors put it forward as true.
- Checkable: passes — It can be checked against evidence.
- Load-bearing: passes — The paper’s conclusions depend on it.
- Based: passes — The paper gives a reason why it holds.
It may state two separate claims as one.
- Supported
Every source the paper cites for this claim was checked and supports it.
In the paper
“clinical studies frequently employ advanced tractography methods to reconstruct individual tract streamlines (Sbardella et al., 2013) and obtain feasible results even when brain lesions are present (Lipp et al., 2020).”
§ Quantitative mapping of the brain’s structural connectivity using diffusion MRI tractography: A review > Applications of quantitative tractography analysis > Tractography in neurological and mental brain disorders
What the sources say
- Supportedcites Sbardella et al., 2013 source
The Introduction (page not provided) describes three-dimensional tractography as reconstructing white-matter pathways by tracking fibers and discusses more sophisticated tracking approaches. This supports the tract-reconstruction point attributed to Sbardella et al.; the separate claim about feasible results in the presence of lesions is attributed to Lipp et al., not to this source. (LLM, conf=0.88)
- Supportedcites Lipp et al., 2020 source
The Lipp citation supports the clause about obtaining feasible results in the presence of lesions. In the Discussion and Conclusions, the paper reports successful individual tract segmentation in a large cohort with MS lesions and says this is feasible even in large-scale clinical studies. The preceding claim about how frequently clinical studies use advanced methods is attached to a different citation. (LLM, conf=0.91)
plain- Asserted: passes — The authors put it forward as true.
- Checkable: passes — It can be checked against evidence.
- Load-bearing: passes — The paper’s conclusions depend on it.
- Based: passes — The paper gives a reason why it holds.
It may state two separate claims as one.
- Rests on an assumption: Pathological lesions of MS hinder basic tract reconstruction.
- Supported
Every source the paper cites for this claim was checked and supports it.
In the paper
“basic diffusion metrics are only inferences based on local diffusion properties, which are not direct measures of tissue properties (Assaf et al., 2019).”
§ Quantitative mapping of the brain’s structural connectivity using diffusion MRI tractography: A review > Discussion and conclusion
What the sources say
- Supportedcites Assaf et al., 2019 source
In “Local measures of white matter microstructure,” the paper says basic diffusion parameters reflect local microstructure but have no one-to-one relationship with underlying tissue structure. It also says common DTI indices are nonspecific to any particular tissue compartment, supporting the distinction between diffusion-based inference and direct tissue measurement. (LLM, conf=0.92)
plain- Asserted: passes — The authors put it forward as true.
- Checkable: passes — It can be checked against evidence.
- Load-bearing: passes — The paper’s conclusions depend on it.
- Based: passes — The paper gives a reason why it holds.
It may state two separate claims as one.
- Supported
Every source the paper cites for this claim was checked and supports it.
In the paper
“The anatomical accuracy of tractography is an ongoing issue in quantitative tractography analysis, where both false positive and false negative tractography results pose challenges (Maier-Hein et al., 2017; Thomas et al., 2014).”
§ Quantitative mapping of the brain’s structural connectivity using diffusion MRI tractography: A review > Discussion and conclusion
What the sources say
- Supportedcites Maier-Hein et al., 2017 source
The Results sections report many invalid connections and bundles (false positives), while no submission recovered all 25 ground-truth bundles and average bundle-volume overlap was only 36% (missed connections or portions of bundles). The Discussion describes tractography’s ambiguity as an open challenge. Page numbers are not available in our copy. (LLM, conf=0.91)
- Supportedcites Thomas et al., 2014 source
The Discussion reports that tractography methods with high sensitivity tend to have low specificity and a high rate of false positives. It also explicitly describes missed tracer-labeled regions as false negatives and concludes that anatomical accuracy remains suboptimal even under ideal experimental conditions. (LLM, conf=0.93)
plain- Asserted: passes — The authors put it forward as true.
- Checkable: passes — It can be checked against evidence.
- Load-bearing: passes — The paper’s conclusions depend on it.
- Based: passes — The paper gives a reason why it holds.
It may state two separate claims as one.
- Supported
A result the paper reports from its own data — it cites no other source for it, so there is none to check. The quote shows it is in the paper.
In the paper
“the fact it can be trivially demonstrated that both that streamline count can be erroneously modulated in the absence of a difference in connection strength and erroneously constant in the presence of a difference in connection strength (Figs. 2, 3)”
§ Quantitative mapping of the brain’s structural connectivity using diffusion MRI tractography: A review > Improving tractography quality: methods for tractography correction > Connection density biases
boosted- Asserted: passes — The authors put it forward as true.
- Checkable: passes — It can be checked against evidence.
- Load-bearing: passes — The paper’s conclusions depend on it.
- Based: passes — The paper gives a reason why it holds.
It may state two separate claims as one.
In the paper
“Even operating on high-resolution dMRI data, current tractography algorithms have been shown to deviate from the ground-truth fiber projections derived from histological staining, with greater streamline densities at gyral crowns than sulcal banks (Schilling et al., 2018b).”
§ Quantitative mapping of the brain’s structural connectivity using diffusion MRI tractography: A review > Improving tractography quality: methods for tractography correction > Gyral bias
What the sources say
- Not matchedcites Schilling et al., 2018b
Couldn’t be matched to a paper in Crossref, so it can’t be checked.
boostedcorrelational- Asserted: passes — The authors put it forward as true.
- Checkable: passes — It can be checked against evidence.
- Load-bearing: passes — The paper’s conclusions depend on it.
- Based: passes — The paper gives a reason why it holds.
It may state two separate claims as one.
- Not matched
In the paper
“these “weights” represent an effective cross-sectional area of each streamline, which can be utilized as a direct measure of connection density (Smith et al., 2020a)”
§ Quantitative mapping of the brain’s structural connectivity using diffusion MRI tractography: A review > Improving tractography quality: methods for tractography correction > Connection density biases
What the sources say
- Not matchedcites Smith et al., 2020a
Couldn’t be matched to a paper in Crossref, so it can’t be checked.
plaincorrelational- Asserted: passes — The authors put it forward as true.
- Checkable: passes — It can be checked against evidence.
- Load-bearing: passes — The paper’s conclusions depend on it.
- Based: passes — The paper gives a reason why it holds.
It may state two separate claims as one.
- Not matched
In the paper
“This strategy implicitly assumes a correlation between the strength of a reconstructed edge and its validity, which can be violated in a range of ways due to the errors produced by streamlines tractography not being simply random variance.”
§ Quantitative mapping of the brain’s structural connectivity using diffusion MRI tractography: A review > Improving tractography quality: methods for tractography correction > False positive connections
What the sources say
- Not checked — no full text of the sourcecites Fornito et al., 2016 source
plaincorrelational- Asserted: passes — The authors put it forward as true.
- Checkable: passes — It can be checked against evidence.
- Load-bearing: passes — The paper’s conclusions depend on it.
- Based: passes — The paper gives a reason why it holds.
It may state two separate claims as one.
None of the sources cited for this claim have been checked yet.
In the paper
“The third point is that anatomical tract identification results can be highly variable across studies due to a lack of consistent fiber tract definitions, where different methods may give different results for the same target anatomical fiber tracts (Dick and Tremblay, 2012; Rheault et al., 2020a; Schilling et al., 2020b).”
§ Quantitative mapping of the brain’s structural connectivity using diffusion MRI tractography: A review > Defining regions for quantitation: methods for tractography segmentation > Anatomical tract identification
What the sources say
- Not checked — no full text of the sourcecites Dick and Tremblay, 2012 source
- Not matchedcites Rheault et al., 2020a
Couldn’t be matched to a paper in Crossref, so it can’t be checked.
- Not matchedcites Schilling et al., 2020b
Couldn’t be matched to a paper in Crossref, so it can’t be checked.
plaindirect- Asserted: passes — The authors put it forward as true.
- Checkable: passes — It can be checked against evidence.
- Load-bearing: passes — The paper’s conclusions depend on it.
- Based: passes — The paper gives a reason why it holds.
It may state two separate claims as one.
The paper states this without a source or data behind it here, so there is nothing to check it against. The quote shows it is in the paper.
In the paper
“tract-specific tractography may be more computationally efficient if the number of tracts of interest is small, while whole-brain tractography can be computationally expensive but enables tract identification or parcellation of the whole white matter.”
§ Quantitative mapping of the brain’s structural connectivity using diffusion MRI tractography: A review > Defining regions for quantitation: methods for tractography segmentation > Anatomical tract identification
plaindirect- Asserted: passes — The authors put it forward as true.
- Checkable: passes — It can be checked against evidence.
- Load-bearing: unclear — It is unclear whether the paper’s conclusions depend on it.
- Based: passes — The paper gives a reason why it holds.
It may state two separate claims as one.
A conclusion the paper draws from its own results — it cites no other source for it, so there is none to check. The quote shows it is in the paper.
In the paper
“Most of the direct segmentation approaches use a training tract segmentation dataset and thus may not require image registration or require a small amount of work for registration (e.g., a rigid volumetric registration); however, we note that curation of a training tract segmentation dataset may require extensive work compared to performing image registration.”
§ Quantitative mapping of the brain’s structural connectivity using diffusion MRI tractography: A review > Defining regions for quantitation: methods for tractography segmentation > Anatomical tract identification
hedgedconditional- Asserted: passes — The authors put it forward as true.
- Checkable: passes — It can be checked against evidence.
- Load-bearing: fails — The paper’s conclusions may not depend on it.
- Based: passes — The paper gives a reason why it holds.
Probably not a substantial claim. The paper’s conclusions may not depend on it. It may state two separate claims as one.
A conclusion the paper draws from its own results — it cites no other source for it, so there is none to check. The quote shows it is in the paper.
In the paper
“however, no consensus has been reached given that many existing tract identification methods have not been compared.”
§ Quantitative mapping of the brain’s structural connectivity using diffusion MRI tractography: A review > Defining regions for quantitation: methods for tractography segmentation > Anatomical tract identification
plaindirect- Asserted: passes — The authors put it forward as true.
- Checkable: passes — It can be checked against evidence.
- Load-bearing: unclear — It is unclear whether the paper’s conclusions depend on it.
- Based: passes — The paper gives a reason why it holds.
It may state two separate claims as one.
The paper states this without a source or data behind it here, so there is nothing to check it against. The quote shows it is in the paper.
In the paper
“tract-specific tractography may be more computationally efficient if the number of tracts of interest is small, while whole-brain tractography can be computationally expensive but enables tract identification or parcellation of the whole white matter.”
§ Quantitative mapping of the brain’s structural connectivity using diffusion MRI tractography: A review > Defining regions for quantitation: methods for tractography segmentation > Anatomical tract identification
hedgedconditional- Asserted: passes — The authors put it forward as true.
- Checkable: passes — It can be checked against evidence.
- Load-bearing: fails — The paper’s conclusions may not depend on it.
- Based: passes — The paper gives a reason why it holds.
Probably not a substantial claim. The paper’s conclusions may not depend on it.
In the paper
“but with more modern multi-fiber tractography, reproducibility is lower, potentially due to the increase in spurious streamlines (Rheault et al., 2020a).”
§ Quantitative mapping of the brain’s structural connectivity using diffusion MRI tractography: A review > Defining regions for quantitation: methods for tractography segmentation > Anatomical tract identification
What the sources say
- Not matchedcites Rheault et al., 2020a
Couldn’t be matched to a paper in Crossref, so it can’t be checked.
hedgedconditional- Asserted: passes — The authors put it forward as true.
- Checkable: passes — It can be checked against evidence.
- Load-bearing: unclear — It is unclear whether the paper’s conclusions depend on it.
- Based: passes — The paper gives a reason why it holds.
It may state two separate claims as one.
- Not matched
A conclusion the paper draws from its own results — it cites no other source for it, so there is none to check. The quote shows it is in the paper.
In the paper
“While using streamline-based registration can avoid the intermodality registration issue in ROI-based methods, streamline registration (especially a nonlinear registration) may be computationally heavier than volumetric registration.”
§ Quantitative mapping of the brain’s structural connectivity using diffusion MRI tractography: A review > Defining regions for quantitation: methods for tractography segmentation > Anatomical tract identification
hedgedconditional- Asserted: passes — The authors put it forward as true.
- Checkable: passes — It can be checked against evidence.
- Load-bearing: unclear — It is unclear whether the paper’s conclusions depend on it.
- Based: passes — The paper gives a reason why it holds.
It may state two separate claims as one.
None of the sources cited for this claim could be matched to a paper in Crossref, so there is nothing to check it against.
In the paper
“They parcellate tractography according to a cortical (and sometimes a subcortical) gray matter parcellation, focusing on the structural connectivity among different gray matter ROIs (Bassett and Bullmore, 2017; Bullmore and Sporns, 2009a; Gong et al., 2009a; Ingalhalikar et al., 2014; Sporns et al., 2005; Yeh et al., 2016b; Zalesky et al., 2012).”
§ Quantitative mapping of the brain’s structural connectivity using diffusion MRI tractography: A review > Defining regions for quantitation: methods for tractography segmentation > Parcellation of the whole-brain tractogram
What the sources say
- Not matchedcites Bassett and Bullmore, 2017
Couldn’t be matched to a paper in Crossref, so it can’t be checked.
- Not matchedcites Bullmore and Sporns, 2009a
Couldn’t be matched to a paper in Crossref, so it can’t be checked.
- Not matchedcites Gong et al., 2009a
Couldn’t be matched to a paper in Crossref, so it can’t be checked.
plain- Asserted: passes — The authors put it forward as true.
- Checkable: passes — It can be checked against evidence.
- Load-bearing: fails — The paper’s conclusions may not depend on it.
- Based: passes — The paper gives a reason why it holds.
Probably not a substantial claim. The paper’s conclusions may not depend on it.
- Not matched
None of the sources cited for this claim could be matched to a paper in Crossref, so there is nothing to check it against.
In the paper
“Though relatively less used, fiber clustering tractography parcellation methods are increasingly applied to study the brain’s structural connectivity in applications such as disease classification and between-population statistical analysis (Feng et al., 2020; Ji et al., 2019; Wu et al., 2018; Zhang et al., 2018a; 2018b).”
§ Quantitative mapping of the brain’s structural connectivity using diffusion MRI tractography: A review > Defining regions for quantitation: methods for tractography segmentation > Parcellation of the whole-brain tractogram
What the sources say
- Not matchedcites Feng et al., 2020
Couldn’t be matched to a paper in Crossref, so it can’t be checked.
- Not matchedcites Ji et al., 2019
Couldn’t be matched to a paper in Crossref, so it can’t be checked.
- Not matchedcites Wu et al., 2018
Couldn’t be matched to a paper in Crossref, so it can’t be checked.
plaincorrelational- Asserted: passes — The authors put it forward as true.
- Checkable: passes — It can be checked against evidence.
- Load-bearing: unclear — It is unclear whether the paper’s conclusions depend on it.
- Based: passes — The paper gives a reason why it holds.
It may state two separate claims as one.
- Not matched
The paper states this without a source or data behind it here, so there is nothing to check it against. The quote shows it is in the paper.
In the paper
“(Note that a whole-brain tractogram is required for filtering (Sections 3.3 and 5.3) and analyses of the brain as a network using a connectivity matrix (Sections 5.5 and 5.6)).”
§ Quantitative mapping of the brain’s structural connectivity using diffusion MRI tractography: A review > Defining regions for quantitation: methods for tractography segmentation > Anatomical tract identification
plaindirect- Asserted: passes — The authors put it forward as true.
- Checkable: passes — It can be checked against evidence.
- Load-bearing: fails — The paper’s conclusions may not depend on it.
- Based: passes — The paper gives a reason why it holds.
Probably not a substantial claim. The paper’s conclusions may not depend on it. It may state two separate claims as one.
The paper states this without a source or data behind it here, so there is nothing to check it against. The quote shows it is in the paper.
In the paper
“In this category of measures, tractography is generally used to define the locations in which microstructural measures are sampled.”
§ Quantitative mapping of the brain’s structural connectivity using diffusion MRI tractography: A review > Performing quantitative analysis: methods for tractography quantification > Quantitative measures computed from tractography
plaindirect- Asserted: passes — The authors put it forward as true.
- Checkable: passes — It can be checked against evidence.
- Load-bearing: fails — The paper’s conclusions may not depend on it.
- Based: passes — The paper gives a reason why it holds.
Probably not a substantial claim. The paper’s conclusions may not depend on it.
The paper states this without a source or data behind it here, so there is nothing to check it against. The quote shows it is in the paper.
In the paper
“There are many quantitative measures that can be computed from tractography, which can be subdivided into two categories based on the source of data used to compute the measures.”
§ Quantitative mapping of the brain’s structural connectivity using diffusion MRI tractography: A review > Performing quantitative analysis: methods for tractography quantification > Quantitative measures computed from tractography
plain- Asserted: passes — The authors put it forward as true.
- Checkable: passes — It can be checked against evidence.
- Load-bearing: fails — The paper’s conclusions may not depend on it.
- Based: passes — The paper gives a reason why it holds.
Probably not a substantial claim. The paper’s conclusions may not depend on it.
A conclusion the paper draws from its own results — it cites no other source for it, so there is none to check. The quote shows it is in the paper.
In the paper
“Specifically, tractography segmentation is performed by extracting streamlines that connect pairs of ROIs. Therefore the resulting tractography segmentation is mainly determined by the selection of a cortical parcellation scheme.”
§ Quantitative mapping of the brain’s structural connectivity using diffusion MRI tractography: A review > Defining regions for quantitation: methods for tractography segmentation > Parcellation of the whole-brain tractogram
plaindirect- Asserted: passes — The authors put it forward as true.
- Checkable: passes — It can be checked against evidence.
- Load-bearing: unclear — It is unclear whether the paper’s conclusions depend on it.
- Based: passes — The paper gives a reason why it holds.
It may state two separate claims as one.
The paper states this without a source or data behind it here, so there is nothing to check it against. The quote shows it is in the paper.
In the paper
“The second category of quantitative measures computed from tractography leverages microstructural measures that are usually computed from a diffusion model (e.g., diffusion tensor model) or another quantitative imaging modality (e.g., myelin imaging).”
§ Quantitative mapping of the brain’s structural connectivity using diffusion MRI tractography: A review > Performing quantitative analysis: methods for tractography quantification > Quantitative measures computed from tractography
plain- Asserted: passes — The authors put it forward as true.
- Checkable: passes — It can be checked against evidence.
- Load-bearing: fails — The paper’s conclusions may not depend on it.
- Based: passes — The paper gives a reason why it holds.
Probably not a substantial claim. The paper’s conclusions may not depend on it.
In the paper
“Popularly used diffusion-modeling-based microstructural measures include the fractional anisotropy, axial, radial and mean diffusivities (FA, AD, RD and MD respectively) derived from traditional diffusion tensor model (Basser and Pierpaoli, 1996).”
§ Quantitative mapping of the brain’s structural connectivity using diffusion MRI tractography: A review > Performing quantitative analysis: methods for tractography quantification > Quantitative measures computed from tractography
What the sources say
- Not checked — no full text of the sourcecites Basser and Pierpaoli, 1996 source
plain- Asserted: passes — The authors put it forward as true.
- Checkable: passes — It can be checked against evidence.
- Load-bearing: fails — The paper’s conclusions may not depend on it.
- Based: passes — The paper gives a reason why it holds.
Probably not a substantial claim. The paper’s conclusions may not depend on it.
None of the sources cited for this claim could be matched to a paper in Crossref, so there is nothing to check it against.
In the paper
“Another hypothesis-driven analysis uses a regression model (e.g., a generalized linear model (Dobson and Barnett, 2018) or support vector regression (Zhang and O’Donnell, 2020)) to assess correlation of the tract quantitative measurement and a behavioral or a disease symptom score.”
§ Quantitative mapping of the brain’s structural connectivity using diffusion MRI tractography: A review > Performing quantitative analysis: methods for tractography quantification > Tract-specific analysis using statistical or machine learning techniques
What the sources say
- Not matchedcites Dobson and Barnett, 2018
Couldn’t be matched to a paper in Crossref, so it can’t be checked.
- Not matchedcites Zhang and O’Donnell, 2020
Couldn’t be matched to a paper in Crossref, so it can’t be checked.
plaincorrelational- Asserted: passes — The authors put it forward as true.
- Checkable: passes — It can be checked against evidence.
- Load-bearing: fails — The paper’s conclusions may not depend on it.
- Based: passes — The paper gives a reason why it holds.
Probably not a substantial claim. The paper’s conclusions may not depend on it.
- Not matched
The paper states this without a source or data behind it here, so there is nothing to check it against. The quote shows it is in the paper.
In the paper
“Two main strategies can be employed: using a scalar value as a summary statistic, or using data along the length of the fiber pathway.”
§ Quantitative mapping of the brain’s structural connectivity using diffusion MRI tractography: A review > Performing quantitative analysis: methods for tractography quantification > Domain of analysis: extraction of quantitative measures within white matter fiber pathways
plain- Asserted: passes — The authors put it forward as true.
- Checkable: passes — It can be checked against evidence.
- Load-bearing: fails — The paper’s conclusions may not depend on it.
- Based: passes — The paper gives a reason why it holds.
Probably not a substantial claim. The paper’s conclusions may not depend on it. It may state two separate claims as one.
The paper states this without a source or data behind it here, so there is nothing to check it against. The quote shows it is in the paper.
In the paper
“The second strategy to quantify an individual fiber pathway is to measure the distribution of the microstructural measures along the fiber pathway.”
§ Quantitative mapping of the brain’s structural connectivity using diffusion MRI tractography: A review > Performing quantitative analysis: methods for tractography quantification > Domain of analysis: extraction of quantitative measures within white matter fiber pathways
plain- Asserted: passes — The authors put it forward as true.
- Checkable: passes — It can be checked against evidence.
- Load-bearing: fails — The paper’s conclusions may not depend on it.
- Based: passes — The paper gives a reason why it holds.
Probably not a substantial claim. The paper’s conclusions may not depend on it.
None of the sources cited for this claim have been checked yet.
In the paper
“In particular, because of their flexible implementations, COMMIT, COMMIT2 and COMMIT2tree allow complementing tractography with biophysical models of the tissue microstructure and, thus, enable one to access more quantitative and biologically informative features of individual bundles, such as average axon diameter (Barakovic et al., 2018), myelin content (Schiavi et al., 2019) and bundle-specific”
§ Quantitative mapping of the brain’s structural connectivity using diffusion MRI tractography: A review > Performing quantitative analysis: methods for tractography quantification > Quantitative measures using filtering techniques
What the sources say
- Not matchedcites Barakovic et al., 2018
Couldn’t be matched to a paper in Crossref, so it can’t be checked.
- Not checked — no full text of the sourcecites Schiavi et al., 2019
- Not matchedcites Barakovic et al., 2021b
Couldn’t be matched to a paper in Crossref, so it can’t be checked.
plaindirect- Asserted: passes — The authors put it forward as true.
- Checkable: passes — It can be checked against evidence.
- Load-bearing: unclear — It is unclear whether the paper’s conclusions depend on it.
- Based: passes — The paper gives a reason why it holds.
It may state two separate claims as one.
- The authors state this as an assumption: The microstructure properties corresponding to a single streamline (or a group of axons following the same trajectory) remain constant along its path on average at achievable resolution.
- Not matched
None of the sources cited for this claim could be matched to a paper in Crossref, so there is nothing to check it against.
In the paper
“Other summary statistics such as the median, maximum and minimum have also been employed (Boshkovski et al., 2020b; Zhang et al., 2018a; 2018b).”
§ Quantitative mapping of the brain’s structural connectivity using diffusion MRI tractography: A review > Performing quantitative analysis: methods for tractography quantification > Domain of analysis: extraction of quantitative measures within white matter fiber pathways
What the sources say
- Not matchedcites Boshkovski et al., 2020b
Couldn’t be matched to a paper in Crossref, so it can’t be checked.
- Not matchedcites Zhang et al., 2018a
Couldn’t be matched to a paper in Crossref, so it can’t be checked.
- Not matchedcites Zhang et al., 2018b
Couldn’t be matched to a paper in Crossref, so it can’t be checked.
plain- Asserted: passes — The authors put it forward as true.
- Checkable: passes — It can be checked against evidence.
- Load-bearing: fails — The paper’s conclusions may not depend on it.
- Based: passes — The paper gives a reason why it holds.
Probably not a substantial claim. The paper’s conclusions may not depend on it.
- Not matched
None of the sources cited for this claim could be matched to a paper in Crossref, so there is nothing to check it against.
In the paper
“For example, compared to the mean statistic, studies have shown that the median can be more robust against outliers and does not rely on the normality assumption for the distribution of the microstructure parameter along a streamline (Boshkovski et al., 2020b; Zhang et al., 2018b).”
§ Quantitative mapping of the brain’s structural connectivity using diffusion MRI tractography: A review > Performing quantitative analysis: methods for tractography quantification > Domain of analysis: extraction of quantitative measures within white matter fiber pathways
What the sources say
- Not matchedcites Boshkovski et al., 2020b
Couldn’t be matched to a paper in Crossref, so it can’t be checked.
- Not matchedcites Zhang et al., 2018b
Couldn’t be matched to a paper in Crossref, so it can’t be checked.
plain- Asserted: passes — The authors put it forward as true.
- Checkable: passes — It can be checked against evidence.
- Load-bearing: unclear — It is unclear whether the paper’s conclusions depend on it.
- Based: passes — The paper gives a reason why it holds.
It may state two separate claims as one.
- Not matched
None of the sources cited for this claim could be matched to a paper in Crossref, so there is nothing to check it against.
In the paper
“These methods have been used to investigate properties of healthy and pathological brains, showing better performance than the standard NOS (Schiavi et al., 2020b; Smith et al., 2015a; Yeatman et al., 2014b).”
§ Quantitative mapping of the brain’s structural connectivity using diffusion MRI tractography: A review > Performing quantitative analysis: methods for tractography quantification > Quantitative measures using filtering techniques
What the sources say
- Not matchedcites Schiavi et al., 2020b
Couldn’t be matched to a paper in Crossref, so it can’t be checked.
- Not matchedcites Smith et al., 2015a
Couldn’t be matched to a paper in Crossref, so it can’t be checked.
- Not matchedcites Yeatman et al., 2014b
Couldn’t be matched to a paper in Crossref, so it can’t be checked.
plaincorrelational- Asserted: passes — The authors put it forward as true.
- Checkable: passes — It can be checked against evidence.
- Load-bearing: unclear — It is unclear whether the paper’s conclusions depend on it.
- Based: passes — The paper gives a reason why it holds.
It may state two separate claims as one.
- The authors state this as an assumption: The microstructure properties corresponding to a single streamline (or a group of axons following the same trajectory) remain constant along its path on average at achievable resolution.
- Not matched
In the paper
“While in its original implementation SIFT (Smith et al., 2013) provides only the NOS adjusted based on voxel-wise spherical deconvolution, its evolution SIFT2 (Smith et al., 2015b) optimizes per-streamline cross-section multipliers to match a whole-brain tractogram to fixel-wise fiber densities and thus provides a value for each streamline that can be used (for example) to define the edge weights”
§ Quantitative mapping of the brain’s structural connectivity using diffusion MRI tractography: A review > Performing quantitative analysis: methods for tractography quantification > Quantitative measures using filtering techniques
What the sources say
- Not matchedcites Smith et al., 2015b
Couldn’t be matched to a paper in Crossref, so it can’t be checked.
plaindirect- Asserted: passes — The authors put it forward as true.
- Checkable: passes — It can be checked against evidence.
- Load-bearing: unclear — It is unclear whether the paper’s conclusions depend on it.
- Based: passes — The paper gives a reason why it holds.
It may state two separate claims as one.
- The authors state this as an assumption: The microstructure properties corresponding to a single streamline (or a group of axons following the same trajectory) remain constant along its path on average at achievable resolution.
- Not matched
The paper states this without a source or data behind it here, so there is nothing to check it against. The quote shows it is in the paper.
In the paper
“The choice of the best summary statistic for data measured within a fiber pathway is still open.”
§ Quantitative mapping of the brain’s structural connectivity using diffusion MRI tractography: A review > Performing quantitative analysis: methods for tractography quantification > Domain of analysis: extraction of quantitative measures within white matter fiber pathways
plain- Asserted: passes — The authors put it forward as true.
- Checkable: passes — It can be checked against evidence.
- Load-bearing: fails — The paper’s conclusions may not depend on it.
- Based: passes — The paper gives a reason why it holds.
Probably not a substantial claim. The paper’s conclusions may not depend on it.
The paper states this without a source or data behind it here, so there is nothing to check it against. The quote shows it is in the paper.
In the paper
“These methods may rely on a summary statistic per tract, or analyze data along a tract.”
§ Quantitative mapping of the brain’s structural connectivity using diffusion MRI tractography: A review > Performing quantitative analysis: methods for tractography quantification > Tract-specific analysis using statistical or machine learning techniques
hedged- Asserted: passes — The authors put it forward as true.
- Checkable: passes — It can be checked against evidence.
- Load-bearing: fails — The paper’s conclusions may not depend on it.
- Based: passes — The paper gives a reason why it holds.
Probably not a substantial claim. The paper’s conclusions may not depend on it. It may state two separate claims as one.
The paper states this without a source or data behind it here, so there is nothing to check it against. The quote shows it is in the paper.
In the paper
“Once a quantitative measure has been extracted for individual fiber pathways, several options exist for tract-specific analysis, which may be hypothesis-driven using statistical analysis or data-driven using machine learning.”
§ Quantitative mapping of the brain’s structural connectivity using diffusion MRI tractography: A review > Performing quantitative analysis: methods for tractography quantification > Tract-specific analysis using statistical or machine learning techniques
hedged- Asserted: passes — The authors put it forward as true.
- Checkable: passes — It can be checked against evidence.
- Load-bearing: fails — The paper’s conclusions may not depend on it.
- Based: passes — The paper gives a reason why it holds.
Probably not a substantial claim. The paper’s conclusions may not depend on it. It may state two separate claims as one.
In the paper
“One study has suggested that the maxima and minima are more discriminative than the mean value in machine-learning-based disease classification (Zhang et al., 2018a).”
§ Quantitative mapping of the brain’s structural connectivity using diffusion MRI tractography: A review > Performing quantitative analysis: methods for tractography quantification > Domain of analysis: extraction of quantitative measures within white matter fiber pathways
What the sources say
- Not matchedcites Zhang et al., 2018a
Couldn’t be matched to a paper in Crossref, so it can’t be checked.
hedgedcorrelational- Asserted: passes — The authors put it forward as true.
- Checkable: passes — It can be checked against evidence.
- Load-bearing: fails — The paper’s conclusions may not depend on it.
- Based: passes — The paper gives a reason why it holds.
Probably not a substantial claim. The paper’s conclusions may not depend on it.
- Not matched
The paper states this without a source or data behind it here, so there is nothing to check it against. The quote shows it is in the paper.
In the paper
“The underling assumption comes from the fact that a streamline reconstructed from tractography cannot represent a single axon, but rather a group of axons following the same trajectory, and thus we can suppose that on average the microstructure properties the magnetic resonance signal is sensitive to at achievable resolution remain constant.”
§ Quantitative mapping of the brain’s structural connectivity using diffusion MRI tractography: A review > Performing quantitative analysis: methods for tractography quantification > Quantitative measures using filtering techniques
plain- Asserted: passes — The authors put it forward as true.
- Checkable: passes — It can be checked against evidence.
- Load-bearing: passes — The paper’s conclusions depend on it.
- Based: fails — The paper may give no reason why it holds.
Probably not a substantial claim. The paper may give no reason why it holds.
The paper states this without a source or data behind it here, so there is nothing to check it against. The quote shows it is in the paper.
In the paper
“(This is required for connectome-based analysis and is a popular approach for tract-specific analysis).”
§ Quantitative mapping of the brain’s structural connectivity using diffusion MRI tractography: A review > Performing quantitative analysis: methods for tractography quantification > Domain of analysis: extraction of quantitative measures within white matter fiber pathways
plain- Asserted: passes — The authors put it forward as true.
- Checkable: passes — It can be checked against evidence.
- Load-bearing: fails — The paper’s conclusions may not depend on it.
- Based: fails — The paper may give no reason why it holds.
Probably not a substantial claim. The paper’s conclusions may not depend on it. The paper may give no reason why it holds. It may state two separate claims as one.
What the paper did — it cites no source for this, so there is none to check. The quote shows it is in the paper.
In the paper
“One important point to note is that correction for multiple comparisons is needed if there are multiple tracts and/or multiple quantitative measurements analyzed.”
§ Quantitative mapping of the brain’s structural connectivity using diffusion MRI tractography: A review > Performing quantitative analysis: methods for tractography quantification > Tract-specific analysis using statistical or machine learning techniques
plain- Asserted: passes — The authors put it forward as true.
- Checkable: passes — It can be checked against evidence.
- Load-bearing: fails — The paper’s conclusions may not depend on it.
- Based: passes — The paper gives a reason why it holds.
Probably not a substantial claim. The paper’s conclusions may not depend on it.
In the paper
“Other approaches can employ streamlines of the entire tract in the statistical analyses (Chandio et al., 2020b).”
§ Quantitative mapping of the brain’s structural connectivity using diffusion MRI tractography: A review > Performing quantitative analysis: methods for tractography quantification > Tract-specific analysis using statistical or machine learning techniques
What the sources say
- Not matchedcites Chandio et al., 2020b
Couldn’t be matched to a paper in Crossref, so it can’t be checked.
plain- Asserted: passes — The authors put it forward as true.
- Checkable: passes — It can be checked against evidence.
- Load-bearing: fails — The paper’s conclusions may not depend on it.
- Based: passes — The paper gives a reason why it holds.
Probably not a substantial claim. The paper’s conclusions may not depend on it.
- Not matched
The paper states this without a source or data behind it here, so there is nothing to check it against. The quote shows it is in the paper.
In the paper
“Unlike statistical analysis methods that usually aim to find white matter structures with statistical group differences, the machine-learning-based methods aim to offer predictive relevance.”
§ Quantitative mapping of the brain’s structural connectivity using diffusion MRI tractography: A review > Performing quantitative analysis: methods for tractography quantification > Tract-specific analysis using statistical or machine learning techniques
plain- Asserted: passes — The authors put it forward as true.
- Checkable: passes — It can be checked against evidence.
- Load-bearing: unclear — It is unclear whether the paper’s conclusions depend on it.
- Based: passes — The paper gives a reason why it holds.
It may state two separate claims as one.
The paper states this without a source or data behind it here, so there is nothing to check it against. The quote shows it is in the paper.
In the paper
“In machine learning analysis, the quantitative measures computed from individual fiber pathways are treated as feature descriptors, which are input to a machine learning algorithm (e.g., a support vector machine) to train a model from a set of training samples with known information (e.g., labels such as disease or healthy control).”
§ Quantitative mapping of the brain’s structural connectivity using diffusion MRI tractography: A review > Performing quantitative analysis: methods for tractography quantification > Tract-specific analysis using statistical or machine learning techniques
plain- Asserted: passes — The authors put it forward as true.
- Checkable: passes — It can be checked against evidence.
- Load-bearing: fails — The paper’s conclusions may not depend on it.
- Based: passes — The paper gives a reason why it holds.
Probably not a substantial claim. The paper’s conclusions may not depend on it.
The paper states this without a source or data behind it here, so there is nothing to check it against. The quote shows it is in the paper.
In the paper
“This step is typically done by simply thresholding according to some rule or to reach a predefined density, or using filtering techniques described in Section 5.3.”
§ Quantitative mapping of the brain’s structural connectivity using diffusion MRI tractography: A review > Performing quantitative analysis: methods for tractography quantification > Construction of a structural connectivity matrix
plain- Asserted: passes — The authors put it forward as true.
- Checkable: passes — It can be checked against evidence.
- Load-bearing: fails — The paper’s conclusions may not depend on it.
- Based: passes — The paper gives a reason why it holds.
Probably not a substantial claim. The paper’s conclusions may not depend on it. It may state two separate claims as one.
None of the sources cited for this claim have been checked yet.
In the paper
“Selection of a gray matter parcellation scheme (as described in Section 4.2) is the first essential consideration when constructing a structural connectivity matrix, and it has been shown to be highly consequential in connectome analysis (de Reus and Van den Heuvel, 2013; Yeh et al., 2020; Zalesky et al., 2012).”
§ Quantitative mapping of the brain’s structural connectivity using diffusion MRI tractography: A review > Performing quantitative analysis: methods for tractography quantification > Construction of a structural connectivity matrix
What the sources say
boosteddirect- Asserted: passes — The authors put it forward as true.
- Checkable: passes — It can be checked against evidence.
- Load-bearing: unclear — It is unclear whether the paper’s conclusions depend on it.
- Based: passes — The paper gives a reason why it holds.
It may state two separate claims as one.
A conclusion the paper draws from its own results — it cites no other source for it, so there is none to check. The quote shows it is in the paper.
In the paper
“Along-tract analysis enables the study of local regions along the tract.”
§ Quantitative mapping of the brain’s structural connectivity using diffusion MRI tractography: A review > Performing quantitative analysis: methods for tractography quantification > Tract-specific analysis using statistical or machine learning techniques
plaindirect- Asserted: passes — The authors put it forward as true.
- Checkable: passes — It can be checked against evidence.
- Load-bearing: fails — The paper’s conclusions may not depend on it.
- Based: passes — The paper gives a reason why it holds.
Probably not a substantial claim. The paper’s conclusions may not depend on it.
In the paper
“For scalar values that are interpreted as inversely related to connectivity “strength,” such as RD, MD, or maps reflecting extracellular or isotropic/free water components of the signal, a transformation of the connectivity matrix may be performed using the reciprocal or the log function prior to any subsequent connectivity analysis (Fornito et al., 2016).”
§ Quantitative mapping of the brain’s structural connectivity using diffusion MRI tractography: A review > Performing quantitative analysis: methods for tractography quantification > Construction of a structural connectivity matrix
What the sources say
- Not checked — no full text of the sourcecites Fornito et al., 2016 source
hedgedconditional- Asserted: passes — The authors put it forward as true.
- Checkable: passes — It can be checked against evidence.
- Load-bearing: fails — The paper’s conclusions may not depend on it.
- Based: passes — The paper gives a reason why it holds.
Probably not a substantial claim. The paper’s conclusions may not depend on it.
None of the sources cited for this claim have been checked yet.
In the paper
“Another advantage of machine learning is that it can be easily applied to multimodal data.”
§ Quantitative mapping of the brain’s structural connectivity using diffusion MRI tractography: A review > Performing quantitative analysis: methods for tractography quantification > Tract-specific analysis using statistical or machine learning techniques
plaindirect- Asserted: passes — The authors put it forward as true.
- Checkable: passes — It can be checked against evidence.
- Load-bearing: fails — The paper’s conclusions may not depend on it.
- Based: passes — The paper gives a reason why it holds.
Probably not a substantial claim. The paper’s conclusions may not depend on it.
The paper states this without a source or data behind it here, so there is nothing to check it against. The quote shows it is in the paper.
In the paper
“Then the trained model can be used to predict new samples.”
§ Quantitative mapping of the brain’s structural connectivity using diffusion MRI tractography: A review > Performing quantitative analysis: methods for tractography quantification > Tract-specific analysis using statistical or machine learning techniques
plaindirect- Asserted: passes — The authors put it forward as true.
- Checkable: passes — It can be checked against evidence.
- Load-bearing: fails — The paper’s conclusions may not depend on it.
- Based: passes — The paper gives a reason why it holds.
Probably not a substantial claim. The paper’s conclusions may not depend on it.
The paper states this without a source or data behind it here, so there is nothing to check it against. The quote shows it is in the paper.
In the paper
“In addition, connectomes are usually post-processed to reduce potential bias in the estimation of graph measures.”
§ Quantitative mapping of the brain’s structural connectivity using diffusion MRI tractography: A review > Performing quantitative analysis: methods for tractography quantification > Construction of a structural connectivity matrix
plaindirect- Asserted: passes — The authors put it forward as true.
- Checkable: passes — It can be checked against evidence.
- Load-bearing: fails — The paper’s conclusions may not depend on it.
- Based: passes — The paper gives a reason why it holds.
Probably not a substantial claim. The paper’s conclusions may not depend on it.
None of the sources cited for this claim have been checked yet.
In the paper
“Commonly used multiple comparison correction methods include false discovery rate (FDR) (Benjamini and Hochberg, 1995) and Bonferroni (Holm, 1979) methods.”
§ Quantitative mapping of the brain’s structural connectivity using diffusion MRI tractography: A review > Performing quantitative analysis: methods for tractography quantification > Tract-specific analysis using statistical or machine learning techniques
What the sources say
- Not checked — no full text of the sourcecites Benjamini and Hochberg, 1995 source
- Not matchedcites Holm, 1979
Couldn’t be matched to a paper in Crossref, so it can’t be checked.
plain- Asserted: passes — The authors put it forward as true.
- Checkable: passes — It can be checked against evidence.
- Load-bearing: fails — The paper’s conclusions may not depend on it.
- Based: passes — The paper gives a reason why it holds.
Probably not a substantial claim. The paper’s conclusions may not depend on it.
A conclusion the paper draws from its own results — it cites no other source for it, so there is none to check. The quote shows it is in the paper.
In the paper
“This can be advantageous in situations where the within-group heterogeneity is large (e.g., in psychiatric diseases) and thus a statistical group comparison, which essentially compares the “average patient” to the “average control,” is not informative.”
§ Quantitative mapping of the brain’s structural connectivity using diffusion MRI tractography: A review > Performing quantitative analysis: methods for tractography quantification > Tract-specific analysis using statistical or machine learning techniques
plainconditional- Asserted: passes — The authors put it forward as true.
- Checkable: passes — It can be checked against evidence.
- Load-bearing: unclear — It is unclear whether the paper’s conclusions depend on it.
- Based: passes — The paper gives a reason why it holds.
It may state two separate claims as one.
In the paper
“Shortest-path-based measures include, e.g., the popular characteristic path length and network efficiency (Rubinov and Sporns, 2010).”
§ Quantitative mapping of the brain’s structural connectivity using diffusion MRI tractography: A review > Performing quantitative analysis: methods for tractography quantification > Graph theoretical measures and advanced structural connectome measurements
What the sources say
- Not checked — no full text of the sourcecites Rubinov and Sporns, 2010 source
plain- Asserted: passes — The authors put it forward as true.
- Checkable: passes — It can be checked against evidence.
- Load-bearing: fails — The paper’s conclusions may not depend on it.
- Based: passes — The paper gives a reason why it holds.
Probably not a substantial claim. The paper’s conclusions may not depend on it.
None of the sources cited for this claim have been checked yet.
In the paper
“A daunting number of graph theoretical measures have been proposed to study the network properties of the brain’s connectome (Bullmore and Sporns, 2009b; Iturria-Medina et al., 2008; Rubinov and Sporns, 2010).”
§ Quantitative mapping of the brain’s structural connectivity using diffusion MRI tractography: A review > Performing quantitative analysis: methods for tractography quantification > Graph theoretical measures and advanced structural connectome measurements
What the sources say
plain- Asserted: passes — The authors put it forward as true.
- Checkable: passes — It can be checked against evidence.
- Load-bearing: fails — The paper’s conclusions may not depend on it.
- Based: passes — The paper gives a reason why it holds.
Probably not a substantial claim. The paper’s conclusions may not depend on it.
In the paper
“FA values of the corpus callosum declined with aging only in the genu part while not in the body and splenium parts in participants aged 22–84 years (Michielse et al., 2010).”
§ Quantitative mapping of the brain’s structural connectivity using diffusion MRI tractography: A review > Applications of quantitative tractography analysis > Aging and lifespan tractography of the brain
What the sources say
- Not checked — no full text of the sourcecites Michielse et al., 2010 source
plaindirect- Asserted: passes — The authors put it forward as true.
- Checkable: passes — It can be checked against evidence.
- Load-bearing: unclear — It is unclear whether the paper’s conclusions depend on it.
- Based: passes — The paper gives a reason why it holds.
It may state two separate claims as one.
None of the sources cited for this claim could be matched to a paper in Crossref, so there is nothing to check it against.
In the paper
“Meanwhile, both global and local alterations of the brain’s structural topology occur with aging”
§ Quantitative mapping of the brain’s structural connectivity using diffusion MRI tractography: A review > Applications of quantitative tractography analysis > Aging and lifespan tractography of the brain
What the sources say
- Not matchedcites Bi et al., 2021
Couldn’t be matched to a paper in Crossref, so it can’t be checked.
- Not matchedcites Gong et al., 2009b
Couldn’t be matched to a paper in Crossref, so it can’t be checked.
- Not matchedcites Li et al., 2020c
Couldn’t be matched to a paper in Crossref, so it can’t be checked.
plaindirect- Asserted: passes — The authors put it forward as true.
- Checkable: passes — It can be checked against evidence.
- Load-bearing: passes — The paper’s conclusions depend on it.
- Based: passes — The paper gives a reason why it holds.
It may state two separate claims as one.
- Not matched
None of the sources cited for this claim have been checked yet.
In the paper
“During prenatal development, the whole network becomes increasingly efficient and segregated with typical system-level refinements such as increased small-worldness (Brown et al., 2014) and increased modularity (Van Den Heuvel et al., 2015b).”
§ Quantitative mapping of the brain’s structural connectivity using diffusion MRI tractography: A review > Applications of quantitative tractography analysis > Developmental tractography of the brain
What the sources say
- Not checked — no full text of the sourcecites Brown et al., 2014 source
- Not matchedcites Van Den Heuvel et al., 2015b
Couldn’t be matched to a paper in Crossref, so it can’t be checked.
plaindirect- Asserted: passes — The authors put it forward as true.
- Checkable: passes — It can be checked against evidence.
- Load-bearing: unclear — It is unclear whether the paper’s conclusions depend on it.
- Based: passes — The paper gives a reason why it holds.
It may state two separate claims as one.
In the paper
“The nodal efficiency of provincial hubs and the strength of within-module connections (Zhao et al., 2019a) develop fast during the prenatal stage”
§ Quantitative mapping of the brain’s structural connectivity using diffusion MRI tractography: A review > Applications of quantitative tractography analysis > Developmental tractography of the brain
What the sources say
- Not matchedcites Zhao et al., 2019a
Couldn’t be matched to a paper in Crossref, so it can’t be checked.
plaindirect- Asserted: passes — The authors put it forward as true.
- Checkable: passes — It can be checked against evidence.
- Load-bearing: unclear — It is unclear whether the paper’s conclusions depend on it.
- Based: passes — The paper gives a reason why it holds.
It may state two separate claims as one.
- Not matched
In the paper
“Researchers can further estimate the growth of tracts at the subsystem level by multivariate analysis; for example, one study investigated the maturational calendars of linguistic bundles and found that the dorsal pathway development falls behind the ventral pathway at birth and catches up later at the first postnatal months (Dubois et al., 2016).”
§ Quantitative mapping of the brain’s structural connectivity using diffusion MRI tractography: A review > Applications of quantitative tractography analysis > Developmental tractography of the brain
What the sources say
- Not checked — no full text of the sourcecites Dubois et al., 2016 source
plaincorrelational- Asserted: passes — The authors put it forward as true.
- Checkable: passes — It can be checked against evidence.
- Load-bearing: unclear — It is unclear whether the paper’s conclusions depend on it.
- Based: passes — The paper gives a reason why it holds.
It may state two separate claims as one.
In the paper
“It may partly reduce the ambiguity about the best intervention target and is quite suitable for brain disorders that involve several abnormal circuits, e.g., OCD (For a review, see (Baldermann et al., 2021)).”
§ Quantitative mapping of the brain’s structural connectivity using diffusion MRI tractography: A review > Applications of quantitative tractography analysis > Tractography in neurosurgery
What the sources say
- Not checked — no full text of the sourcecites Baldermann et al., 2021 source
hedgedconditional- Asserted: passes — The authors put it forward as true.
- Checkable: passes — It can be checked against evidence.
- Load-bearing: passes — The paper’s conclusions depend on it.
- Based: passes — The paper gives a reason why it holds.
It may state two separate claims as one.
In the paper
“traditional voxel-based analysis of brain white matter is usually performed in a standard space and seems sensitive to registration error (Colby et al., 2012b).”
§ Quantitative mapping of the brain’s structural connectivity using diffusion MRI tractography: A review > Applications of quantitative tractography analysis > Tractography in neurological and mental brain disorders
What the sources say
- Not matchedcites Colby et al., 2012b
Couldn’t be matched to a paper in Crossref, so it can’t be checked.
hedgedcorrelational- Asserted: passes — The authors put it forward as true.
- Checkable: passes — It can be checked against evidence.
- Load-bearing: passes — The paper’s conclusions depend on it.
- Based: passes — The paper gives a reason why it holds.
It may state two separate claims as one.
- Not matched
In the paper
“Multiple sclerosis is a demyelinating disease with multiple focal white matter lesions (Fleischer et al., 2019).”
§ Quantitative mapping of the brain’s structural connectivity using diffusion MRI tractography: A review > Applications of quantitative tractography analysis > Tractography in neurological and mental brain disorders
What the sources say
- Not checked — no full text of the sourcecites Fleischer et al., 2019 source
plain- Asserted: passes — The authors put it forward as true.
- Checkable: passes — It can be checked against evidence.
- Load-bearing: fails — The paper’s conclusions may not depend on it.
- Based: passes — The paper gives a reason why it holds.
Probably not a substantial claim. The paper’s conclusions may not depend on it. It may state two separate claims as one.
A conclusion the paper draws from its own results — it cites no other source for it, so there is none to check. The quote shows it is in the paper.
In the paper
“Tractography has enabled the study of the brain’s white matter connections across the lifespan in health and disease.”
§ Quantitative mapping of the brain’s structural connectivity using diffusion MRI tractography: A review > Discussion and conclusion
plaindirect- Asserted: passes — The authors put it forward as true.
- Checkable: passes — It can be checked against evidence.
- Load-bearing: passes — The paper’s conclusions depend on it.
- Based: passes — The paper gives a reason why it holds.
Probably not a substantial claim.
A conclusion the paper draws from its own results — it cites no other source for it, so there is none to check. The quote shows it is in the paper.
In the paper
“while there have been considerable advancements in methodological technologies and breadth of applications”
§ Quantitative mapping of the brain’s structural connectivity using diffusion MRI tractography: A review > Discussion and conclusion
plain- Asserted: passes — The authors put it forward as true.
- Checkable: passes — It can be checked against evidence.
- Load-bearing: passes — The paper’s conclusions depend on it.
- Based: passes — The paper gives a reason why it holds.
Probably not a substantial claim. It may state two separate claims as one.
The authors state this as an assumption.
Fibers are naturally organized in bundles.
“fibers are naturally organized in bundles (Mandonnet et al., 2018; Udin and Fawcett, 1988)”
The authors state this as an assumption.
The number of bundles should be low to minimize the overall wiring cost.
“the number of bundles should be low to minimize the overall wiring cost (Bullmore and Sporns, 2012)”
The paper relies on this without support.
There is no ground truth in tractography.
“given the fact that there is no ground truth in tractography”
The authors state this as an assumption.
The microstructure properties corresponding to a single streamline (or a group of axons following the same trajectory) remain constant along its path on average at achievable resolution.
“Assuming that the microstructure properties corresponding to a single streamline remain constant along its path, these methods assign a specific microstructural property to each reconstructed pathway.”
“we can suppose that on average the microstructure properties the magnetic resonance signal is sensitive to at achievable resolution remain constant.”
The paper relies on this without support.
Pathological lesions of MS hinder basic tract reconstruction.
“Since the pathological lesions of MS hinder basic tract reconstruction”
Self-check
Percentages, sums and reported differences re-computed from the paper’s own numbers.
Each contradiction between two passages listed here was confirmed by an independent check.
Rated minor: it would not touch a result — a value no result rests on, a p-value that stays on the same side of the significance level, or a conflict that is clerical, resolved elsewhere in the paper, or outside its own findings.
In the paper
§ Quantitative mapping of the brain’s structural connectivity using diffusion MRI tractography: A review > Applications of quantitative tractography analysis > Developmental tractography of the brain
“Similar studies also show that the radial and tangential pathways organization are prominent at 17 weeks but gradually disappear at later gestational ages, and all major structural pathways are already identifiable by term (Takahashi et al., 2002).”
§ Quantitative mapping of the brain’s structural connectivity using diffusion MRI tractography: A review > References
“478. Takahashi M, Hackney DB, Zhang G, Wehrli SL, Wright AC, O’Brien WT, Uematsu H, Wehrli FW, Selzer ME, 2002. Magnetic resonance microimaging of intraaxonal water diffusion in live excised lamprey spinal cord.”
Citations
Cites
Items 401–600 of 609
Clustering of Whole-Brain White Matter Short Association Bundles Using HARDI Data
Román, C., Guevara, M., Valenzuela, R., Figueroa, M. E., Houenou, J., Duclap, D., Poupon, C., Mangin, J., & Guevara, P. (2017) · Frontiers in Neuroinformatics · doi:10.3389/fninf.2017.00073 · Cited by 77
White matter tractography by anisotropic wavefront evolution and diffusion tensor imaging
Jackowski, M. P., Kao, C. Y., Qiu, M., Constable, R. T., & Staib, L. H. (2005) · Medical Image Analysis · doi:10.1016/j.media.2005.05.008 · Cited by 76 · cited 2×
“[27, 94, 296, 488, 28, 452, 116, 38, 154, 249, 454, 214, 138, 280, 352, 484, 135], and the ways in which specific undesir-”
BackgroundComparative mouse brain tractography of diffusion magnetic resonance imaging
Moldrich, R. X., Pannek, K., Hoch, R. V., Rubenstein, J. L. R., Kurniawan, N. D., & Richards, L. J. (2010) · NeuroImage · doi:10.1016/j.neuroimage.2010.03.035 · Cited by 76 · cited 1×
“On the other hand, tractography results can also be sensitive to the choice of parameters (such as seeding and stopping thresholds) within a certain algorithm (Chamberland et al., 2014; Côté et al., 2013; Gong et al., 2018; Moldrich et al., 2010; Xie et al., 2020).”
BackgroundFleischer, V., Gröger, A., Koirala, N., Droby, A., Muthuraman, M., Kolber, P. L., Reuter, E., Meuth, S. G., Zipp, F., & Groppa, S. (2016) · Multiple Sclerosis Journal · doi:10.1177/1352458516651503 · Cited by 76 · cited 1×
“first clinical event, which indicates a disease-related abnormality of network segregation ability [145, 301].”
BackgroundMicroTrack: An Algorithm for Concurrent Projectome and Microstructure Estimation
Sherbondy, A. J., Rowe, M. C., & Alexander, D. C. (2010) · Lecture notes in computer science · doi:10.1007/978-3-642-15705-9_23 · Cited by 75 · cited 2×
“Initial methods achieved this by selecting a subset of streamlines that best fit the diffusion image data, i.e., BlueMatter [399], MicroTrack [398] and SIFT [415], while later methods estimate a multiplier to be applied to each streamline, i.e., COMMIT [105, 106], LiFE [334], SIFT2 [416], COMMIT2 [375] and COMMIT2tree…”
Cha, J., Fekete, T., Siciliano, F., Biezonski, D., Greenhill, L., Pliszka, S. R., Blader, J. C., Krain Roy, A., Leibenluft, E., & Posner, J. (2015) · Neuropsychopharmacology · doi:10.1038/npp.2015.18 · Cited by 75 · cited 1×
“white matter fiber tracts are affected in individuals with different disease severity [70, 342, 80], and how tracts are developing during human neurodevelopment and aging [160, 289, 187].”
BackgroundWhite Matter Abnormalities in Pediatric Obsessive-Compulsive Disorder
Gruner, P., Vo, A., Ikuta, T., Mahon, K., Peters, B. D., Malhotra, A. K., Uluğ, A. M., & Szeszko, P. R. (2012) · Neuropsychopharmacology · doi:10.1038/npp.2012.138 · Cited by 74 · cited 2×
“depression [110, 239], obsessive-compulsive disorder (OCD) [64, 81, 156, 175, 238], attention-deficit hyperactivity disorder (ADHD) [62, 63, 107, 201] and autism [209, 247, 445, 537].”
BackgroundOpportunities and Challenges for Psychiatry in the Connectomic Era
Fornito, A., Bullmore, E. T., & Zalesky, A. (2017) · Biological Psychiatry: Cognitive Neuroscience and Neuroimaging · doi:10.1016/j.bpsc.2016.08.003 · Cited by 74 · cited 2×
“structural connectome studies [92, 147] have shown altered”
BackgroundMangin, J., Poupon, C., Cointepas, Y., Rivière, D., Orfanos, D. P., Clark, C., Régis, J. M., & Bihan, D. L. (2002) · NMR in Biomedicine · doi:10.1002/nbm.780 · Cited by 73
Diffusion-weighted magnetic resonance imaging fibre tracking using a front evolution algorithm
Tournier, J., Calamante, F., Gadian, D. G., & Connelly, A. (2003) · NeuroImage · doi:10.1016/s1053-8119(03)00236-2 · Cited by 73
Aydogan, D. B., Jacobs, R., Dulawa, S., Thompson, S. L., Francois, M. C., Toga, A. W., Dong, H., Knowles, J. A., & Shi, Y. (2018) · Brain Structure and Function · doi:10.1007/s00429-018-1663-8 · Cited by 72 · cited 1×
“, 2020b), which reduces the agreement of the initiations or terminations of fiber streamlines with known ground truth from tracer studies and histology (Aydogan et al., 2018; Budde and Annese, 2013).”
BackgroundKovanlıkaya, İ., Fırat, Z., Kovanlıkaya, A., et al. (2009) · European Journal of Radiology · doi:10.1016/j.ejrad.2009.08.012 · Cited by 71 · cited 1×
“been widely used in various lesions located in both supratentorial and infratentorial areas [131, 137, 240], involving not only the major tracts but also smaller fiber structures [287].”
BackgroundHuman fetal brain connectome: structural network development from middle fetal stage to birth
Song, L., Mishra, V., Ouyang, M., Peng, Q., Slinger, M., Liu, S., & Huang, H. (2017) · Frontiers in Neuroscience · doi:10.3389/fnins.2017.00561 · Cited by 71 · cited 1×
“Many studies have discovered largely adult-like topological structures including significant small-world, modular, and richclub organization during the middle to final trimester of gestation [51, 420, 460, 463, 549], which reveals that the whole brain tract network is already highly efficient and specialized”
BackgroundResection of gliomas deemed inoperable by neurosurgeons based on preoperative imaging studies
Southwell, D. G., Birk, H. S., Han, S. J., Li, J., Sall, J. W., & Berger, M. S. (2018) · Journal of Neurosurgery · doi:10.3171/2017.5.jns17166 · Cited by 71 · cited 1×
“However, considering the potential for functional compensation and the presence of individual variation, a common location of “eloquent” areas across patients seems inaccurate [425].”
BackgroundTractography for Surgical Neuro-Oncology Planning: Towards a Gold Standard
Panesar, S. S., Abhinav, K., Yeh, F.-C. F., Jacquesson, T., Collins, M. K., & Fernandez-Miranda, J. C. (2018) · Neurotherapeutics · doi:10.1007/s13311-018-00697-x · Cited by 71 · cited 1×
“important for quality of life and overall survival of neurosurgical patients [97, 132, 151, 328].”
BackgroundAn Introduction to Computational Diffusion MRI: the Diffusion Tensor and Beyond
Alexander, D. C. (2006) · Mathematics and Visualization · doi:10.1007/3-540-31272-2_5 · Cited by 70 · cited 2×
“across the large set of available diffusion models [551, 360, 8, 4] and tractography methods [35, 247, 494, 134, 46, 175, 275, 496, 237, 159, 307, 385, 527, 155].”
BackgroundAnatomiCuts: Hierarchical clustering of tractography streamlines based on anatomical similarity
Siless, V., Chang, K., Fischl, B. R., & Yendiki, A. (2017) · NeuroImage · doi:10.1016/j.neuroimage.2017.10.058 · Cited by 70 · cited 2×
“They group tractography streamlines according to their geometric trajectories, describing the structural connectivity according to the white matter anatomy [315, 551, 261, 176, 366, 76, 458, 524, 365, 518, 158, 540, 408, 16, 472, 409, 498].”
BackgroundMethodNetwork-Based Asymmetry of the Human Auditory System
Mišić, B., Betzel, R. F., Griffa, A., de Reus, M. A., He, Y., Zuo, X., van den Heuvel, M. P., Hagmann, P., Sporns, O., & Zatorre, R. J. (2018) · Cerebral Cortex · doi:10.1093/cercor/bhy101 · Cited by 70
Self-citationSinke, M. R. T., Otte, W. M., Christiaens, D., Schmitt, O., Leemans, A., van der Toorn, A., Sarabdjitsingh, R. A., Joëls, M., & Dijkhuizen, R. M. (2018) · Brain Structure and Function · doi:10.1007/s00429-018-1628-y · Cited by 69 · cited 1×
“While many research studies have been performed to compare different tractography algorithms [34, 344, 410, 491, 336, 532, 141], there is no consensus on “the best algorithm.”
BackgroundAbnormal cingulum bundle development in autism: a probabilistic tractography study
Ikuta, T., Shafritz, K. M., Bregman, J., Peters, B. D., Gruner, P., Malhotra, A. K., & Szeszko, P. R. (2014) · Psychiatry Research: Neuroimaging · doi:10.1016/j.pscychresns.2013.08.002 · Cited by 69 · cited 1×
“depression [110, 239], obsessive-compulsive disorder (OCD) [64, 81, 156, 175, 238], attention-deficit hyperactivity disorder (ADHD) [62, 63, 107, 201] and autism [209, 247, 445, 537].”
BackgroundStructural network maturation of the preterm human brain
Zhao, T., Mishra, V. R., Jeon, T., Ouyang, M., Peng, Q., Chalak, L. F., Wisnowski, J. L., Heyne, R. J., Rollins, N. K., Shu, N., et al. (2018) · NeuroImage · doi:10.1016/j.neuroimage.2018.06.047 · Cited by 69 · cited 1×
“efficiency of provincial hubs and the strength of within-module connections [547] develop fast during the prenatal stage, and”
BackgroundSelf-citationDuffau, H. (2021) · Acta Neurochirurgica · doi:10.1007/s00701-021-04752-z · Cited by 69 · cited 1×
“forming the resection of certain neuronal circuits during tumor surgery [128].”
BackgroundDirect segmentation of the major white matter tracts in diffusion tensor images
Bazin, P., Ye, C., Bogovic, J., Shiee, N., Reich, D. S., Prince, J. L., & Pham, D. L. (2011) · NeuroImage · doi:10.1016/j.neuroimage.2011.06.020 · Cited by 68 · cited 1×
“direct segmentation in the literature [129, 37, 351, 353, 483, 484, 121, 361, 274, 260].”
Neher, P., Descoteaux, M., Houde, J., Stieltjes, B., & Maier-Hein, K. H. (2015) · Medical Image Analysis · doi:10.1016/j.media.2015.10.011 · Cited by 68 · cited 1×
“While a detailed introduction of tractography methods is out of the scope of this review, we refer the readers to these review papers [304, 223, 359, 413] that are specific to tractography algorithms.”
MethodFiber tractography using machine learning
Neher, P. F., Côté, M.-A., Houde, J.-C., Descoteaux, M., & Maier-Hein, K. H. (2017) · NeuroImage · doi:10.1016/j.neuroimage.2017.07.028 · Cited by 68
Quantitative diffusion tensor fiber tracking of age-related changes in the limbic system
Stadlbauer, A., Salomonowitz, E. K., Strunk, G., Hammen, T., & Ganslandt, O. (2007) · European Radiology · doi:10.1007/s00330-007-0733-8 · Cited by 65 · cited 1×
“Early tractography studies usually estimated the aging effect on specific fiber bundles such as the corpus callosum [437], uncinate fasciculus [187], and fornix [433], which show consistent”
Parallel Transport Tractography
Aydogan, D. B., & Shi, Y. (2020) · IEEE Transactions on Medical Imaging · doi:10.1109/tmi.2020.3034038 · Cited by 65 · cited 1×
“However, doing so in a manner that is compatible with diffusion models that account for crossing fibers can be technically difficult (Aydogan and Shi, 2020; Cherifi et al., 2018; Tournier et al., 2010).”
BackgroundBrain mapping in multiple sclerosis: Lessons learned about the human brain
Filippi, M., Preziosa, P., & Rocca, M. A. (2017) · NeuroImage · doi:10.1016/j.neuroimage.2017.09.021 · Cited by 64 · cited 1×
“tion of motor function during training [140, 343].”
White matter development from birth to 6 years of age: a longitudinal study
Stephens, R. L., Langworthy, B. W., Short, S. J., Girault, J. B., Styner, M. A., & Gilmore, J. H. (2020) · Cerebral Cortex · doi:10.1093/cercor/bhaa170 · Cited by 63 · cited 1×
“cal nonlinear trajectories (piecewise, exponential and quadratic) of diffusion metrics for major tracts across large developmental ranges such as infancy to childhood [333, 357, 434] or adolescence to adulthood [75, 251].”
Chiang, H.-L., Chen, Y.-J., Shang, C.-Y., Tseng, W.-Y. I., & Gau, S. S.-F. (2016) · Psychological Medicine · doi:10.1017/s0033291715002767 · Cited by 62 · cited 1×
“white matter fiber tracts are affected in individuals with different disease severity [70, 342, 80], and how tracts are developing during human neurodevelopment and aging [160, 289, 187].”
BackgroundAxTract: Toward microstructure informed tractography
Girard, G., Daducci, A., Petit, L., Thiran, J., Whittingstall, K., Deriche, R., Wassermann, D., & Descoteaux, M. (2017) · Human Brain Mapping · doi:10.1002/hbm.23741 · Cited by 62 · cited 1×
“be simultaneously estimated when performing tractography so that the microstructural measures are directly computed at points along each streamline (Girard et al., 2017; Gong et al., 2018; Malcolm et al., 2010; Olszewski et al., 2017; Reddy and Rathi, 2016).”
BackgroundSelf-citationYeo, S. S., Jang, S. H., & Son, S. M. (2014) · Frontiers in Human Neuroscience · doi:10.3389/fnhum.2014.00573 · Cited by 61 · cited 1×
“and studies particular anatomical fiber tracts [5, 523, 394, 259].”
Sollmann, N., Kelm, A., Ille, S., Schröder, A., Zimmer, C., Ringel, F. A., Meyer, B., & Krieg, S. M. (2018) · Neurosurgical FOCUS · doi:10.3171/2018.3.focus1838 · Cited by 60
Abnormal integrity of association fiber tracts in amnestic mild cognitive impairment
Bai, F., Zhang, Z., Watson, D. R., Yu, H., Shi, Y., Yuan, Y., Qian, Y., & Jia, J. (2009) · Journal of the Neurological Sciences · doi:10.1016/j.jns.2008.12.009 · Cited by 59 · cited 1×
“dMRI tractography has become an indispensable tool for studies on various brain disorders including, but not limited to, multiple sclerosis (MS) [146, 372], amnestic mild cognitive impairment (aMCI) [19, 548], Alzheimer’s disease [213, 273, 293, 449], stroke [300], schizophrenia [92, 166, 490],”
BackgroundMadden, D. J., Jain, S., Monge, Z. A., Cook, A. D., Lee, A., Huang, H., Howard, C. M., & Cohen, J. R. (2020) · Neurobiology of Aging · doi:10.1016/j.neurobiolaging.2020.09.010 · Cited by 58 · cited 1×
“Meanwhile, both global and local alterations of the brain’s structural topology occur with aging, including decreased network efficiency [58, 190, 290, 303, 445, 540] and decreased inter-/intra-modularity strength that may be due to the widespread degeneration of whole brain tracts [290, 540] and”
BackgroundChiu, C., Lo, Y., Tang, H., Liu, I., Chiang, W.-Y., Yeh, F.-C. F., Jaw, F., & Tseng, W. I. (2011) · Psychiatry Research Neuroimaging · doi:10.1016/j.pscychresns.2010.09.009 · Cited by 56
The International Society for Magnetic Resonance in Medicine (ISMRM)
Kennedy, P., Semple, M. G., Gray, C. D., et al. (2012) · Cited by 56
Abnormal white matter structural connectivity in adults with obsessive-compulsive disorder
Gan, J., Zhong, M., Fan, J., Liu, W., Niu, C., Cai, S., Zou, L., Wang, Y., Wang, Y., Tan, C., et al. (2017) · Translational Psychiatry · doi:10.1038/tp.2017.22 · Cited by 56 · cited 2×
“depression [110, 239], obsessive-compulsive disorder (OCD) [64, 81, 156, 175, 238], attention-deficit hyperactivity disorder (ADHD) [62, 63, 107, 201] and autism [209, 247, 445, 537].”
BackgroundXu, H., Dong, M., Lee, M., O'Hara, N. B., Asano, E., & Jeong, J. (2019) · IEEE Transactions on Medical Imaging · doi:10.1109/tmi.2019.2902073 · Cited by 56 · cited 2×
“There are also learning-based segmentation approaches that train a model from the reference tract segmentation data and predict an anatomical label for each streamline in a new subject [179, 246, 178, 243, 508, 533, 269, 504].”
Structural MRI connectome in development: challenges of the changing brain
Tymofiyeva, O., Hess, C. P., Xu, D., & Barkovich, A. J. (2014) · British Journal of Radiology · doi:10.1259/bjr.20140086 · Cited by 55 · cited 1×
“Using the newly emerging developmental connectomics framework, researchers are able to seek the wiring principles of brain white matter tracts [71, 72, 110, 183, 359, 501, 517, 598].”
BackgroundStructural Network Disorganization in Subjects at Clinical High Risk for Psychosis
Schmidt, A., Crossley, N. A., Harrisberger, F., Smieskova, R., Lenz, C., Riecher‐Rössler, A., Lang, U. E., McGuire, P. K., Fusar‐Poli, P., & Borgwardt, S. (2016) · Schizophrenia Bulletin · doi:10.1093/schbul/sbw110 · Cited by 55 · cited 1×
“Studies also find evidence of abnormally enhanced network segregation such as increased modularity in schizophrenia patients and individuals with highrisk syndrome [383, 465].”
BackgroundFiber length profiling: a novel approach to structural brain organization
Bajada, C. J., Schreiber, J., & Caspers, S. (2019) · NeuroImage · doi:10.1016/j.neuroimage.2018.10.070 · Cited by 55 · cited 1×
“volume and the length of a fiber tract (Bajada et al., 2019; Behrman-Lay et al., 2015; Catani et al., 2007; Chandio et al., 2020a; Colby et al., 2012a; Grinberg et al., 2018; Rheault et al., 2020a; Song et al., 2015; Yeatman et al., 2012), have also been used.”
MethodDelettre, C., Messé, A., Dell, L.-A., Foubet, O., Heuer, K., Larrat, B., Meriaux, S., Mangin, J.-F., Reillo, I., de Juan Romero, C., et al. (2019) · Network Neuroscience · doi:10.1162/netn_a_00098 · Cited by 55 · cited 1×
“eral studies conducted on animals using invasive tracttracing techniques have shown good agreement between the NOS and the biological connectivity as measured using ex vivo tracttracing data [218, 129, 184].”
MethodConnectome-Based Patterns of First-Episode Medication-Naïve Patients With Schizophrenia
Cui, L., Wei, Y., Xi, Y.-B., Griffa, A., de Lange, S. C., Kahn, R. S., Yin, H. J., & van den Heuvel, M. P. (2019) · Schizophrenia Bulletin · doi:10.1093/schbul/sbz014 · Cited by 54 · cited 1×
“The disruption of rich-club organization is also associated with PANSS scores and shows potential for classification between schizophrenia patients and healthy controls [119, 599].”
BackgroundGeeraert, B., Chamberland, M., Lebel, R. M., & Lebel, C. A. (2020) · PLoS ONE · doi:10.1371/journal.pone.0233244 · Cited by 54 · cited 1×
“[347, 78, 526] or performed data reduction techniques to reduce the dimensionality of the point-wise measurements along tracts [159, 71, 68].”
MethodD’Andrea, G., Familiari, P., Lauro, A. D., Angelini, A., & Sessa, G. (2015) · World Neurosurgery · doi:10.1016/j.wneu.2015.10.076 · Cited by 53 · cited 1×
“ally, in language area surgery, when awake surgery is impossible or unavailable, tractography-based estimation may become the only available solution for assessing involved white matter tracts [125].”
BackgroundLongitudinal scalar-on-functions regression with application to tractography data
Gertheiss, J., Goldsmith, J., Crainiceanu, C. M., et al. (2013) · Biostatistics · doi:10.1093/biostatistics/kxs051 · Cited by 53 · cited 1×
“, how white matter fiber tracts are affected in individuals with different disease severity [81, 375, 95], how tracts relate to cognitive and socio-emotional function [580], and how tracts are developing during human neurodevelopment and aging [182, 318, 210].”
BackgroundConnectomic correlates of response to treatment in first-episode psychosis
Crossley, N. A., Marques, T. R., Taylor, H., Chaddock, C., Dell’Acqua, F., Reinders, A. A. T. S., Mondelli, V., Forti, M. D., Simmons, A., David, A. S., et al. (2016) · Brain · doi:10.1093/brain/aww297 · Cited by 53 · cited 2×
“of long-distance association edges, disruptions of anatomical brain hubs and rich club connections [107, 117, 261, 508, 570]”
BackgroundJavadi, S. A. H., Nabavi, A., Giordano, M., et al. (2016) · Neurosurgery · doi:10.1227/neu.0000000000001347 · Cited by 53 · cited 1×
“prehensive surgical white matter mapping by identifying fiber tracts that were not detected in preoperative tractography [216].”
BackgroundChen, Z., Zhang, H. G., Yushkevich, P. A., Liu, M., & Beaulieu, C. (2016) · Frontiers in Neuroanatomy · doi:10.3389/fnana.2016.00009 · Cited by 52 · cited 2×
“to define how to sample the microstructural data of interest [510, 316, 40, 230, 96, 89, 78, 212].”
BackgroundMethodLi, X., Wang, Y., Wang, W., Huang, W., Chen, K., Xu, K., Zhang, J., Chen, Y., Li, H., Wei, D., et al. (2020) · Cerebral Cortex · doi:10.1093/cercor/bhaa066 · Cited by 52 · cited 2×
“degeneration of whole brain tracts [265, 494] and loss of frontal”
BackgroundLanguage pathway tracking: comparing nTMS-based DTI fiber tracking with a cubic ROIs-based protocol
Negwer, C., Sollmann, N., Ille, S., Hauck, T., Maurer, S., Kirschke, J. S., Ringel, F. A., Meyer, B., & Krieg, S. M. (2016) · Journal of neurosurgery · doi:10.3171/2016.2.jns152382 · Cited by 51 · cited 1×
“to the superior longitudinal fasciculus [302, 418].”
Improved tractography using asymmetric fibre orientation distributions
Bastiani, M., Cottaar, M., Dikranian, K. T., Ghosh, A., Zhang, H. G., Alexander, D. C., Behrens, T. E. J., Jbabdi, S., & Sotiropoulos, S. N. (2017) · NeuroImage · doi:10.1016/j.neuroimage.2017.06.050 · Cited by 51 · cited 1×
“, 2020c), which can depict the highly-curved fiber geometry appearing at the superficial white matter (Bastiani et al., 2017; Wu et al., 2020c).”
BackgroundGong, S., Zhang, F., Norton, I., Essayed, W. I., Unadkat, P., Rigolo, L., Pasternak, O., Rathi, Y., Hou, L., Golby, A. J., et al. (2018) · PLOS ONE · doi:10.1371/journal.pone.0197056 · Cited by 51 · cited 1×
“It can also be computed by averaging microstructural measures sampled along each point of the streamlines [322, 537, 169, 539, 228].”
BackgroundSelf-citationTractography in the presence of multiple sclerosis lesions
Lipp, I., Parker, G. D., Tallantyre, E. C., Goodall, A., Grama, S., Patitucci, E., Heveron, P., Tomassini, V., & Jones, D. K. (2020) · NeuroImage · doi:10.1016/j.neuroimage.2019.116471 · Cited by 51 · cited 1×
“MS because researchers have found that the location and surrounding damages of lesions contribute more than the number and volume of lesions [268].”
BackgroundZekelman, L., Zhang, F., Makris, N., He, J., Chen, Y., Xue, T., Liera, D., Drane, D. L., Yogesh Rathi, A., Golby, A. J., et al. (2021) · NeuroImage · doi:10.1016/j.neuroimage.2021.118739 · Cited by 51 · cited 1×
“, how white matter fiber tracts are affected in individuals with different disease severity [81, 375, 95], how tracts relate to cognitive and socio-emotional function [580], and how tracts are developing during human neurodevelopment and aging [182, 318, 210].”
Self-citationIntroduction to Generalized Linear Models
(2010) · Wiley series in probability and statistics · doi:10.1002/9780470556986.ch1 · Cited by 50
A Hamilton-Jacobi-Bellman Approach to High Angular Resolution Diffusion Tractography
Pichon, É., Westin, C., & Tannenbaum, A. (2005) · Lecture notes in computer science · doi:10.1007/11566465_23 · Cited by 49 · cited 1×
“Furthermore, many alternative tractography algorithms have been proposed, such as front evolution (Pichon et al., 2005; Sepasian et al., 2012; Tournier et al., 2003), geodesic (identifying likely connection trajectories based on assumed endpoints) (Jbabdi et al.”
Chen, Z., Tie, Y., Olubiyi, O. I., Zhang, F., Mehrtash, A., Rigolo, L., Kahali, P., Norton, I. H., Pasternak, O., Yogesh Rathi, A., et al. (2016) · International Journal of Computer Assisted Radiology and Surgery · doi:10.1007/s11548-015-1344-5 · Cited by 49 · cited 1×
“During tumor resection surgeries, in-vivo tractography, especially in intraoperative MRI, allows for the accurate visualization and localization of white matter tracts that are displaced or affected by tumors [243, 92], which is important for the quality of life and overall survival of neurosurgical patients”
BackgroundSelf-citationMamah, D. T., Ji, A. B., Rutlin, J. R., & Shimony, J. S. (2018) · NeuroImage Clinical · doi:10.1016/j.nicl.2018.101649 · Cited by 49 · cited 1×
“However, increasing evidence suggests that the impairments of tracts in schizophrenia are more widespread than classical fronto-temporal regions [165, 258, 261, 579][309], which emphasizes the need for”
BackgroundThink Global, Act Local; Projectome Estimation with BlueMatter
Sherbondy, A. J., Dougherty, R. F., Ananthanarayanan, R., Modha, D. S., & Wandell, B. A. (2009) · Lecture notes in computer science · doi:10.1007/978-3-642-04268-3_106 · Cited by 48
Mitter, C., Jakab, A., Brugger, P. C., Ricken, G., Gruber, G. M., Bettelheim, D., Scharrer, A., Langs, G., Hainfellner, J. A., Prayer, D., et al. (2015) · Frontiers in Neuroanatomy · doi:10.3389/fnana.2015.00164 · Cited by 48 · cited 1×
“These results are consistent with classical histological studies [294, 468].”
ResultGlobal tractography with embedded anatomical priors for quantitative connectivity analysis
Lemkaddem, A., Skiöldebrand, D., Dal Palú, A., Thiran, J.-P., & Daducci, A. (2014) · Frontiers in Neurology · doi:10.3389/fneur.2014.00232 · Cited by 47 · cited 1×
“ing a set of candidate trajectories [496, 36, 258, 87]).”
Self-citationFast Automatic Segmentation of White Matter Streamlines Based on a Multi-Subject Bundle Atlas
Labra, N., Guevara, P., Duclap, D., Houenou, J., Poupon, C., Mangin, J., & Figueroa, M. E. (2016) · Neuroinformatics · doi:10.1007/s12021-016-9316-7 · Cited by 47
Wu, Y., Zhang, F., Makris, N., Ning, Y., Norton, I. H., She, S., Peng, H., Yogesh Rathi, A., Feng, Y., Wu, H., et al. (2018) · NeuroImage · doi:10.1016/j.neuroimage.2018.06.019 · Cited by 46 · cited 1×
“fication and between-population statistical analysis [587, 156, 586, 248, 547].”
Self-citationClassifyber, a robust streamline-based linear classifier for white matter bundle segmentation
Bertò, G., Bullock, D. N., Astolfi, P., Hayashi, S., Zigiotto, L., Annicchiarico, L., Corsini, F., BENEDICTIS, A. D., Sarubbo, S., Pestilli, F., et al. (2020) · NeuroImage · doi:10.1016/j.neuroimage.2020.117402 · Cited by 46
Connectomics in Schizophrenia: From Early Pioneers to Recent Brain Network Findings
Collin, G., Turk, E., & van den Heuvel, M. P. (2016) · Biological Psychiatry Cognitive Neuroscience and Neuroimaging · doi:10.1016/j.bpsc.2016.01.002 · Cited by 45
Yeh, C., Smith, R. E., Dhollander, T., Calamante, F., & Connelly, A. (2019) · NeuroImage · doi:10.1016/j.neuroimage.2019.05.005 · Cited by 45 · cited 1×
“anism by which streamlines are assigned to those parcels [560].”
BackgroundSelf-citationMadole, J. W., Ritchie, S. J., Cox, S. R., Buchanan, C. R., Hernández, M. V., Maniega, S. M., Wardlaw, J. M., Harris, M. A., Bastin, M. E., Deary, I. J., et al. (2021) · Biological Psychiatry · doi:10.1016/j.biopsych.2020.06.010 · Cited by 45 · cited 1×
“tome in aging-related cognitive decline [278].”
Yeo, R. A., Ryman, S. G., van den Heuvel, M. P., de Reus, M. A., Jung, R. E., Pommy, J. M., Mayer, A. R., Ehrlich, S., Schulz, S. C., Morrow, E. M., et al. (2016) · Journal of the International Neuropsychological Society · doi:10.1017/s1355617715000867 · Cited by 44 · cited 1×
“Meanwhile, the disproportionate deficits of long-distance association edges, disruptions of anatomical brain hubs and rich club connections [90, 100, 236, 465, 522] in both patients and their unaffected siblings also suggest damage of topological infrastructures for inter-domain functional”
FiberNET: An Ensemble Deep Learning Framework for Clustering White Matter Fibers
Gupta, V., Thomopoulos, S. I., Rashid, F. M., et al. (2017) · Lecture notes in computer science · doi:10.1007/978-3-319-66182-7_63 · Cited by 44
A comparison of three fiber tract delineation methods and their impact on white matter analysis
Sydnor, V. J., Rivas-Grajales, A. M., Lyall, A. E., Zhang, F., Bouix, S., Karmacharya, S., Shenton, M. E., Westin, C.-F., Makris, N., Wassermann, D., et al. (2018) · NeuroImage · doi:10.1016/j.neuroimage.2018.05.044 · Cited by 43 · cited 1×
“jects [535, 440] and a higher reproducibility between test-retest”
BackgroundSelf-citationMitigating gyral bias in cortical tractography via asymmetric fiber orientation distributions
Wu, Y., Hong, Y., Feng, Y., Shen, D. G., & Yap, P. (2019) · Medical Image Analysis · doi:10.1016/j.media.2019.101543 · Cited by 43 · cited 1×
“using an asymmetric FOD technique [500], which can depict”
Default mode network engagement beyond self-referential internal mentation
Vatansever, D., Manktelow, A., Sahakian, B. J., Menon, D. K., & Stamatakis, E. A. (2018) · Brain Connectivity · doi:10.1089/brain.2017.0489 · Cited by 42 · cited 1×
“For instance, following an inverted U-shaped trajectory, the peak ages of network efficiency and small-world measures (30 years) fall within the range of peak ages on general cognitive performance (Schaie, 2005; Schroeder and Salthouse, 2004), and brain regions within the default mode network, which is involved broadl…”
Joint RElaxation-Diffusion Imaging Moments to Probe Neurite Microstructure
Ning, L., Gagoski, B. A., Szczepankiewicz, F., Westin, C., & Yogesh Rathi, A. (2019) · IEEE Transactions on Medical Imaging · doi:10.1109/tmi.2019.2933982 · Cited by 42 · cited 1×
“Research is underway to improve biological specificity to the type of tissue change, by improving the information that is obtained at the acquisition level [487, 208, 24, 397, 192, 306], and by proposing advanced mathematical modeling and machine learning techniques [307, 495, 339].”
BackgroundXie, G., Zhang, F., Leung, L. W. L., Mooney, M. A., Epprecht, L., Norton, I. H., Yogesh Rathi, A., Kikinis, R., Al‐Mefty, O., Makris, N., et al. (2020) · NeuroImage Clinical · doi:10.1016/j.nicl.2019.102160 · Cited by 42 · cited 1×
“raphy and has been widely used to validate other anatomical tract identification techniques [344, 340, 503].”
Self-citationLi, B., de Groot, M., Steketee, R. M. E., Meijboom, R., Smits, M., Vernooij, M. W., Ikram, M. A., Liu, J., Niessen, W. J., & Bron, E. E. (2020) · NeuroImage · doi:10.1016/j.neuroimage.2020.116993 · Cited by 42 · cited 1×
“direct segmentation in the literature [147, 45, 568, 384, 386, 526, 601, 527, 139, 394, 300, 286].”
Proceedings of the ACM Turing Celebration Conference - China
(2020) · doi:10.1145/3393527 · Cited by 42
Deng, Y., Hung, K. S. Y., Lui, S. S. Y., Chui, W. W. H., Lee, J. C. W., Wang, Y., Li, Z., Mak, H. K. F., Sham, P. C., Chan, R. C. K., et al. (2019) · Progress in Neuro-Psychopharmacology and Biological Psychiatry · doi:10.1016/j.pnpbp.2018.06.010 · Cited by 40 · cited 1×
“Another tract-specific analysis strategy is data-driven and uses machine learning techniques to perform tasks such as disease classification and prediction [537, 114, 331, 317].”
MethodTRAFIC: fiber tract classification using deep learning
Prieto, J. C., Ngattai, P. D., Belhomme, G., et al. (2018) · SPIE Medical Imaging: Image Processing · doi:10.1117/12.2293931 · Cited by 39 · cited 2×
“There are also learning-based segmentation approaches that train a model from the reference tract segmentation data and predict an anatomical label for each streamline in a new subject [179, 246, 178, 243, 508, 533, 269, 504].”
BackgroundMethodBaraković, M., Tax, C. M. W., Rudrapatna, U. S., Chamberland, M., Rafael‐Patiño, J., Granziera, C., Thiran, J., Daducci, A., Canales-Rodríguez, E. J., & Jones, D. K. (2020) · NeuroImage · doi:10.1016/j.neuroimage.2020.117617 · Cited by 39 · cited 1×
“Research is underway to improve biological specificity to the type of tissue change, by improving the information that is obtained at the acquisition level [487, 208, 24, 397, 192, 306], and by proposing advanced mathematical modeling and machine learning techniques [307, 495, 339].”
BackgroundSelf-citationNavigating the link between processing speed and network communication in the human brain
Imms, P., Domínguez D, J. F., Burmester, A., Seguin, C., Clemente, A., Dhollander, T., Wilson, P. H., Poudel, G., & Caeyenberghs, K. (2021) · Brain Structure and Function · doi:10.1007/s00429-021-02241-8 · Cited by 39 · cited 1×
“Nonetheless, recent work has shown that advanced communication measures can elucidate how the organization of structural connectivity shapes neural information processing and functional dynamics [170, 291, 481, 210].”
BackgroundSelf-citationWitte, N. A. J. D., & Mueller, S. C. (2016) · Brain Imaging and Behavior · doi:10.1007/s11682-016-9642-2 · Cited by 38 · cited 1×
“studies on various brain disorders including, but not limited to, multiple sclerosis (MS) [167, 407], amnestic mild cognitive impairment (aMCI) [22, 597], Alzheimer’s disease [236, 298, 322, 491], stroke [329], schizophrenia [109, 188, 533], depression [128, 265], obsessive-compulsive disorder (OCD) [75, 96, 177, 198,…”
BackgroundYu, F. F., Chiang, F. L., Stephens, N., Huang, S. Y., Bilgiç, B., Tantiwongkosi, B., & Romero, R. S. (2018) · Neuroradiology · doi:10.1007/s00234-018-2137-7 · Cited by 38 · cited 1×
“, 2019) and may be influenced by different pathological factors such as iron or myelin (Fang et al., 2019).”
BackgroundRegional vulnerability of longitudinal cortical association connectivity
Ceschin, R. C., Lee, V., Schmithorst, V. J., et al. (2015) · NeuroImage Clinical · doi:10.1016/j.nicl.2015.08.021 · Cited by 37 · cited 1×
“[347, 78, 526] or performed data reduction techniques to reduce the dimensionality of the point-wise measurements along tracts [159, 71, 68].”
MethodShu, N., Duan, Y., Huang, J., Ren, Z., Liu, Z., Dong, H., Barkhof, F., Li, K., & Liu, Y. (2018) · NeuroImage Clinical · doi:10.1016/j.nicl.2018.03.034 · Cited by 37 · cited 1×
“for remote communication [301], decreased frontal network communicability that represents the parallel communication capacity [266] and impairments of rich-club connectivity that serve as core highways [403] in MS patients compared with healthy controls.”
BackgroundAutomated tract extraction via atlas based Adaptive Clustering
Tunç, B., Parker, W. A., Ingalhalikar, M., & Verma, R. (2014) · NeuroImage · doi:10.1016/j.neuroimage.2014.08.021 · Cited by 36 · cited 2×
“They group tractography streamlines according to their geometric trajectories, describing the structural connectivity according to the white matter anatomy [315, 551, 261, 176, 366, 76, 458, 524, 365, 518, 158, 540, 408, 16, 472, 409, 498].”
Intra-subject reliability of the high-resolution whole-brain structural connectome
Besson, P., Lopes, R., Leclerc, X., Derambure, P., & Tyvaert, L. (2014) · NeuroImage · doi:10.1016/j.neuroimage.2014.07.064 · Cited by 36 · cited 2×
“Various parcellation scales have been applied in different studies, ranging from tens to millions of white matter parcels (Besson et al., 2014; Liu et al., 2017; Osmanlıoğlu et al., 2020; Rodrigues et al., 2013; Zalesky et al., 2010; Zhang et al., 2018a).”
BackgroundMethodEllis, M. J., Rutka, J. T., Kulkarni, A. V., et al. (2012) · Journal of Neurosurgery Pediatrics · doi:10.3171/2012.1.peds11363 · Cited by 35 · cited 1×
“been widely used in various lesions located in both supratentorial and infratentorial areas [131, 137, 240], involving not only the major tracts but also smaller fiber structures [287].”
BackgroundAn Example-Based Multi-Atlas Approach to Automatic Labeling of White Matter Tracts
Yoo, S. W., Guevara, P., Jeong, Y., Yoo, K., Shin, J. S., Mangin, J., & Seong, J. (2015) · PLoS ONE · doi:10.1371/journal.pone.0133337 · Cited by 35 · cited 2×
“They group tractography streamlines according to their geometric trajectories, describing the structural connectivity according to the white matter anatomy [315, 551, 261, 176, 366, 76, 458, 524, 365, 518, 158, 540, 408, 16, 472, 409, 498].”
The impact of isolated lesions on white-matter fiber tracts in multiple sclerosis patients
Droby, A., Fleischer, V., Carnini, M., Zimmermann, H., Siffrin, V., Gawehn, J., Erb, M., Hildebrandt, A., Baier, B., & Zipp, F. (2015) · NeuroImage Clinical · doi:10.1016/j.nicl.2015.03.003 · Cited by 35 · cited 1×
“fected pathologically [123, 146] and the FA abnormalities in”
BackgroundZiyan, U., Sabuncu, M. R., Grimson, W. E. L., et al. (2009) · International Journal of Computer Vision · doi:10.1007/s11263-009-0217-1 · Cited by 35 · cited 2×
“They group tractography streamlines according to their geometric trajectories, describing the structural connectivity according to the white matter anatomy [315, 551, 261, 176, 366, 76, 458, 524, 365, 518, 158, 540, 408, 16, 472, 409, 498].”
A convex optimization framework for global tractography
Daducci, A., Palù, A. D., Lemkaddem, A., & Thiran, J. (2013) · IEEE International Symposium on Biomedical Imaging (ISBI) · doi:10.1109/isbi.2013.6556527 · Cited by 35 · cited 7×
“Many software packages are available to perform tractography research, including ANIMA [134], BrainSUITE [433], Camino [112], COMMIT [122, 123, 410, 342], Diffusion toolkit [523], Dipy [178], DMIPY [160], DSI studio [566], DTIstudio [249], ExploreDTI [283], FiberNavigator [83], FSL”
MethodInfluentialSelf-citationZhang, F., Wu, W., Ning, L., McAnulty, G. B., Waber, D. P., Gagoski, B. A., Sarill, K., Hamoda, H. M., Song, Y., Cai, W., et al. (2018) · NeuroImage · doi:10.1016/j.neuroimage.2018.01.006 · Cited by 35 · cited 3×
“ANOVA, or other more advanced statistical analysis methods [180, 285, 323, 538].”
BackgroundMethodSelf-citationTong, Q., He, H., Gong, T., Li, C., Liang, P., Qian, T., Sun, Y., Ding, Q., Li, K., & Zhong, J. (2019) · Magnetic Resonance Imaging · doi:10.1016/j.mri.2019.02.011 · Cited by 35 · cited 1×
“as well as test-retest reproducibility) [539, 450, 358].”
O'Dwyer, L., Lamberton, F., Matura, S., Scheibe, M., Miller, J., Rujescu, D., Prvulovic, D., & Hampel, H. (2012) · PLoS ONE · doi:10.1371/journal.pone.0036024 · Cited by 34 · cited 1×
“Another tract-specific analysis strategy is data-driven and uses machine learning techniques to perform tasks such as disease classification and prediction [537, 114, 331, 317].”
MethodShahab, S., Stefanik, L., Foussias, G., Lai, M., Anderson, K. K., & Voineskos, A. N. (2017) · Schizophrenia Bulletin · doi:10.1093/schbul/sbx049 · Cited by 34 · cited 1×
“These impairments are found reproducible across studies (Ohoshi et al., 2019; Price et al., 2007; Shahab et al., 2018) and are predictive for multiple cognitive domains (Sui et al.”
Schiavi, S., Petracca, M., Battocchio, M., Mendili, M. M. E., Paduri, S., Fleysher, L., Inglese, M., & Daducci, A. (2020) · Human Brain Mapping · doi:10.1002/hbm.24989 · Cited by 34 · cited 7×
“The most popular scalar value for connectivity matrix analysis is the NOS [112, 429, 211, 362, 182], where higher values are considered to indicate stronger connectivity between pairs of gray matter regions.”
InfluentialSelf-citationWidge, A. S., Zhang, F., Gosai, A. K., Papadimitrou, G., Wilson-Braun, P., Tsintou, M., Palanivelu, S., Noecker, A. M., McIntyre, C. C., O’Donnell, L. J., et al. (2021) · Neuropsychopharmacology · doi:10.1038/s41386-021-01199-9 · Cited by 34
Self-citationFIBERNET 2.0: An automatic neural network based tool for clustering white matter fibers in the brain
Gupta, V., Thomopoulos, S. I., Corbin, C. K., et al. (2018) · IEEE International Symposium on Biomedical Imaging (ISBI) · doi:10.1109/isbi.2018.8363672 · Cited by 34
Wang, D., Luo, Y., Mok, V. C. T., Chu, W. C. W., & Shi, L. (2016) · NeuroImage · doi:10.1016/j.neuroimage.2015.10.032 · Cited by 33 · cited 1×
“egy is to analyze data that are averaged across corresponding points along each streamline in the pathway [478, 89, 510, 74], while other studies have analyzed tracts represented as surfaces”
Malinsky, M., Peter, R., Hodneland, E., Lundervold, A. J., Lundervold, A., & Jan, J. (2013) · Journal of Digital Imaging · doi:10.1007/s10278-012-9561-8 · Cited by 33 · cited 2×
“, an image registration between dMRI and T1w images that can be affected by differences in image resolution [308] and echo-planar imaging (EPI) distortion in dMRI data [6].”
BackgroundA tract-specific approach to assessing white matter in preterm infants
Pecheva, D., Yushkevich, P., Batalle, D., Hughes, E., Aljabar, P., Wurie, J., Hajnal, J. V., Edwards, A. D., Alexander, D. C., Counsell, S. J., et al. (2017) · NeuroImage · doi:10.1016/j.neuroimage.2017.04.057 · Cited by 33 · cited 1×
“cal nonlinear trajectories (piecewise, exponential and quadratic) of diffusion metrics for major tracts across large developmental ranges such as infancy to childhood [333, 357, 434] or adolescence to adulthood [75, 251].”
Connectomic consistency: a systematic stability analysis of structural and functional connectivity
Osmanlıoğlu, Y., Alappatt, J. A., Parker, D., & Verma, R. (2020) · Journal of Neural Engineering · doi:10.1088/1741-2552/ab947b · Cited by 33
An Update on Promising Biomarkers in Schizophrenia
Goldsmith, D. R., Crooks, C. L., Walker, E. F., & Cotes, R. O. (2018) · FOCUS The Journal of Lifelong Learning in Psychiatry · doi:10.1176/appi.focus.20170046 · Cited by 32 · cited 3×
“idence for this hypothesis, indicating that schizophrenia may be seen in terms of affected pathways between cortical regions [166, 171].”
BackgroundParcellation-based tractographic modeling of the ventral attention network
Allan, P. G., Briggs, R. G., Conner, A. K., O’Neal, C. M., Bonney, P. A., Maxwell, B. D., Baker, C. M., Burks, J. D., Sali, G., Glenn, C. A., et al. (2019) · Journal of the Neurological Sciences · doi:10.1016/j.jns.2019.116548 · Cited by 32 · cited 1×
“a brain ROI atlas and use an image registration to automatically align the ROIs in the atlas space to the subject space [525, 225, 592, 593, 556, 15, 516, 274, 425, 11].”
MethodAtlas-Guided Cluster Analysis of Large Tractography Datasets
Ros, C., Güllmar, D., Stenzel, M., Mentzel, H., & Reichenbach, J. R. (2013) · PLoS ONE · doi:10.1371/journal.pone.0083847 · Cited by 31 · cited 2×
“They group tractography streamlines according to their geometric trajectories, describing the structural connectivity according to the white matter anatomy [315, 551, 261, 176, 366, 76, 458, 524, 365, 518, 158, 540, 408, 16, 472, 409, 498].”
Radmanesh, A., Zamani, A. A., Whalen, S., Tie, Y., Suarez, R. O., & Golby, A. J. (2014) · Clinical Neurology and Neurosurgery · doi:10.1016/j.clineuro.2014.11.021 · Cited by 31
Schreiber, J., Riffert, T., Anwander, A., & Knösche, T. R. (2014) · NeuroImage · doi:10.1016/j.neuroimage.2014.01.002 · Cited by 31 · cited 1×
“[343, 241, 240, 543, 288, 423], atlas-based [568, 527], differential tractography [567] and various forms of “global” tractogra-”
Zhao, X., Tian, L., Yan, J., Yue, W., Yan, H., & Zhang, D. (2017) · Neuroscience Bulletin · doi:10.1007/s12264-017-0151-0 · Cited by 31 · cited 1×
“between schizophrenia patients and healthy controls [102, 550].”
DeepBundle: Fiber Bundle Parcellation with Graph Convolution Neural Networks
Liu, F., Feng, J. H., Chen, G., Wu, Y., Hong, Y., Yap, P., & Shen, D. G. (2019) · Lecture notes in computer science · doi:10.1007/978-3-030-35817-4_11 · Cited by 31 · cited 2×
“Often, streamline labeling is done by computing the geometric distance of each streamline to labeled streamlines in a reference tract segmentation, and then assigning a streamline label based on the closest reference tract (Bertò et al., 2020; Clayden et al., 2007; Gupta et al., 2018; 2017b; Kumar et al., 2019; Labra…”
MethodTractography in the Study of the Human Brain: A Neurosurgical Perspective
Fortin, D., Aubin-Lemay, C., Boré, A., Girard, G., Houde, J., Whittingstall, K., & Descoteaux, M. (2012) · Canadian Journal of Neurological Sciences / Journal Canadien des Sciences Neurologiques · doi:10.1017/s0317167100015560 · Cited by 30 · cited 1×
“important for quality of life and overall survival of neurosurgical patients [97, 132, 151, 328].”
BackgroundJavadi, S. A. H., Arya, N., Mario, G., et al. (2017) · Neurosurgery · doi:10.1093/neuros/nyx083 · Cited by 30
The social brain network in 22q11.2 deletion syndrome: a diffusion tensor imaging study
Olszewski, A. K., Kikinis, Z., Gonzalez, C. S., Coman, I. L., Makris, N., Gong, X., Yogesh Rathi, A., Zhu, A., Antshel, K. M., Fremont, W. P., et al. (2017) · Behavioral and Brain Functions · doi:10.1186/s12993-017-0122-7 · Cited by 30 · cited 1×
“It can also be computed by averaging microstructural measures sampled along each point of the streamlines [322, 537, 169, 539, 228].”
BackgroundZöllei, L., Jaimes, C. E., Saliba, É., Grant, P. E., & Yendiki, A. (2019) · NeuroImage · doi:10.1016/j.neuroimage.2019.05.051 · Cited by 29 · cited 2×
“line data, the direct segmentation methods operate on DWI data [568, 601] or derived volumetric image data (e.”
MethodCao, R., Yang, X., Luo, J., Wang, P., Meng, F., Xia, M., Yong He, A., Zhao, T., & Li, Z. (2020) · Progress in Neuro-Psychopharmacology and Biological Psychiatry · doi:10.1016/j.pnpbp.2020.110037 · Cited by 29 · cited 2×
“dMRI tractography has become an indispensable tool for studies on various brain disorders including, but not limited to, multiple sclerosis (MS) [146, 372], amnestic mild cognitive impairment (aMCI) [19, 548], Alzheimer’s disease [213, 273, 293, 449], stroke [300], schizophrenia [92, 166, 490], depression [110, 239],…”
Self-citationTseng, W. I., Hsu, Y., Chen, C., Kang, Y.-J., Kao, T.-W., Chen, P., & Waiter, G. D. (2020) · Neurobiology of Aging · doi:10.1016/j.neurobiolaging.2020.10.006 · Cited by 29 · cited 1×
“ploying thousands of participants [99, 174, 457], which brings us into an unprecedented “big data” era [502].”
Hansen, C. B., Yang, Q., Lyu, I., Rheault, F., Kerley, C. I., Chandio, B. Q., Fadnavis, S., Williams, O. A., Shafer, A. T., Resnick, S. M., et al. (2020) · Neuroinformatics · doi:10.1007/s12021-020-09497-1 · Cited by 29 · cited 1×
“Currently, popularly used brain ROI atlases include those provided in Freesurfer [117, 143], MNI–ICBM152 [286, 297, 320, 319], and JHU-DTI [477, 476] (see [184] for a review of more atlases).”
MethodMulti-label segmentation of white matter structures: Application to neonatal brains
Ratnarajah, N., & Qiu, A. (2014) · NeuroImage · doi:10.1016/j.neuroimage.2014.08.001 · Cited by 28 · cited 1×
“The third category of automated tract identification is called direct segmentation in the literature (Bazin et al., 2011; Dong et al., 2019; Eckstein et al., 2009; Li et al., 2020a; Lu et al., 2020; Ratnarajah and Qiu, 2014; Reisert et al., 2018; Rheault et al., 2019; Wasserthal et al., 2018; 2019; Yendiki et al., 201…”
Liu, Y., Duan, Y., Dong, H., et al. (2018) · Frontiers in Human Neuroscience · doi:10.3389/fnhum.2018.00138 · Cited by 28 · cited 1×
“Researchers have observed consistent disrupted network integration including reduction of global efficiency and network strength (Liu et al., 2018; Schiavi et al., 2020b; Shu et al., 2016; 2011), breakdown of long-range connections that account for remote communication (Muthuraman et al.”
BackgroundChen, Y., Zhang, C., Song, Y., Makris, N., Rathi, Y., Cai, W., Zhang, F., & O’Donnell, L. J. (2021) · Lecture Notes in Computer Science · doi:10.1007/978-3-030-87234-2_47 · Cited by 28 · cited 1×
“Lastly, deep learning techniques have been increasingly applied for anatomical tract identification, showing high potential for future work and improvements in computational speed (Chen et al., 2021; Gupta et al., 2017a; 2018; 2017b; Lam et al., 2018; Reisert et al., 2018; Wasserthal et al., 2018; 2019; Xu et al., 201…”
MethodSelf-citationZhao, T., Sheng, C., Bi, Q., Niu, W., Shu, N., & Han, Y. (2017) · Neurobiology of Aging · doi:10.1016/j.neurobiolaging.2017.08.005 · Cited by 27
Self-citationOhoshi, Y., Takahashi, S., Yamada, S., Ishida, T., Tsuda, K., Tsuji, T., Terada, M., Shinosaki, K., & Ukai, S. (2019) · Brain and Behavior · doi:10.1002/brb3.1357 · Cited by 27 · cited 1×
“These impairments are found reproducible across studies [318, 342, 393] and are predictive for multi-”
BackgroundKreilkamp, B. A. K., Lisanti, L., Glenn, G. R., Wieshmann, U. C., Das, K., Marson, A. G., & Keller, S. S. (2019) · NeuroImage: Clinical · doi:10.1016/j.nicl.2019.102024 · Cited by 27 · cited 1×
“the gold standard for benchmarked comparisons and algorithm training [268, 526, 593].”
BackgroundQiu, A., Oishi, K., Miller, M. I., Lyketsos, C. G., Mori, S., & Albert, M. (2010) · PLoS ONE · doi:10.1371/journal.pone.0009811 · Cited by 26 · cited 1×
“[347, 78, 526] or performed data reduction techniques to reduce the dimensionality of the point-wise measurements along tracts [159, 71, 68].”
Fiber bundle length and cognition: a length-based tractography MRI study
Behrman-Lay, A. M., Usher, C., Conturo, T. E., Correia, S., Laidlaw, D. H., Lane, E. M., Bolzenius, J., Heaps, J. M., Salminen, L. E., Baker, L. M., et al. (2015) · Brain Imaging and Behavior · doi:10.1007/s11682-014-9334-8 · Cited by 26 · cited 1×
“Other quantitative measures can be computed directly from tractography, such as the volume and the length of a fiber tract [88, 510, 73, 358, 66, 419, 20, 39, 173], have also been used.”
BackgroundConnectomics Sheds New Light on Alzheimer’s Disease
Toga, A. W., & Thompson, P. M. (2013) · Biological Psychiatry · doi:10.1016/j.biopsych.2013.01.004 · Cited by 25 · cited 1×
“studies on various brain disorders including, but not limited to, multiple sclerosis (MS) [167, 407], amnestic mild cognitive impairment (aMCI) [22, 597], Alzheimer’s disease [236, 298, 322, 491], stroke [329], schizophrenia [109, 188, 533], depression [128, 265], obsessive-compulsive disorder (OCD) [75, 96, 177, 198,…”
Tractography delineation of the vertical occipital fasciculus using quantitative T1 mapping
Schurr, R., Filo, S., & Mezer, A. (2019) · NeuroImage · doi:10.1016/j.neuroimage.2019.116121 · Cited by 25 · cited 1×
“a brain ROI atlas and use an image registration to automatically align the ROIs in the atlas space to the subject space [525, 225, 592, 593, 556, 15, 516, 274, 425, 11].”
Reproducibility of the structural connectome reconstruction across diffusion methods
Prčkovska, V., Rodrigues, P., Puigdellivol Sanchez, A., Ramos, M., Andorra, M., Martinez‐Heras, E., Falcon, C., Prats‐Galino, A., & Villoslada, P. (2016) · Journal of Neuroimaging · doi:10.1111/jon.12298 · Cited by 24 · cited 1×
“In general, studies indicate that modern multifiber tractography is more sensitive when performing tractography and thus is more consistent across subjects and timepoints than traditional single-fiber DTI tractography [63, 374].”
Tax, C. M. W., Duits, R., Vilanova, A., Romeny, B. M. T. H., Hofman, P. A. M., Wagner, L., Leemans, A., & Ossenblok, P. (2014) · PLoS ONE · doi:10.1371/journal.pone.0101524 · Cited by 24 · cited 1×
“, those requiring a lower anisotropy threshold, more lenient curvature threshold, or a dedicated tracking algorithm (such as the optic radiation [485, 438]).”
BackgroundCommunity detection in network neuroscience
Betzel, R. F. (2020) · arXiv · doi:10.48550/arxiv.2011.06723 · Cited by 24
Active fibers: Matching deformable tract templates to diffusion tensor images
Eckstein, I., Shattuck, D. W., Stein, J. L., McMahon, K. L., de Zubicaray, G. I., Wright, M. J., Thompson, P. M., & Toga, A. W. (2009) · NeuroImage · doi:10.1016/j.neuroimage.2009.01.065 · Cited by 23
Liu, X., Lauer, K. K., Ward, B. D., Roberts, C. J., Liu, S., Gollapudy, S., Rohloff, R., Gross, W., Xu, Z., Chen, G., et al. (2017) · Brain Connectivity · doi:10.1089/brain.2016.0477 · Cited by 23 · cited 1×
“, studies have suggested a fine scale white matter parcellation (over 2000 parcels) can be beneficial for machine learning and statistical analysis [537, 270] while a coarse scale parcellation (fewer than 200 parcels) can improve the connec-”
BackgroundDiffusion Tensor Tractography of the Cerebellar Peduncles in Prematurely Born 7-Year-Old Children
Shany, E., Inder, T. E., Goshen, S., Lee, I., Neil, J. J., Smyser, C. D., Doyle, L. W., Anderson, P. J., & Shimony, J. S. (2016) · The Cerebellum · doi:10.1007/s12311-016-0796-7 · Cited by 22 · cited 1×
“and studies particular anatomical fiber tracts [5, 523, 394, 259].”
Data-driven fiber tractography with neural networks
Wegmayr, V., Giuliari, G., Holdener, S., & Buhmann, J. M. (2018) · IEEE International Symposium on Biomedical Imaging (ISBI) · doi:10.1109/isbi.2018.8363747 · Cited by 22 · cited 1×
“Work is additionally underway to improve tractography using machine learning [373, 333, 528, 406, 527].”
BackgroundSynchronization lag in post stroke: relation to motor function and structural connectivity
Wang, X., Seguin, C., Zalesky, A., Wong, W.-W., Chu, C. W., & Tong, R. K. (2019) · Network Neuroscience · doi:10.1162/netn_a_00105 · Cited by 22
Self-citationTowards deep learning for connectome mapping: A block decomposition framework
Sarwar, T., Seguin, C., Ramamohanarao, K., & Zalesky, A. (2020) · NeuroImage · doi:10.1016/j.neuroimage.2020.116654 · Cited by 22 · cited 1×
“Work is additionally underway to improve tractography using machine learning [373, 333, 528, 406, 527].”
Self-citationBi, Q., Wang, W., Niu, N., Li, H., Wang, Y., Huang, W., Chen, K., Xu, K., Zhang, J., Chen, Y., et al. (2020) · NeuroImage · doi:10.1016/j.neuroimage.2020.117591 · Cited by 22 · cited 1×
“metabolic mechanisms underlying aging-related changes of brain tractography, in which they found that the overall connectome efficiency-metabolism coupling across brain regions significantly increased with aging [48].”
BackgroundThe R1-weighted connectome: complementing brain networks with a myelin-sensitive measure
Boshkovski, T., Kocarev, L., Cohen‐Adad, J., Mišić, B., Lehéricy, S., Stikov, N., & Mancini, M. (2021) · Network Neuroscience · doi:10.1162/netn_a_00179 · Cited by 22
Fernandes-Cabral, D. T., Zenonos, G. A., Hamilton, R. L., Panesar, S. S., & Fernandez-Miranda, J. C. (2016) · World Neurosurgery · doi:10.1016/j.wneu.2016.04.128 · Cited by 21 · cited 1×
“been widely used in various lesions located in both supratentorial and infratentorial areas [131, 137, 240], involving not only the major tracts but also smaller fiber structures [287].”
BackgroundZhang, F., Norton, I. H., Cai, W., Song, Y., Wells, W. M., & O’Donnell, L. J. (2017) · IEEE International Symposium on Biomedical Imaging (ISBI) · doi:10.1109/isbi.2017.7950638 · Cited by 21 · cited 1×
“jects [535, 440] and a higher reproducibility between test-retest”
BackgroundSelf-citationPayabvash, S., Palacios, E. M., Owen, J. P., Wang, M. B., Tavassoli, T., Gerdes, M., Brandes-Aitken, A., Marco, E. J., & Mukherjee, P. (2019) · NeuroImage: Clinical · doi:10.1016/j.nicl.2019.101831 · Cited by 21 · cited 1×
“Another tract-specific analysis strategy is data-driven and uses machine learning techniques to perform tasks such as disease classification and prediction [537, 114, 331, 317].”
MethodMultivalued Geodesic Ray-Tracing for Computing Brain Connections Using Diffusion Tensor Imaging
Sepasian, N., Boonkkamp, J. H. M. T. T., Romeny, B. M. T. H., et al. (2012) · SIAM Journal on Imaging Sciences · doi:10.1137/110824395 · Cited by 20 · cited 1×
“lution [454, 337, 392], geodesic (identifying likely connection”
Genetic white matter fiber tractography with global optimization
Wu, X., Xu, Q., Xu, L., Zhou, J., Anderson, A. W., & Ding, Z. (2009) · Journal of Neuroscience Methods · doi:10.1016/j.jneumeth.2009.07.032 · Cited by 20
Tract Dictionary Learning for Fast and Robust Recognition of Fiber Bundles
Wu, Y., Hong, Y., Ahmad, S., et al. (2020) · Lecture notes in computer science · doi:10.1007/978-3-030-59728-3_25 · Cited by 20
Albi, A., Meola, A., Zhang, F., Kahali, P., Rigolo, L., Tax, C. M. W., Ciris, P. A., Essayed, W. I., Unadkat, P., Norton, I., et al. (2018) · Journal of Neuroimaging · doi:10.1111/jon.12485 · Cited by 19 · cited 1×
“echo-planar imaging (EPI) distortion in dMRI data [4].”
BackgroundSelf-citationSiless, V., Davidow, J. Y., Nielsen, J. A., Fan, Q., Hedden, T., Hollinshead, M. O., Beam, E., Bustamante, C. M. V., Garrad, M. C., Santillana, R. M., et al. (2020) · NeuroImage · doi:10.1016/j.neuroimage.2020.116703 · Cited by 19 · cited 2×
“They group tractography streamlines according to their geometric trajectories, describing the structural connectivity according to the white matter anatomy [315, 551, 261, 176, 366, 76, 458, 524, 365, 518, 158, 540, 408, 16, 472, 409, 498].”
BackgroundMethodDiffusion MRI tractography filtering techniques change the topology of structural connectomes
Frigo, M., Deslauriers-Gauthier, S., Parker, D., Aziz Ould Ismail, A., John Kim, J., Verma, R., & Deriche, R. (2020) · Journal of Neural Engineering · doi:10.1088/1741-2552/abc29b · Cited by 19 · cited 2×
“of the topology of brain networks [153, 85, 516] and affect sensitivity and specificity when analyzing the connectomes [528].”
BackgroundMethodHierarchical microstructure informed tractography
Ocampo-Pineda, M., Schiavi, S., Rheault, F., Girard, G., Petit, L., Descoteaux, M., & Daducci, A. (2021) · Brain Connectivity · doi:10.1089/brain.2020.0907 · Cited by 19 · cited 8×
“MIT2 [375] and COMMIT2tree [312]; these “weights” represent an effective cross-sectional area of each streamline, which can be utilized as a direct measure of connection density [411] (or indeed to modulate streamline contributions toward other aggregate measures of the connectivity “strength”; see Section 5).”
BackgroundMethodInfluentialSelf-citationAcquiring and Predicting Multidimensional Diffusion (MUDI) Data: An Open Challenge
Pizzolato, M., Palombo, M., Bonet-Carné, E., Tax, C. M. W., Grussu, F., Ianuș, A., Bogusz, F., Pieciak, T., Ning, L., Larochelle, H., et al. (2020) · Mathematics and visualization · doi:10.1007/978-3-030-52893-5_17 · Cited by 18 · cited 1×
“Research is underway to improve biological specificity to the type of tissue change, by improving the information that is obtained at the acquisition level [487, 208, 24, 397, 192, 306], and by proposing advanced mathematical modeling and machine learning techniques [307, 495, 339].”
Self-citationAlignment of Tractograms As Graph Matching
Olivetti, E., Sharmin, N., & Avesani, P. (2016) · Frontiers in Neuroscience · doi:10.3389/fnins.2016.00554 · Cited by 17
A Novel Anatomically-Constrained Global Tractography Approach to Monitor Sharp Turns in Gyri
Teillac, A., Beaujoin, J., Poupon, F., Mangin, J., & Poupon, C. (2017) · Lecture notes in computer science · doi:10.1007/978-3-319-66182-7_61 · Cited by 17 · cited 1×
“, 2019b) and various forms of “global” tractography that simultaneously fit the entire tractography reconstruction to all image data (either by progressively forming linked chains from a large set of randomly-initialized short segments (Christiaens et al., 2015; Fillard et al., 2009; Kreher et al., 2008; Mangin et al.…”
BackgroundReducing variability in along-tract analysis with diffusion profile realignment
St‐Jean, S., Chamberland, M., Viergever, M. A., & Leemans, A. (2019) · NeuroImage · doi:10.1016/j.neuroimage.2019.06.016 · Cited by 17
Damatac, C. G., Chauvin, R. J., Zwiers, M. P., van Rooij, D., Akkermans, S. E. A., Naaijen, J., Hoekstra, P. J., Hartman, C. A., Oosterlaan, J., Franke, B., et al. (2020) · Biological Psychiatry Cognitive Neuroscience and Neuroimaging · doi:10.1016/j.bpsc.2020.07.015 · Cited by 17
(2021) · Lecture notes in computer science · doi:10.1007/978-3-030-87615-9 · Cited by 17
Louapre, C., Govindarajan, S. T., Giannì, C., Cohen‐Adad, J., Gregory, M. D., Nielsen, A. S., Madigan, N. K., Sloane, J. A., Kinkel, R. P., & Mainero, C. (2015) · Radiology · doi:10.1148/radiol.2015150486 · Cited by 16 · cited 1×
“By combining along-tract analysis and intracortical measurements, researchers further found that although the abnormalities in white matter tracts of MS are concomitant with intra-cortical injuries, this relationship is not strictly following a tract-cortexspecific pattern [299].”
BackgroundBathelt, J., Barnes, J., Raymond, F. L., Baker, K., & Astle, D. (2017) · Cerebral Cortex · doi:10.1093/cercor/bhx027 · Cited by 15
Miswiring of Frontostriatal Projections in Schizophrenia
Levitt, J. J., Nestor, P. G., Kubicki, M. R., Lyall, A. E., Zhang, F., Raviv, T. R., O’Donnell, L. J., McCarley, R. W., Shenton, M. E., & Yogesh Rathi, A. (2019) · Schizophrenia Bulletin · doi:10.1093/schbul/sbz129 · Cited by 15 · cited 1×
“and studies particular anatomical fiber tracts [5, 523, 394, 259].”
Self-citationAsymmetric fiber trajectory distribution estimation using streamline differential equation
Feng, Y., & He, J. (2020) · Medical Image Analysis · doi:10.1016/j.media.2020.101686 · Cited by 15 · cited 2×
“[27, 94, 296, 488, 28, 452, 116, 38, 154, 249, 454, 214, 138, 280, 352, 484, 135], and the ways in which specific undesir-”
BackgroundThe use of tractography-based targeting in deep brain stimulation for psychiatric indications
Davidson, B., Lipsman, N., Meng, Y., Rabin, J. S., Giacobbe, P., & Hamani, C. (2020) · Frontiers in Human Neuroscience · doi:10.3389/fnhum.2020.588423 · Cited by 15 · cited 3×
“In psychiatric surgery, tractography results are used to improve targeting during DBS surgery for patients with refractory psychiatric diseases such as depression, obsessivecompulsive disorder (OCD), or posttraumatic stress disorder (PTSD) (Davidson et al., 2020; Fenoy, 2020).”
BackgroundMethodHAMLET: Hierarchical Harmonic Filters for Learning Tracts from Diffusion MRIPreprint
Reisert, M., Coenen, V. A., Kaller, C. P., et al. (2018) · arXiv (Cornell University) · doi:10.48550/arxiv.1807.01068 · Cited by 15
Two Parallel Stages Deep Learning Network for Anterior Visual Pathway Segmentation
Li, S., Chen, Z., Guo, W., Zeng, Q., & Feng, Y. (2021) · Mathematics and visualization · doi:10.1007/978-3-030-73018-5_22 · Cited by 15
Globally optimized fiber tracking and hierarchical clustering — a unified framework
Wu, X., Xie, M., Zhou, J., Anderson, A. W., Gore, J. C., & Ding, Z. (2012) · Magnetic Resonance Imaging · doi:10.1016/j.mri.2011.12.017 · Cited by 14 · cited 1×
“ing a set of candidate trajectories [496, 36, 258, 87]).”
Li, M., Ratnanather, J. T., Miller, M. I., & Mori, S. (2013) · NeuroImage · doi:10.1016/j.neuroimage.2013.10.011 · Cited by 13 · cited 1×
“[343, 241, 240, 543, 288, 423], atlas-based [568, 527], differential tractography [567] and various forms of “global” tractogra-”
BackgroundDelineating Neural Structures of Developmental Human Brains with Diffusion Tensor Imaging
Huang, H. (2010) · The Scientific World JOURNAL · doi:10.1100/tsw.2010.21 · Cited by 13 · cited 1×
“tal stages ranging from the middle fetal stage to adulthood [71, 142, 183, 226, 279, 281, 379, 598].”
BackgroundCross-subject Comparison of Local Diffusion MRI Parameters
Smith, S. M., & Kindlmann, G. (2009) · Elsevier eBooks · doi:10.1016/b978-0-12-374709-9.00008-0 · Cited by 13 · cited 1×
“Critically, this step enables crosssubject quantitative comparison of the segmented white matter pathways; see [457] for a review of general considerations”
BackgroundSeguin, C., Tian, Y., & Zalesky, A. (2020) · bioRxiv (Cold Spring Harbor Laboratory) · doi:10.1101/2020.04.21.053702 · Cited by 13 · cited 1×
“termining which approaches most accurately reflect underlying biological processes remains a crucial open question [429].”
Self-citationA hybrid approach for optimal automatic segmentation of White Matter tracts in HARDI
Chekir, A., Descoteaux, M., Garyfallidis, E., Cote, M.-A., & Boumghar, F. O. (2014) · 2014 IEEE Conference on Biomedical Engineering and Sciences (IECBES) · doi:10.1109/iecbes.2014.7047481 · Cited by 12 · cited 2×
“To reduce the amount of labeling for each streamline, many streamline labeling methods first group streamlines into clusters (known as fiber clustering), followed by assigning an anatomical label for each cluster, thus labeling each streamline (Avila et al., 2019; Chekir et al., 2014; Garyfallidis et al., 2018; Guevar…”
MethodCombining white matter diffusion and geometry for tract-specific alignment and variability analysis
Benou, I., Veksler, R., Friedman, A., & Raviv, T. R. (2019) · NeuroImage · doi:10.1016/j.neuroimage.2019.05.003 · Cited by 12 · cited 1×
“form a linear registration [347, 180], while many studies have proposed to perform non-linear approaches to enable deformations of the streamlines [355, 51, 84].”
BackgroundProbing tissue microstructure by diffusion skewness tensor imaging
Ning, L., Szczepankiewicz, F., Nilsson, M., Yogesh Rathi, A., & Westin, C. (2021) · Scientific Reports · doi:10.1038/s41598-020-79748-3 · Cited by 12 · cited 1×
“Research is underway to improve biological specificity to the type of tissue change, by improving the information that is obtained at the acquisition level [487, 208, 24, 397, 192, 306], and by proposing advanced mathematical modeling and machine learning techniques [307, 495, 339].”
BackgroundSchilling, K. G., Tax, C. M. W., Rheault, F., et al. (2021) · bioRxiv (Cold Spring Harbor Laboratory) · doi:10.1101/2021.06.22.449454 · Cited by 12
Evaluating 35 Methods to Generate Structural Connectomes Using Pairwise Classification
Petrov, D., Ivanov, A., Faskowitz, J., Gutman, B. A., Moyer, D., Villalon, J. E., Jahanshad, N., & Thompson, P. M. (2017) · Lecture notes in computer science · doi:10.1007/978-3-319-66182-7_59 · Cited by 12
Multimodality white matter tract segmentation using CNN
Dong, X., Yang, Z., Peng, J., & Wu, X. (2019) · ACM Turing Celebration Conference - China (ACM TURC) · doi:10.1145/3321408.3326673 · Cited by 11 · cited 1×
“direct segmentation in the literature [129, 37, 351, 353, 483, 484, 121, 361, 274, 260].”
Editorial: network communication in the brain
Graham, D., Avena-Koenigsberger, A., & Mišić, B. (2020) · Network Neuroscience · doi:10.1162/netn_e_00167 · Cited by 11 · cited 1×
“vidual ROIs (nodes), to mesoscale measures describing clusters of interconnected ROIs, to global measures that describe whole-brain connectivity properties [56, 171] such as network communication in the brain [194] (Figure 4b).”
BackgroundGupta, T., Patil, S. M., Tailor, M., Thapar, D., & Nigam, A. (2017) · arXiv (Cornell University) · doi:10.48550/arxiv.1710.05158 · Cited by 11
Close, T., Tournier, J., Johnston, L. A., Calamante, F., Mareels, I., & Connelly, A. (2015) · NeuroImage · doi:10.1016/j.neuroimage.2015.05.090 · Cited by 10 · cited 1×
“, 2017)or iteratively perturbing a set of candidate trajectories (Battocchio et al., 2020; Close et al., 2015; Lemkaddem et al., 2014; Wu et al., 2012b).”
BackgroundThe frequent complete subgraphs in the human connectome
Fellner, M., Varga, B., & Grolmusz, V. I. (2020) · PLoS ONE · doi:10.1371/journal.pone.0236883 · Cited by 10 · cited 1×
“, by identifying streamlines that connect pairs of vertices in the cortical surface [44, 134, 448].”
BackgroundLabra, N., Lebenberg, J., Rivière, D., Auzias, G., Fischer, C., Poupon, F., Guevara, P., Poupon, C., & Mangin, J. (2019) · Mathematics and visualization · doi:10.1007/978-3-030-05831-9_25 · Cited by 10 · cited 2×
“To reduce the amount of labeling for each streamline, many streamline labeling methods first group streamlines into clusters (known as fiber clustering), followed by assigning an anatomical label for each cluster, thus labeling each streamline (Avila et al., 2019; Chekir et al., 2014; Garyfallidis et al., 2018; Guevar…”
MethodDiffusion MRI Fiber Tractography
Smith, R. E., Connelly, A., & Calamante, F. (2020) · Advances in magnetic resonance technology and applications · doi:10.1016/b978-0-12-817057-1.00023-8 · Cited by 10 · cited 1×
“rect evidence of fiber terminations [412]).”
Self-citationAbdolalizadeh, A., Ostadrahimi, H., Mohajer, B., Darvishi, A., Sattarian, M., Ershadi, A. S. B., & Abbasi, N. (2020) · Psychiatry Research Neuroimaging · doi:10.1016/j.pscychresns.2020.111105 · Cited by 9 · cited 1×
“These tract-specific impairments exhibit significant symptom associations in deficits of working memory [257], hallucinations [439] and attention [1].”
BackgroundHansen, C. B., Yang, Q., Lyu, I., et al. (2020) · bioRxiv (Cold Spring Harbor Laboratory) · doi:10.1101/2020.06.12.148999 · Cited by 9
White matter fiber analysis using kernel dictionary learning and sparsity priors
Kumar, K., Kaleem Siddiqi, A., & Desrosiers, C. (2019) · Pattern Recognition · doi:10.1016/j.patcog.2019.06.002 · Cited by 8 · cited 2×
“Often, streamline labeling is done by computing the geometric distance of each streamline to labeled streamlines in a reference tract segmentation, and then assigning a streamline label based on the closest reference tract (Bertò et al., 2020; Clayden et al., 2007; Gupta et al., 2018; 2017b; Kumar et al., 2019; Labra…”
MethodLocal White Matter Fiber Clustering Differentiates Parkinson’s Disease Diagnoses
Feng, Y., Yan, W., Wang, J., Song, J., Zeng, Q., & Zhao, C. (2020) · Neuroscience · doi:10.1016/j.neuroscience.2020.03.049 · Cited by 8
White Matter Tract Segmentation with Self-supervised Learning
Lu, Q., Li, Y., & Ye, C. (2020) · Lecture notes in computer science · doi:10.1007/978-3-030-59728-3_27 · Cited by 8
Cross-Subject Comparison of Local Diffusion MRI Parameters
Smith, S. M., Kindlmann, G., & Jbabdi, S. (2014) · Diffusion MRI · doi:10.1016/b978-0-12-396460-1.00010-x · Cited by 8
Hart, M. G., Romero-Garcia, R., Price, S. J., Santarius, T., & Suckling, J. (2020) · World Neurosurgery · doi:10.1016/j.wneu.2020.03.116 · Cited by 7 · cited 1×
“The brain connectomic concept benefits traditional surgical strategy by a potential shift from focusing on local topography to a network-guided “oncological disconnection surgery” (Duffau, 2021; Hart et al., 2020).”
BackgroundAndrei Irimia, A., Fan, D., Chaudhari, N. N., Ngo, V., Zhang, F., Joshi, S. H., & O’Donnell, L. J. (2020) · IEEE International Symposium on Biomedical Imaging (ISBI) · doi:10.1109/isbi45749.2020.9098476 · Cited by 7 · cited 1×
“This approach requires definition of a coordinate system, sampling framework, or surface-based representation to define how to sample the microstructural data of interest [556, 349, 193, 48, 254, 113, 106, 93, 563, 234].”
BackgroundSelf-citationVázquez, A., López-López, N., Houenou, J., Poupon, C., Mangin, J., Ladra, S., & Guevara, P. (2020) · BioMedical Engineering OnLine · doi:10.1186/s12938-020-00786-z · Cited by 7 · cited 2×
“They group tractography streamlines according to their geometric trajectories, describing the structural connectivity according to the white matter anatomy [315, 551, 261, 176, 366, 76, 458, 524, 365, 518, 158, 540, 408, 16, 472, 409, 498].”
Combining Improved Euler and Runge-Kutta 4th order for Tractography in Diffusion-Weighted MRI
Cherifi, D., Boudjada, M., Morsli, A., Girard, G., & Rachid Deriche, B. (2017) · Biomedical Signal Processing and Control · doi:10.1016/j.bspc.2017.11.008 · Cited by 6 · cited 1×
“However, doing so in a manner that is compatible with diffusion models that account for crossing fibers can be technically difficult (Aydogan and Shi, 2020; Cherifi et al., 2018; Tournier et al., 2010).”
BackgroundMapping Structural Connectivity Using Diffusion MRI : Challenges and Opportunities
Yeh, C., Jones, D. K., Liang, X., et al. (2021) · Journal of Magnetic Resonance Imaging · doi:10.1002/jmri.27225 · Cited by 6
Self-citationGrinberg, F., Maximov, I. I., Farrher, E., & Shah, N. J. (2017) · Magnetic Resonance Imaging · doi:10.1016/j.mri.2017.08.007 · Cited by 5 · cited 1×
“Other quantitative measures can be computed directly from tractography, such as the volume and the length of a fiber tract [105, 556, 85, 391, 77, 459, 23, 47, 196], have also been used.”
BackgroundFunctional clustering of whole brain white matter fibers
Yang, Z., Li, X., Zhou, J., Wu, X., & Ding, Z. (2020) · Journal of Neuroscience Methods · doi:10.1016/j.jneumeth.2020.108626 · Cited by 5 · cited 1×
“There are also learning-based segmentation approaches that train a model from the reference tract segmentation data and predict an anatomical label for each streamline in a new subject [179, 246, 178, 243, 508, 533, 269, 504].”
A Stem-Based Dissection of Inferior Fronto-Occipital Fasciculus with A Deep Learning Model
Astolfi, P., BENEDICTIS, A. D., Sarubbo, S., Bertò, G., Olivetti, E., Sona, D., & Avesani, P. (2020) · IEEE International Symposium on Biomedical Imaging (ISBI) · doi:10.1109/isbi45749.2020.9098483 · Cited by 5 · cited 2×
“There are also ROI-based methods that directly predict ROIs in subject space using machine learning (Astolfi et al., 2020; Li et al., 2020b).”
MethodScattered slice shard reconstruction for motion correction in multi-shell diffusion MRI
Christiaens, D., Cordero-Grande, L., Pietsch, M., Hutter, J., Price, A. N., Hughes, E. J., Vecchiato, K., Deprez, M., Edwards, A. D., Hajnal, J. V., et al. (2021) · NeuroImage · doi:10.1016/j.neuroimage.2020.117437 · Cited by 4 · cited 1×
“roanatomical studies [260, 97], which indicates strong potential for future prenatal brain investigations.”
BackgroundImproving Tractography Accuracy Using Dynamic Filtering
Battocchio, M., Schiavi, S., Descoteaux, M., & Daducci, A. (2021) · Mathematics and visualization · doi:10.1007/978-3-030-73018-5_4 · Cited by 4 · cited 1×
“[313, 267, 163, 387, 312, 98, 486], or iteratively perturbing a set of candidate trajectories [542, 43, 284, 103]).”
BackgroundSelf-citationChallenges in deep brain stimulation for depression
Fenoy, A. J. (2020) · Brazilian Journal of Psychiatry · doi:10.1590/1516-4446-2020-0878 · Cited by 3 · cited 1×
“fractory psychiatric diseases such as depression, obsessivecompulsive disorder (OCD), or post-traumatic stress disorder (PTSD) [126, 157].”
BackgroundResolving to super resolution multi-dimensional diffusion imaging (Super-MUDI)
Nath, V., Pizzolato, M., Palombo, M., et al. (2021) · Technical University of Denmark, DTU Orbit (Technical University of Denmark, DTU) · Cited by 3
Self-citation(2019) · Infoscience (Ecole Polytechnique Fédérale de Lausanne) · Cited by 3
Self-citationBarch, D. M., Verfaellie, M. H., & Rao, S. M. (2016) · Journal of the International Neuropsychological Society · doi:10.1017/s1355617716000047 · Cited by 2 · cited 1×
“proach is motivated by a general shift of focus away from the roles of isolated regions towards understanding the brain as a networked system [176, 30].”
Background
Research works printed but not linked: 10
- Barakovic, 2021, Resolving bundle-specific intra-axonal T2 values within a voxel using diffusion-relaxation tract-based estimation, Neuroimage, 227, 117617, 10.1016/j.neuroimage.2020.117617 · DOI
- Bullmore, 2009, Complex brain networks: graph theoretical analysis of structural and functional systems, Nat. Rev. Neurosci., 10, 186, 10.1038/nrn2575 · DOI · Paper page
- Chandio, 2020, Bundle analytics, a computational framework for investigating the shapes and profiles of brain pathways across populations, Sci. Rep., 10, 1, 10.1038/s41598-020-74054-4 · DOI
- Colby, 2012, Along-tract statistics allow for enhanced tractography analysis, Neuroimage, 59, 3227, 10.1016/j.neuroimage.2011.11.004 · DOI
- Hagmann, 2008, Mapping the structural core of human cerebral cortex, PLoS Biol., 6, e159, 10.1371/journal.pbio.0060159 · DOI · Paper page
- Rheault, 2020, Common misconceptions, hidden biases and modern challenges of dMRI tractography, J. Neural Eng., 17, 011001, 10.1088/1741-2552/ab6aad · DOI
- Schilling, 2018, Confirmation of a gyral bias in diffusion MRI fiber tractography, Hum. Brain Mapp., 39, 1449, 10.1002/hbm.23936 · DOI
- Smith, 2020, Diffusion MRI fiber tractography, Vol. 1, 533
- Wu, 2020, Mitigating gyral bias in cortical tractography via asymmetric fiber orientation distributions, Med. Image Anal., 59, 101543, 10.1016/j.media.2019.101543 · DOI
- Zalesky, 2016, Connectome sensitivity or specificity: which is more important?, Neuroimage, 142, 407, 10.1016/j.neuroimage.2016.06.035 · DOI · Paper page
Cited by
Sorted by citations
Scale matters: The nested human connectome
Axer, M., & Amunts, K. (2022) · Science · doi:10.1126/science.abq2599 · Cited by 126
The subcortical and neurochemical organization of the ventral and dorsal attention networks
Alves, P. N., Forkel, S. J., Corbetta, M., & de Schotten, M. T. (2022) · Communications Biology · doi:10.1038/s42003-022-04281-0 · Cited by 89
Seguin, C., Jedynak, M., Olivier David, A., Sina Mansour, L., Sporns, O., & Zalesky, A. (2023) · Neuron · doi:10.1016/j.neuron.2023.01.027 · Cited by 90
Self-citationYang, J. Y.-M., Yeh, C.-H., Poupon, C., & Calamante, F. (2021) · Physics in Medicine & Biology · doi:10.1088/1361-6560/ac0d90 · Cited by 80
Self-citationSeguin, C., Sina Mansour, L., Sporns, O., Zalesky, A., & Calamante, F. (2022) · NeuroImage · doi:10.1016/j.neuroimage.2022.119323 · Cited by 67
Self-citation
Metadata
- Authors
- Zhang, F., Daducci, A., He, Y., Schiavi, S., Seguin, C., Smith, R. E., Yeh, C.-H., Zhao, T., & O’Donnell, L. J.
- Affiliations
- Brigham and Women's Hospital (US)
- University of Verona (IT)
- The University of Sydney (AU)
- The University of Melbourne (AU)
- Chang Gung University (TW)
- Beijing Normal University (CN)
- Corresponding author
- Zhang, Fan
- O’Donnell, Lauren J.
- Venue
- NeuroImage
- Publisher
- Elsevier BV
- Published
- 2022-04
- Volume
- 249
- Pages
- 118870
- ISSN
- 1053-8119 (ISSN-L)
- PMC
- PMC9257891
- OpenAlex
- W4205798776
- Semantic Scholar
- 76c276c32a8fd376256c5061e0b0d1f8cbbb44a0
- Cited by
- 302
- References
- 598
- Citations by year
- 2026: 57 · 2025: 88 · 2024: 71 · 2023: 58 · 2022: 24
- FWCI
- 31.00
- Type
- journal article
- Language
- en
- Open access
- gold
- doi.org
- Licence
- Locations
- NeuroImage (publishedVersion, cc-by-nc-nd)
- PubMed (publishedVersion)
- arXiv (Cornell University) (submittedVersion)
- PubMed Central (submittedVersion, cc-by-nc-nd)
- DOAJ (DOAJ: Directory of Open Access Journals) (submittedVersion, cc-by-sa)
- Minerva Access (University of Melbourne) (submittedVersion, cc-by-nc-nd)
- arXiv (Cornell University)
- Funders
- Ministry of Science and Technology, Taiwan (109-2222-E-182-001-MY3)
- National Natural Science Foundation of China (81620108016, 81801783)
- National Institutes of Health (P41EB015902, R01MH074794, R01MH119222, R01MH125860)
- National Imaging Facility
- Topics
- Health Sciences › Medicine › Radiology, Nuclear Medicine and Imaging › Advanced Neuroimaging Techniques and Applications
- Life Sciences › Neuroscience › Cognitive Neuroscience › Functional Brain Connectivity Studies
- Health Sciences › Medicine › Clinical Neurology › Cerebrovascular and genetic disorders
- Keywords
- diffusion MRI tractography, structural connectivity, white matter, connectome, white matter microstructure, brain development, brain aging, neurological disorders, mental illness, neurosurgery, method comparison
- MeSH terms
- Brain, Humans, Nerve Net, Diffusion Tensor Imaging
About these checks
Registry, retraction, Cites and statistics results are computed, not judged, with one exception: a printed reference that no index lists is read once by a model before it counts as a citation error. Claims are extracted by a model and kept only when their quote appears verbatim in the text; each cited source is then checked, with a model’s help, for whether it says what the claim relies on. Those verdicts can be wrong — read the claim’s quote and the cited source before relying on one.
A language model drew the claims from the paper on 2026-10-18, under version 3 of the claim definition (model deepseek-v4.1-flash, prompt extract-v3).
A second model labelled each claim on 2026-10-18 (model jev-1.13-20260917, definition revision gold-guideline-v0.2).
Cited sources are checked with a language model’s help (gpt-6-sol).
Statistics and arithmetic are recomputed, not judged.
Confidence bands are shown only for fields calibrated on our annotated test set. None is calibrated yet, so no band is shown.
What counts as a claim ›How we measure confidence ›How we check this ›
Are you an author, or do you see a problem with this page? Request a review
