

The DOI matches its Crossref record; 136 of the 136 references it cites were found in a registry or an index; 156 of the 241 sources its claims cite were checked for support.
Critical transitions in the Amazon forest system
Open accessAbstract
The possibility that the Amazon forest system could soon reach a tipping point, inducing large-scale collapse, has raised global concern 1–3 . For 65 million years, Amazonian forests remained relatively resilient to climatic variability. Now, the region is increasingly exposed to unprecedented stress from warming temperatures, extreme droughts, deforestation and fires, even in central and remote parts of the system 1 . Long existing feedbacks between the forest and environmental conditions are being replaced by novel feedbacks that modify ecosystem resilience, increasing the risk of critical transition. Here we analyse existing evidence for five major drivers of water stress on Amazonian forests, as well as potential critical thresholds of those drivers that, if crossed, could trigger local, regional or even biome-wide forest collapse. By combining spatial information on various disturbances, we estimate that by 2050, 10% to 47% of Amazonian forests will be exposed to compounding disturbances that may trigger unexpected ecosystem transitions and potentially exacerbate regional climate change. Using examples of disturbed forests across the Amazon, we identify the three most plausible ecosystem trajectories, involving different feedbacks and environmental conditions. We discuss how the inherent complexity of the Amazon adds uncertainty about future dynamics, but also reveals opportunities for action. Keeping the Amazon forest resilient in the Anthropocene will depend on a combination of local efforts to end deforestation and degradation and to expand restoration, with global efforts to stop greenhouse gas emissions.
Overview
AI snapshot
Written from the paper’s full text.
TL;DR
This synthesis assesses evidence that the Amazon forest system is approaching critical transitions under compounding water-stress drivers, estimating that by 2050 10–47% of Amazonian forests could be exposed to compounding disturbances. It identifies critical thresholds and safe boundaries for five drivers and three plausible post-disturbance ecosystem trajectories, concluding resilience depends on ending deforestation and degradation, expanding restoration, and stopping greenhouse gas emissions.
Key findings
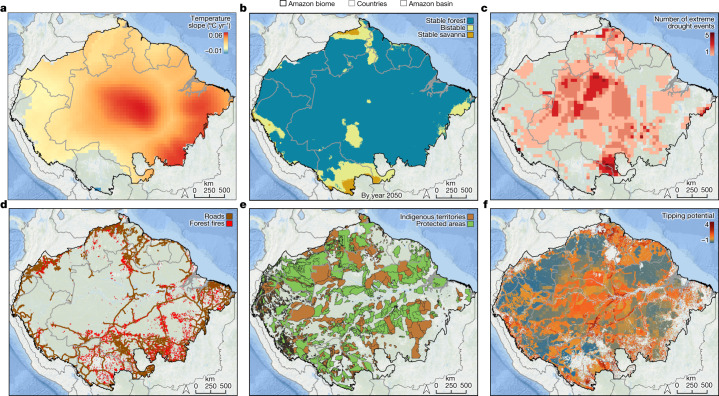
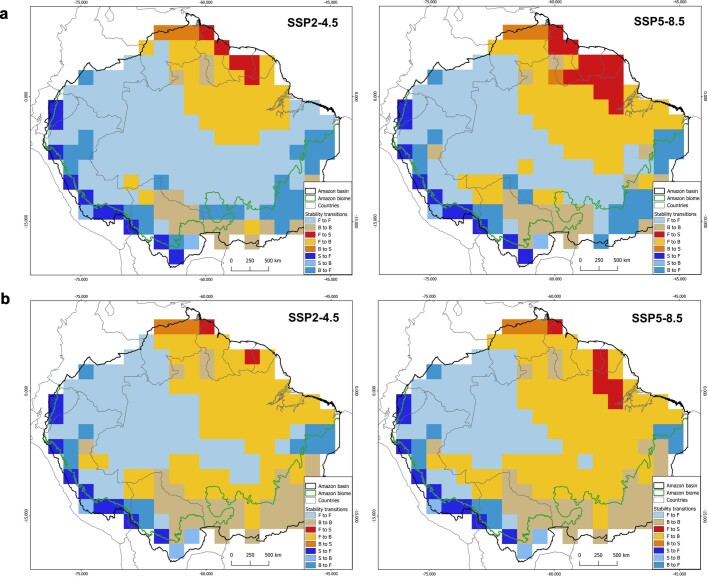
- By 2050, 10% of the Amazon forest biome has relatively high transition potential (more than 2 disturbance types), 47% has moderate transition potential (more than 1 disturbance type), and 53% has low transition potential; if broader CMIP6 bistability projections are considered, the proportion that could transition into low tree cover would be much larger.
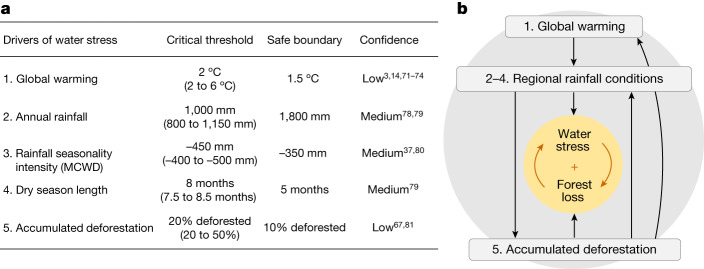
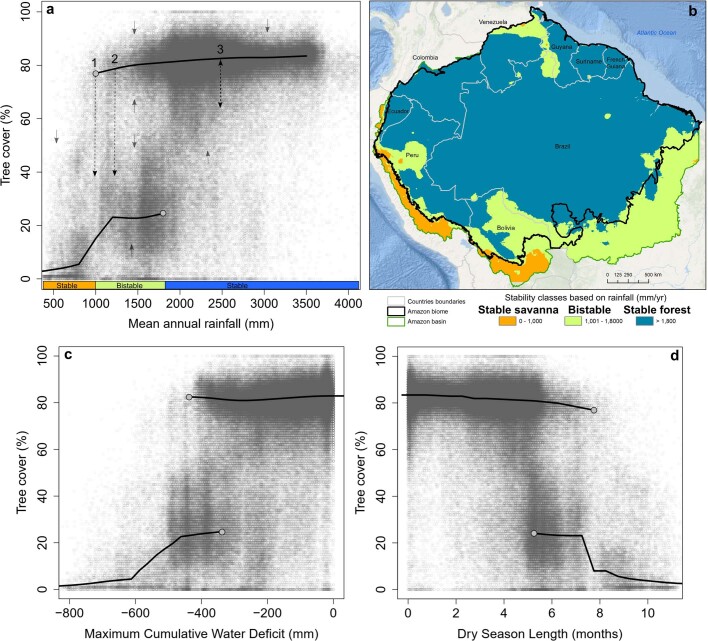
- Critical thresholds and safe boundaries include: annual rainfall threshold at 1,000 mm (bistability 1,000–1,800 mm; safe boundary 1,800 mm); maximum cumulative water deficit threshold at approximately −450 mm (bistability −350 to −450 mm; safe boundary −350 mm); dry season length threshold at 8 months (bistability 5–8 months; safe boundary 5 months); accumulated deforestation threshold at 20% (safe boundary 10%); and global warming threshold range of 2–6 °C (suggested safe boundary 1.5 °C).
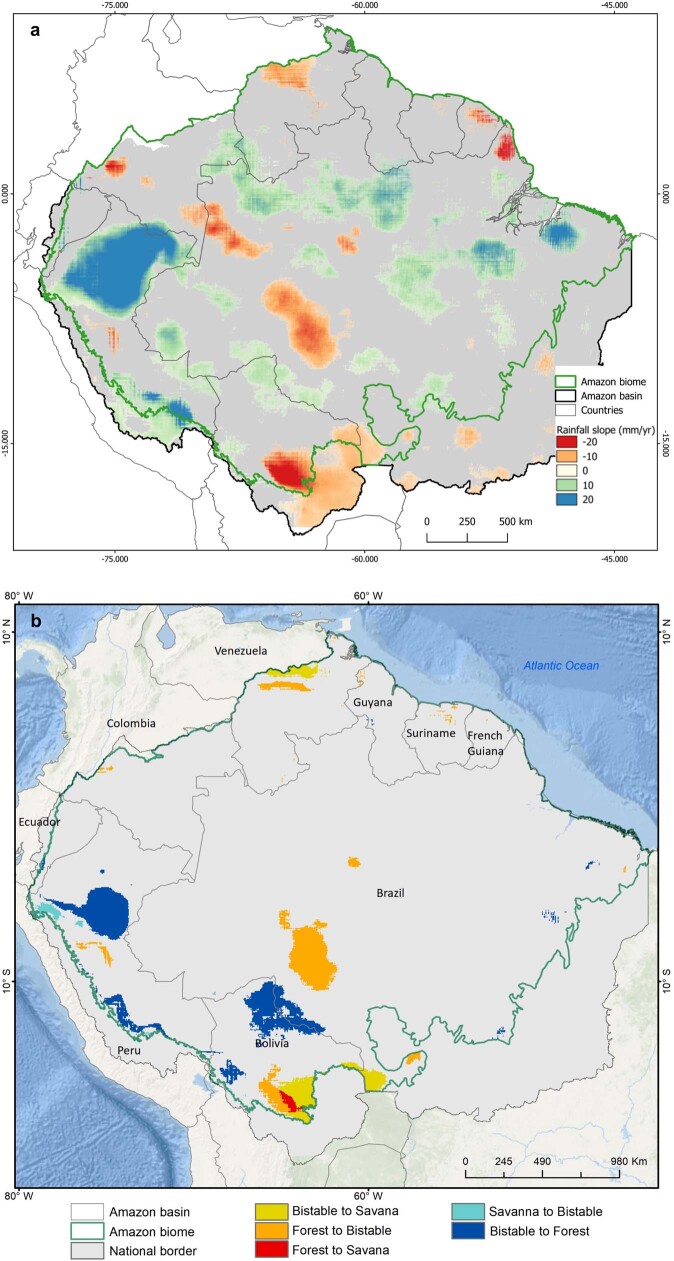
- Currently, 86% of the Amazon biome may be in a stable forest state, but 17% of remaining Amazon forest has been degraded by human disturbances, rising to 38% when repeated extreme droughts are included. Under rainfall trends, 6% of the biome may change from stable forest to bistable, 3% may pass into stable savanna, and 8% of bistable areas may turn into stable forest by 2050.
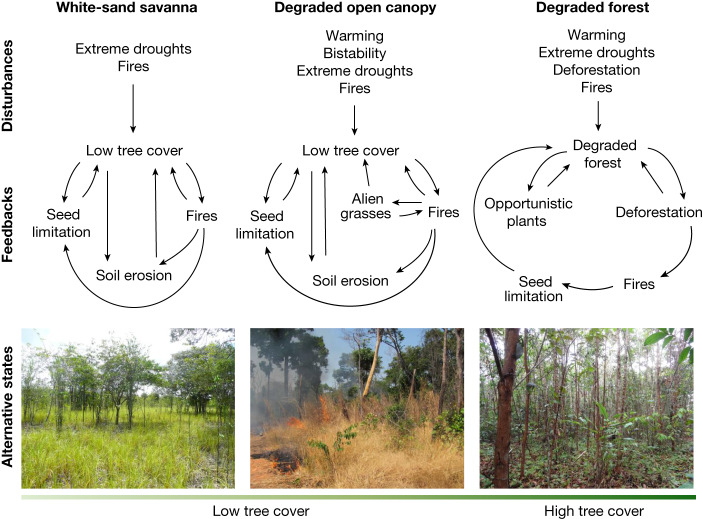
- Three plausible ecosystem trajectories are identified: degraded forest (for example, Vismia, liana, and Guadua bamboo forests), white-sand savanna (confirmed in the Negro river basin after repeated fires), and degraded open-canopy ecosystem (with 5–6% of the southern Amazon landscape already shifted due to deforestation and fires).
Methods
- The paper synthesizes paleorecords, observational data, and modelling studies, using spatial datasets including MODIS Vegetation Continuous Fields for 2001 at 250-m resolution, CHIRPS rainfall 1981–2020, CRU temperature, MapBiomas land cover, MODIS fire data, and RAISG road and protected-area layers.
- Potential analysis was used to construct empirical stability landscapes of tree cover against mean annual precipitation, maximum cumulative water deficit, and dry season length, with sensitivity tests of kernel smoothing and thresholds.
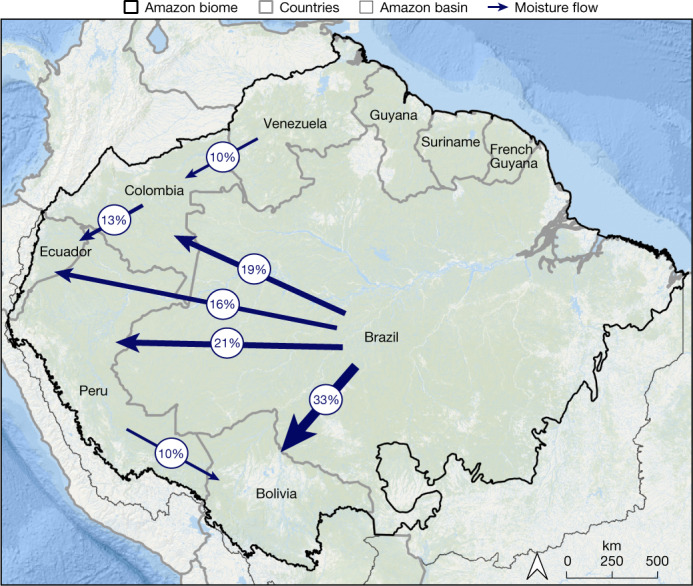
- A relative transition-potential index was calculated at 5-km resolution by additively combining dry-season temperature slopes, 2050 ecosystem stability classes, repeated extreme drought events, road proximity, and protected areas/Indigenous territories; atmospheric moisture flows between Amazonian countries were tracked with the UTrack Lagrangian model using ERA5 data for 2008–2017.
Limitations
- The paper states that the simple additive transition-potential approach does not consider synergies between compounding disturbances that could trigger unexpected ecosystem transitions, and that the inherent complexity of the Amazon adds uncertainty about future dynamics.
- The paper states that many questions remain about environmental heterogeneity and whether it can mitigate a systemic transition, that CO2 fertilization responses are still poorly understood, and that most Earth system models do not simulate dynamic vegetation cover or key disturbances.
- Evident from the text: the transition-potential map is a relative spatial measure for governance, not a predictive model; it excludes accumulated deforestation and savannas, uses road proximity as a proxy for degrading activities, and relies on MODIS VCF data that can contain errors at lower tree cover ranges.
Model-written summary. Check it against the paper before relying on it.
Integrity signals
Registry
Cites
Statistics
Figures
Verification
Claims the paper makes
69 Partly supported · 23 Own interpretation · 20 No full text of the sources · 19 Supported · 15 Own result · 12 Not checked yet · 8 No basis given · 6 Supported so far · 4 Not supported · 3 Couldn’t confirm · 3 Sources not found · 3 Own method · 1 Mixed support · accuracy not yet measured
At least one cited source doesn’t support this claim or points to a different paper, and none confirmed it — see the verdicts below.
In the paper
“Patches of white-sand savanna also expanded within the Amazon forest owing to geomorphological dynamics and fires26,27.”
§ Critical transitions in the Amazon forest system > Past dynamics
What the sources say
- Disputedcites [26] Rossetti, D. F. et al. Unfolding long-term Late Pleistocene-Holocene disturbances of forest communities in the southwestern Amazonian lowlands. Ecosphere 9, e02457 (2018). sourceExperimental — accuracy not yet measured
The Conclusions and Ways Forward section links savannas within the rainforest matrix to evolving fluvial terraces, but says they decreased in size over time as forests replaced them—not that they expanded. The Linkage to past climate section mentions fire-driven expansion only for the Gran Sabana in northern Amazonia, not for the study area's savannas. Page numbers are unavailable in our copy. (LLM, conf=0.86)
Checked by a reasoning model — may be wrong.
- Not checked — no full text of the sourcecites [27] Prance, G. T. & Schubart, H. O. R. Notes on the vegetation of Amazonia I. A preliminary note on the origin of the open white sand campinas of the lower Rio Negro. Brittonia 30, 60 (1978). source
plaindirect- Asserted: passes — The authors put it forward as true.
- Checkable: passes — It can be checked against evidence.
- Load-bearing: unclear — It is unclear whether the paper’s conclusions depend on it.
- Based: passes — The paper gives a reason why it holds.
- Disputed
At least one cited source doesn’t support this claim or points to a different paper, and none confirmed it — see the verdicts below.
In the paper
“By contrast, parts of the western and eastern Amazon forest are becoming wetter, with annual rainfall increasing by up to 20 mm yr−1.”
§ Critical transitions in the Amazon forest system > Global change impacts on forest resilience > Regional climatic conditions
What the sources say
- Disputedcites [31] Marengo, J. A., Jimenez, J. C., Espinoza, J.-C., Cunha, A. P. & Aragão, L. E. O. Increased climate pressure on the agricultural frontier in the Eastern Amazonia–Cerrado transition zone. Sci. Rep. 12, 457 (2022). sourceExperimental — accuracy not yet measured
The Results sections “Regional scale trends over the MATOPIBA” and “Drought and land cover changes” report declining rainfall in the eastern Amazonia–Cerrado transition region and describe eastern Amazonia’s dry and dry-to-wet seasons as becoming drier. The paper does not report the claimed increase of up to 20 mm yr−1 in annual rainfall in parts of the western and eastern Amazon forest. Page numbers were not available in our copy. (LLM, conf=0.82)
Checked by a reasoning model — may be wrong.
plaindirect- Asserted: passes — The authors put it forward as true.
- Checkable: passes — It can be checked against evidence.
- Load-bearing: passes — The paper’s conclusions depend on it.
- Based: passes — The paper gives a reason why it holds.
- Disputed
At least one cited source doesn’t support this claim or points to a different paper, and none confirmed it — see the verdicts below.
In the paper
“A potential vegetation model81 found a critical threshold at 20% of accumulated deforestation (Fig. 3a) by simulating Amazon forest responses to different scenarios of accumulated deforestation (with associated fire events) and of greenhouse gas emissions, and by considering a CO2 fertilization effect of 25% of the maximum photosynthetic assimilation rate.”
§ Critical transitions in the Amazon forest system > Five critical drivers of water stress > Accumulated deforestation
What the sources say
- Disputedcites [81] Nobre, C. A. et al. Land-use and climate change risks in the Amazon and the need of a novel sustainable development paradigm. Proc. Natl Acad. Sci. USA 113, 10759–10768 (2016). sourceExperimental — accuracy not yet measured
The Significance section and ‘Climate Change: Global and Regional Perspectives’ (pages unavailable) identify 40% deforestation—not 20%—as a suggested tipping point for Amazon forests. The paper’s mention of around 20% concerns a modeled increase in local precipitation at low levels of deforestation, not a critical vegetation threshold; the cited 25% CO2-fertilization assumption is also not stated in the passages found. (LLM, conf=0.88)
Checked by a reasoning model — may be wrong.
plaindirect- Asserted: passes — The authors put it forward as true.
- Checkable: passes — It can be checked against evidence.
- Load-bearing: passes — The paper’s conclusions depend on it.
- Based: passes — The paper gives a reason why it holds.
- Disputed
The cited sources support only part of this claim — read each source’s verdict below.
In the paper
“For 65 million years, Amazonian forests remained relatively resilient to climatic variability.”
§ Critical transitions in the Amazon forest system > Abstract
What the sources say
- Partly supportedcites [19] Hoorn, C. et al. Amazonia through time: Andean uplift, climate change, landscape evolution, and biodiversity. Science 330, 927–931 (2010). sourceExperimental — accuracy not yet measured
The Fig. 2 caption (p. 3) says floral diversity remained relatively high under cooler Neogene conditions, supporting a limited claim of resilience to climate change. But the paper does not establish that Amazonian forests remained resilient throughout 65 million years; the Andean Uplift section (p. 3) also describes preexisting rainforests being fragmented by wetlands. (LLM, conf=0.85)
plain- Asserted: passes — The authors put it forward as true.
- Checkable: passes — It can be checked against evidence.
- Load-bearing: unclear — It is unclear whether the paper’s conclusions depend on it.
- Based: passes — The paper gives a reason why it holds.
- Partly supported
The cited sources support only part of this claim — read each source’s verdict below.
In the paper
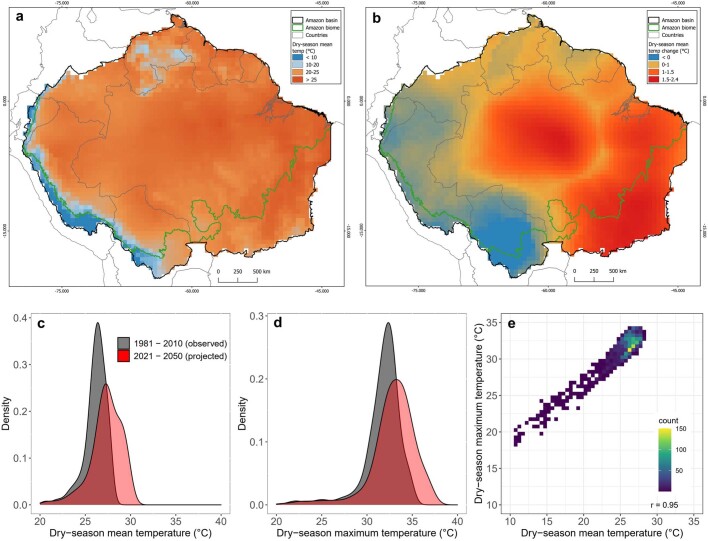
“Dry season mean temperature is now more than 2 °C higher than it was 40 years ago in large parts of the central and southeastern Amazon.”
§ Critical transitions in the Amazon forest system > Global change impacts on forest resilience > Regional climatic conditions
What the sources say
- Partly supportedcites [31] Marengo, J. A., Jimenez, J. C., Espinoza, J.-C., Cunha, A. P. & Aragão, L. E. O. Increased climate pressure on the agricultural frontier in the Eastern Amazonia–Cerrado transition zone. Sci. Rep. 12, 457 (2022). sourceExperimental — accuracy not yet measured
The Results section, “Compound changes in hydrological and climate variables” (page unavailable), reports warming over four decades in the Eastern Amazonia–Cerrado transition zone, but its July–October trend of 0.38 °C per decade amounts to about 1.5 °C, not more than 2 °C. “Regional scale trends over the MATOPIBA” reports a 1.2 °C change from 1981 to 2020. The copy does not establish the claimed magnitude across large parts of the central and southeastern Amazon. (LLM, conf=0.88)
plain- Asserted: passes — The authors put it forward as true.
- Checkable: passes — It can be checked against evidence.
- Load-bearing: passes — The paper’s conclusions depend on it.
- Based: passes — The paper gives a reason why it holds.
- Partly supported
Every source the paper cites for this claim was checked and supports it.
In the paper
“Within the remaining Amazon forest area, 17% has been degraded by human disturbances38, such as logging, edge effects and understory fires, but if we consider also the impacts from repeated extreme drought events in the past decades, 38% of the Amazon could be degraded39.”
§ Critical transitions in the Amazon forest system > Global change impacts on forest resilience > Disturbance regimes
What the sources say
- Supportedcites [39] Lapola, D. M. et al. The drivers and impacts of Amazon forest degradation. Science 379, eabp8622 (2023). source
The Extended summary states that adding extreme-drought data to fire, edge effects and timber extraction raises the estimated degraded area to 38% of remaining Amazonian forests. The Spatial extent and severity section specifies that the estimate covers 2001–2018 and accounts for overlaps among the four disturbances. (LLM, conf=0.95)
hedgedconditional- Asserted: passes — The authors put it forward as true.
- Checkable: passes — It can be checked against evidence.
- Load-bearing: unclear — It is unclear whether the paper’s conclusions depend on it.
- Based: passes — The paper gives a reason why it holds.
- Supported
The cited sources that could be checked couldn’t confirm or dispute this claim.
In the paper
“Only a few small areas in the west of the biome are significantly cooling by around 0.1 °C per decade (Fig. 1a).”
§ Critical transitions in the Amazon forest system > Global change impacts on forest resilience > Regional climatic conditions
What the sources say
- Could not verifycites [31] Marengo, J. A., Jimenez, J. C., Espinoza, J.-C., Cunha, A. P. & Aragão, L. E. O. Increased climate pressure on the agricultural frontier in the Eastern Amazonia–Cerrado transition zone. Sci. Rep. 12, 457 (2022). sourceExperimental — accuracy not yet measured
The Results section on compound changes reports widespread significant warming in the EAC, and the Figure 1 caption says only statistically significant pixels are displayed. Neither passage identifies small cooling areas in the west of the biome or a cooling rate of about 0.1 °C per decade. Searches for western cooling and that rate found no supporting passage in our copy; widespread warming does not rule out local exceptions. (LLM, conf=0.76)
plain- Asserted: passes — The authors put it forward as true.
- Checkable: passes — It can be checked against evidence.
- Load-bearing: unclear — It is unclear whether the paper’s conclusions depend on it.
- Based: passes — The paper gives a reason why it holds.
- Could not verify
The cited sources support only part of this claim — read each source’s verdict below.
In the paper
“However, during the past 3,000 years, forests have been mostly expanding over savanna in the southern Amazon driven by increasingly wet conditions28.”
§ Critical transitions in the Amazon forest system > Past dynamics
What the sources say
- Partly supportedcites [28] Wright, J. L. et al. Sixteen hundred years of increasing tree cover prior to modern deforestation in Southern Amazon and central Brazilian savannas. Glob. Change Biol. 27, 136–150 (2021). sourceExperimental — accuracy not yet measured
The Results (section 3.2) and Conclusion report that tree cover expanded across much of the Amazon–Cerrado region, including savannas. The paper links that trend to increasing moisture, but treats precipitation as one possible contributor alongside changes in fire disturbance and other factors. Its measured reference age is about 1,600 years, not 3,000 years, so the stated duration and definitive causal attribution are not fully supported. (LLM, conf=0.88)
plaindirect- Asserted: passes — The authors put it forward as true.
- Checkable: passes — It can be checked against evidence.
- Load-bearing: unclear — It is unclear whether the paper’s conclusions depend on it.
- Based: passes — The paper gives a reason why it holds.
- Partly supported
The cited sources support only part of this claim — read each source’s verdict below.
In the paper
“These climatic conditions could expose the forest to unprecedented levels of vapour pressure deficit31 and consequently water stress30.”
§ Critical transitions in the Amazon forest system > Global change impacts on forest resilience > Regional climatic conditions
What the sources say
- Supportedcites [31] Marengo, J. A., Jimenez, J. C., Espinoza, J.-C., Cunha, A. P. & Aragão, L. E. O. Increased climate pressure on the agricultural frontier in the Eastern Amazonia–Cerrado transition zone. Sci. Rep. 12, 457 (2022). source
Citation 30 is attached to the water-stress portion of the sentence. The Discussion says that longer, warmer, drier seasons in eastern Amazonia favor a higher risk of water stress; the Results section on drought and land-cover changes likewise suggests increasing water stress on vegetation. The claim about unprecedented vapour pressure deficit is attached to citation 31, not this source. (LLM, conf=0.92)
- Could not verifycites [30] Smith, M. N. et al. Empirical evidence for resilience of tropical forest photosynthesis in a warmer world. Nat. Plants 6, 1225–1230 (2020). sourceExperimental — accuracy not yet measured
No passage from our copy addresses unprecedented vapour pressure deficit or consequent water stress. Searches for those terms and related phrasing returned no relevant passage; the only returned text was project and citation metadata, not a finding from the paper. (LLM, conf=0.68)
hedgedconditional- Asserted: passes — The authors put it forward as true.
- Checkable: passes — It can be checked against evidence.
- Load-bearing: passes — The paper’s conclusions depend on it.
- Based: passes — The paper gives a reason why it holds.
- Supported
The cited sources support only part of this claim — read each source’s verdict below.
In the paper
“More recently, during the drier and cooler conditions of the Last Glacial Maximum20 (LGM) (around 21,000 years ago) and of the mid-Holocene epoch21 (around 6,000 years ago), forests persisted even when humans were already present in the landscape22.”
§ Critical transitions in the Amazon forest system > Past dynamics
What the sources say
- Not checked — no full text of the sourcecites [20] Wang, X. et al. Hydroclimate changes across the Amazon lowlands over the past 45,000 years. Nature 541, 204–207 (2017). source
- Could not verifycites [21] Kukla, T. et al. The resilience of Amazon tree cover to past and present drying. Global Planet. Change 202, 103520 (2021). sourceExperimental — accuracy not yet measured
The Introduction (p. 2) says the paper examines central and western Amazon tree cover under drier mid-Holocene conditions, but the passages available do not establish that forests persisted while humans were present. Searches for human presence, anthropogenic activity, forest persistence, and the Last Glacial Maximum found no passage addressing that conjunction. (LLM, conf=0.70)
- Partly supportedcites [22] Clement, C. R. et al. Disentangling domestication from food production systems in the neotropics. Quaternary 4, 4 (2021). sourceExperimental — accuracy not yet measured
Section 3, “Early Human Entanglements in the Neotropics” (page unavailable), reports human occupation in a Brazilian dry-forest region around 22,000 years BP and plant remains from an Atlantic-forest coastal site around 6,000 years BP. These examples support human presence in forested landscapes, but the paper does not establish that forests persisted through both the Last Glacial Maximum and the mid-Holocene under the conditions described. (LLM, conf=0.78)
plain- Asserted: passes — The authors put it forward as true.
- Checkable: passes — It can be checked against evidence.
- Load-bearing: unclear — It is unclear whether the paper’s conclusions depend on it.
- Based: passes — The paper gives a reason why it holds.
The cited sources support only part of this claim — read each source’s verdict below.
In the paper
“The Amazon system has been mostly covered by forest throughout the Cenozoic era19 (for 65 million years).”
§ Critical transitions in the Amazon forest system > Past dynamics
What the sources say
- Partly supportedcites [19] Hoorn, C. et al. Amazonia through time: Andean uplift, climate change, landscape evolution, and biodiversity. Science 330, 927–931 (2010). sourceExperimental — accuracy not yet measured
The Andean Uplift section (p. 3) describes preexisting rainforests that were fragmented by Miocene wetlands, and p. 4 says forested habitats later replaced those wetlands. This supports a long history of Amazonian forest, but the paper does not establish that most of the Amazon system was forest-covered throughout the Cenozoic or for the full 65 million years. (LLM, conf=0.83)
plain- Asserted: passes — The authors put it forward as true.
- Checkable: passes — It can be checked against evidence.
- Load-bearing: unclear — It is unclear whether the paper’s conclusions depend on it.
- Based: passes — The paper gives a reason why it holds.
- Partly supported
The cited sources support only part of this claim — read each source’s verdict below.
In the paper
“Indigenous peoples and local communities (IPLCs) would be harmed by forest loss in terms of their livelihoods, lifeways and knowledge systems that inspire societies globally1,7,9.”
§ Critical transitions in the Amazon forest system > Main
What the sources say
- Not checked yetcites [1] Science Panel for the Amazon. Amazon Assessment Report 2021 (2021); www.theamazonwewant.org/amazon-assessment-report-2021/.
- Could not verifycites [7] Bromham, L. et al. Global predictors of language endangerment and the future of linguistic diversity. Nat. Ecol. Evol. 6, 163–173 (2022). sourceExperimental — accuracy not yet measured
The Results and discussion sections address Indigenous language endangerment, including associations with roads and some forms of land use. They do not say that forest loss harms Indigenous peoples’ and local communities’ livelihoods, lifeways, or knowledge systems (searched for forest loss, deforestation, livelihoods, and knowledge). (LLM, conf=0.77)
- Partly supportedcites [9] Cámara-Leret, R., Fortuna, M. A. & Bascompte, J. Indigenous knowledge networks in the face of global change. Proc. Natl Acad. Sci. USA 116, 9913–9918 (2019). sourceExperimental — accuracy not yet measured
The Abstract says loss of plant species and cultural heritage can erode indigenous knowledge, threaten human well-being, and jeopardize livelihoods; Fig. 1 also shows how plants figure in daily life. But the study concerns 57 Neotropical indigenous communities and models plant-species loss, not forest loss and its effects on Indigenous peoples and local communities generally. (LLM, conf=0.83)
hedgeddirect- Asserted: passes — The authors put it forward as true.
- Checkable: passes — It can be checked against evidence.
- Load-bearing: unclear — It is unclear whether the paper’s conclusions depend on it.
- Based: passes — The paper gives a reason why it holds.
The cited sources support only part of this claim — read each source’s verdict below.
In the paper
“Diversity of other organisms, such as frugivores and pollinators, also increases forest resilience by stabilizing ecological networks15,112.”
§ Critical transitions in the Amazon forest system > Global change impacts on forest resilience > Disturbance regimes
What the sources say
- Partly supportedcites [15] Flores, B. M. & Staal, A. Feedback in tropical forests of the Anthropocene. Global Change Biol. 28, 5041–5061 (2022). sourceExperimental — accuracy not yet measured
The ‘Interactions with fauna’ section says frugivores aid recovery through seed dispersal and pollinators support tree reproduction; ‘A network of interactions’ describes a feedback linking both groups to forest cover. The paper does not establish that greater diversity of these organisms increases resilience by stabilizing ecological networks. Page numbers were not available in our copy. (LLM, conf=0.86)
- Not checked — no full text of the sourcecites [112] Estes, J. A. et al. Trophic downgrading of planet Earth. Science 333, 301–306 (2011). source
plaindirect- Asserted: passes — The authors put it forward as true.
- Checkable: passes — It can be checked against evidence.
- Load-bearing: unclear — It is unclear whether the paper’s conclusions depend on it.
- Based: passes — The paper gives a reason why it holds.
- Partly supported
Every source the paper cites for this claim was checked and supports it.
In the paper
“Diverse forests are also more likely to resist severe disturbances owing to ‘response diversity’110—that is, some species may die, while others persist.”
§ Critical transitions in the Amazon forest system > Global change impacts on forest resilience > Disturbance regimes
What the sources say
- Supportedcites [110] Elmqvist, T. et al. Response diversity, ecosystem change, and resilience. Front. Ecol. Environ. 1, 488–494 (2003). source
The ‘Seed dispersers in tropical forest systems’ section describes cyclones after which some frugivore species declined drastically while others survived and maintained seed dispersal. The paper identifies those differing responses as response diversity and says their absence could have redirected forest development. Its ‘In a nutshell’ section cautions that species richness alone does not guarantee resilience; the claim’s explanation rests on response diversity rather than richness alone. (LLM, conf=0.86)
hedgedconditional- Asserted: passes — The authors put it forward as true.
- Checkable: passes — It can be checked against evidence.
- Load-bearing: unclear — It is unclear whether the paper’s conclusions depend on it.
- Based: passes — The paper gives a reason why it holds.
- Supported
The cited sources support only part of this claim — read each source’s verdict below.
In the paper
“In the Amazon, an important source of connectivity enhancing forest resilience is atmospheric moisture flow westward (Fig. 2), partly maintained by forest evapotranspiration4,37,67.”
§ Critical transitions in the Amazon forest system > Local versus systemic transition > Sources of connectivity
What the sources say
- Could not verifycites [4] Staal, A. et al. Forest-rainfall cascades buffer against drought across the Amazon. Nat. Clim. Change 8, 539–543 (2018). sourceExperimental — accuracy not yet measured
The available passages contain the paper’s title and bibliographic metadata, but no substantive text establishing westward moisture flow, its contribution to forest resilience, or its maintenance by evapotranspiration. Searches for those terms and for moisture recycling returned only metadata, so this claim cannot be assessed from the available copy. (LLM, conf=0.70)
- Partly supportedcites [37] Zemp, D. C. et al. Self-amplified Amazon forest loss due to vegetation-atmosphere feedbacks. Nat. Commun. 8, 14681 (2017). sourceExperimental — accuracy not yet measured
The Methods (‘Moisture recycling networks’; page not provided) describe links through which evapotranspiration in one Amazon grid cell contributes rainfall to another. The Results (‘Forest shifts’; page not provided) link rainfall to forest resilience. These passages support moisture-mediated connectivity and its relationship to resilience, but they do not establish the claim’s specific westward direction of flow. (LLM, conf=0.83)
- Supportedcites [67] Boers, N., Marwan, N., Barbosa, H. M. J. & Kurths, J. A deforestation-induced tipping point for the South American monsoon system. Sci. Rep. 7, 41489 (2017). source
The paper’s Abstract describes a westward cascade of precipitation and evapotranspiration across the Amazon. It explains that forest evapotranspiration replenishes moisture in the westward flow, supporting rainfall farther downstream, and that disruption of this coupling can reduce rainfall in undeforested forest. This supports the claim’s description of moisture-flow connectivity and its contribution to forest resilience. (LLM, conf=0.88)
plaindirect- Asserted: passes — The authors put it forward as true.
- Checkable: passes — It can be checked against evidence.
- Load-bearing: unclear — It is unclear whether the paper’s conclusions depend on it.
- Based: passes — The paper gives a reason why it holds.
- Could not verify
The cited sources support only part of this claim — read each source’s verdict below.
In the paper
“Nonetheless, a few global climate models3,14,71–74 indicate a broad range for a potential critical threshold in global warming between 2 and 6 °C (Fig. 3a).”
§ Critical transitions in the Amazon forest system > Five critical drivers of water stress > Global warming
What the sources say
- Not checked — no full text of the sourcecites [3] Armstrong McKay, D. et al. Exceeding 1.5 °C global warming could trigger multiple climate tipping points. Science 377, abn7950 (2022). source
- Partly supportedcites [14] Lenton, T. M. et al. Tipping elements in the Earth’s climate system. Proc. Natl Acad. Sci. USA 105, 1786–1793 (2008). sourceExperimental — accuracy not yet measured
Table 1 (page unavailable in our copy) lists potential tipping elements with estimated global-warming thresholds spanning roughly 2–6 °C, so the broad range is consistent with the paper. Its table notes say the preliminary numbers come from expert assessments and a literature review, not specifically from a few global climate models, and the thresholds apply to different elements rather than one common threshold. (LLM, conf=0.84)
- Partly supportedcites [71] Drijfhout, S. et al. Catalogue of abrupt shifts in Intergovernmental Panel on Climate Change climate models. Proc. Natl Acad. Sci. USA 112, E5777–E5786 (2015). sourceExperimental — accuracy not yet measured
The Discussion reports modelled abrupt regional shifts after temperature thresholds, so the paper supports the general idea that climate models indicate potential thresholds. It does not identify a critical global-warming threshold between 2 and 6 °C: 18 of 37 forced shifts occur below 2 °C, and the paper finds no compelling general relationship between the number of shifts and warming level. Page numbers are unavailable in our copy. (LLM, conf=0.86)
- Not checked — no full text of the sourcecites [72] Salazar, L. F. & Nobre, C. A. Climate change and thresholds of biome shifts in Amazonia: climate change and Amazon biome shift. Geophys. Res. Lett. 37, https://doi.org/10.1029/2010GL043538 (2010). source
- Partly supportedcites [73] Jones, C., Lowe, J., Liddicoat, S. & Betts, R. Committed terrestrial ecosystem changes due to climate change. Nat. Geosci. 2, 484–487 (2009). sourceExperimental — accuracy not yet measured
The ‘Response of Amazon forest’ passage (p. 6) says that continued dieback after emissions cuts implies a climate threshold beyond which dieback is committed. The copy does not give a 2–6 °C threshold range, and its discussion of multiple vegetation models does not establish that a few global climate models produced that range. (LLM, conf=0.84)
- Not checked — no full text of the sourcecites [74] Schellnhuber, H. J., Rahmstorf, S. & Winkelmann, R. Why the right climate target was agreed in Paris. Nat. Clim. Change 6, 649–653 (2016). source
hedgedconditional- Asserted: passes — The authors put it forward as true.
- Checkable: passes — It can be checked against evidence.
- Load-bearing: unclear — It is unclear whether the paper’s conclusions depend on it.
- Based: passes — The paper gives a reason why it holds.
The cited sources support only part of this claim — read each source’s verdict below.
In the paper
“By contrast, most seasonal forest trees have various strategies to cope with water deficit owing to evolutionary and adaptive responses to historical drought events32,63.”
§ Critical transitions in the Amazon forest system > Local versus systemic transition > Environmental heterogeneity
What the sources say
- Partly supportedcites [32] Tavares, J. V. et al. Basin-wide variation in tree hydraulic safety margins predicts the carbon balance of Amazon forests. Nature 617, 111–117 (2023). sourceExperimental — accuracy not yet measured
The Hydraulic traits distribution section reports differences in drought-related hydraulic traits among Amazonian forests. The Implications and conclusions section suggests that drought-resistant xylem may be an evolutionary adaptation and that periodic El Niño events may have selected for drought-adapted taxa in central eastern forests. It does not establish that most seasonal forest trees have multiple coping strategies because of historical droughts. (LLM, conf=0.86)
- Partly supportedcites [63] Staver, A. C. et al. Thinner bark increases sensitivity of wetter Amazonian tropical forests to fire. Ecol. Lett. 23, 99–106 (2020). sourceExperimental — accuracy not yet measured
The Discussion (p. 11) suggests that vulnerable hydraulic architecture is common in trees without a history of drought or fire, which is consistent with a possible response to past drought. But it does not establish that most seasonal-forest trees have various water-deficit strategies or that those strategies evolved in response to historical drought; its discussion of bark as a drought-tolerance trait is explicitly cautious (p. 10). (LLM, conf=0.72)
plaindirect- Asserted: passes — The authors put it forward as true.
- Checkable: passes — It can be checked against evidence.
- Load-bearing: passes — The paper’s conclusions depend on it.
- Based: passes — The paper gives a reason why it holds.
- Partly supported
The cited sources support only part of this claim — read each source’s verdict below.
In the paper
“As result, a ‘CO2 fertilization effect’ could increase forest resilience to climatic variability53,54.”
§ Critical transitions in the Amazon forest system > Global change impacts on forest resilience > CO2 fertilization
What the sources say
- Partly supportedcites [53] Kooperman, G. J. et al. Forest response to rising CO2 drives zonally asymmetric rainfall change over tropical land. Nat. Clim. Change 8, 434–440 (2018). sourceExperimental — accuracy not yet measured
The Discussion (page unavailable) says tropical forests outside the Amazon are more likely to experience decreasing moisture stress as CO2 rises, which is consistent with a possible increase in resilience. But it does not establish greater resilience to climatic variability generally; it finds the opposite regional response in the Amazon. (LLM, conf=0.82)
- Not checked — no full text of the sourcecites [54] Lapola, D. M., Oyama, M. D. & Nobre, C. A. Exploring the range of climate biome projections for tropical South America: the role of CO2 fertilization and seasonality: future biome distribution in South America. Global Biogeochem. Cycles 23, https://doi.org/10.1029/2008GB003357 (2009). source
hedgedconditional- Asserted: passes — The authors put it forward as true.
- Checkable: passes — It can be checked against evidence.
- Load-bearing: unclear — It is unclear whether the paper’s conclusions depend on it.
- Based: passes — The paper gives a reason why it holds.
- Partly supported
The cited sources support only part of this claim — read each source’s verdict below.
In the paper
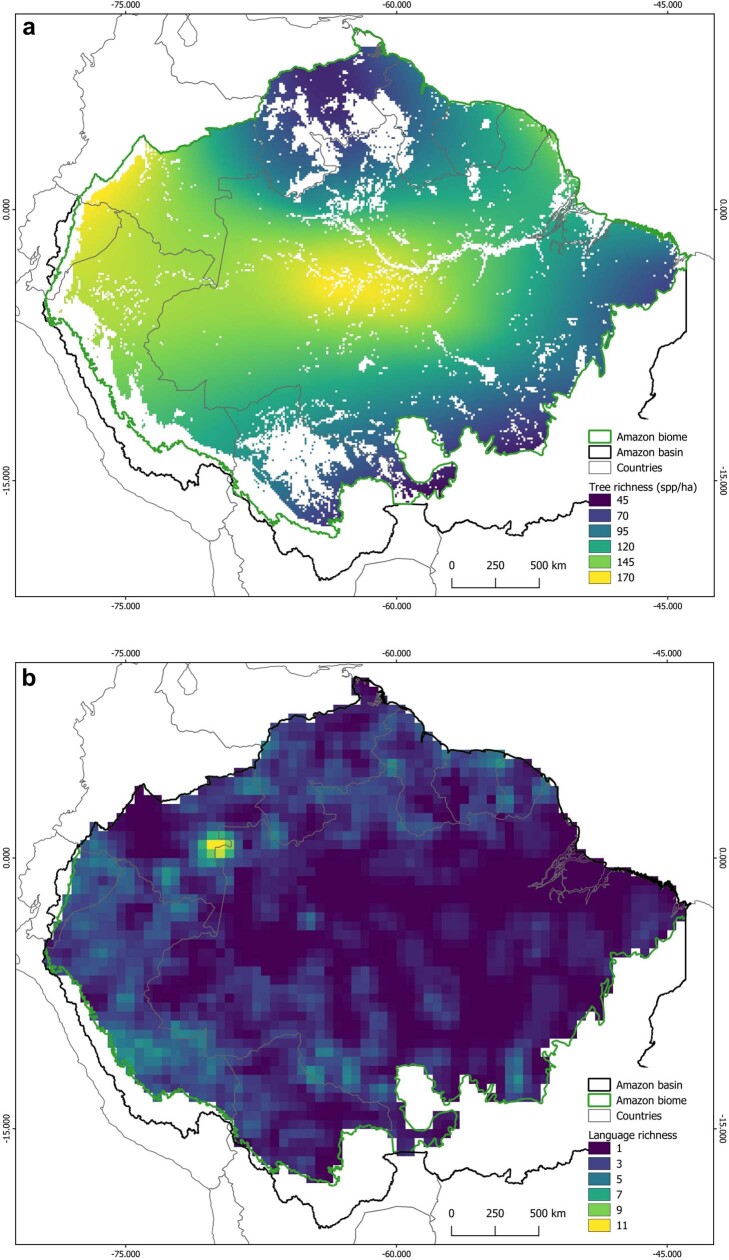
“Amazonian regions with the highest linguistic diversity (a proxy for ecological knowledge diversity123) are found in peripheral parts of the system, particularly in the north-west (Extended Data Fig. 7b).”
§ Critical transitions in the Amazon forest system > Global change impacts on forest resilience > Disturbance regimes
What the sources say
- Partly supportedcites [123] Cámara-Leret, R. & Bascompte, J. Language extinction triggers the loss of unique medicinal knowledge. Proc. Natl Acad. Sci. USA 118, e2103683118 (2021). sourceExperimental — accuracy not yet measured
The citation is attached to the parenthetical claim that linguistic diversity is a proxy for ecological knowledge diversity, not to the geographic pattern attributed to Extended Data Fig. 7b. The paper’s Abstract reports that medicinal-plant knowledge is often unique to a single language, supporting the proxy for that kind of knowledge, but it does not establish the relationship for ecological knowledge more broadly. (LLM, conf=0.84)
plaincorrelational- Asserted: passes — The authors put it forward as true.
- Checkable: passes — It can be checked against evidence.
- Load-bearing: unclear — It is unclear whether the paper’s conclusions depend on it.
- Based: passes — The paper gives a reason why it holds.
- Partly supported
Every source the paper cites for this claim was checked and supports it.
In the paper
“Experimental evidence suggests that CO2 fertilization also depends on soil nutrient availability, particularly nitrogen and phosphorus57,58.”
§ Critical transitions in the Amazon forest system > Global change impacts on forest resilience > CO2 fertilization
What the sources say
- Supportedcites [57] Terrer, C. et al. Nitrogen and phosphorus constrain the CO2 fertilization of global plant biomass. Nat. Clim. Change 9, 684–689 (2019). source
The main-text discussion of Fig. 1 identifies soil C:N ratio, an indicator of nitrogen availability, and soil phosphorus availability as predictors of the biomass response to elevated CO₂. It reports that their relationships with the response differ by mycorrhizal type, supporting the claim that CO₂ fertilization depends on these soil nutrients. (LLM, conf=0.94)
- Supportedcites [58] Ellsworth, D. S. et al. Elevated CO2 does not increase eucalypt forest productivity on a low-phosphorus soil. Nat. Clim. Change 7, 279–282 (2017). source
The paper’s main text reports that earlier elevated-CO2 experiments found reduced productivity stimulation when nitrogen was limiting. It also reports that its own experiment found no significant productivity increase under elevated CO2 on a phosphorus-limited site, and concludes that phosphorus availability may constrain the response. No page numbers are provided in our copy. (LLM, conf=0.93)
hedgedconditional- Asserted: passes — The authors put it forward as true.
- Checkable: passes — It can be checked against evidence.
- Load-bearing: passes — The paper’s conclusions depend on it.
- Based: passes — The paper gives a reason why it holds.
- Supported
The cited sources support only part of this claim — read each source’s verdict below.
In the paper
“Forests across the Amazon are already responding with increasing tree mortality rates that are not simulated by these models46, possibly because of compounding disturbance regimes (Fig. 1).”
§ Critical transitions in the Amazon forest system > Five critical drivers of water stress > Global warming
What the sources say
- Partly supportedcites [46] Brienen, R. J. W. et al. Long-term decline of the Amazon carbon sink. Nature 519, 344–348 (2015). sourceExperimental — accuracy not yet measured
The Results (p. 4) report a long-term increase in tree mortality across the studied tropical South American forests. The discussion (p. 5) says demographic feedbacks are not explicitly included in dynamic global vegetation models, but it does not establish that CMIP6 models fail to simulate the observed mortality increase. (LLM, conf=0.88)
hedged- Asserted: passes — The authors put it forward as true.
- Checkable: passes — It can be checked against evidence.
- Load-bearing: passes — The paper’s conclusions depend on it.
- Based: passes — The paper gives a reason why it holds.
- Partly supported
Every source the paper cites for this claim was checked and supports it.
In the paper
“Currently, 86% of the Amazon biome may be in a stable forest state (Extended Data Fig. 1b), but some of these stable forests are showing signs of fragility33.”
§ Critical transitions in the Amazon forest system > Global change impacts on forest resilience > Disturbance regimes
What the sources say
- Supportedcites [33] Boulton, C. A., Lenton, T. M. & Boers, N. Pronounced loss of Amazon rainforest resilience since the early 2000s. Nat. Clim. Change 12, 271–278 (2022). source
The Discussion reports a marked loss of resilience across vast areas of Amazon rainforest where the broadleaf forest fraction has not strongly decreased. This supports the claim that some forests still in a forest state show signs of fragility; the cited paper need not establish the separately cited 86% figure. (LLM, conf=0.93)
plain- Asserted: passes — The authors put it forward as true.
- Checkable: passes — It can be checked against evidence.
- Load-bearing: passes — The paper’s conclusions depend on it.
- Based: passes — The paper gives a reason why it holds.
- Supported
The cited sources support only part of this claim — read each source’s verdict below.
In the paper
“Globally, Indigenous peoples and local communities (IPLCs) have a key role in maintaining ecosystems resilient to global change113.”
§ Critical transitions in the Amazon forest system > Global change impacts on forest resilience > Disturbance regimes
What the sources say
- Partly supportedcites [113] Garnett, S. T. et al. A spatial overview of the global importance of Indigenous lands for conservation. Nat. Sustain. 1, 369–374 (2018). sourceExperimental — accuracy not yet measured
In “Consequences of Indigenous influence on land management” (page unavailable), the paper says Indigenous Peoples and local communities contribute to biodiversity conservation, and that Indigenous Peoples sustain ecosystem diversity worldwide. It describes Indigenous management institutions as resilient, but does not establish that the ecosystems they maintain are resilient to global change. (LLM, conf=0.86)
plaindirect- Asserted: passes — The authors put it forward as true.
- Checkable: passes — It can be checked against evidence.
- Load-bearing: unclear — It is unclear whether the paper’s conclusions depend on it.
- Based: passes — The paper gives a reason why it holds.
- Partly supported
The cited sources support only part of this claim — read each source’s verdict below.
In the paper
“Road networks (Fig. 1d) facilitate illegal activities, promoting more deforestation, logging and fire spread throughout the core of the Amazon forest38,39.”
§ Critical transitions in the Amazon forest system > Global change impacts on forest resilience > Disturbance regimes
What the sources say
- Not checked — no full text of the sourcecites [38] Bullock, E. L., Woodcock, C. E., Souza, C. Jr & Olofsson, P. Satellite-based estimates reveal widespread forest degradation in the Amazon. Global Change Biol. 26, 2956–2969 (2020). source
- Partly supportedcites [39] Lapola, D. M. et al. The drivers and impacts of Amazon forest degradation. Science 379, eabp8622 (2023). sourceExperimental — accuracy not yet measured
The 'Projecting Amazon forest degradation' section says that roads promote degradation and deforestation. The copy does not establish the more specific chain that road networks facilitate illegal activities and thereby promote logging and fire spread throughout the forest core. (LLM, conf=0.84)
plaindirect- Asserted: passes — The authors put it forward as true.
- Checkable: passes — It can be checked against evidence.
- Load-bearing: unclear — It is unclear whether the paper’s conclusions depend on it.
- Based: passes — The paper gives a reason why it holds.
The cited sources support only part of this claim — read each source’s verdict below.
In the paper
“Tree functional diversity increases forest adaptability to climate chance by offering various possibilities of functioning99.”
§ Critical transitions in the Amazon forest system > Global change impacts on forest resilience > Disturbance regimes
What the sources say
- Partly supportedcites [99] Sakschewski, B. et al. Resilience of Amazon forests emerges from plant trait diversity. Nat. Clim. Change 6, 1032–1036 (2016). sourceExperimental — accuracy not yet measured
The indexed Abstract says functional diversity can enhance ecosystem resilience by providing greater response diversity, and that plant trait diversity may enable Amazon forests to adjust to new climate conditions. This supports the proposed mechanism, but the citing sentence states the effect as certain for forests generally, whereas the paper's own finding is qualified and concerns Amazon forests. (LLM, conf=0.82)
plaindirect- Asserted: passes — The authors put it forward as true.
- Checkable: passes — It can be checked against evidence.
- Load-bearing: unclear — It is unclear whether the paper’s conclusions depend on it.
- Based: passes — The paper gives a reason why it holds.
- Partly supported
Every source the paper cites for this claim was checked and supports it.
In the paper
“In addition, CO2 may reduce water stress by increasing tree water-use efficiency29.”
§ Critical transitions in the Amazon forest system > Global change impacts on forest resilience > CO2 fertilization
What the sources say
- Supportedcites [29] van der Sleen, P. et al. No growth stimulation of tropical trees by 150 years of CO2 fertilization but water-use efficiency increased. Nat. Geosci. 8, 24–28 (2015). source
The paper’s Abstract (page not available in our copy) reports increased tree water-use efficiency with rising atmospheric CO2 and says reduced transpiration was very likely. That mechanism supports the citing sentence’s hedged claim that CO2 may reduce water stress. (LLM, conf=0.85)
hedgedconditional- Asserted: passes — The authors put it forward as true.
- Checkable: passes — It can be checked against evidence.
- Load-bearing: passes — The paper’s conclusions depend on it.
- Based: passes — The paper gives a reason why it holds.
- Supported
The cited sources support only part of this claim — read each source’s verdict below.
In the paper
“These emerging positive feedback loops could accelerate a systemic transition of the Amazon forest15.”
§ Critical transitions in the Amazon forest system > Five critical drivers of water stress > Global warming
What the sources say
- Partly supportedcites [15] Flores, B. M. & Staal, A. Feedback in tropical forests of the Anthropocene. Global Change Biol. 28, 5041–5061 (2022). sourceExperimental — accuracy not yet measured
The Introduction and “A network of interactions” section say positive feedback can amplify change and sometimes propel tropical forests into contrasting states. The South America case study discusses Amazon deforestation disrupting rainfall, but its illustrated consequences concern wildfire risk in the Pantanal; it does not specifically say these loops could accelerate a systemic transition of the Amazon forest. Page numbers were not available in our copy. (LLM, conf=0.82)
hedgedconditional- Asserted: passes — The authors put it forward as true.
- Checkable: passes — It can be checked against evidence.
- Load-bearing: passes — The paper’s conclusions depend on it.
- Based: passes — The paper gives a reason why it holds.
- Partly supported
The cited sources support only part of this claim — read each source’s verdict below.
In the paper
“The ecosystem often becomes dominated by fire-tolerant tree and palm species, together with alien invasive grasses and opportunistic herbaceous plants96,97, such as vines and ferns.”
§ Critical transitions in the Amazon forest system > Three alternative ecosystem trajectories > Degraded open-canopy ecosystem
What the sources say
- Not checked — no full text of the sourcecites [96] Veldman, J. W. & Putz, F. E. Grass-dominated vegetation, not species-diverse natural savanna, replaces degraded tropical forests on the southern edge of the Amazon Basin. Biol. Conserv. 144, 1419–1429 (2011). source
- Partly supportedcites [97] Silvério, D. V. et al. Testing the Amazon savannization hypothesis: fire effects on invasion of a neotropical forest by native cerrado and exotic pasture grasses. Phil. Trans. R. Soc. B 368, 20120427 (2013). sourceExperimental — accuracy not yet measured
The fire-induced grass-invasion section reports that exotic pasture grasses can establish after fires, and the persistence section says fire-degraded forests may become dominated by vines, resprouts and pioneer trees. The paper does not establish the claimed combined dominance by fire-tolerant trees, palms, invasive grasses and opportunistic plants, and the cited passages do not mention ferns. Its persistence section also notes that grass dominance may be transient. (LLM, conf=0.86)
plain- Asserted: passes — The authors put it forward as true.
- Checkable: passes — It can be checked against evidence.
- Load-bearing: unclear — It is unclear whether the paper’s conclusions depend on it.
- Based: passes — The paper gives a reason why it holds.
The cited sources support only part of this claim — read each source’s verdict below.
In the paper
“These alternative trajectories may be irreversible or transient depending on the strength of the novel interactions15.”
§ Critical transitions in the Amazon forest system > Three alternative ecosystem trajectories > Degraded forest
What the sources say
- Partly supportedcites [15] Flores, B. M. & Staal, A. Feedback in tropical forests of the Anthropocene. Global Change Biol. 28, 5041–5061 (2022). sourceExperimental — accuracy not yet measured
The Conclusions (page not available) say that the balance of strong and weak feedbacks will determine how global changes affect tropical forests. The ‘A network of interactions’ section (page not available) says positive feedbacks can propel forests to a contrasting state, but our copy does not say whether the resulting trajectories are irreversible or transient. (LLM, conf=0.83)
hedgedconditional- Asserted: passes — The authors put it forward as true.
- Checkable: passes — It can be checked against evidence.
- Load-bearing: passes — The paper’s conclusions depend on it.
- Based: passes — The paper gives a reason why it holds.
- Partly supported
The cited sources support only part of this claim — read each source’s verdict below.
In the paper
“Estimates from the southern Amazon indicate that 5−6% of the landscape has already shifted into degraded open-canopy ecosystems due to deforestation and fires45,96.”
§ Critical transitions in the Amazon forest system > Three alternative ecosystem trajectories > Degraded open-canopy ecosystem
What the sources say
- Partly supportedcites [45] Silvério, D. V. et al. Intensification of fire regimes and forest loss in the Território Indígena do Xingu. Environ. Res. Lett. 17, 045012 (2022). sourceExperimental — accuracy not yet measured
The Results report forest-cover loss in the Território Indígena do Xingu, with fire the most important predictor, and the Abstract describes degradation as reduced canopy cover. But the paper estimates approximately 7% for this specific territory, not 5–6% of the southern Amazon landscape. (LLM, conf=0.88)
- Not checked — no full text of the sourcecites [96] Veldman, J. W. & Putz, F. E. Grass-dominated vegetation, not species-diverse natural savanna, replaces degraded tropical forests on the southern edge of the Amazon Basin. Biol. Conserv. 144, 1419–1429 (2011). source
hedgeddirect- Asserted: passes — The authors put it forward as true.
- Checkable: passes — It can be checked against evidence.
- Load-bearing: unclear — It is unclear whether the paper’s conclusions depend on it.
- Based: passes — The paper gives a reason why it holds.
- Partly supported
The cited sources that could be checked couldn’t confirm or dispute this claim.
In the paper
“Liana forests are expected to expand with increasing aridity, disturbance regimes and CO2 fertilization90.”
§ Critical transitions in the Amazon forest system > Three alternative ecosystem trajectories > Degraded forest
What the sources say
- Could not verifycites [90] Schnitzer, S. A. & Bongers, F. Increasing liana abundance and biomass in tropical forests: emerging patterns and putative mechanisms: Increasing lianas in tropical forests. Ecology Letters 14, 397–406 (2011). sourceExperimental — accuracy not yet measured
The available indexed passages contain bibliographic information and keywords, including “elevated atmospheric co2,” but no discussion of whether liana forests will expand. Searches for aridity, disturbance, CO2 fertilization, and increasing liana abundance returned no passage stating the claimed relationship. (LLM, conf=0.72)
hedgedconditional- Asserted: passes — The authors put it forward as true.
- Checkable: passes — It can be checked against evidence.
- Load-bearing: unclear — It is unclear whether the paper’s conclusions depend on it.
- Based: passes — The paper gives a reason why it holds.
- Could not verify
The cited sources support only part of this claim — read each source’s verdict below.
In the paper
“Among the remaining old-growth forests, at least 38% have been degraded by land use disturbances and repeated extreme droughts39, with impacts on moisture recycling that are still uncertain.”
§ Critical transitions in the Amazon forest system > Five critical drivers of water stress > Accumulated deforestation
What the sources say
- Partly supportedcites [39] Lapola, D. M. et al. The drivers and impacts of Amazon forest degradation. Science 379, eabp8622 (2023). sourceExperimental — accuracy not yet measured
The Extended summary and Spatial extent and severity section estimate that 38% of remaining Amazonian forests were affected by fire, edge effects, timber extraction, or extreme drought during 2001–2018 (page not provided). But the estimate includes single drought events, not just repeated ones: Changes in carbon stocks and basin-wide emissions says only about one-third of drought-affected area experienced multiple droughts. The paper describes the denominator as remaining Amazonian forest, rather than specifically old-growth forest. (LLM, conf=0.88)
plaindirect- Asserted: passes — The authors put it forward as true.
- Checkable: passes — It can be checked against evidence.
- Load-bearing: unclear — It is unclear whether the paper’s conclusions depend on it.
- Based: passes — The paper gives a reason why it holds.
- Partly supported
The cited sources support only part of this claim — read each source’s verdict below.
In the paper
“Other more recent models incorporating fire disturbances support a potential broad-scale transition of the Amazon forest, simulating a biomass loss of 30–40% under a high-emission scenario5,82 (SSP5–8.5 at 4 °C).”
§ Critical transitions in the Amazon forest system > Five critical drivers of water stress > Accumulated deforestation
What the sources say
- Partly supportedcites [5] Cano, I. M. et al. Abrupt loss and uncertain recovery from fires of Amazon forests under low climate mitigation scenarios. Proc. Natl Acad. Sci. USA 119, e2203200119 (2022). sourceExperimental — accuracy not yet measured
The Results section ('Projected Changes in Tropical Tree Biomass'; page unavailable) reports that GFDL-ESM4.1 projects Neotropical forest biomass falling to 40% below its initial stock under SSP5-8.5, and describes fire-driven declines in Amazon grid cells. This supports the potential broad-scale transition, but our copy does not give a 30–40% biomass-loss range or tie that loss to 4 °C of warming. It also notes that another fire-capable model projects forest growth under high emissions. (LLM, conf=0.86)
- Partly supportedcites [82] Burton, C. et al. South American fires and their impacts on ecosystems increase with continued emissions. Clim. Resil. Sustain. 1, e8 (2022). sourceExperimental — accuracy not yet measured
Section 4.3 (Vegetation impacts; page unavailable) projects a 30% reduction in vegetation carbon under SSP5-8.5 at 4 °C. The Discussion says fire feedbacks can shift forest-dominated ecosystems toward grasses and shrubs, including impacts in Amazonia. But the 30% figure is for South America as a whole, not specifically the Amazon, and the paper does not give the claimed 30–40% range. (LLM, conf=0.88)
hedgedconditional- Asserted: passes — The authors put it forward as true.
- Checkable: passes — It can be checked against evidence.
- Load-bearing: unclear — It is unclear whether the paper’s conclusions depend on it.
- Based: passes — The paper gives a reason why it holds.
- Partly supported
The cited sources support only part of this claim — read each source’s verdict below.
In the paper
“In a remote landscape far from large agricultural frontiers, within a stable forest region of the Amazon (Extended Data Fig. 1b), satellite and field evidence revealed that white-sand savannas are expanding where floodplain forests were repeatedly disturbed by fires95.”
§ Critical transitions in the Amazon forest system > Three alternative ecosystem trajectories > White-sand savanna
What the sources say
- Partly supportedcites [95] Flores, B. M. & Holmgren, M. White-sand savannas expand at the core of the Amazon after forest wildfires. Ecosystems 24, 1624–1637 (2021). sourceExperimental — accuracy not yet measured
Split into 2 atoms — 1 confirmed, 1 partially supported, 0 disputed, 0 misattributed, 0 unverifiable. Expand the claim to see per-atom verdicts.
plaindirectSingle case- Asserted: passes — The authors put it forward as true.
- Checkable: passes — It can be checked against evidence.
- Load-bearing: passes — The paper’s conclusions depend on it.
- Based: passes — The paper gives a reason why it holds.
- Partly supported
The cited sources support only part of this claim — read each source’s verdict below.
In the paper
“In bistable regions of the Amazon forest with annual rainfall below 1,800 mm (Extended Data Fig. 1b), shifts to degraded open-canopy ecosystems are relatively common after repeated disturbances by fire45,96.”
§ Critical transitions in the Amazon forest system > Three alternative ecosystem trajectories > Degraded open-canopy ecosystem
What the sources say
- Partly supportedcites [45] Silvério, D. V. et al. Intensification of fire regimes and forest loss in the Território Indígena do Xingu. Environ. Res. Lett. 17, 045012 (2022). sourceExperimental — accuracy not yet measured
The Discussion (page unavailable) reports that, after three consecutive fires, over half of the forests studied in the Território Indígena do Xingu entered a degraded state that could persist for years or decades. This supports the repeated-fire and degradation part of the claim, but the paper does not establish that such shifts are relatively common across Amazonian bistable regions. The 1,800 mm rainfall boundary is attributed in the citing sentence to its own Extended Data figure, not specifically to this source. (LLM, conf=0.84)
- Not checked — no full text of the sourcecites [96] Veldman, J. W. & Putz, F. E. Grass-dominated vegetation, not species-diverse natural savanna, replaces degraded tropical forests on the southern edge of the Amazon Basin. Biol. Conserv. 144, 1419–1429 (2011). source
plaindirect- Asserted: passes — The authors put it forward as true.
- Checkable: passes — It can be checked against evidence.
- Load-bearing: unclear — It is unclear whether the paper’s conclusions depend on it.
- Based: passes — The paper gives a reason why it holds.
- Partly supported
The cited sources support only part of this claim — read each source’s verdict below.
In the paper
“At the regional scale, a self-reinforcing feedback between forest loss and reduced atmospheric moisture flow may increase the resilience of these open-canopy degraded ecosystems42.”
§ Critical transitions in the Amazon forest system > Three alternative ecosystem trajectories > Degraded forest
What the sources say
- Partly supportedcites [42] Staal, A. et al. Feedback between drought and deforestation in the Amazon. Environ. Res. Lett. 15, 044024 (2020). sourceExperimental — accuracy not yet measured
The Abstract describes a regional feedback in which forest loss reduces recycled moisture and intensifies dry seasons. The Discussion says fire-related feedbacks may favor open vegetation and that forest loss could become self-perpetuating. It does not establish that reduced atmospheric moisture flow increases the resilience of open-canopy degraded ecosystems. (LLM, conf=0.83)
hedgedconditional- Asserted: passes — The authors put it forward as true.
- Checkable: passes — It can be checked against evidence.
- Load-bearing: unclear — It is unclear whether the paper’s conclusions depend on it.
- Based: passes — The paper gives a reason why it holds.
- Partly supported
The cited sources support only part of this claim — read each source’s verdict below.
In the paper
“In the ‘degraded open-canopy ecosystem’ trajectory, feedbacks involve interactions among low tree cover and fire97, soil erosion60, seed limitation105, invasive grasses and opportunistic plants96.”
§ Critical transitions in the Amazon forest system > Three alternative ecosystem trajectories > Degraded forest
What the sources say
- Partly supportedcites [97] Silvério, D. V. et al. Testing the Amazon savannization hypothesis: fire effects on invasion of a neotropical forest by native cerrado and exotic pasture grasses. Phil. Trans. R. Soc. B 368, 20120427 (2013). sourceExperimental — accuracy not yet measured
The Introduction and ‘Fire-induced loss of canopy cover’ section describe a feedback in which fire reduces tree cover, grasses invade, and grass fuels intensify subsequent fires. The ‘Persistence of fire-promoting grasses’ section also mentions vines, resprouts, and pioneer trees in fire-degraded forests, but presents them as possible alternatives to grass dominance, not as participants in the described feedback. (LLM, conf=0.84)
- Could not verifycites [60] Flores, B. M. et al. Soil erosion as a resilience drain in disturbed tropical forests. Plant Soil https://doi.org/10.1007/s11104-019-04097-8 (2020). sourceExperimental — accuracy not yet measured
The citation is attached specifically to soil erosion, not to the other feedbacks listed in the sentence. Searches for soil erosion and its feedback with reduced tree cover returned only an abstract and bibliographic material, with no full-text passage on which to base a verdict. (LLM, conf=0.70)
- Supportedcites [105] Hawes, J. E. et al. A large‐scale assessment of plant dispersal mode and seed traits across human‐modified Amazonian forests. J. Ecol. 108, 1373–1385 (2020). source
Citation 105 is attached to “seed limitation,” not to the other feedbacks listed in the sentence. The Discussion (page unavailable) describes a possible destabilising feedback in which a lack of large-seeded fruiting trees deters their animal dispersers, limiting the immigration and dispersal of large-seeded species. (LLM, conf=0.86)
plaincorrelational- Asserted: passes — The authors put it forward as true.
- Checkable: passes — It can be checked against evidence.
- Load-bearing: unclear — It is unclear whether the paper’s conclusions depend on it.
- Based: passes — The paper gives a reason why it holds.
- Partly supported
The sources with a verdict support this claim; the rest weren’t checked yet, have no full text we could read, or their verdicts aren’t rated yet.
In the paper
“An additional 38% of the forest biome has been damaged by extreme droughts, fires, logging and edge effects38,39.”
§ Critical transitions in the Amazon forest system > Three alternative ecosystem trajectories > Degraded forest
What the sources say
- Not checked — no full text of the sourcecites [38] Bullock, E. L., Woodcock, C. E., Souza, C. Jr & Olofsson, P. Satellite-based estimates reveal widespread forest degradation in the Amazon. Global Change Biol. 26, 2956–2969 (2020). source
- Supportedcites [39] Lapola, D. M. et al. The drivers and impacts of Amazon forest degradation. Science 379, eabp8622 (2023). source
The Extended summary reports that adding extreme drought to fire, edge effects and timber extraction raises the estimated degraded area to 38% of remaining Amazonian forests. The Spatial extent and severity section likewise gives 38% after accounting for overlap among all four disturbances. (LLM, conf=0.94)
plaindirect- Asserted: passes — The authors put it forward as true.
- Checkable: passes — It can be checked against evidence.
- Load-bearing: unclear — It is unclear whether the paper’s conclusions depend on it.
- Based: passes — The paper gives a reason why it holds.
The cited sources support only part of this claim — read each source’s verdict below.
In the paper
“In the ‘white-sand savanna’ trajectory, the main feedbacks result from interactions among low tree cover and fire, soil erosion, and seed limitation106.”
§ Critical transitions in the Amazon forest system > Three alternative ecosystem trajectories > Degraded forest
What the sources say
- Partly supportedcites [106] Flores, B. M. & Holmgren, M. Why forest fails to recover after repeated wildfires in Amazonian floodplains? Experimental evidence on tree recruitment limitation. J. Ecol. 109, 3473–3486 (2021). sourceExperimental — accuracy not yet measured
The Conclusions (page unavailable) describe repeatedly burnt floodplain forests slowly transitioning toward a white-sand savanna state. Section 4.5 and Figure 5 describe feedbacks involving seed limitation, fire and flood erosion, but present the erosion and fire feedbacks as expected or possible rather than established as the trajectory’s main feedbacks. (LLM, conf=0.84)
plaindirect- Asserted: passes — The authors put it forward as true.
- Checkable: passes — It can be checked against evidence.
- Load-bearing: unclear — It is unclear whether the paper’s conclusions depend on it.
- Based: passes — The paper gives a reason why it holds.
- Partly supported
The cited sources support only part of this claim — read each source’s verdict below.
In the paper
“Liana forests can also be relatively stable, because lianas self-perpetuate by causing physical damage to trees, allowing lianas to remain at high density90,91.”
§ Critical transitions in the Amazon forest system > Three alternative ecosystem trajectories > Degraded forest
What the sources say
- Could not verifycites [90] Schnitzer, S. A. & Bongers, F. Increasing liana abundance and biomass in tropical forests: emerging patterns and putative mechanisms: Increasing lianas in tropical forests. Ecology Letters 14, 397–406 (2011). sourceExperimental — accuracy not yet measured
The supplied passages contain bibliographic metadata but no discussion of liana-dominated forest stability. Further searches for physical tree damage, self-perpetuation, and feedbacks affecting liana density returned no substantive passage, so this claim cannot be checked against our copy. (LLM, conf=0.72)
- Partly supportedcites [91] Tymen, B. et al. Evidence for arrested succession in a liana-infested Amazonian forest. J Ecol 104, 149–159 (2016). sourceExperimental — accuracy not yet measured
The Abstract reports that the studied liana-infested forest remained stable in extent from 2007 to 2012 and that fast forest dynamics maintained high liana infestation. The “Influence of Lianas on Forest Dynamics” section links tree mortality and resulting canopy gaps to liana maintenance, but attributes faster tree dynamics probably to species composition and competition; it does not establish physical damage to trees as the mechanism. The study also concerns a single forest patch, rather than liana forests generally. (LLM, conf=0.87)
plaindirect- Asserted: passes — The authors put it forward as true.
- Checkable: passes — It can be checked against evidence.
- Load-bearing: passes — The paper’s conclusions depend on it.
- Based: passes — The paper gives a reason why it holds.
- Could not verify
The cited sources support only part of this claim — read each source’s verdict below.
In the paper
“Satellite observations of tree cover distributions across tropical South America suggest a critical threshold in rainfall seasonality intensity at −400 mm of the maximum cumulative water deficit37,80 (MCWD).”
§ Critical transitions in the Amazon forest system > Five critical drivers of water stress > Rainfall seasonality intensity
What the sources say
- Partly supportedcites [37] Zemp, D. C. et al. Self-amplified Amazon forest loss due to vegetation-atmosphere feedbacks. Nat. Commun. 8, 14681 (2017). sourceExperimental — accuracy not yet measured
The Results section (“Forest shifts”; page unavailable) says that forest probability across rainfall regimes is derived from satellite data and that forest resilience decreases as MCWD decreases. The Methods section (“Potential landscapes”; page unavailable) examines tree-cover states across MCWD values, but the retrieved passages do not identify a critical threshold at −400 mm. That numerical threshold is unsupported by our copy. (LLM, conf=0.86)
- Partly supportedcites [80] Malhi, Y. et al. Exploring the likelihood and mechanism of a climate-change-induced dieback of the Amazon rainforest. Proc. Natl Acad. Sci. USA 106, 20610–20615 (2009). sourceExperimental — accuracy not yet measured
In “Hydrological Thresholds on Current Forest Extent” (page unavailable), the paper uses satellite-derived maps and reports that savannas predominate below −400 mm MCWD when annual precipitation is below 1,500 mm. It explicitly says there is no sharp vegetation threshold: the forest–savanna transition spans −400 to −200 mm MCWD. The claim omits both the precipitation condition and the broad transition. (LLM, conf=0.88)
hedgedcorrelational- Asserted: passes — The authors put it forward as true.
- Checkable: passes — It can be checked against evidence.
- Load-bearing: passes — The paper’s conclusions depend on it.
- Based: passes — The paper gives a reason why it holds.
- Partly supported
The cited sources support only part of this claim — read each source’s verdict below.
In the paper
“Simulating individual trees can improve the representation of growth and mortality dynamics, which ultimately affect forest dynamics (for example, refs. 61,62,99).”
§ Critical transitions in the Amazon forest system > Prospects for modelling Amazon forest dynamics
What the sources say
- Partly supportedcites [61] Longo, M. et al. Ecosystem heterogeneity and diversity mitigate Amazon forest resilience to frequent extreme droughts. New Phytol. 219, 914–931 (2018). sourceExperimental — accuracy not yet measured
The Ecosystem Demography Model, version 2 section describes a size- and age-structured model, and Site-level simulations link size-dependent growth and mortality to changes in forest structure. This supports the importance of representing tree-level differences, but the paper describes structured equations rather than simulations of individual trees and does not show that individual-tree simulation improves the representation of those dynamics. (LLM, conf=0.82)
- Supportedcites [62] Levine, N. M. et al. Ecosystem heterogeneity determines the ecological resilience of the Amazon to climate change. Proc. Natl Acad. Sci. USA 113, 793–797 (2016). source
The Significance section says that representing individual-level responses improves models’ ability to capture forest structure, composition, and dynamics. It also explains that differences among individual plants influence growth and mortality, producing forest-level responses that differ from those of an aggregated model. (LLM, conf=0.92)
- Could not verifycites [99] Sakschewski, B. et al. Resilience of Amazon forests emerges from plant trait diversity. Nat. Clim. Change 6, 1032–1036 (2016). sourceExperimental — accuracy not yet measured
The supplied passages and additional searches for individual trees, growth, mortality, and forest modelling returned bibliographic material rather than a passage addressing the claim. Our indexed copy therefore does not establish whether the paper says that simulating individual trees improves the representation of growth and mortality dynamics. (LLM, conf=0.72)
plaindirect- Asserted: passes — The authors put it forward as true.
- Checkable: passes — It can be checked against evidence.
- Load-bearing: unclear — It is unclear whether the paper’s conclusions depend on it.
- Based: passes — The paper gives a reason why it holds.
- Partly supported
The cited sources support only part of this claim — read each source’s verdict below.
In the paper
“Satellite observations of tree cover distributions across tropical South America suggest a critical threshold between 1,000 and 1,250 mm of annual rainfall78,79.”
§ Critical transitions in the Amazon forest system > Five critical drivers of water stress > Annual rainfall
What the sources say
- Partly supportedcites [78] Staal, A. et al. Hysteresis of tropical forests in the 21st century. Nat. Commun. 11, 4978 (2020). sourceExperimental — accuracy not yet measured
The Results (‘Stability of tropical forests’; page unavailable) use forest-cover distributions to identify a rainfall-dependent change in South America, with bistability beginning at 1,250 mm per year. The paper does not place the threshold between 1,000 and 1,250 mm per year; it reports a bistable range of 1,250–2,050 mm per year. (LLM, conf=0.85)
- Not checked — no full text of the sourcecites [79] Staver, A. C., Archibald, S. & Levin, S. A. The global extent and determinants of savanna and forest as alternative biome states. Science 334, 230–232 (2011). source
hedgedcorrelational- Asserted: passes — The authors put it forward as true.
- Checkable: passes — It can be checked against evidence.
- Load-bearing: passes — The paper’s conclusions depend on it.
- Based: passes — The paper gives a reason why it holds.
- Partly supported
Every source the paper cites for this claim was checked and supports it.
In the paper
“Here we use the runs from Tuinenburg et al.134, who published monthly climatological mean (2008–2017) moisture flows between each pair of 0.5° grid cells on Earth.”
§ Critical transitions in the Amazon forest system > Methods > Atmospheric moisture tracking
What the sources say
- Supportedcites Tuinenburg et al. [134] Tuinenburg, O. A., Theeuwen, J. J. E. & Staal, A. High-resolution global atmospheric moisture connections from evaporation to precipitation. Earth Syst. Sci. Data 12, 3177–3188 (2020). source
The Introduction states that the dataset contains moisture flows between every pair of 0.5° grid cells and consists of monthly multi-annual mean footprints for 2008–2017. Methods §2.2 confirms that the published output was aggregated to 0.5° resolution and provided as monthly means over that period. (LLM, conf=0.95)
plain- Asserted: passes — The authors put it forward as true.
- Checkable: passes — It can be checked against evidence.
- Load-bearing: passes — The paper’s conclusions depend on it.
- Based: passes — The paper gives a reason why it holds.
- Supported
The sources with a verdict support this claim; the rest weren’t checked yet, have no full text we could read, or their verdicts aren’t rated yet.
In the paper
“Although MODIS VCF can contain errors within lower tree cover ranges and should not be used to test for bistability between grasslands and savannas125, the dataset is relatively robust for assessing bistability within the tree cover range of forests and savannas126, as also shown by low uncertainty (standard deviation of tree cover estimates) across the Amazon (Extended Data Fig. 8).”
§ Critical transitions in the Amazon forest system > Methods > Datasets
What the sources say
- Not checked — no full text of the sourcecites [125] Sexton, J. O. et al. Global, 30-m resolution continuous fields of tree cover: Landsat-based rescaling of MODIS vegetation continuous fields with lidar-based estimates of error. Int. J. Digital Earth 6, 427–448 (2013). source
- Supportedcites [126] Staver, A. C. & Hansen, M. C. Analysis of stable states in global savannas: is the CART pulling the horse? – a comment. Global Ecol. Biogeogr. 24, 985–987 (2015). source
The paper reports no systematic bias in MODIS VCF at 50–75% tree cover, the intermediate range at the savanna–forest boundary (passage 4, labelled Abstract; page not supplied). It contrasts this with substantial bias at low tree cover. The Amazon uncertainty observation is attributed to the citing paper’s Extended Data Fig. 8, not to this source. (LLM, conf=0.90)
plaincorrelational- Asserted: passes — The authors put it forward as true.
- Checkable: passes — It can be checked against evidence.
- Load-bearing: passes — The paper’s conclusions depend on it.
- Based: passes — The paper gives a reason why it holds.
The paper states this without a source or data behind it here, so there is nothing to check it against. The quote shows it is in the paper.
In the paper
“Bistable areas covering 8% of the biome may turn into stable forest in the western Amazon (Peru and Bolivia), thus becoming more resilient to disturbances.”
§ Critical transitions in the Amazon forest system > Global change impacts on forest resilience > Regional climatic conditions
hedgedconditional- Asserted: passes — The authors put it forward as true.
- Checkable: passes — It can be checked against evidence.
- Load-bearing: passes — The paper’s conclusions depend on it.
- Based: passes — The paper gives a reason why it holds.
In the paper
“Now, the region is increasingly exposed to unprecedented stress from warming temperatures, extreme droughts, deforestation and fires, even in central and remote parts of the system1.”
§ Critical transitions in the Amazon forest system > Abstract
What the sources say
- Not checked yetcites [1] Science Panel for the Amazon. Amazon Assessment Report 2021 (2021); www.theamazonwewant.org/amazon-assessment-report-2021/.
plaindirect- Asserted: passes — The authors put it forward as true.
- Checkable: passes — It can be checked against evidence.
- Load-bearing: passes — The paper’s conclusions depend on it.
- Based: passes — The paper gives a reason why it holds.
A result the paper reports from its own data — it cites no other source for it, so there is none to check. The quote shows it is in the paper.
In the paper
“However, an ensemble with all 33 models suggests that 35–41% of the biome could become bistable, including large areas of the southern Amazon.”
§ Critical transitions in the Amazon forest system > Global change impacts on forest resilience > Regional climatic conditions
hedgedconditional- Asserted: passes — The authors put it forward as true.
- Checkable: passes — It can be checked against evidence.
- Load-bearing: passes — The paper’s conclusions depend on it.
- Based: passes — The paper gives a reason why it holds.
The paper states this without a source or data behind it here, so there is nothing to check it against. The quote shows it is in the paper.
In the paper
“Another 3% of the biome may pass the critical threshold in annual rainfall into stable savanna in the southern Bolivian Amazon.”
§ Critical transitions in the Amazon forest system > Global change impacts on forest resilience > Regional climatic conditions
hedgedconditional- Asserted: passes — The authors put it forward as true.
- Checkable: passes — It can be checked against evidence.
- Load-bearing: passes — The paper’s conclusions depend on it.
- Based: passes — The paper gives a reason why it holds.
A result the paper reports from its own data — it cites no other source for it, so there is none to check. The quote shows it is in the paper.
In the paper
“By combining spatial information on various disturbances, we estimate that by 2050, 10% to 47% of Amazonian forests will be exposed to compounding disturbances that may trigger unexpected ecosystem transitions and potentially exacerbate regional climate change.”
§ Critical transitions in the Amazon forest system > Abstract
hedgedconditional- Asserted: passes — The authors put it forward as true.
- Checkable: passes — It can be checked against evidence.
- Load-bearing: passes — The paper’s conclusions depend on it.
- Based: passes — The paper gives a reason why it holds.
- Rests on an assumption: The additive sum of warming/drying slopes, ecosystem stability classes, drought impacts, road proximity, and governance can serve as a proxy for ecosystem transition potential.
The paper states this without a source or data behind it here, so there is nothing to check it against. The quote shows it is in the paper.
In the paper
“For example, 6% of the biome may change from stable forest to a bistable regime in parts of the southern and central Amazon.”
§ Critical transitions in the Amazon forest system > Global change impacts on forest resilience > Regional climatic conditions
hedgedconditional- Asserted: passes — The authors put it forward as true.
- Checkable: passes — It can be checked against evidence.
- Load-bearing: passes — The paper’s conclusions depend on it.
- Based: passes — The paper gives a reason why it holds.
A result the paper reports from its own data — it cites no other source for it, so there is none to check. The quote shows it is in the paper.
In the paper
“Brazil is the largest supplier of rainfall to western Amazonian countries.”
§ Critical transitions in the Amazon forest system > Local versus systemic transition > Sources of connectivity
plaindirect- Asserted: passes — The authors put it forward as true.
- Checkable: passes — It can be checked against evidence.
- Load-bearing: passes — The paper’s conclusions depend on it.
- Based: passes — The paper gives a reason why it holds.
A result the paper reports from its own data — it cites no other source for it, so there is none to check. The quote shows it is in the paper.
In the paper
“Currently, 86% of the Amazon biome may be in a stable forest state (Extended Data Fig. 1b), but some of these stable forests are showing signs of fragility33.”
§ Critical transitions in the Amazon forest system > Global change impacts on forest resilience > Disturbance regimes
hedged- Asserted: passes — The authors put it forward as true.
- Checkable: passes — It can be checked against evidence.
- Load-bearing: unclear — It is unclear whether the paper’s conclusions depend on it.
- Based: passes — The paper gives a reason why it holds.
A result the paper reports from its own data — it cites no other source for it, so there is none to check. The quote shows it is in the paper.
In the paper
“Up to one-third of the total annual rainfall in Amazonian territories of Bolivia, Peru, Colombia and Ecuador depends on water originating from Brazil’s portion of the Amazon forest.”
§ Critical transitions in the Amazon forest system > Local versus systemic transition > Sources of connectivity
plaindirect- Asserted: passes — The authors put it forward as true.
- Checkable: passes — It can be checked against evidence.
- Load-bearing: passes — The paper’s conclusions depend on it.
- Based: passes — The paper gives a reason why it holds.
A result the paper reports from its own data — it cites no other source for it, so there is none to check. The quote shows it is in the paper.
In the paper
“Between 1,000 and 1,800 mm of annual rainfall, high and low tree cover ecosystems exist in the Amazon as two alternative stable states (see Extended Data Table 2 for uncertainty ranges).”
§ Critical transitions in the Amazon forest system > Five critical drivers of water stress > Annual rainfall
plaincorrelational- Asserted: passes — The authors put it forward as true.
- Checkable: passes — It can be checked against evidence.
- Load-bearing: passes — The paper’s conclusions depend on it.
- Based: passes — The paper gives a reason why it holds.
A result the paper reports from its own data — it cites no other source for it, so there is none to check. The quote shows it is in the paper.
In the paper
“On the basis of our reanalysis using tree cover data from the Amazon basin (Extended Data Fig. 1a), we confirm a potential threshold at 1,000 mm of annual rainfall (Fig. 3a), below which forests become rare and unstable.”
§ Critical transitions in the Amazon forest system > Five critical drivers of water stress > Annual rainfall
hedgedconditional- Asserted: passes — The authors put it forward as true.
- Checkable: passes — It can be checked against evidence.
- Load-bearing: passes — The paper’s conclusions depend on it.
- Based: passes — The paper gives a reason why it holds.
The paper states this without a source or data behind it here, so there is nothing to check it against. The quote shows it is in the paper.
In the paper
“Forest resilience is changing across the Amazon as disturbance regimes intensify (Fig. 1).”
§ Critical transitions in the Amazon forest system > Implications for governance
plaindirect- Asserted: passes — The authors put it forward as true.
- Checkable: passes — It can be checked against evidence.
- Load-bearing: passes — The paper’s conclusions depend on it.
- Based: passes — The paper gives a reason why it holds.
A result the paper reports from its own data — it cites no other source for it, so there is none to check. The quote shows it is in the paper.
In the paper
“Our findings also indicate that Amazon forest resilience is affected by compounding disturbances (Fig. 1).”
§ Critical transitions in the Amazon forest system > Prospects for modelling Amazon forest dynamics
hedgeddirect- Asserted: passes — The authors put it forward as true.
- Checkable: passes — It can be checked against evidence.
- Load-bearing: passes — The paper’s conclusions depend on it.
- Based: passes — The paper gives a reason why it holds.
The paper states this without a source or data behind it here, so there is nothing to check it against. The quote shows it is in the paper.
In the paper
“From examples of disturbed forests across the Amazon, we identify the three most plausible ecosystem trajectories related to the types of disturbances, feedbacks and local environmental conditions.”
§ Critical transitions in the Amazon forest system > Three alternative ecosystem trajectories > Degraded forest
plaincorrelational- Asserted: passes — The authors put it forward as true.
- Checkable: passes — It can be checked against evidence.
- Load-bearing: passes — The paper’s conclusions depend on it.
- Based: passes — The paper gives a reason why it holds.
A result the paper reports from its own data — it cites no other source for it, so there is none to check. The quote shows it is in the paper.
In the paper
“Within the bistability range in annual rainfall conditions, forests are relatively more likely to collapse when severely disturbed, when compared to forests in areas with annual rainfall above 1,800 mm (Extended Data Fig. 1a).”
§ Critical transitions in the Amazon forest system > Five critical drivers of water stress > Annual rainfall
hedgedconditional- Asserted: passes — The authors put it forward as true.
- Checkable: passes — It can be checked against evidence.
- Load-bearing: passes — The paper’s conclusions depend on it.
- Based: passes — The paper gives a reason why it holds.
The paper states this without a source or data behind it here, so there is nothing to check it against. The quote shows it is in the paper.
In the paper
“The sum of these layers revealed relative spatial variation in ecosystem transition potential by 2050 across the Amazon (Fig. 1f), ranging from −1 (low potential) to 4 (very high potential).”
§ Critical transitions in the Amazon forest system > Methods > Transition potential
plaincorrelational- Asserted: passes — The authors put it forward as true.
- Checkable: passes — It can be checked against evidence.
- Load-bearing: passes — The paper’s conclusions depend on it.
- Based: passes — The paper gives a reason why it holds.
- Rests on an assumption: Protected areas and Indigenous territories have lower exposure to human land-use disturbances such as deforestation and forest fires.
None of the sources cited for this claim have been checked yet.
In the paper
“The Amazon forest holds more than 10% of Earth’s terrestrial biodiversity, stores an amount of carbon equivalent to 15–20 years of global CO2 emissions (150–200 Pg C), and has a net cooling effect (from evapotranspiration) that helps to stabilize the Earth’s climate1–3.”
§ Critical transitions in the Amazon forest system > Main
What the sources say
- Not checked yetcites [1] Science Panel for the Amazon. Amazon Assessment Report 2021 (2021); www.theamazonwewant.org/amazon-assessment-report-2021/.
- Not checked yetcites [2] IPCC. Climate Change 2021: The Physical Science Basis (eds Masson-Delmotte, V. et al.) https://www.ipcc.ch/report/ar6/wg1/#FullReport (Cambridge Univ. Press, 2021).
- Not checked — no full text of the sourcecites [3] Armstrong McKay, D. et al. Exceeding 1.5 °C global warming could trigger multiple climate tipping points. Science 377, abn7950 (2022). source
plaindirect- Asserted: passes — The authors put it forward as true.
- Checkable: passes — It can be checked against evidence.
- Load-bearing: unclear — It is unclear whether the paper’s conclusions depend on it.
- Based: passes — The paper gives a reason why it holds.
In the paper
“Within the twenty-first century, global warming may cause long-term changes in Amazonian climatic conditions2.”
§ Critical transitions in the Amazon forest system > Global change impacts on forest resilience > Regional climatic conditions
What the sources say
- Not checked yetcites [2] IPCC. Climate Change 2021: The Physical Science Basis (eds Masson-Delmotte, V. et al.) https://www.ipcc.ch/report/ar6/wg1/#FullReport (Cambridge Univ. Press, 2021).
hedgedconditional- Asserted: passes — The authors put it forward as true.
- Checkable: passes — It can be checked against evidence.
- Load-bearing: passes — The paper’s conclusions depend on it.
- Based: passes — The paper gives a reason why it holds.
A conclusion the paper draws from its own results — it cites no other source for it, so there is none to check. The quote shows it is in the paper.
In the paper
“If trends continue, these areas could potentially warm by over 4 °C by 2050.”
§ Critical transitions in the Amazon forest system > Global change impacts on forest resilience > Regional climatic conditions
hedgedconditional- Asserted: passes — The authors put it forward as true.
- Checkable: passes — It can be checked against evidence.
- Load-bearing: unclear — It is unclear whether the paper’s conclusions depend on it.
- Based: passes — The paper gives a reason why it holds.
In the paper
“As ecosystems approach a tipping point, they often lose resilience while still remaining close to equilibrium17.”
§ Critical transitions in the Amazon forest system > Theory and concepts
What the sources say
- Not checked — no full text of the sourcecites [17] Scheffer, M. et al. Anticipating critical transitions. Science 338, 344–348 (2012). source
hedgedcorrelational- Asserted: passes — The authors put it forward as true.
- Checkable: passes — It can be checked against evidence.
- Load-bearing: passes — The paper’s conclusions depend on it.
- Based: passes — The paper gives a reason why it holds.
In the paper
“The possibility that alternative stable states (or bistability) may exist in a system has important implications, because the crossing of tipping points may be irreversible for the time scales that matter to societies10.”
§ Critical transitions in the Amazon forest system > Theory and concepts
What the sources say
- Not checked — no full text of the sourcecites [10] Scheffer, M., Carpenter, S., Foley, J. A., Folke, C. & Walker, B. Catastrophic shifts in ecosystems. Nature 413, 591–596 (2001). source
hedgedconditional- Asserted: passes — The authors put it forward as true.
- Checkable: passes — It can be checked against evidence.
- Load-bearing: passes — The paper’s conclusions depend on it.
- Based: passes — The paper gives a reason why it holds.
In the paper
“Within the remaining Amazon forest area, 17% has been degraded by human disturbances38, such as logging, edge effects and understory fires, but if we consider also the impacts from repeated extreme drought events in the past decades, 38% of the Amazon could be degraded39.”
§ Critical transitions in the Amazon forest system > Global change impacts on forest resilience > Disturbance regimes
What the sources say
- Not checked — no full text of the sourcecites [38] Bullock, E. L., Woodcock, C. E., Souza, C. Jr & Olofsson, P. Satellite-based estimates reveal widespread forest degradation in the Amazon. Global Change Biol. 26, 2956–2969 (2020). source
plaindirect- Asserted: passes — The authors put it forward as true.
- Checkable: passes — It can be checked against evidence.
- Load-bearing: unclear — It is unclear whether the paper’s conclusions depend on it.
- Based: passes — The paper gives a reason why it holds.
In the paper
“Depending on the processes involved, connectivity can either increase or decrease the risk of systemic transition17.”
§ Critical transitions in the Amazon forest system > Local versus systemic transition > Sources of connectivity
What the sources say
- Not checked — no full text of the sourcecites [17] Scheffer, M. et al. Anticipating critical transitions. Science 338, 344–348 (2012). source
plainconditional- Asserted: passes — The authors put it forward as true.
- Checkable: passes — It can be checked against evidence.
- Load-bearing: passes — The paper’s conclusions depend on it.
- Based: passes — The paper gives a reason why it holds.
A result the paper reports from its own data — it cites no other source for it, so there is none to check. The quote shows it is in the paper.
In the paper
“A single forest hectare in the central and northwestern Amazon can contain more than 300 tree species (Extended Data Fig. 7a).”
§ Critical transitions in the Amazon forest system > Global change impacts on forest resilience > Disturbance regimes
plain- Asserted: passes — The authors put it forward as true.
- Checkable: passes — It can be checked against evidence.
- Load-bearing: unclear — It is unclear whether the paper’s conclusions depend on it.
- Based: passes — The paper gives a reason why it holds.
In the paper
“Most CMIP6 models agree that a large-scale dieback of the Amazon is unlikely in response to global warming above pre-industrial levels2, but this ecosystem response is based on certain assumptions, such as a large CO2-fertilization effect53.”
§ Critical transitions in the Amazon forest system > Five critical drivers of water stress > Global warming
What the sources say
- Not checked yetcites [2] IPCC. Climate Change 2021: The Physical Science Basis (eds Masson-Delmotte, V. et al.) https://www.ipcc.ch/report/ar6/wg1/#FullReport (Cambridge Univ. Press, 2021).
plain- Asserted: passes — The authors put it forward as true.
- Checkable: passes — It can be checked against evidence.
- Load-bearing: passes — The paper’s conclusions depend on it.
- Based: passes — The paper gives a reason why it holds.
In the paper
“Connectivity across Amazonian landscapes and regions can contribute to synchronize forest dynamics, causing different forests to behave more similarly17.”
§ Critical transitions in the Amazon forest system > Local versus systemic transition > Sources of connectivity
What the sources say
- Not checked — no full text of the sourcecites [17] Scheffer, M. et al. Anticipating critical transitions. Science 338, 344–348 (2012). source
plaindirect- Asserted: passes — The authors put it forward as true.
- Checkable: passes — It can be checked against evidence.
- Load-bearing: passes — The paper’s conclusions depend on it.
- Based: passes — The paper gives a reason why it holds.
A conclusion the paper draws from its own results — it cites no other source for it, so there is none to check. The quote shows it is in the paper.
In the paper
“Moreover, as human disturbances intensify throughout the Amazon (Fig. 1), the spread of invasive grasses and fires can make the system increasingly homogeneous.”
§ Critical transitions in the Amazon forest system > Local versus systemic transition > Environmental heterogeneity
plainconditional- Asserted: passes — The authors put it forward as true.
- Checkable: passes — It can be checked against evidence.
- Load-bearing: unclear — It is unclear whether the paper’s conclusions depend on it.
- Based: unclear — It is unclear why the paper says it holds.
A conclusion the paper draws from its own results — it cites no other source for it, so there is none to check. The quote shows it is in the paper.
In the paper
“However, this scenario seems unlikely to occur in the near future (Fig. 1).”
§ Critical transitions in the Amazon forest system > Local versus systemic transition > Environmental heterogeneity
hedged- Asserted: passes — The authors put it forward as true.
- Checkable: passes — It can be checked against evidence.
- Load-bearing: unclear — It is unclear whether the paper’s conclusions depend on it.
- Based: unclear — It is unclear why the paper says it holds.
A conclusion the paper draws from its own results — it cites no other source for it, so there is none to check. The quote shows it is in the paper.
In the paper
“If these estimates, however, considered projections from CMIP6 models and their relatively broader areas of bistability (Extended Data Fig. 4), the proportion of the Amazon forest that could transition into a low tree cover state would be much larger.”
§ Critical transitions in the Amazon forest system > Global change impacts on forest resilience > Disturbance regimes
hedgedconditional- Asserted: passes — The authors put it forward as true.
- Checkable: passes — It can be checked against evidence.
- Load-bearing: unclear — It is unclear whether the paper’s conclusions depend on it.
- Based: passes — The paper gives a reason why it holds.
- Rests on an assumption: The additive sum of warming/drying slopes, ecosystem stability classes, drought impacts, road proximity, and governance can serve as a proxy for ecosystem transition potential.
A conclusion the paper draws from its own results — it cites no other source for it, so there is none to check. The quote shows it is in the paper.
In the paper
“Such tremendous tree species diversity can increase forest resilience by different mechanisms.”
§ Critical transitions in the Amazon forest system > Global change impacts on forest resilience > Disturbance regimes
plaindirect- Asserted: passes — The authors put it forward as true.
- Checkable: passes — It can be checked against evidence.
- Load-bearing: unclear — It is unclear whether the paper’s conclusions depend on it.
- Based: passes — The paper gives a reason why it holds.
The paper states this without a source or data behind it here, so there is nothing to check it against. The quote shows it is in the paper.
In the paper
“At the regional scale, a fundamental heterogeneity factor is rainfall and how it translates into water stress.”
§ Critical transitions in the Amazon forest system > Local versus systemic transition > Environmental heterogeneity
plaincorrelational- Asserted: passes — The authors put it forward as true.
- Checkable: passes — It can be checked against evidence.
- Load-bearing: passes — The paper’s conclusions depend on it.
- Based: passes — The paper gives a reason why it holds.
A conclusion the paper draws from its own results — it cites no other source for it, so there is none to check. The quote shows it is in the paper.
In the paper
“This international connectivity illustrates how policies related to deforestation, especially in the Brazilian Amazon, will affect the climate in other countries.”
§ Critical transitions in the Amazon forest system > Local versus systemic transition > Sources of connectivity
plaindirect- Asserted: passes — The authors put it forward as true.
- Checkable: passes — It can be checked against evidence.
- Load-bearing: passes — The paper’s conclusions depend on it.
- Based: passes — The paper gives a reason why it holds.
A conclusion the paper draws from its own results — it cites no other source for it, so there is none to check. The quote shows it is in the paper.
In the paper
“As bistable forests expand deeper into the system (Fig. 1b and Extended Data Fig. 4), the distribution of compounding disturbances may indicate where ecosystem transitions are more likely to occur in the coming decades (Fig. 1f).”
§ Critical transitions in the Amazon forest system > Global change impacts on forest resilience > Disturbance regimes
hedgedconditional- Asserted: passes — The authors put it forward as true.
- Checkable: passes — It can be checked against evidence.
- Load-bearing: passes — The paper’s conclusions depend on it.
- Based: passes — The paper gives a reason why it holds.
- Rests on an assumption: The additive sum of warming/drying slopes, ecosystem stability classes, drought impacts, road proximity, and governance can serve as a proxy for ecosystem transition potential.
In the paper
“Rare species provide ‘ecological redundancy’, increasing opportunities for replacement of lost functions when dominant species disappear109.”
§ Critical transitions in the Amazon forest system > Global change impacts on forest resilience > Disturbance regimes
What the sources say
- Not checked — no full text of the sourcecites [109] Walker, B., Kinzig, A. & Langridge, J. Plant attribute diversity, resilience, and ecosystem function: the nature and significance of dominant and minor species. Ecosystems 2, 95–113 (1999). source
plaindirect- Asserted: passes — The authors put it forward as true.
- Checkable: passes — It can be checked against evidence.
- Load-bearing: unclear — It is unclear whether the paper’s conclusions depend on it.
- Based: passes — The paper gives a reason why it holds.
A conclusion the paper draws from its own results — it cites no other source for it, so there is none to check. The quote shows it is in the paper.
In the paper
“Conceptual model showing how the five drivers may interact (arrows indicate positive effects) and how these interactions may strengthen a positive feedback between water stress and forest loss.”
§ Critical transitions in the Amazon forest system > Five critical drivers of water stress > Global warming
hedgedconditional- Asserted: passes — The authors put it forward as true.
- Checkable: passes — It can be checked against evidence.
- Load-bearing: passes — The paper’s conclusions depend on it.
- Based: passes — The paper gives a reason why it holds.
In the paper
“Palaeorecords from the northern Amazon98 show that burnt forests may spend centuries in a degraded open-canopy state before they eventually shift into a savanna.”
§ Critical transitions in the Amazon forest system > Three alternative ecosystem trajectories > Degraded open-canopy ecosystem
What the sources say
- Not checked — no full text of the sourcecites [98] Rull, V. A palynological record of a secondary succession after fire in the Gran Sabana, Venezuela. J. Quat. Sci. 14, 137–152 (1999). source
hedgedconditional- Asserted: passes — The authors put it forward as true.
- Checkable: passes — It can be checked against evidence.
- Load-bearing: unclear — It is unclear whether the paper’s conclusions depend on it.
- Based: passes — The paper gives a reason why it holds.
In the paper
“The intensification of these drivers may cause widespread tree mortality for instance because of extreme droughts and fires76.”
§ Critical transitions in the Amazon forest system > Five critical drivers of water stress > Global warming
What the sources say
- Not checked — no full text of the sourcecites [76] Brando, P. M. et al. Abrupt increases in Amazonian tree mortality due to drought-fire interactions. Proc. Natl Acad. Sci. USA 111, 6347–6352 (2014). source
hedgedconditional- Asserted: passes — The authors put it forward as true.
- Checkable: passes — It can be checked against evidence.
- Load-bearing: passes — The paper’s conclusions depend on it.
- Based: passes — The paper gives a reason why it holds.
In the paper
“Shifts from forest to white-sand savanna (Fig. 4) are probably stable (that is, the ecosystem is unlikely to recover back to forest within centuries), based on the relatively long persistence of these savannas in the landscape94.”
§ Critical transitions in the Amazon forest system > Three alternative ecosystem trajectories > White-sand savanna
What the sources say
- Not checked — no full text of the sourcecites [94] Adeney, J. M., Christensen, N. L., Vicentini, A. & Cohn‐Haft, M. White‐sand ecosystems in Amazonia. Biotropica 48, 7–23 (2016). source
hedged- Asserted: passes — The authors put it forward as true.
- Checkable: passes — It can be checked against evidence.
- Load-bearing: passes — The paper’s conclusions depend on it.
- Based: passes — The paper gives a reason why it holds.
A conclusion the paper draws from its own results — it cites no other source for it, so there is none to check. The quote shows it is in the paper.
In the paper
“At local scales, driver 5 (accumulated deforestation) intensifies with land use changes.”
§ Critical transitions in the Amazon forest system > Five critical drivers of water stress > Global warming
plaindirect- Asserted: passes — The authors put it forward as true.
- Checkable: passes — It can be checked against evidence.
- Load-bearing: unclear — It is unclear whether the paper’s conclusions depend on it.
- Based: unclear — It is unclear why the paper says it holds.
A conclusion the paper draws from its own results — it cites no other source for it, so there is none to check. The quote shows it is in the paper.
In the paper
“Drivers 2 to 4 (regional rainfall conditions) intensify in response to drivers 1 and 5.”
§ Critical transitions in the Amazon forest system > Five critical drivers of water stress > Global warming
plaindirect- Asserted: passes — The authors put it forward as true.
- Checkable: passes — It can be checked against evidence.
- Load-bearing: passes — The paper’s conclusions depend on it.
- Based: unclear — It is unclear why the paper says it holds.
A conclusion the paper draws from its own results — it cites no other source for it, so there is none to check. The quote shows it is in the paper.
In the paper
“Five critical drivers of water stress on Amazonian forests affect (directly or indirectly) the underlying tipping point of the system.”
§ Critical transitions in the Amazon forest system > Five critical drivers of water stress > Global warming
plaindirect- Asserted: passes — The authors put it forward as true.
- Checkable: passes — It can be checked against evidence.
- Load-bearing: passes — The paper’s conclusions depend on it.
- Based: passes — The paper gives a reason why it holds.
In the paper
“Satellite observations of tree cover distributions across tropical South America suggest a critical threshold at 7 months of dry season length79 (DSL).”
§ Critical transitions in the Amazon forest system > Five critical drivers of water stress > Dry season length
What the sources say
- Not checked — no full text of the sourcecites [79] Staver, A. C., Archibald, S. & Levin, S. A. The global extent and determinants of savanna and forest as alternative biome states. Science 334, 230–232 (2011). source
hedgedcorrelational- Asserted: passes — The authors put it forward as true.
- Checkable: passes — It can be checked against evidence.
- Load-bearing: passes — The paper’s conclusions depend on it.
- Based: passes — The paper gives a reason why it holds.
In the paper
“The southeastern region has already turned into a source of greenhouse gases to the atmosphere48.”
§ Critical transitions in the Amazon forest system > Implications for governance
What the sources say
- Not checked — no full text of the sourcecites [48] Gatti, L. V. et al. Amazonia as a carbon source linked to deforestation and climate change. Nature 595, 388–393 (2021). source
plain- Asserted: passes — The authors put it forward as true.
- Checkable: passes — It can be checked against evidence.
- Load-bearing: unclear — It is unclear whether the paper’s conclusions depend on it.
- Based: passes — The paper gives a reason why it holds.
In the paper
“Recent policy and approaches to Amazon development, however, accelerated deforestation that reached 13,000 km2 in the Brazilian Amazon in 2021 (http://terrabrasilis.dpi.inpe.br).”
§ Critical transitions in the Amazon forest system > Implications for governance
What the sources say
- Not matchedcites http://terrabrasilis.dpi.inpe.br
Couldn’t be matched to a paper in Crossref, so it can’t be checked.
plaindirect- Asserted: passes — The authors put it forward as true.
- Checkable: passes — It can be checked against evidence.
- Load-bearing: unclear — It is unclear whether the paper’s conclusions depend on it.
- Based: passes — The paper gives a reason why it holds.
- Not matched
- It may state two separate claims as one. 85
- Probably not a substantial claim. 18
Some cited sources support this claim and some don’t — read each source’s verdict below.
In the paper
“Drought regimes are intensifying across the region41, possibly due to deforestation42 that continues to expand within the system (Extended Data Fig. 5).”
§ Critical transitions in the Amazon forest system > Global change impacts on forest resilience > Disturbance regimes
What the sources say
- Disputedcites [41] Anderson, L. O. et al. Vulnerability of Amazonian forests to repeated droughts. Phil. Trans. R. Soc. B 373, 20170411 (2018). sourceExperimental — accuracy not yet measured
The Discussion (section 4(a)) says increasing dry and very dry events appear to be occurring in southern Amazonia, but explicitly says the proposed broader trend toward more frequent and intense droughts is not supported by its observed long-term patterns in other regions. The Conclusion (section 5) likewise reports wetter conditions in some regions and no increase in drought intensity or duration in central areas. Citation 41 is attached to the region-wide drought claim, not the separate deforestation claim attached to citation 42. (LLM, conf=0.86)
Checked by a reasoning model — may be wrong.
- Supportedcites [42] Staal, A. et al. Feedback between drought and deforestation in the Amazon. Environ. Res. Lett. 15, 044024 (2020). source
Citation 42 is attached to the suggestion that deforestation may contribute to intensifying drought, not to the broader trend or continued expansion of deforestation. The Results report that deforestation made Amazon dry seasons more intense in the early 21st century, accounting for about 3.8% of the average drying, especially in the southwest. (LLM, conf=0.93)
hedgedconditional- Asserted: passes — The authors put it forward as true.
- Checkable: passes — It can be checked against evidence.
- Load-bearing: unclear — It is unclear whether the paper’s conclusions depend on it.
- Based: passes — The paper gives a reason why it holds.
It may state two separate claims as one.
- Disputed
At least one cited source doesn’t support this claim or points to a different paper, and none confirmed it — see the verdicts below.
In the paper
“Beyond 20% deforestation, forest mortality accelerated, causing large reductions in regional rainfall and consequently an ecosystem transition of 50−60% of the Amazon, depending on the emissions scenario.”
§ Critical transitions in the Amazon forest system > Five critical drivers of water stress > Accumulated deforestation
What the sources say
- Disputedcites [81] Nobre, C. A. et al. Land-use and climate change risks in the Amazon and the need of a novel sustainable development paradigm. Proc. Natl Acad. Sci. USA 113, 10759–10768 (2016). sourceExperimental — accuracy not yet measured
In “Climate Change: Global and Regional Perspectives” (page unavailable), the paper places a proposed forest-loss tipping point at 40% deforestation and says regional precipitation is expected to decrease beyond around 30%, not 20%. In “Impacts of Anthropogenic Drivers of Change in the Amazon” (page unavailable), it projects over 60% forest-area reduction by 2050 under combined climate, deforestation, and fire effects; it does not describe accelerated mortality beyond 20% deforestation causing a 50–60% transition. (LLM, conf=0.88)
Checked by a reasoning model — may be wrong.
plaindirect- Asserted: passes — The authors put it forward as true.
- Checkable: passes — It can be checked against evidence.
- Load-bearing: passes — The paper’s conclusions depend on it.
- Based: passes — The paper gives a reason why it holds.
It may state two separate claims as one.
- Disputed
The cited sources support only part of this claim — read each source’s verdict below.
In the paper
“Past drier climatic conditions were therefore very different from the current climatic conditions, in which observed warming trends may exacerbate drought impacts on the forest by exposing trees to unprecedented levels of water stress31,32.”
§ Critical transitions in the Amazon forest system > Past dynamics
What the sources say
- Partly supportedcites [31] Marengo, J. A., Jimenez, J. C., Espinoza, J.-C., Cunha, A. P. & Aragão, L. E. O. Increased climate pressure on the agricultural frontier in the Eastern Amazonia–Cerrado transition zone. Sci. Rep. 12, 457 (2022). sourceExperimental — accuracy not yet measured
The Results (Drought and land cover changes) report that recent warming and drying suggest increasing water stress on vegetation in the eastern Amazonia–Cerrado transition zone. The paper does not establish that past drier climates were very different from current conditions or that trees face unprecedented levels of water stress. (LLM, conf=0.85)
- Partly supportedcites [32] Tavares, J. V. et al. Basin-wide variation in tree hydraulic safety margins predicts the carbon balance of Amazon forests. Nature 617, 111–117 (2023). sourceExperimental — accuracy not yet measured
The Main section says rising temperatures are likely to intensify water stress in Amazonian forests, and Implications and conclusions says higher temperatures and vapour pressure deficit will probably reduce trees’ hydraulic safety margins. The paper does not establish that past drier conditions were very different from current conditions or that trees will face unprecedented levels of water stress. Page numbers are unavailable in our copy. (LLM, conf=0.85)
hedgedconditional- Asserted: passes — The authors put it forward as true.
- Checkable: passes — It can be checked against evidence.
- Load-bearing: passes — The paper’s conclusions depend on it.
- Based: passes — The paper gives a reason why it holds.
It may state two separate claims as one.
- Partly supported
Every source the paper cites for this claim was checked and supports it.
In the paper
“Increasing rainfall variability is causing extreme drought events to become more widespread and frequent across the Amazon (Fig. 1c), together with extreme wet events and convective storms that result in more windthrow disturbances40.”
§ Critical transitions in the Amazon forest system > Global change impacts on forest resilience > Disturbance regimes
What the sources say
- Supportedcites [40] Feng, Y., Negrón-Juárez, R. I., Romps, D. M. & Chambers, J. Q. Amazon windthrow disturbances are likely to increase with storm frequency under global warming. Nat. Commun. 14, 101 (2023). source
The citation is attached to the claim about wet events and convective storms producing windthrow, rather than the preceding drought claim, which points to the citing paper’s Fig. 1c. The Introduction says severe winds and heavy rainfall associated with storms cause widespread Amazon windthrows; the Results project more storm-favorable conditions and windthrow events. (LLM, conf=0.88)
plaindirect- Asserted: passes — The authors put it forward as true.
- Checkable: passes — It can be checked against evidence.
- Load-bearing: unclear — It is unclear whether the paper’s conclusions depend on it.
- Based: passes — The paper gives a reason why it holds.
It may state two separate claims as one.
- Supported
The cited sources support only part of this claim — read each source’s verdict below.
In the paper
“Maximum temperatures during the dry season follow a similar trend, rising across most of the biome (Extended Data Fig. 2), exposing the forest34 and local peoples35 to potentially unbearable heat.”
§ Critical transitions in the Amazon forest system > Global change impacts on forest resilience > Regional climatic conditions
What the sources say
- Supportedcites [34] Doughty, C. E. et al. Tropical forests are approaching critical temperature thresholds. Nature 621, 105–111 (2023). source
The citation to this paper is attached to “the forest,” not “local peoples.” The Introduction says rising temperatures may expose tropical leaves to damaging heat, and the Discussion reports leaf damage after temperatures exceeded a critical threshold. The biome-wide trend is attributed to the citing document’s own figure. (LLM, conf=0.90)
- Partly supportedcites [35] Xu, C., Kohler, T. A., Lenton, T. M., Svenning, J.-C. & Scheffer, M. Future of the human climate niche. Proc. Natl Acad. Sci. USA 117, 11350–11355 (2020). sourceExperimental — accuracy not yet measured
In Results > Projected Change (page not provided), the paper projects that billions of people could be exposed to extremely hot mean annual temperatures. This supports the concern for people, but it does not establish that dry-season maximum temperatures across the cited biome will expose local peoples to potentially unbearable heat. (LLM, conf=0.84)
plaindirect- Asserted: passes — The authors put it forward as true.
- Checkable: passes — It can be checked against evidence.
- Load-bearing: unclear — It is unclear whether the paper’s conclusions depend on it.
- Based: passes — The paper gives a reason why it holds.
It may state two separate claims as one.
- Supported
None of the sources cited for this claim have been checked yet.
In the paper
“The forest contributes up to 50% of rainfall in the region and is crucial for moisture supply across South America4, allowing other biomes and economic activities to thrive in regions that would otherwise be more arid, such as the Pantanal wetlands and the La Plata river basin1.”
§ Critical transitions in the Amazon forest system > Main
What the sources say
- Could not verifycites [4] Staal, A. et al. Forest-rainfall cascades buffer against drought across the Amazon. Nat. Clim. Change 8, 539–543 (2018). sourceExperimental — accuracy not yet measured
The supplied passages are bibliographic metadata, and searches for “50% of rainfall,” “moisture supply,” and rainfall recycling did not surface a substantive passage from the paper’s body. Our accessible copy therefore cannot verify the 50% figure or the claim about moisture supply across South America. (LLM, conf=0.70)
- Not checked yetcites [1] Science Panel for the Amazon. Amazon Assessment Report 2021 (2021); www.theamazonwewant.org/amazon-assessment-report-2021/.
plaindirect- Asserted: passes — The authors put it forward as true.
- Checkable: passes — It can be checked against evidence.
- Load-bearing: unclear — It is unclear whether the paper’s conclusions depend on it.
- Based: passes — The paper gives a reason why it holds.
It may state two separate claims as one.
- Could not verify
The cited sources support only part of this claim — read each source’s verdict below.
In the paper
“Throughout the core of the Amazon forest biome, patches of white-sand savanna also expanded in the past 20,000–7,000 years, driven by sediment deposition along ancient rivers26, and more recently (around 800 years ago) owing to Indigenous fires27.”
§ Critical transitions in the Amazon forest system > Past dynamics
What the sources say
- Partly supportedcites [26] Rossetti, D. F. et al. Unfolding long-term Late Pleistocene-Holocene disturbances of forest communities in the southwestern Amazonian lowlands. Ecosphere 9, e02457 (2018). sourceExperimental — accuracy not yet measured
The History of vegetation and time of the present-day forests section reports evidence of broader savanna areas at different times between about 20,000 and 7,578 years ago. The Potential driver section links vegetation changes in the southwestern Amazonian study area to sedimentation and ancient river channels. Citation 26 attaches to that earlier expansion, not to the later Indigenous-fire claim. The paper does not establish expansion throughout the Amazon biome or identify all those past savannas as white-sand savanna. (LLM, conf=0.86)
- Not checked — no full text of the sourcecites [27] Prance, G. T. & Schubart, H. O. R. Notes on the vegetation of Amazonia I. A preliminary note on the origin of the open white sand campinas of the lower Rio Negro. Brittonia 30, 60 (1978). source
plaindirect- Asserted: passes — The authors put it forward as true.
- Checkable: passes — It can be checked against evidence.
- Load-bearing: unclear — It is unclear whether the paper’s conclusions depend on it.
- Based: passes — The paper gives a reason why it holds.
It may state two separate claims as one.
- Partly supported
The cited sources support only part of this claim — read each source’s verdict below.
In the paper
“The difference between both ensembles is possibly related to the forest–rainfall feedback included in the five coupled models, which increases total annual rainfall and therefore the stable forest area along the southern Amazon, but only when deforestation is not included in the simulations4,37.”
§ Critical transitions in the Amazon forest system > Global change impacts on forest resilience > Regional climatic conditions
What the sources say
- Could not verifycites [4] Staal, A. et al. Forest-rainfall cascades buffer against drought across the Amazon. Nat. Clim. Change 8, 539–543 (2018). sourceExperimental — accuracy not yet measured
Split into 2 atoms — 0 confirmed, 0 partially supported, 0 disputed, 0 misattributed, 2 unverifiable. Expand the claim to see per-atom verdicts.
- Partly supportedcites [37] Zemp, D. C. et al. Self-amplified Amazon forest loss due to vegetation-atmosphere feedbacks. Nat. Commun. 8, 14681 (2017). sourceExperimental — accuracy not yet measured
Split into 2 atoms — 0 confirmed, 2 partially supported, 0 disputed, 0 misattributed, 0 unverifiable. Expand the claim to see per-atom verdicts.
hedgeddirect- Asserted: passes — The authors put it forward as true.
- Checkable: passes — It can be checked against evidence.
- Load-bearing: unclear — It is unclear whether the paper’s conclusions depend on it.
- Based: passes — The paper gives a reason why it holds.
It may state two separate claims as one.
- Could not verify
The cited sources support only part of this claim — read each source’s verdict below.
In the paper
“These impacts would also involve irreversible loss of biodiversity, socioeconomic and cultural values1,7–9.”
§ Critical transitions in the Amazon forest system > Main
What the sources say
- Not checked yetcites [1] Science Panel for the Amazon. Amazon Assessment Report 2021 (2021); www.theamazonwewant.org/amazon-assessment-report-2021/.
- Partly supportedcites [7] Bromham, L. et al. Global predictors of language endangerment and the future of linguistic diversity. Nat. Ecol. Evol. 6, 163–173 (2022). sourceExperimental — accuracy not yet measured
The Main section says biodiversity is under threat, and ‘Safeguarding language diversity’ warns that language loss could erase unique expressions of human cultural diversity. The paper does not say these impacts would irreversibly destroy biodiversity or socioeconomic values; it discusses socioeconomic change chiefly as a factor in language loss. The cited passages have no page numbers in our copy. (LLM, conf=0.78)
- Not checked — no full text of the sourcecites [8] Gomes, V. H. F., Vieira, I. C. G., Salomão, R. P. & ter Steege, H. Amazonian tree species threatened by deforestation and climate change. Nat. Clim. Change 9, 547–553 (2019). source
- Partly supportedcites [9] Cámara-Leret, R., Fortuna, M. A. & Bascompte, J. Indigenous knowledge networks in the face of global change. Proc. Natl Acad. Sci. USA 116, 9913–9918 (2019). sourceExperimental — accuracy not yet measured
The Abstract reports that the combined loss of plant species and cultural knowledge erodes indigenous knowledge networks, and that lost knowledge may jeopardize livelihoods. It does not establish that the resulting losses of biodiversity, socioeconomic values, and cultural values are all irreversible. (LLM, conf=0.84)
hedgeddirect- Asserted: passes — The authors put it forward as true.
- Checkable: passes — It can be checked against evidence.
- Load-bearing: passes — The paper’s conclusions depend on it.
- Based: passes — The paper gives a reason why it holds.
It may state two separate claims as one.
Every source the paper cites for this claim was checked and supports it.
In the paper
“Past drought periods were usually associated with much lower atmospheric CO2 concentrations, which may have reduced water-use efficiency of trees29 (that is, trees assimilated less carbon during transpiration).”
§ Critical transitions in the Amazon forest system > Past dynamics
What the sources say
- Supportedcites [29] van der Sleen, P. et al. No growth stimulation of tropical trees by 150 years of CO2 fertilization but water-use efficiency increased. Nat. Geosci. 8, 24–28 (2015). source
The main text (indexed as Abstract; page unavailable) reports that atmospheric CO2 rose over the past 150 years while trees’ intrinsic water-use efficiency increased by 30–35%. It also says that higher CO2 can enhance water-use efficiency during drought, supporting the cautious inference that trees facing earlier droughts at lower CO2 may have had lower water-use efficiency. (LLM, conf=0.87)
hedgedconditional- Asserted: passes — The authors put it forward as true.
- Checkable: passes — It can be checked against evidence.
- Load-bearing: unclear — It is unclear whether the paper’s conclusions depend on it.
- Based: passes — The paper gives a reason why it holds.
It may state two separate claims as one.
- Supported
The cited sources that could be checked couldn’t confirm or dispute this claim.
In the paper
“However, these periods also coincided with cooler temperatures20,21, which probably reduced water demand by trees30.”
§ Critical transitions in the Amazon forest system > Past dynamics
What the sources say
- Not checked — no full text of the sourcecites [20] Wang, X. et al. Hydroclimate changes across the Amazon lowlands over the past 45,000 years. Nature 541, 204–207 (2017). source
- Could not verifycites [21] Kukla, T. et al. The resilience of Amazon tree cover to past and present drying. Global Planet. Change 202, 103520 (2021). sourceExperimental — accuracy not yet measured
Citation 30 is attached to the suggestion that cooler temperatures reduced trees’ water demand; the preceding citations support the timing of cooler temperatures. The Introduction discusses mid-Holocene drying and tree-cover resilience, but the passages retrieved for cooler temperatures, water demand, and evapotranspiration do not address that proposed effect. (LLM, conf=0.72)
- Could not verifycites [30] Smith, M. N. et al. Empirical evidence for resilience of tropical forest photosynthesis in a warmer world. Nat. Plants 6, 1225–1230 (2020). sourceExperimental — accuracy not yet measured
The available indexed passage contains only the paper’s title and bibliographic details, with no section or page text addressing this claim. Searches for cooler temperatures during drought and reduced tree water demand found no relevant passage, so our copy cannot verify what the citation attributes to this source. (LLM, conf=0.70)
hedgedconditional- Asserted: passes — The authors put it forward as true.
- Checkable: passes — It can be checked against evidence.
- Load-bearing: unclear — It is unclear whether the paper’s conclusions depend on it.
- Based: passes — The paper gives a reason why it holds.
It may state two separate claims as one.
Every source the paper cites for this claim was checked and supports it.
In the paper
“Since the early 1980s, rainfall conditions have also changed31. Peripheral and central parts of the Amazon forest are drying significantly, such as in the southern Bolivian Amazon, where annual rainfall reduced by up to 20 mm yr−1 (Extended Data Fig. 3a).”
§ Critical transitions in the Amazon forest system > Global change impacts on forest resilience > Regional climatic conditions
What the sources say
- Supportedcites [31] Marengo, J. A., Jimenez, J. C., Espinoza, J.-C., Cunha, A. P. & Aragão, L. E. O. Increased climate pressure on the agricultural frontier in the Eastern Amazonia–Cerrado transition zone. Sci. Rep. 12, 457 (2022). source
Citation 31 is attached to the statement that rainfall conditions have changed since the early 1980s. The Results section ('Regional scale trends over the MATOPIBA') reports systematic rainfall reductions over 1981–2020 and refers to decreases in rainfall since 1980. The southern Bolivian Amazon figure appears in the following sentence, which points instead to the citing paper’s Extended Data Fig. 3a. (LLM, conf=0.91)
plaindirect- Asserted: passes — The authors put it forward as true.
- Checkable: passes — It can be checked against evidence.
- Load-bearing: passes — The paper’s conclusions depend on it.
- Based: passes — The paper gives a reason why it holds.
It may state two separate claims as one.
- Supported
The cited sources support only part of this claim — read each source’s verdict below.
In the paper
“Although palaeorecords suggest that a large-scale Amazon forest collapse did not occur within the past 65 million years19, they indicate that savannas expanded locally, particularly in the more seasonal peripheral regions when fires ignited by humans were frequent23,24.”
§ Critical transitions in the Amazon forest system > Past dynamics
What the sources say
- Partly supportedcites [19] Hoorn, C. et al. Amazonia through time: Andean uplift, climate change, landscape evolution, and biodiversity. Science 330, 927–931 (2010). sourceExperimental — accuracy not yet measured
Split into 2 atoms — 0 confirmed, 1 partially supported, 0 disputed, 0 misattributed, 1 unverifiable. Expand the claim to see per-atom verdicts.
- Partly supportedcites [23] Mayle, F. E. & Power, M. J. Impact of a drier Early–Mid-Holocene climate upon Amazonian forests. Phil. Trans. R. Soc. B 363, 1829–1838 (2008). sourceExperimental — accuracy not yet measured
Split into 2 atoms — 0 confirmed, 2 partially supported, 0 disputed, 0 misattributed, 0 unverifiable. Expand the claim to see per-atom verdicts.
- Could not verifycites [24] Montoya, E. & Rull, V. Gran Sabana fires (SE Venezuela): a paleoecological perspective. Quat. Sci. Rev. 30, 3430–3444 (2011). sourceExperimental — accuracy not yet measured
Split into 2 atoms — 0 confirmed, 0 partially supported, 0 disputed, 0 misattributed, 2 unverifiable. Expand the claim to see per-atom verdicts.
hedgedcorrelational- Asserted: passes — The authors put it forward as true.
- Checkable: passes — It can be checked against evidence.
- Load-bearing: unclear — It is unclear whether the paper’s conclusions depend on it.
- Based: passes — The paper gives a reason why it holds.
It may state two separate claims as one.
- Partly supported
The cited sources support only part of this claim — read each source’s verdict below.
In the paper
“Satellite observations of climatic variability31 confirm model projections2, showing that since the early 1980s, the Amazonian region has been warming significantly at an average rate of 0.27 °C per decade during the dry season, with the highest rates of up to 0.6 °C per decade in the centre and southeast of the biome (Fig. 1a).”
§ Critical transitions in the Amazon forest system > Global change impacts on forest resilience > Regional climatic conditions
What the sources say
- Partly supportedcites [31] Marengo, J. A., Jimenez, J. C., Espinoza, J.-C., Cunha, A. P. & Aragão, L. E. O. Increased climate pressure on the agricultural frontier in the Eastern Amazonia–Cerrado transition zone. Sci. Rep. 12, 457 (2022). sourceExperimental — accuracy not yet measured
Split into 2 atoms — 0 confirmed, 2 partially supported, 0 disputed, 0 misattributed, 0 unverifiable. Expand the claim to see per-atom verdicts.
- Not checked yetcites [2] IPCC. Climate Change 2021: The Physical Science Basis (eds Masson-Delmotte, V. et al.) https://www.ipcc.ch/report/ar6/wg1/#FullReport (Cambridge Univ. Press, 2021).
plaincorrelational- Asserted: passes — The authors put it forward as true.
- Checkable: passes — It can be checked against evidence.
- Load-bearing: unclear — It is unclear whether the paper’s conclusions depend on it.
- Based: passes — The paper gives a reason why it holds.
It may state two separate claims as one.
- Partly supported
Every source the paper cites for this claim was checked and supports it.
In the paper
“Rising temperatures will increase thermal stress, potentially reducing forest productivity and carbon storage capacity36 and causing widespread leaf damage34.”
§ Critical transitions in the Amazon forest system > Global change impacts on forest resilience > Regional climatic conditions
What the sources say
- Supportedcites [36] Sullivan, M. J. P. et al. Long-term thermal sensitivity of Earth’s tropical forests. Science 368, 869–874 (2020). source
The main text (p. 13) states that warming reduces tropical forest carbon stocks and gains from woody productivity. Table S1 (p. 54) describes heat-related stress mechanisms. Widespread leaf damage is attached to citation 34, not this source, and is not part of this verdict. (LLM, conf=0.92)
- Supportedcites [34] Doughty, C. E. et al. Tropical forests are approaching critical temperature thresholds. Nature 621, 105–111 (2023). source
Citation 34 is attached to the leaf-damage claim, not the productivity and carbon-storage claim. The Discussion reports leaf damage after experimentally warmed leaves exceeded a critical temperature, and the modelling section says further warming could lead to the death of all leaves under its assumptions. This supports widespread leaf damage as a potential outcome, not a certainty. (LLM, conf=0.88)
hedgedconditional- Asserted: passes — The authors put it forward as true.
- Checkable: passes — It can be checked against evidence.
- Load-bearing: passes — The paper’s conclusions depend on it.
- Based: passes — The paper gives a reason why it holds.
It may state two separate claims as one.
- Supported
The cited sources support only part of this claim — read each source’s verdict below.
In the paper
“Large parts of the Amazon forest, however, are projected to experience mass mortality events due to climatic and land use-related disturbances in the coming decades5,6, potentially accelerating climate change through carbon emissions and feedbacks with the climate system2,3.”
§ Critical transitions in the Amazon forest system > Main
What the sources say
- Partly supportedcites [5] Cano, I. M. et al. Abrupt loss and uncertain recovery from fires of Amazon forests under low climate mitigation scenarios. Proc. Natl Acad. Sci. USA 119, e2203200119 (2022). sourceExperimental — accuracy not yet measured
Split into 2 atoms — 0 confirmed, 2 partially supported, 0 disputed, 0 misattributed, 0 unverifiable. Expand the claim to see per-atom verdicts.
- Partly supportedcites [6] Parry, I. M., Ritchie, P. D. L. & Cox, P. M. Evidence of localised Amazon rainforest dieback in CMIP6 models. Earth Syst. Dynam. 13, 1667–1675 (2022). sourceExperimental — accuracy not yet measured
Split into 2 atoms — 1 confirmed, 1 partially supported, 0 disputed, 0 misattributed, 0 unverifiable. Expand the claim to see per-atom verdicts.
- Not checked yetcites [2] IPCC. Climate Change 2021: The Physical Science Basis (eds Masson-Delmotte, V. et al.) https://www.ipcc.ch/report/ar6/wg1/#FullReport (Cambridge Univ. Press, 2021).
- Not checked — no full text of the sourcecites [3] Armstrong McKay, D. et al. Exceeding 1.5 °C global warming could trigger multiple climate tipping points. Science 377, abn7950 (2022). source
hedgedconditional- Asserted: passes — The authors put it forward as true.
- Checkable: passes — It can be checked against evidence.
- Load-bearing: passes — The paper’s conclusions depend on it.
- Based: passes — The paper gives a reason why it holds.
It may state two separate claims as one.
- Partly supported
The cited sources support only part of this claim — read each source’s verdict below.
In the paper
“Nonetheless, savannas expanded in peripheral parts of the southern Amazon basin during the LGM and mid-Holocene23, as well as in the northeastern Amazon during the early Holocene (around 11,000 years ago), probably influenced by drier climatic conditions and fires ignited by humans24,25.”
§ Critical transitions in the Amazon forest system > Past dynamics
What the sources say
- Partly supportedcites [23] Mayle, F. E. & Power, M. J. Impact of a drier Early–Mid-Holocene climate upon Amazonian forests. Phil. Trans. R. Soc. B 363, 1829–1838 (2008). sourceExperimental — accuracy not yet measured
Split into 2 atoms — 0 confirmed, 2 partially supported, 0 disputed, 0 misattributed, 0 unverifiable. Expand the claim to see per-atom verdicts.
- Partly supportedcites [24] Montoya, E. & Rull, V. Gran Sabana fires (SE Venezuela): a paleoecological perspective. Quat. Sci. Rev. 30, 3430–3444 (2011). sourceExperimental — accuracy not yet measured
Split into 2 atoms — 0 confirmed, 1 partially supported, 0 disputed, 0 misattributed, 1 unverifiable. Expand the claim to see per-atom verdicts.
- Not checked — no full text of the sourcecites [25] Rull, V., Montoya, E., Vegas-Vilarrúbia, T. & Ballesteros, T. New insights on palaeofires and savannisation in northern South America. Quat. Sci. Rev. 122, 158–165 (2015). source
hedgedconditional- Asserted: passes — The authors put it forward as true.
- Checkable: passes — It can be checked against evidence.
- Load-bearing: unclear — It is unclear whether the paper’s conclusions depend on it.
- Based: passes — The paper gives a reason why it holds.
It may state two separate claims as one.
- Partly supported
Every source the paper cites for this claim was checked and supports it.
In the paper
“Satellite observations from across the Amazon suggest that forest resilience has been decreasing since the early 2000s33, possibly as a result of global changes.”
§ Critical transitions in the Amazon forest system > Global change impacts on forest resilience
What the sources say
- Supportedcites [33] Boulton, C. A., Lenton, T. M. & Boers, N. Pronounced loss of Amazon rainforest resilience since the early 2000s. Nat. Clim. Change 12, 271–278 (2022). source
The opening summary reports that remotely sensed vegetation data show resilience loss in more than three-quarters of the Amazon rainforest since the early 2000s. The Discussion suggests that drier conditions and increasing human land use probably contributed, consistent with the claim’s tentative explanation. Page numbers are not supplied in our copy. (LLM, conf=0.92)
hedgedconditional- Asserted: passes — The authors put it forward as true.
- Checkable: passes — It can be checked against evidence.
- Load-bearing: passes — The paper’s conclusions depend on it.
- Based: passes — The paper gives a reason why it holds.
It may state two separate claims as one.
- Supported
The sources with a verdict support this claim; the rest weren’t checked yet, have no full text we could read, or their verdicts aren’t rated yet.
In the paper
“As a result, new fire regimes are burning larger forest areas43, emitting more carbon to the atmosphere44 and forcing IPLCs to readapt45.”
§ Critical transitions in the Amazon forest system > Global change impacts on forest resilience > Disturbance regimes
What the sources say
- Not checked — no full text of the sourcecites [43] Alencar, A. A., Brando, P. M., Asner, G. P. & Putz, F. E. Landscape fragmentation, severe drought, and the new Amazon forest fire regime. Ecol. Appl. 25, 1493–1505 (2015). source
- Supportedcites [44] Aragão, L. E. O. C. et al. 21st century drought-related fires counteract the decline of Amazon deforestation carbon emissions. Nat. Commun. 9, 536 (2018). source
The Introduction reports that fire-associated carbon emissions increased during drought years despite falling deforestation emissions. It states that gross carbon emissions from fires in 2010 were 1.7 times those in the subsequent non-drought year. This supports the carbon-emissions clause attached to citation 44; the forest-area and IPLC clauses have separate citations. (LLM, conf=0.90)
- Supportedcites [45] Silvério, D. V. et al. Intensification of fire regimes and forest loss in the Território Indígena do Xingu. Environ. Res. Lett. 17, 045012 (2022). source
Citation 43 is attached to the claim that new fire regimes are burning larger forest areas, not to the separate carbon-emissions or readaptation claims. The Introduction describes intensified fire regimes allowing wildfires to spread over vast areas, and the Discussion reports that over 350,000 hectares of forest in the Território Indígena do Xingu burned more than once. Page numbers are unavailable in our copy. (LLM, conf=0.87)
plaindirect- Asserted: passes — The authors put it forward as true.
- Checkable: passes — It can be checked against evidence.
- Load-bearing: unclear — It is unclear whether the paper’s conclusions depend on it.
- Based: passes — The paper gives a reason why it holds.
It may state two separate claims as one.
The cited sources support only part of this claim — read each source’s verdict below.
In the paper
“Amazonian forests are heterogeneous in their resilience to disturbances, which may have contributed to buffering large-scale transitions in the past37,61,62.”
§ Critical transitions in the Amazon forest system > Local versus systemic transition > Environmental heterogeneity
What the sources say
- Supportedcites [37] Zemp, D. C. et al. Self-amplified Amazon forest loss due to vegetation-atmosphere feedbacks. Nat. Commun. 8, 14681 (2017). source
The Results (‘Effect of heterogeneity’; page unavailable) report that variation in forest resilience thresholds reduces high-order cascades and usually stops the propagation of forest loss early. The Discussion (page unavailable) models conditions comparable to the Last Glacial Maximum and finds that self-amplified forest loss did not affect western Amazonia. Together, these passages support the hedged suggestion that heterogeneous resilience may have buffered large-scale transitions in the past. (LLM, conf=0.85)
- Partly supportedcites [61] Longo, M. et al. Ecosystem heterogeneity and diversity mitigate Amazon forest resilience to frequent extreme droughts. New Phytol. 219, 914–931 (2018). sourceExperimental — accuracy not yet measured
The Regional patterns of vulnerability section describes differences in drought resilience across Amazonian regions, and the Impacts of climate variability section says canopy reorganization can make responses to climate change more gradual. These passages support heterogeneous resilience and a possible buffering mechanism, but they do not establish that it buffered large-scale transitions in the past. (LLM, conf=0.83)
- Partly supportedcites [62] Levine, N. M. et al. Ecosystem heterogeneity determines the ecological resilience of the Amazon to climate change. Proc. Natl Acad. Sci. USA 113, 793–797 (2016). sourceExperimental — accuracy not yet measured
The Significance section describes heterogeneous responses to a drying climate and says forest reorganization can buffer against drastic threshold changes in vegetation state. It discusses predicted future changes, however, not evidence that heterogeneity buffered large-scale transitions in the past; its analysis also focuses on climate-related water stress rather than disturbances generally. Page numbers were not provided in our copy. (LLM, conf=0.86)
hedgedconditional- Asserted: passes — The authors put it forward as true.
- Checkable: passes — It can be checked against evidence.
- Load-bearing: passes — The paper’s conclusions depend on it.
- Based: passes — The paper gives a reason why it holds.
It may state two separate claims as one.
- Supported
The cited sources support only part of this claim — read each source’s verdict below.
In the paper
“As a result of low exposure to water deficit, most northwestern forests have trees with low drought resistance and could suffer massive mortality if suddenly exposed to severe water stress32.”
§ Critical transitions in the Amazon forest system > Local versus systemic transition > Environmental heterogeneity
What the sources say
- Partly supportedcites [32] Tavares, J. V. et al. Basin-wide variation in tree hydraulic safety margins predicts the carbon balance of Amazon forests. Nature 617, 111–117 (2023). sourceExperimental — accuracy not yet measured
The Hydraulic traits distribution section reports that ever-wet forests, which have little drought exposure, have the least embolism-resistant xylem. It also says they face the lowest apparent risk of hydraulic failure under observed conditions. The paper does not establish that most northwestern forests would suffer massive mortality if suddenly exposed to severe water stress. (LLM, conf=0.85)
hedgeddirect- Asserted: passes — The authors put it forward as true.
- Checkable: passes — It can be checked against evidence.
- Load-bearing: unclear — It is unclear whether the paper’s conclusions depend on it.
- Based: passes — The paper gives a reason why it holds.
It may state two separate claims as one.
- Partly supported
The cited sources support only part of this claim — read each source’s verdict below.
In the paper
“Smaller areas with high transition potential were found scattered within deforestation frontiers, where most forests have been carved by roads50,51.”
§ Critical transitions in the Amazon forest system > Global change impacts on forest resilience > Disturbance regimes
What the sources say
- Partly supportedcites [50] Botelho, J., Costa, S. C. P., Ribeiro, J. G. & Souza, C. M. Mapping roads in the Brazilian Amazon with artificial intelligence and Sentinel-2. Remote Sensing 14, 3625 (2022). sourceExperimental — accuracy not yet measured
The Discussion reports that roads cut through or lie within 10 km of some remaining Amazon forest, supporting the road-impact part of the cited clause. It does not establish that most forests specifically within deforestation frontiers have been carved by roads; across the remaining forest it reports 41% affected and 59% roadless. The finding about smaller areas with high transition potential appears to be the citing authors’ own result, not a finding attributed to this source. (LLM, conf=0.84)
- Not checked — no full text of the sourcecites [51] Matricardi, E. A. T. et al. Long-term forest degradation surpasses deforestation in the Brazilian Amazon. Science 369, 1378–1382 (2020). source
plaincorrelational- Asserted: passes — The authors put it forward as true.
- Checkable: passes — It can be checked against evidence.
- Load-bearing: unclear — It is unclear whether the paper’s conclusions depend on it.
- Based: passes — The paper gives a reason why it holds.
It may state two separate claims as one.
- Rests on an assumption: The additive sum of warming/drying slopes, ecosystem stability classes, drought impacts, road proximity, and governance can serve as a proxy for ecosystem transition potential.
- Partly supported
Every source the paper cites for this claim was checked and supports it.
In the paper
“These strategies may allow seasonal forests to resist current levels of rainfall fluctuations32, but seasonal forests are also closer to the critical rainfall thresholds (Extended Data Fig. 1) and may experience unprecedented water stress in the coming decades (Fig. 1).”
§ Critical transitions in the Amazon forest system > Local versus systemic transition > Environmental heterogeneity
What the sources say
- Supportedcites [32] Tavares, J. V. et al. Basin-wide variation in tree hydraulic safety margins predicts the carbon balance of Amazon forests. Nature 617, 111–117 (2023). source
The citation is attached to the claim that strategies may help seasonal forests withstand current rainfall fluctuations, not to the later claims tied to the citing paper’s figures. In “Hydraulic traits distribution” (page unavailable), the source reports more resistant xylem in forests with longer dry seasons and suggests that species at the driest sites may be adapted to cope with seasonal hydraulic stress. (LLM, conf=0.87)
hedgedconditional- Asserted: passes — The authors put it forward as true.
- Checkable: passes — It can be checked against evidence.
- Load-bearing: passes — The paper’s conclusions depend on it.
- Based: passes — The paper gives a reason why it holds.
It may state two separate claims as one.
- Supported
The cited sources support only part of this claim — read each source’s verdict below.
In the paper
“Soil fertility is another heterogeneity factor that may affect forest resilience59, and which may be undermined by disturbances that cause topsoil erosion60.”
§ Critical transitions in the Amazon forest system > Local versus systemic transition > Environmental heterogeneity
What the sources say
- Supportedcites [59] Quesada, C. A. et al. Basin-wide variations in Amazon forest structure and function are mediated by both soils and climate. Biogeosciences 9, 2203–2246 (2012). source
Citation 59 is attached to the claim that soil fertility may affect forest resilience, not to the separate topsoil-erosion claim cited to 60. Section 4.5 (page not provided) says soil fertility could affect growth–defence tradeoffs, mortality and stand turnover, supporting the hedged claim about its potential effect on forest resilience. (LLM, conf=0.85)
- Partly supportedcites [60] Flores, B. M. et al. Soil erosion as a resilience drain in disturbed tropical forests. Plant Soil https://doi.org/10.1007/s11104-019-04097-8 (2020). sourceExperimental — accuracy not yet measured
Citation 60 is attached to the clause about disturbances and topsoil erosion. The indexed Abstract says disturbances leave organic topsoil vulnerable to erosion and identifies soil fertility as a condition affecting the erosion feedback. It does not explicitly say that erosion reduces soil fertility. (LLM, conf=0.78)
hedgedconditional- Asserted: passes — The authors put it forward as true.
- Checkable: passes — It can be checked against evidence.
- Load-bearing: unclear — It is unclear whether the paper’s conclusions depend on it.
- Based: passes — The paper gives a reason why it holds.
It may state two separate claims as one.
- Supported
The cited sources support only part of this claim — read each source’s verdict below.
In the paper
“Amazonian forests are home to more than 15,000 tree species, of which 1% are dominant and the other 99% are mostly rare107.”
§ Critical transitions in the Amazon forest system > Global change impacts on forest resilience > Disturbance regimes
What the sources say
- Partly supportedcites [107] ter Steege, H. et al. Biased-corrected richness estimates for the Amazonian tree flora. Sci. Rep. 10, 10130 (2020). sourceExperimental — accuracy not yet measured
The Discussion estimates 15,874 Amazonian tree species and describes hyperdominance by a few abundant species. It does not establish that exactly 1% of species are dominant or that the other 99% are mostly rare. (LLM, conf=0.86)
plain- Asserted: passes — The authors put it forward as true.
- Checkable: passes — It can be checked against evidence.
- Load-bearing: unclear — It is unclear whether the paper’s conclusions depend on it.
- Based: passes — The paper gives a reason why it holds.
It may state two separate claims as one.
- Partly supported
The cited sources support only part of this claim — read each source’s verdict below.
In the paper
“However, observations from across the Amazon46 suggest that CO2-driven accelerations of tree growth may have contributed to increasing tree mortality rates (trees grow faster but also die earlier), which could eventually neutralize the forest carbon sink in the coming decades55.”
§ Critical transitions in the Amazon forest system > Global change impacts on forest resilience > CO2 fertilization
What the sources say
- Partly supportedcites [46] Brienen, R. J. W. et al. Long-term decline of the Amazon carbon sink. Nature 519, 344–348 (2015). sourceExperimental — accuracy not yet measured
The paper reports Amazon-wide increases in productivity and mortality (p. 4) and suggests that faster growth may shorten tree lifespans and contribute to mortality (p. 5). But it says the factors driving the observed changes remain unclear (p. 5), so it does not establish that CO2 drove the growth acceleration. The sentence separately cites source 55 for the possibility that the sink could be neutralized in coming decades. (LLM, conf=0.84)
- Supportedcites [55] Brienen, R. J. W. et al. Forest carbon sink neutralized by pervasive growth-lifespan trade-offs. Nat. Commun. 11, 4241 (2020). source
The citation to this paper is attached to the possibility that increased mortality could neutralize the forest carbon sink. In Results and discussion, the paper says growth–lifespan trade-offs may explain rising mortality and could reduce or reverse the future forest carbon sink. The Amazon observations earlier in the sentence carry a separate citation. (LLM, conf=0.92)
hedgedconditional- Asserted: passes — The authors put it forward as true.
- Checkable: passes — It can be checked against evidence.
- Load-bearing: passes — The paper’s conclusions depend on it.
- Based: passes — The paper gives a reason why it holds.
It may state two separate claims as one.
- Partly supported
The cited sources support only part of this claim — read each source’s verdict below.
In the paper
“For instance, roads carving through the forest are well-known sources of illegal activities, such as logging and burning, which increase forest flammability38,39.”
§ Critical transitions in the Amazon forest system > Local versus systemic transition > Sources of connectivity
What the sources say
- Not checked — no full text of the sourcecites [38] Bullock, E. L., Woodcock, C. E., Souza, C. Jr & Olofsson, P. Satellite-based estimates reveal widespread forest degradation in the Amazon. Global Change Biol. 26, 2956–2969 (2020). source
- Partly supportedcites [39] Lapola, D. M. et al. The drivers and impacts of Amazon forest degradation. Science 379, eabp8622 (2023). sourceExperimental — accuracy not yet measured
In “Projecting Amazon forest degradation” (page unavailable), the paper says roads promote degradation and deforestation. “Spatial extent and severity” says logged forests can be more flammable than undisturbed forests, and elsewhere notes that some timber extraction is illegal. It does not establish the more specific claim that roads are sources of illegal logging and burning, or that those road-linked activities increase flammability. (LLM, conf=0.85)
boosteddirect- Asserted: passes — The authors put it forward as true.
- Checkable: passes — It can be checked against evidence.
- Load-bearing: unclear — It is unclear whether the paper’s conclusions depend on it.
- Based: passes — The paper gives a reason why it holds.
It may state two separate claims as one.
The cited sources support only part of this claim — read each source’s verdict below.
In the paper
“IPLCs defend their territories against illegal deforestation and land use disturbances49,113, and they also promote forest restoration by expanding diverse agroforestry systems121,122.”
§ Critical transitions in the Amazon forest system > Global change impacts on forest resilience > Disturbance regimes
What the sources say
- Not checked — no full text of the sourcecites [49] Nepstad, D. et al. Inhibition of Amazon deforestation and fire by parks and Indigenous lands: inhibition of Amazon deforestation and fire. Conserv. Biol. 20, 65–73 (2006). source
- Partly supportedcites [113] Garnett, S. T. et al. A spatial overview of the global importance of Indigenous lands for conservation. Nat. Sustain. 1, 369–374 (2018). sourceExperimental — accuracy not yet measured
The 'Consequences of Indigenous influence on land management' section says Indigenous Peoples protect biodiversity on their lands, and the 'Fig. 2 around here' section reports that most Indigenous lands have low-intensity land uses. Neither passage establishes that IPLCs defend their territories specifically against illegal deforestation or land-use disturbances. The agroforestry clause is attached to other citations, so it is not assessed here. (LLM, conf=0.79)
- Partly supportedcites [121] Schmidt, M. V. C. et al. Indigenous knowledge and forest succession management in the Brazilian Amazon: contributions to reforestation of degraded areas. Front. For. Glob. Change 4, 605925 (2021). sourceExperimental — accuracy not yet measured
The Discussion describes indigenous agroforestry management practices that can accelerate forest recovery. But the Assisted Natural Regeneration section says traditional agroforestry management in the studied villages is being replaced, not expanded. The paper therefore supports a restoration role for these practices, but not the claim that communities are expanding diverse agroforestry systems. (LLM, conf=0.87)
- Not checked — no full text of the sourcecites [122] Tomioka Nilsson, M. S. & Fearnside, P. M. Yanomami mobility and its effects on the forest landscape. Hum. Ecol. 39, 235–256 (2011). source
plaindirect- Asserted: passes — The authors put it forward as true.
- Checkable: passes — It can be checked against evidence.
- Load-bearing: unclear — It is unclear whether the paper’s conclusions depend on it.
- Based: passes — The paper gives a reason why it holds.
It may state two separate claims as one.
The cited sources support only part of this claim — read each source’s verdict below.
In the paper
“Continued loss of ecological knowledge will undermine the capacity of IPLCs to manage and protect Amazonian forests, further reducing their resilience to global changes9.”
§ Critical transitions in the Amazon forest system > Global change impacts on forest resilience > Disturbance regimes
What the sources say
- Partly supportedcites [9] Cámara-Leret, R., Fortuna, M. A. & Bascompte, J. Indigenous knowledge networks in the face of global change. Proc. Natl Acad. Sci. USA 116, 9913–9918 (2019). sourceExperimental — accuracy not yet measured
The Abstract says progressive loss of biocultural heritage may undermine the resilience of the communities studied, and that knowledge loss constrains their ability to benefit from nature’s services. It does not establish that knowledge loss undermines their capacity to manage or protect Amazonian forests; the Study Area section also includes communities outside Amazonia. No page numbers are provided in our copy. (LLM, conf=0.87)
plaindirect- Asserted: passes — The authors put it forward as true.
- Checkable: passes — It can be checked against evidence.
- Load-bearing: unclear — It is unclear whether the paper’s conclusions depend on it.
- Based: passes — The paper gives a reason why it holds.
It may state two separate claims as one.
- Partly supported
Every source the paper cites for this claim was checked and supports it.
In the paper
“Other key heterogeneity factors (Extended Data Fig. 6) include topography, which determines plant access to groundwater64, and seasonal flooding, which increases forest vulnerability to wildfires65.”
§ Critical transitions in the Amazon forest system > Local versus systemic transition > Environmental heterogeneity
What the sources say
- Supportedcites [64] Mattos, C. R. C. et al. Double stress of waterlogging and drought drives forest–savanna coexistence. Proc. Natl Acad. Sci. USA 120, e2301255120 (2023). source
Citation 65 attaches to the seasonal-flooding and wildfire clause, not the separate topography claim. The Discussion explains that floodplain vegetation has shallow, exposed root mats, making dry-season fires more damaging, and that tree recovery after fire is slow. (LLM, conf=0.91)
- Supportedcites [65] Flores, B. M. et al. Floodplains as an Achilles’ heel of Amazonian forest resilience. Proc. Natl Acad. Sci. USA 114, 4442–4446 (2017). source
Citation 65 attaches to the seasonal-flooding clause, not the topography clause. The Results and Discussion (page not supplied) says floodplain forests are more vulnerable to fire than upland forests and describes exposed root mats after waters retreat that burn easily. (LLM, conf=0.92)
plaindirect- Asserted: passes — The authors put it forward as true.
- Checkable: passes — It can be checked against evidence.
- Load-bearing: unclear — It is unclear whether the paper’s conclusions depend on it.
- Based: passes — The paper gives a reason why it holds.
It may state two separate claims as one.
- Supported
The cited sources support only part of this claim — read each source’s verdict below.
In the paper
“By creating new cultural niches, humans partly modified the Amazonian flora117,118, increasing their food security even during times of past climate change119,120 without the need for large-scale deforestation117.”
§ Critical transitions in the Amazon forest system > Global change impacts on forest resilience > Disturbance regimes
What the sources say
- Not checked — no full text of the sourcecites [117] Levis, C. et al. Persistent effects of pre-Columbian plant domestication on Amazonian forest composition. Science 355, 925–931 (2017). source
- Partly supportedcites [118] Coelho, S. D. et al. Eighty-four per cent of all Amazonian arboreal plant individuals are useful to humans. PLoS ONE 16, e0257875 (2021). sourceExperimental — accuracy not yet measured
The Introduction (page unavailable) says Indigenous management practices may have changed the abundance of useful Amazonian plants and describes practices that created domesticated forest landscapes. It does not establish that this occurred without large-scale deforestation. The food-security and past-climate-change clause is attached to other citations in the citing sentence, not to this source. (LLM, conf=0.82)
- Partly supportedcites [119] de Souza, J. G. et al. Climate change and cultural resilience in late pre-Columbian Amazonia. Nat. Ecol. Evol. 3, 1007–1017 (2019). sourceExperimental — accuracy not yet measured
In “Two models of land use” (page unavailable), the paper describes forest enrichment without large-scale deforestation and says its review suggests that polyculture agroforestry gave pre-Columbian societies resilience to climate variability. The citing sentence’s assertion that these practices increased food security during climate change is stronger than the paper’s proposed resilience finding; it does not establish a direct increase in food security. (LLM, conf=0.82)
- Partly supportedcites [120] Furquim, L. P. et al. Facing change through diversity: resilience and diversification of plant management strategies during the Mid to Late Holocene Transition at the Monte Castelo shellmound, SW Amazonia. Quaternary 4, 8 (2021). sourceExperimental — accuracy not yet measured
Section 5.1 says Indigenous people directly manipulated plants and co-constructed biodiversity, while section 5.2 describes diversified plant management in response to climatic change. Section 5.3 finds that fires recorded at Monte Castelo were not for vegetation clearance. That site-specific finding does not establish that modifying Amazonian flora more broadly required no large-scale deforestation; the food-security and climate-change phrase is attached to other citations in the citing sentence. (LLM, conf=0.84)
plaindirect- Asserted: passes — The authors put it forward as true.
- Checkable: passes — It can be checked against evidence.
- Load-bearing: unclear — It is unclear whether the paper’s conclusions depend on it.
- Based: passes — The paper gives a reason why it holds.
It may state two separate claims as one.
Every source the paper cites for this claim was checked and supports it.
In the paper
“For instance, in the rainy western Amazon, drought-resistant species are rare but present within tree communities111, implying that they could replace the dominant drought-sensitive species in a drier future.”
§ Critical transitions in the Amazon forest system > Global change impacts on forest resilience > Disturbance regimes
What the sources say
- Supportedcites [111] Esquivel-Muelbert, A. et al. Seasonal drought limits tree species across the Neotropics. Ecography 40, 618–629 (2017). source
The Discussion (page unavailable) reports that dry-forest species also occur in wetter communities and that only a small proportion of taxa are restricted to dry conditions. A later passage (Accepted Article, page unavailable) says dry-affiliated taxa may be less abundant in wet forests but generally remain present. It also suggests potential compensatory gains by the fewer dry-tolerant species as wet-forest specialists are lost, matching the sentence’s tentative implication rather than establishing that replacement will occur. (LLM, conf=0.88)
hedgedconditional- Asserted: passes — The authors put it forward as true.
- Checkable: passes — It can be checked against evidence.
- Load-bearing: unclear — It is unclear whether the paper’s conclusions depend on it.
- Based: passes — The paper gives a reason why it holds.
It may state two separate claims as one.
- Supported
The cited sources support only part of this claim — read each source’s verdict below.
In the paper
“Tree species complementarity increases carbon storage, accelerating forest recovery after disturbances108.”
§ Critical transitions in the Amazon forest system > Global change impacts on forest resilience > Disturbance regimes
What the sources say
- Partly supportedcites [108] Poorter, L. et al. Diversity enhances carbon storage in tropical forests: Carbon storage in tropical forests. Global Ecol. Biogeogr. 24, 1314–1328 (2015). sourceExperimental — accuracy not yet measured
The Discussion (page unavailable) reports a positive relationship between species richness and above-ground biomass, supporting the carbon-storage part of the claim. The Introduction presents complementarity as a proposed mechanism, not one the study establishes. The discussion of gap dynamics says richness and biomass may both rise after disturbance; it does not show that complementarity accelerates forest recovery. (LLM, conf=0.88)
plaindirect- Asserted: passes — The authors put it forward as true.
- Checkable: passes — It can be checked against evidence.
- Load-bearing: unclear — It is unclear whether the paper’s conclusions depend on it.
- Based: passes — The paper gives a reason why it holds.
It may state two separate claims as one.
- Partly supported
The cited sources support only part of this claim — read each source’s verdict below.
In the paper
“Humans have been present in the Amazon for at least 12,000 years114 and extensively managing landscapes for 6,000 years22.”
§ Critical transitions in the Amazon forest system > Global change impacts on forest resilience > Disturbance regimes
What the sources say
- Not checked — no full text of the sourcecites [114] Morcote-Ríos, G., Aceituno, F. J., Iriarte, J., Robinson, M. & Chaparro-Cárdenas, J. L. Colonisation and early peopling of the Colombian Amazon during the Late Pleistocene and the Early Holocene: new evidence from La Serranía La Lindosa. Quat. Int. 578, 5–19 (2021). source
- Partly supportedcites [22] Clement, C. R. et al. Disentangling domestication from food production systems in the neotropics. Quaternary 4, 4 (2021). sourceExperimental — accuracy not yet measured
Citation 22 is attached to the landscape-management claim, not the separate 12,000-year presence claim. Section 3, “Early Human Entanglements in the Neotropics” (page unavailable), says early-Holocene palm remains suggest management at two Amazonian sites, and Section 5, “Are the Neotropics Different?” (page unavailable), describes evidence of widespread human influence. Neither passage establishes that landscapes were extensively managed for 6,000 years. (LLM, conf=0.82)
plain- Asserted: passes — The authors put it forward as true.
- Checkable: passes — It can be checked against evidence.
- Load-bearing: fails — The paper’s conclusions may not depend on it.
- Based: passes — The paper gives a reason why it holds.
Probably not a substantial claim. The paper’s conclusions may not depend on it. It may state two separate claims as one.
The cited sources support only part of this claim — read each source’s verdict below.
In the paper
“However, consistent loss of Amazonian languages is causing an irreversible disruption of ecological knowledge systems, mostly driven by road construction7.”
§ Critical transitions in the Amazon forest system > Global change impacts on forest resilience > Disturbance regimes
What the sources say
- Partly supportedcites [7] Bromham, L. et al. Global predictors of language endangerment and the future of linguistic diversity. Nat. Ecol. Evol. 6, 163–173 (2022). sourceExperimental — accuracy not yet measured
In “Predicting future language loss” (page unavailable), the paper identifies the Amazon rainforest as a projected hotspot, not a documented site of consistent loss. “Predictors of language endangerment” associates road density with endangerment globally but does not establish that road construction is the main cause of Amazonian language loss. The cited passages do not establish irreversible disruption of ecological knowledge systems; “Safeguarding language diversity” instead describes the predictions as possible outcomes that intervention may change. (LLM, conf=0.88)
plaindirect- Asserted: passes — The authors put it forward as true.
- Checkable: passes — It can be checked against evidence.
- Load-bearing: unclear — It is unclear whether the paper’s conclusions depend on it.
- Based: passes — The paper gives a reason why it holds.
It may state two separate claims as one.
- Partly supported
The cited sources support only part of this claim — read each source’s verdict below.
In the paper
“Through diverse ecosystem management practices, humans built thousands of earthworks and ‘Amazon Dark Earth’ sites, and domesticated plants and landscapes across the Amazon forest115,116.”
§ Critical transitions in the Amazon forest system > Global change impacts on forest resilience > Disturbance regimes
What the sources say
- Partly supportedcites [115] Levis, C. et al. How people domesticated Amazonian forests. Front. Ecol. Evol. 5, 171 (2018). sourceExperimental — accuracy not yet measured
The Introduction and Discussion describe diverse management practices that domesticated plants and forest landscapes across Amazonia. Materials and methods says people created anthropogenic soils, and the Discussion mentions mounds and geoglyphs. However, the paper does not establish that humans built thousands of earthworks and Amazon Dark Earth sites. (LLM, conf=0.86)
- Supportedcites [116] Clement, C. R. et al. The domestication of Amazonia before European conquest. Proc. R. Soc. B. 282, 20150813 (2015). source
The discussion of anthropogenic soils and earthworks reports widely dispersed Amazonian dark earth (ADE) sites and explains how human settlement and land management produced them. The paper also identifies tens of thousands of raised fields among its examples of earthworks, while its plant-management section describes domesticated plants and modified forests across Amazonia. No page numbers are available in our copy. (LLM, conf=0.88)
plaindirect- Asserted: passes — The authors put it forward as true.
- Checkable: passes — It can be checked against evidence.
- Load-bearing: unclear — It is unclear whether the paper’s conclusions depend on it.
- Based: passes — The paper gives a reason why it holds.
It may state two separate claims as one.
- Partly supported
The cited sources support only part of this claim — read each source’s verdict below.
In the paper
“Today, IPLCs have diverse ecological knowledge about Amazonian plants, animals and landscapes, which allows them to quickly identify and respond to environmental changes with mitigation and adaptation practices68,69.”
§ Critical transitions in the Amazon forest system > Global change impacts on forest resilience > Disturbance regimes
What the sources say
- Not checked — no full text of the sourcecites [68] Alexander, C. et al. Linking Indigenous and scientific knowledge of climate change. BioScience 61, 477–484 (2011). source
- Partly supportedcites [69] Ford, J. D. et al. The resilience of Indigenous peoples to environmental change. One Earth 2, 532–543 (2020). sourceExperimental — accuracy not yet measured
The paper’s discussion of Indigenous knowledge (section labeled “War uet”; page not provided) says botanical and ecological knowledge helps Indigenous peoples detect environmental change and adapt their practices. The Resilience Factors section also describes fire-management practices in Latin America. These passages support the general mechanism, but do not establish the claim specifically for IPLCs’ knowledge of Amazonian plants, animals, and landscapes or their ability to respond quickly there. (LLM, conf=0.84)
plaindirect- Asserted: passes — The authors put it forward as true.
- Checkable: passes — It can be checked against evidence.
- Load-bearing: unclear — It is unclear whether the paper’s conclusions depend on it.
- Based: passes — The paper gives a reason why it holds.
It may state two separate claims as one.
The cited sources support only part of this claim — read each source’s verdict below.
In the paper
“For instance, field evidence from long-term monitoring sites across the Amazon shows that tree mortality rates are increasing in most sites, reducing carbon storage46, while favouring the replacement by drought-affiliated species47.”
§ Critical transitions in the Amazon forest system > Global change impacts on forest resilience > Disturbance regimes
What the sources say
- Partly supportedcites [46] Brienen, R. J. W. et al. Long-term decline of the Amazon carbon sink. Nature 519, 344–348 (2015). sourceExperimental — accuracy not yet measured
The main text (p. 4) reports increasing mortality across the monitoring network and a resulting decline in the rate of biomass gain. It does not establish that mortality increased in most individual sites, and it says forests remained a biomass sink rather than losing biomass overall. The drought-affiliated species clause is attached to a different citation, so it is not assessed here. (LLM, conf=0.86)
- Supportedcites [47] Esquivel‐Muelbert, A. et al. Compositional response of Amazon forests to climate change. Glob. Change Biol. 25, 39–56 (2019). source
Citation 47 is attached to the clause about favouring replacement by drought-affiliated species, not the preceding mortality-rate and carbon-storage claim. The Discussion reports that recruits have become more dry-affiliated and that mortality of wet-affiliated trees has increased where drying was stronger, supporting an emerging compositional shift. (LLM, conf=0.90)
plaindirect- Asserted: passes — The authors put it forward as true.
- Checkable: passes — It can be checked against evidence.
- Load-bearing: passes — The paper’s conclusions depend on it.
- Based: passes — The paper gives a reason why it holds.
It may state two separate claims as one.
- Partly supported
The cited sources support only part of this claim — read each source’s verdict below.
In the paper
“Moreover, increases in tree water-use efficiency may reduce forest transpiration and consequently atmospheric moisture flow across the Amazon53,56, potentially reducing forest resilience in the southwest of the biome4,37.”
§ Critical transitions in the Amazon forest system > Global change impacts on forest resilience > CO2 fertilization
What the sources say
- Partly supportedcites [53] Kooperman, G. J. et al. Forest response to rising CO2 drives zonally asymmetric rainfall change over tropical land. Nat. Clim. Change 8, 434–440 (2018). sourceExperimental — accuracy not yet measured
The Local thermodynamic and circulation anomalies section says rising CO₂ can reduce stomatal conductance and forest transpiration. The Discussion also reports reduced moisture flow over the Amazon. But Differences between Amazon and Indonesian forests attributes the reduction in moisture convergence to non-local influences from Africa, rather than a direct consequence of reduced transpiration within the Amazon. The southwest-resilience clause has separate citations and is not judged here. (LLM, conf=0.83)
- Not checked — no full text of the sourcecites [56] Lammertsma, E. I. et al. Global CO2 rise leads to reduced maximum stomatal conductance in Florida vegetation. Proc. Natl Acad. Sci. USA 108, 4035–4040 (2011). source
- Could not verifycites [4] Staal, A. et al. Forest-rainfall cascades buffer against drought across the Amazon. Nat. Clim. Change 8, 539–543 (2018). sourceExperimental — accuracy not yet measured
The available passages are bibliographic metadata, not substantive text from the paper (no section or page is given). Searches for water-use efficiency, transpiration, atmospheric moisture flow, and southwestern Amazon resilience returned no passage addressing the attributed claim. (LLM, conf=0.72)
- Partly supportedcites [37] Zemp, D. C. et al. Self-amplified Amazon forest loss due to vegetation-atmosphere feedbacks. Nat. Commun. 8, 14681 (2017). sourceExperimental — accuracy not yet measured
The Results section (‘Self-amplified forest loss under dry-season intensification’; page unavailable) links reduced evapotranspiration after forest loss with moisture recycling and declining forest resilience. But the paper studies forest loss, not increased tree water-use efficiency as a cause of reduced transpiration. The southwest-resilience clause has separate citations in the citing sentence and is not attributed to this source. (LLM, conf=0.86)
hedgedconditional- Asserted: passes — The authors put it forward as true.
- Checkable: passes — It can be checked against evidence.
- Load-bearing: passes — The paper’s conclusions depend on it.
- Based: passes — The paper gives a reason why it holds.
It may state two separate claims as one.
- Partly supported
Every source the paper cites for this claim was checked and supports it.
In the paper
“For instance, logging and edge effects can make a forest patch more flammable39, but these disturbances are often not captured by ESMs.”
§ Critical transitions in the Amazon forest system > Prospects for modelling Amazon forest dynamics
What the sources say
- Supportedcites [39] Lapola, D. M. et al. The drivers and impacts of Amazon forest degradation. Science 379, eabp8622 (2023). source
The citation follows the flammability clause. In “Projecting Amazon forest degradation” (page unavailable), the paper says timber extraction and edge effects alter the forest microclimate, making future fires more likely. The statement about ESMs follows the citation and is not needed to confirm the cited clause. (LLM, conf=0.94)
plaindirect- Asserted: passes — The authors put it forward as true.
- Checkable: passes — It can be checked against evidence.
- Load-bearing: unclear — It is unclear whether the paper’s conclusions depend on it.
- Based: passes — The paper gives a reason why it holds.
It may state two separate claims as one.
- Supported
The cited sources support only part of this claim — read each source’s verdict below.
In the paper
“Although these ecosystem transitions have been confirmed only in the Negro river basin (central Amazon), floodplain forests in other parts of the Amazon were shown to be particularly vulnerable to collapse45,64,65.”
§ Critical transitions in the Amazon forest system > Three alternative ecosystem trajectories > White-sand savanna
What the sources say
- Supportedcites [45] Silvério, D. V. et al. Intensification of fire regimes and forest loss in the Território Indígena do Xingu. Environ. Res. Lett. 17, 045012 (2022). source
The Results report that flooded forests in the Xingu were particularly vulnerable to forest loss from fire–drought interactions. The Conclusions state that these forests are less resilient than upland forests and at greater risk of transitioning to herbaceous vegetation. This supports the cited claim about vulnerability outside the Negro River basin; the citation is attached to that claim, not to the assertion about where transitions have been confirmed. (LLM, conf=0.94)
- Partly supportedcites [64] Mattos, C. R. C. et al. Double stress of waterlogging and drought drives forest–savanna coexistence. Proc. Natl Acad. Sci. USA 120, e2301255120 (2023). sourceExperimental — accuracy not yet measured
In “Future Changes in Double Stress,” the paper says floodplain forests of the Amazonas, Madeira, and Upper Negro Rivers are particularly affected by simulated hydrologic stress, supporting the geographic point. It does not establish that those forests are particularly vulnerable to collapse: the same section says vegetation shifts depend on local factors and that more research is needed to determine each forest type’s vulnerability. (LLM, conf=0.86)
- Supportedcites [65] Flores, B. M. et al. Floodplains as an Achilles’ heel of Amazonian forest resilience. Proc. Natl Acad. Sci. USA 114, 4442–4446 (2017). source
The Results and Discussion report lower resilience of floodplain forests and conclude that seasonally inundated forests throughout the Amazon are especially vulnerable to transition into a fire-prone state. The paper presents this as a basin-wide inference, not as confirmation that transitions have occurred outside the Negro River basin. (LLM, conf=0.88)
plaincorrelational- Asserted: passes — The authors put it forward as true.
- Checkable: passes — It can be checked against evidence.
- Load-bearing: unclear — It is unclear whether the paper’s conclusions depend on it.
- Based: passes — The paper gives a reason why it holds.
It may state two separate claims as one.
- Supported
Every source the paper cites for this claim was checked and supports it.
In the paper
“For floodplain ecosystems covering 14% of the forest biome, a different critical threshold has been estimated at 1,500 mm of annual rainfall65, implying that floodplain forests may be the first to collapse in a drier future.”
§ Critical transitions in the Amazon forest system > Five critical drivers of water stress > Annual rainfall
What the sources say
- Supportedcites [65] Flores, B. M. et al. Floodplains as an Achilles’ heel of Amazonian forest resilience. Proc. Natl Acad. Sci. USA 114, 4442–4446 (2017). source
The Results and Discussion report that a savanna basin of attraction appears at around 1,500 mm of mean annual rainfall in floodplains, and that tipping points will likely be reached first in seasonally inundated forests. The same section says these ecosystems cover 14% of the Amazon basin. The paper describes the 1,500 mm figure as the appearance of a savanna state, rather than a certain point of collapse, consistent with the citing sentence’s hedged implication. (LLM, conf=0.90)
hedgedconditional- Asserted: passes — The authors put it forward as true.
- Checkable: passes — It can be checked against evidence.
- Load-bearing: passes — The paper’s conclusions depend on it.
- Based: passes — The paper gives a reason why it holds.
It may state two separate claims as one.
- Supported
The sources with a verdict support this claim; the rest weren’t checked yet, have no full text we could read, or their verdicts aren’t rated yet.
In the paper
“Guadua bamboo forests are common in the southwestern Amazon92,93.”
§ Critical transitions in the Amazon forest system > Three alternative ecosystem trajectories > Degraded forest
What the sources say
- Not checked — no full text of the sourcecites [92] da Silva, S. S. et al. Increasing bamboo dominance in southwestern Amazon forests following intensification of drought-mediated fires. For. Ecol. Manag. 490, 119139 (2021). source
- Supportedcites [93] Carvalho, A. Lde et al. Bamboo-dominated forests of the southwest Amazon: detection, spatial extent, life cycle length and flowering waves. PLoS ONE 8, e54852 (2013). source
The Introduction states that Guadua weberbaueri and G. sarcocarpa dominate forests over a large area of the southwest Amazon. The Discussion (Conclusions and Future Directions) estimates that at least 161,500 km² of the region has high densities of Guadua, supporting the claim that these forests are common there. (LLM, conf=0.94)
plain- Asserted: passes — The authors put it forward as true.
- Checkable: passes — It can be checked against evidence.
- Load-bearing: fails — The paper’s conclusions may not depend on it.
- Based: passes — The paper gives a reason why it holds.
Probably not a substantial claim. The paper’s conclusions may not depend on it.
The cited sources support only part of this claim — read each source’s verdict below.
In the paper
“In stable forest regions of the Amazon with annual rainfall above 1,800 mm (Extended Data Fig. 1b), forest cover usually recovers within a few years or decades after disturbances, yet forest composition and functioning may remain degraded for decades or centuries84–87.”
§ Critical transitions in the Amazon forest system > Three alternative ecosystem trajectories > Degraded forest
What the sources say
- Not checked — no full text of the sourcecites [84] Brando, P. M. et al. Prolonged tropical forest degradation due to compounding disturbances: Implications for CO2 and H2O fluxes. Glob. Change Biol. 25, 2855–2868 (2019). source
- Partly supportedcites [85] Mesquita, R. C. G., Ickes, K., Ganade, G. & Williamson, G. B. Alternative successional pathways in the Amazon Basin: successional pathways in the Amazon. J. Ecol. 89, 528–537 (2001). sourceExperimental — accuracy not yet measured
The Summary describes secondary forest stands 6–10 years after clearing, and the Introduction reports that recovery to primary forest may take 100–200 years on lightly used sites or at least 500 years on heavily used sites. The Methods give mean rainfall of 2,200 mm at the study site. The paper does not establish that forest cover usually recovers within years or decades across stable Amazonian regions above 1,800 mm of rainfall, or give a general timescale for recovery of forest functioning. (LLM, conf=0.86)
- Could not verifycites [86] Jakovac, C. C., Peña-Claros, M., Kuyper, T. W. & Bongers, F. Loss of secondary-forest resilience by land-use intensification in the Amazon. J. Ecol. 103, 67–77 (2015). sourceExperimental — accuracy not yet measured
Searches for recovery times, rainfall, and species composition found no matching full-text passage. The retrieved text is labelled Abstract and cannot establish the claim under the specified evidence rule; the available passages do not verify recovery within years or decades, an 1,800 mm rainfall threshold, or degradation lasting centuries. (LLM, conf=0.70)
- Partly supportedcites [87] Barlow, J. & Peres, C. A. Fire-mediated dieback and compositional cascade in an Amazonian forest. Phil. Trans. R. Soc. B 363, 1787–1794 (2008). sourceExperimental — accuracy not yet measured
The Conclusion (p. not provided) says that compositional recovery after forest disturbance can take hundreds of years or longer. The Results report recruitment of smaller trees within nine years, and the Methods describe a study area averaging 2,041 mm of annual rainfall. But the paper does not establish that forest cover usually recovers within years or decades across stable Amazonian regions receiving more than 1,800 mm of rain annually. (LLM, conf=0.85)
hedgedconditional- Asserted: passes — The authors put it forward as true.
- Checkable: passes — It can be checked against evidence.
- Load-bearing: passes — The paper’s conclusions depend on it.
- Based: passes — The paper gives a reason why it holds.
It may state two separate claims as one.
The cited sources support only part of this claim — read each source’s verdict below.
In the paper
“In the ‘degraded forest’ trajectory, feedbacks often involve competition between trees and other opportunistic plants85,90,92, as well as interactions between deforestation, fire and seed limitation84,87,105.”
§ Critical transitions in the Amazon forest system > Three alternative ecosystem trajectories > Degraded forest
What the sources say
- Partly supportedcites [85] Mesquita, R. C. G., Ickes, K., Ganade, G. & Williamson, G. B. Alternative successional pathways in the Amazon Basin: successional pathways in the Amazon. J. Ecol. 89, 528–537 (2001). sourceExperimental — accuracy not yet measured
The ‘what drives successional pathways in the Amazon?’ section (page unavailable) links deforestation and periodic burning to different regeneration pathways, while the ‘regeneration as a function of distance from primary forest edge’ section reports seed-dispersal limits. The paper also discusses dominant pioneer plants retarding regeneration, but it does not establish competition between trees and other opportunistic plants as a frequent feedback. (LLM, conf=0.82)
- Could not verifycites [90] Schnitzer, S. A. & Bongers, F. Increasing liana abundance and biomass in tropical forests: emerging patterns and putative mechanisms: Increasing lianas in tropical forests. Ecology Letters 14, 397–406 (2011). sourceExperimental — accuracy not yet measured
The citation is attached to the clause about competition between trees and opportunistic plants, not the separate clause about deforestation, fire and seed limitation. The available passages labeled Abstract contain bibliographic details and the keyword “below-ground competition,” but no substantive passage establishing the claimed feedback in degraded forests. Searches for tree–liana competition and degraded-forest feedbacks returned no relevant text. (LLM, conf=0.72)
- Not checked — no full text of the sourcecites [92] da Silva, S. S. et al. Increasing bamboo dominance in southwestern Amazon forests following intensification of drought-mediated fires. For. Ecol. Manag. 490, 119139 (2021). source
- Not checked — no full text of the sourcecites [84] Brando, P. M. et al. Prolonged tropical forest degradation due to compounding disturbances: Implications for CO2 and H2O fluxes. Glob. Change Biol. 25, 2855–2868 (2019). source
- Supportedcites [87] Barlow, J. & Peres, C. A. Fire-mediated dieback and compositional cascade in an Amazonian forest. Phil. Trans. R. Soc. B 363, 1787–1794 (2008). source
The Discussion (section 4; page unavailable) identifies competition with grasses and ruderal species, fire-damaged seed banks, and reduced seed dispersal as processes that can hinder forest regeneration. The Introduction (section 1; page unavailable) explains how forest clearance and other human disturbances increase fire susceptibility. Together, these passages support the cited description of interacting feedbacks in degraded forests. (LLM, conf=0.87)
- Partly supportedcites [105] Hawes, J. E. et al. A large‐scale assessment of plant dispersal mode and seed traits across human‐modified Amazonian forests. J. Ecol. 108, 1373–1385 (2020). sourceExperimental — accuracy not yet measured
The Discussion (page unavailable) links fire-related forest disturbance to changes in seed-dispersal traits and describes dispersal-limited recovery and a possible feedback between plant and animal communities. It does not establish a feedback involving deforestation, fire and seed limitation together. The competition clause has a separate set of citations and is not assessed against this source. (LLM, conf=0.78)
plaincorrelational- Asserted: passes — The authors put it forward as true.
- Checkable: passes — It can be checked against evidence.
- Load-bearing: unclear — It is unclear whether the paper’s conclusions depend on it.
- Based: passes — The paper gives a reason why it holds.
It may state two separate claims as one.
- Partly supported
The cited sources support only part of this claim — read each source’s verdict below.
In the paper
“For instance, Vismia forests are common in old abandoned pastures managed with fire85, and are relatively stable, because Vismia trees favour recruitment of Vismia seedlings in detriment of other tree species88,89.”
§ Critical transitions in the Amazon forest system > Three alternative ecosystem trajectories > Degraded forest
What the sources say
- Partly supportedcites [85] Mesquita, R. C. G., Ickes, K., Ganade, G. & Williamson, G. B. Alternative successional pathways in the Amazon Basin: successional pathways in the Amazon. J. Ecol. 89, 528–537 (2001). sourceExperimental — accuracy not yet measured
The Summary and ‘regeneration under Vismia- and Cecropia-dominated canopies’ report that abandoned-pasture stands were Vismia-dominated and that many recruits beneath Vismia were Vismia seedlings or clonal sprouts. The paper describes Vismia as persistent, but says its effect on other species’ regeneration is a possibility and that land-use history may confound it. The claim presents that proposed cause as established and calls the recruits seedlings without allowing for sprouts. (LLM, conf=0.87)
- Could not verifycites [88] Jakovac, A. C. C., Bentos, T. V., Mesquita, R. C. G. & Williamson, G. B. Age and light effects on seedling growth in two alternative secondary successions in central Amazonia. Plant Ecol. Divers. 7, 349–358 (2014). sourceExperimental — accuracy not yet measured
The passages labelled Abstract contain bibliographic metadata and keywords, not findings about Vismia. Searches for Vismia recruitment, fire-managed pastures, and forest stability found no passage addressing the claim in our copy. (LLM, conf=0.72)
- Not checked — no full text of the sourcecites [89] Mazzochini, G. G. & Camargo, J. L. C. Understory plant interactions along a successional gradient in Central Amazon. Plant Soil https://doi.org/10.1007/s11104-019-04100-2 (2020). source
plaindirect- Asserted: passes — The authors put it forward as true.
- Checkable: passes — It can be checked against evidence.
- Load-bearing: unclear — It is unclear whether the paper’s conclusions depend on it.
- Based: passes — The paper gives a reason why it holds.
It may state two separate claims as one.
- Partly supported
The cited sources support only part of this claim — read each source’s verdict below.
In the paper
“Although most recent models agree that a large-scale collapse of the Amazon forest is unlikely within the twenty-first century2, our findings suggest that interactions and synergies among different disturbances (for example, frequent extreme hot droughts and forest fires) could trigger unexpected ecosystem transitions even in remote and central parts of the system101.”
§ Critical transitions in the Amazon forest system > Implications for governance
What the sources say
- Not checked yetcites [2] IPCC. Climate Change 2021: The Physical Science Basis (eds Masson-Delmotte, V. et al.) https://www.ipcc.ch/report/ar6/wg1/#FullReport (Cambridge Univ. Press, 2021).
- Partly supportedcites [101] Willcock, S., Cooper, G. S., Addy, J. & Dearing, J. A. Earlier collapse of Anthropocene ecosystems driven by multiple faster and noisier drivers. Nat. Sustain 6, 1331–1342 (2023). sourceExperimental — accuracy not yet measured
Split into 2 atoms — 0 confirmed, 2 partially supported, 0 disputed, 0 misattributed, 0 unverifiable. Expand the claim to see per-atom verdicts.
hedgedconditional- Asserted: passes — The authors put it forward as true.
- Checkable: passes — It can be checked against evidence.
- Load-bearing: passes — The paper’s conclusions depend on it.
- Based: passes — The paper gives a reason why it holds.
It may state two separate claims as one.
Every source the paper cites for this claim was checked and supports it.
In the paper
“These forests may naturally regrow through forest succession, yet because of feedbacks15, succession can become arrested, keeping forests persistently degraded (Fig. 4).”
§ Critical transitions in the Amazon forest system > Three alternative ecosystem trajectories > Degraded forest
What the sources say
- Supportedcites [15] Flores, B. M. & Staal, A. Feedback in tropical forests of the Anthropocene. Global Change Biol. 28, 5041–5061 (2022). source
The Interactions with soils section says slowed recovery after disturbance can leave an ecosystem persisting in a low-tree-cover state. The Prospects for future research section adds that forest restoration can require intervention to break degrading feedbacks. Together, these support the claim that feedbacks can prevent recovery and maintain degradation; page numbers are unavailable in our copy. (LLM, conf=0.87)
hedgeddirect- Asserted: passes — The authors put it forward as true.
- Checkable: passes — It can be checked against evidence.
- Load-bearing: passes — The paper’s conclusions depend on it.
- Based: passes — The paper gives a reason why it holds.
It may state two separate claims as one.
- Supported
The cited sources support only part of this claim — read each source’s verdict below.
In the paper
“The Amazon biome has already lost 13% of its original forest area due to deforestation83 (or 15% of the biome if we consider also young secondary forests83 that provide limited contribution to moisture flow84).”
§ Critical transitions in the Amazon forest system > Five critical drivers of water stress > Accumulated deforestation
What the sources say
- Partly supportedcites [83] Smith, C. C. et al. Old-growth forest loss and secondary forest recovery across Amazonian countries. Environ. Res. Lett. 16, 085009 (2021). sourceExperimental — accuracy not yet measured
Table 1 reports 13.4% old-growth forest loss across the Amazon biome, supporting the rounded 13% figure. Section 2.2 reports the extent and ages of secondary forests, but does not report 15% forest loss when young secondary forests are considered. The paper defines secondary forest as regrowth on previously deforested land, so adding it to old-growth loss would double-count that area. (LLM, conf=0.88)
plain- Asserted: passes — The authors put it forward as true.
- Checkable: passes — It can be checked against evidence.
- Load-bearing: passes — The paper’s conclusions depend on it.
- Based: passes — The paper gives a reason why it holds.
It may state two separate claims as one.
- Partly supported
The cited sources support only part of this claim — read each source’s verdict below.
In the paper
“After fire, the topsoil of burnt forests changes from clayey to sandy, favouring the establishment of savanna trees and native herbaceous plants95.”
§ Critical transitions in the Amazon forest system > Three alternative ecosystem trajectories > White-sand savanna
What the sources say
- Partly supportedcites [95] Flores, B. M. & Holmgren, M. White-sand savannas expand at the core of the Amazon after forest wildfires. Ecosystems 24, 1624–1637 (2021). sourceExperimental — accuracy not yet measured
The Soil Shift section says burnt floodplain forest soil shifts from clayey to sandy, while the Vegetation Shift section reports the arrival of savanna trees and the dominance of native herbaceous plants in burnt sites. But the paper says it cannot infer how soils and plants interact during this shift; it does not establish that the sandier soil favours the establishment of both plant groups. (LLM, conf=0.86)
plaindirect- Asserted: passes — The authors put it forward as true.
- Checkable: passes — It can be checked against evidence.
- Load-bearing: passes — The paper’s conclusions depend on it.
- Based: passes — The paper gives a reason why it holds.
It may state two separate claims as one.
- Partly supported
Every source the paper cites for this claim was checked and supports it.
In the paper
“Estimates from across the Amazon indicate that approximately 30% of areas previously deforested are in a secondary forest state83 (covering 4% of the biome).”
§ Critical transitions in the Amazon forest system > Three alternative ecosystem trajectories > Degraded forest
What the sources say
- Supportedcites [83] Smith, C. C. et al. Old-growth forest loss and secondary forest recovery across Amazonian countries. Environ. Res. Lett. 16, 085009 (2021). source
The Abstract reports that secondary forests occupied 28.8% of deforested land across the Amazon biome, supporting “approximately 30%.” Section 2.2 reports 234,795 km² of secondary forest; the paper calls this 4.1% of total forest cover, rather than of the biome. Its biome-wide figures nevertheless put secondary forest at approximately 4% of the biome. (LLM, conf=0.91)
hedged- Asserted: passes — The authors put it forward as true.
- Checkable: passes — It can be checked against evidence.
- Load-bearing: unclear — It is unclear whether the paper’s conclusions depend on it.
- Based: passes — The paper gives a reason why it holds.
It may state two separate claims as one.
- Supported
The cited sources support only part of this claim — read each source’s verdict below.
In the paper
“Another study using a climate-vegetation model found that with accumulated deforestation of 30−50%, rainfall in non-deforested areas downwind would decline67 by 40% (ref. 67), potentially causing more forest loss4,37.”
§ Critical transitions in the Amazon forest system > Five critical drivers of water stress > Accumulated deforestation
What the sources say
- Supportedcites [67] Boers, N., Marwan, N., Barbosa, H. M. J. & Kurths, J. A deforestation-induced tipping point for the South American monsoon system. Sci. Rep. 7, 41489 (2017). source
The Discussion reports that deforesting 30–50% of the east-to-west Amazon model boxes would reduce precipitation in the remaining non-deforested areas by about 40%. The Abstract identifies this as a model result affecting the western Amazon and areas further downstream. The suggestion of additional forest loss carries separate citations in the citing sentence and is not attributed to this source. (LLM, conf=0.94)
- Could not verifycites [4] Staal, A. et al. Forest-rainfall cascades buffer against drought across the Amazon. Nat. Clim. Change 8, 539–543 (2018). sourceExperimental — accuracy not yet measured
The passages available from our copy are bibliographic and repository information, not the study’s findings; none reports the claimed 30–50% deforestation scenario or a 40% rainfall decline in non-deforested areas downwind. Searches for those figures and for downwind rainfall returned no relevant passage. The potential for further forest loss is attached to different citations in the citing sentence. (LLM, conf=0.74)
- Partly supportedcites [37] Zemp, D. C. et al. Self-amplified Amazon forest loss due to vegetation-atmosphere feedbacks. Nat. Commun. 8, 14681 (2017). sourceExperimental — accuracy not yet measured
The Results (LGM and twenty-first century; page unavailable) describe an approximately 40% dry-season rainfall reduction that could lead to self-amplified forest loss. But that scenario is driven by reduced oceanic moisture inflow, not 30–50% accumulated deforestation; the passage does not place the rainfall decline in non-deforested areas downwind. (LLM, conf=0.87)
hedgeddirect- Asserted: passes — The authors put it forward as true.
- Checkable: passes — It can be checked against evidence.
- Load-bearing: passes — The paper’s conclusions depend on it.
- Based: passes — The paper gives a reason why it holds.
It may state two separate claims as one.
- Supported
The sources with a verdict support this claim; the rest weren’t checked yet, have no full text we could read, or their verdicts aren’t rated yet.
In the paper
“Today, invasion by alien flammable grasses is a novel stabilizing mechanism96,97, but the long-term persistence of these grasses in the ecosystem is also uncertain.”
§ Critical transitions in the Amazon forest system > Three alternative ecosystem trajectories > Degraded open-canopy ecosystem
What the sources say
- Not checked — no full text of the sourcecites [96] Veldman, J. W. & Putz, F. E. Grass-dominated vegetation, not species-diverse natural savanna, replaces degraded tropical forests on the southern edge of the Amazon Basin. Biol. Conserv. 144, 1419–1429 (2011). source
- Supportedcites [97] Silvério, D. V. et al. Testing the Amazon savannization hypothesis: fire effects on invasion of a neotropical forest by native cerrado and exotic pasture grasses. Phil. Trans. R. Soc. B 368, 20120427 (2013). source
The Introduction describes a positive feedback cycle in which invasive grasses increase fire intensity, reduce tree cover, and facilitate further grass invasion. Section (c), “Persistence of fire-promoting grasses,” says it remains unclear whether the resulting grass-dominated ecosystem will persist over longer fire-free periods. (LLM, conf=0.90)
plaindirect- Asserted: passes — The authors put it forward as true.
- Checkable: passes — It can be checked against evidence.
- Load-bearing: unclear — It is unclear whether the paper’s conclusions depend on it.
- Based: passes — The paper gives a reason why it holds.
It may state two separate claims as one.
The cited sources support only part of this claim — read each source’s verdict below.
In the paper
“Their origin has been attributed to geomorphological dynamics and past Indigenous fires26,27,94.”
§ Critical transitions in the Amazon forest system > Three alternative ecosystem trajectories > White-sand savanna
What the sources say
- Partly supportedcites [26] Rossetti, D. F. et al. Unfolding long-term Late Pleistocene-Holocene disturbances of forest communities in the southwestern Amazonian lowlands. Ecosphere 9, e02457 (2018). sourceExperimental — accuracy not yet measured
The Conclusions and Ways Forward attribute the study area’s savanna and forest distribution to evolving fluvial terraces, topographic gradients, and hydrology, supporting the geomorphological part. Linkage to Past Climate mentions anthropogenic fires only as a suggested amplification of Holocene savanna in the separate Gran Sabana region; it does not attribute the origin of the study area’s vegetation to past Indigenous fires. (LLM, conf=0.85)
- Not checked — no full text of the sourcecites [27] Prance, G. T. & Schubart, H. O. R. Notes on the vegetation of Amazonia I. A preliminary note on the origin of the open white sand campinas of the lower Rio Negro. Brittonia 30, 60 (1978). source
- Not checked — no full text of the sourcecites [94] Adeney, J. M., Christensen, N. L., Vicentini, A. & Cohn‐Haft, M. White‐sand ecosystems in Amazonia. Biotropica 48, 7–23 (2016). source
plaindirect- Asserted: passes — The authors put it forward as true.
- Checkable: passes — It can be checked against evidence.
- Load-bearing: fails — The paper’s conclusions may not depend on it.
- Based: passes — The paper gives a reason why it holds.
Probably not a substantial claim. The paper’s conclusions may not depend on it. It may state two separate claims as one.
- Partly supported
The cited sources support only part of this claim — read each source’s verdict below.
In the paper
“At the landscape scale, secondary forests are more likely to be cleared than mature forests, thus keeping forests persistently young and landscapes fragmented83.”
§ Critical transitions in the Amazon forest system > Three alternative ecosystem trajectories > Degraded forest
What the sources say
- Partly supportedcites [83] Smith, C. C. et al. Old-growth forest loss and secondary forest recovery across Amazonian countries. Environ. Res. Lett. 16, 085009 (2021). sourceExperimental — accuracy not yet measured
Section 2.2 reports that most Amazonian secondary forest was young and that 70% of cleared secondary forest was five years old or less; the Discussion also describes high turnover and short residence times. Our copy does not establish that secondary forests are more likely to be cleared than mature forests, or that their clearance keeps landscapes fragmented. Page numbers were not available in the indexed passages. (LLM, conf=0.85)
hedgeddirect- Asserted: passes — The authors put it forward as true.
- Checkable: passes — It can be checked against evidence.
- Load-bearing: unclear — It is unclear whether the paper’s conclusions depend on it.
- Based: passes — The paper gives a reason why it holds.
It may state two separate claims as one.
- Partly supported
The cited sources support only part of this claim — read each source’s verdict below.
In the paper
“Significant effects on simulation results may emerge from increasing plant functional diversity, representation of key physiological trade-offs and other features that determine water stress on plants, and also allowing for community adjustment to environmental heterogeneity and global change32,55,62,99.”
§ Critical transitions in the Amazon forest system > Prospects for modelling Amazon forest dynamics
What the sources say
- Partly supportedcites [32] Tavares, J. V. et al. Basin-wide variation in tree hydraulic safety margins predicts the carbon balance of Amazon forests. Nature 617, 111–117 (2023). sourceExperimental — accuracy not yet measured
The Abstract and Implications and conclusions (page unavailable) link variation in hydraulic traits and a proposed growth–mortality trade-off to Amazon forest composition and biomass change. Hydraulic traits distribution also reports variation with rainfall and local water availability. The paper does not show that increasing functional diversity or allowing community adjustment significantly changes simulation results. (LLM, conf=0.82)
- Partly supportedcites [55] Brienen, R. J. W. et al. Forest carbon sink neutralized by pervasive growth-lifespan trade-offs. Nat. Commun. 11, 4241 (2020). sourceExperimental — accuracy not yet measured
In “Implications for forest demography and carbon sink” (page not provided), simulations with and without a growth–lifespan trade-off produce substantially different biomass and mortality results. The paper also notes that climate-driven shifts in species distributions may affect biomass. It does not establish simulation effects from increasing plant functional diversity, representing features that determine water stress, or allowing community adjustment to environmental heterogeneity. (LLM, conf=0.85)
- Partly supportedcites [62] Levine, N. M. et al. Ecosystem heterogeneity determines the ecological resilience of the Amazon to climate change. Proc. Natl Acad. Sci. USA 113, 793–797 (2016). sourceExperimental — accuracy not yet measured
The Significance section (page unavailable) shows that representing individual plant water stress and canopy dynamics, rather than an aggregated canopy, substantially changes simulated forest responses. It also predicts changes in forest composition following drought. Our copy does not specifically show that increasing plant functional diversity or representing key physiological trade-offs produces significant effects on simulation results. (LLM, conf=0.82)
- Could not verifycites [99] Sakschewski, B. et al. Resilience of Amazon forests emerges from plant trait diversity. Nat. Clim. Change 6, 1032–1036 (2016). sourceExperimental — accuracy not yet measured
The available passages contain the title and bibliographic records, but no substantive findings. Searches for simulation effects, physiological trade-offs, water stress, and community adjustment returned no passages addressing the claim, so our copy cannot verify what is attributed to this paper. (LLM, conf=0.72)
hedgedconditional- Asserted: passes — The authors put it forward as true.
- Checkable: passes — It can be checked against evidence.
- Load-bearing: unclear — It is unclear whether the paper’s conclusions depend on it.
- Based: passes — The paper gives a reason why it holds.
It may state two separate claims as one.
- Partly supported
The sources with a verdict support this claim; the rest weren’t checked yet, have no full text we could read, or their verdicts aren’t rated yet.
In the paper
“In 2012, Davidson et al.102 demonstrated how the Amazon basin was experiencing a transition to a ‘disturbance-dominated regime’ related to climatic and land use changes, even though at the time, annual deforestation rates were declining owing to new forms of governance103.”
§ Critical transitions in the Amazon forest system > Implications for governance
What the sources say
- Not checked — no full text of the sourcecites [102] Davidson, E. A. et al. The Amazon basin in transition. Nature 481, 321–328 (2012). source
- Supportedcites [103] Hecht, S. B. From eco-catastrophe to zero deforestation? Interdisciplinarities, politics, environmentalisms and reduced clearing in Amazonia. Envir. Conserv. 39, 4–19 (2012). source
Split into 2 atoms — 2 confirmed, 0 partially supported, 0 disputed, 0 misattributed, 0 unverifiable. Expand the claim to see per-atom verdicts.
boosteddirect- Asserted: passes — The authors put it forward as true.
- Checkable: passes — It can be checked against evidence.
- Load-bearing: fails — The paper’s conclusions may not depend on it.
- Based: passes — The paper gives a reason why it holds.
Probably not a substantial claim. The paper’s conclusions may not depend on it. It may state two separate claims as one.
Every source the paper cites for this claim was checked and supports it.
In the paper
“We aggregated these monthly flows, resulting in mean annual moisture flows between all Amazonian countries during 2008–2017.”
§ Critical transitions in the Amazon forest system > Methods > Atmospheric moisture tracking
What the sources say
- Supportedcites Tuinenburg et al. [134] Tuinenburg, O. A., Theeuwen, J. J. E. & Staal, A. High-resolution global atmospheric moisture connections from evaporation to precipitation. Earth Syst. Sci. Data 12, 3177–3188 (2020). source
The Introduction describes a global dataset of pairwise moisture flows with monthly multi-annual mean footprints for 2008–2017. The citing authors describe aggregating those flows into annual flows between Amazonian countries as their own step, not as a result reported by Tuinenburg et al. (LLM, conf=0.93)
plain- Asserted: passes — The authors put it forward as true.
- Checkable: passes — It can be checked against evidence.
- Load-bearing: passes — The paper’s conclusions depend on it.
- Based: passes — The paper gives a reason why it holds.
Probably not a substantial claim.
- Supported
In the paper
“Aircraft measurements of vertical carbon flux between the forest and atmosphere reveal how southeastern forests are already emitting more carbon than they absorb, probably because of deforestation and fire48.”
§ Critical transitions in the Amazon forest system > Global change impacts on forest resilience > Disturbance regimes
What the sources say
- Not checked — no full text of the sourcecites [48] Gatti, L. V. et al. Amazonia as a carbon source linked to deforestation and climate change. Nature 595, 388–393 (2021). source
hedgedconditional- Asserted: passes — The authors put it forward as true.
- Checkable: passes — It can be checked against evidence.
- Load-bearing: unclear — It is unclear whether the paper’s conclusions depend on it.
- Based: passes — The paper gives a reason why it holds.
It may state two separate claims as one.
A result the paper reports from its own data — it cites no other source for it, so there is none to check. The quote shows it is in the paper.
In the paper
“Moreover, 47% of the biome has a moderate transition potential (more than 1 disturbance type; Fig. 1f), including relatively remote parts of the central Amazon where warming trends and repeated extreme drought events overlap (Fig. 1a,c).”
§ Critical transitions in the Amazon forest system > Global change impacts on forest resilience > Disturbance regimes
plaincorrelational- Asserted: passes — The authors put it forward as true.
- Checkable: passes — It can be checked against evidence.
- Load-bearing: passes — The paper’s conclusions depend on it.
- Based: passes — The paper gives a reason why it holds.
It may state two separate claims as one.
- Rests on an assumption: The additive sum of warming/drying slopes, ecosystem stability classes, drought impacts, road proximity, and governance can serve as a proxy for ecosystem transition potential.
A result the paper reports from its own data — it cites no other source for it, so there is none to check. The quote shows it is in the paper.
In the paper
“We found that 10% of the Amazon forest biome has a relatively high transition potential (more than 2 disturbance types; Fig. 1f), including bistable forests that could transition into a low tree cover state near savannas of Guyana, Venezuela, Colombia and Peru, as well as stable forests that could transition into alternative compositional states within the central Amazon, such as along the BR319”
§ Critical transitions in the Amazon forest system > Global change impacts on forest resilience > Disturbance regimes
hedgedconditional- Asserted: passes — The authors put it forward as true.
- Checkable: passes — It can be checked against evidence.
- Load-bearing: passes — The paper’s conclusions depend on it.
- Based: passes — The paper gives a reason why it holds.
It may state two separate claims as one.
- Rests on an assumption: The additive sum of warming/drying slopes, ecosystem stability classes, drought impacts, road proximity, and governance can serve as a proxy for ecosystem transition potential.
A result the paper reports from its own data — it cites no other source for it, so there is none to check. The quote shows it is in the paper.
In the paper
“By contrast, large remote areas covering 53% of the biome have low transition potential, mostly reflecting the distribution of protected areas and Indigenous territories (Fig. 1e).”
§ Critical transitions in the Amazon forest system > Global change impacts on forest resilience > Disturbance regimes
plaindirect- Asserted: passes — The authors put it forward as true.
- Checkable: passes — It can be checked against evidence.
- Load-bearing: passes — The paper’s conclusions depend on it.
- Based: passes — The paper gives a reason why it holds.
It may state two separate claims as one.
- Rests on an assumption: The additive sum of warming/drying slopes, ecosystem stability classes, drought impacts, road proximity, and governance can serve as a proxy for ecosystem transition potential.
A result the paper reports from its own data — it cites no other source for it, so there is none to check. The quote shows it is in the paper.
In the paper
“Our reanalysis of the Amazon basin (Extended Data Fig. 1d) suggests a critical threshold at eight months of DSL (Fig. 3a), with a bistability range between approximately five and eight months (see Extended Data Table 2 for uncertainty ranges), in which forests are more likely to collapse when severely disturbed than forests in areas with DSL below five months.”
§ Critical transitions in the Amazon forest system > Five critical drivers of water stress > Dry season length
hedgedconditional- Asserted: passes — The authors put it forward as true.
- Checkable: passes — It can be checked against evidence.
- Load-bearing: passes — The paper’s conclusions depend on it.
- Based: passes — The paper gives a reason why it holds.
It may state two separate claims as one.
A result the paper reports from its own data — it cites no other source for it, so there is none to check. The quote shows it is in the paper.
In the paper
“Our reanalysis of the Amazon basin (Extended Data Fig. 1c) confirms the critical threshold at approximately −450 mm in the MCWD (Fig. 3a), and suggests a bistability range between approximately −350 and −450 mm (see Extended Data Table 2 for uncertainty ranges), in which forests are more likely to collapse when severely disturbed than forests in areas with MCWD below −350 mm.”
§ Critical transitions in the Amazon forest system > Five critical drivers of water stress > Rainfall seasonality intensity
hedgedconditional- Asserted: passes — The authors put it forward as true.
- Checkable: passes — It can be checked against evidence.
- Load-bearing: passes — The paper’s conclusions depend on it.
- Based: passes — The paper gives a reason why it holds.
It may state two separate claims as one.
A conclusion the paper draws from its own results — it cites no other source for it, so there is none to check. The quote shows it is in the paper.
In the paper
“Long existing feedbacks between the forest and environmental conditions are being replaced by novel feedbacks that modify ecosystem resilience, increasing the risk of critical transition.”
§ Critical transitions in the Amazon forest system > Abstract
plaindirect- Asserted: passes — The authors put it forward as true.
- Checkable: passes — It can be checked against evidence.
- Load-bearing: passes — The paper’s conclusions depend on it.
- Based: passes — The paper gives a reason why it holds.
It may state two separate claims as one.
A conclusion the paper draws from its own results — it cites no other source for it, so there is none to check. The quote shows it is in the paper.
In the paper
“Nonetheless, both model ensembles agree that bistable regions will expand deeper into the Amazon, increasing the risk of critical transitions due to disturbances (as implied by the existence of alternative stable states; Extended Data Fig. 1).”
§ Critical transitions in the Amazon forest system > Global change impacts on forest resilience > Regional climatic conditions
plaindirect- Asserted: passes — The authors put it forward as true.
- Checkable: passes — It can be checked against evidence.
- Load-bearing: passes — The paper’s conclusions depend on it.
- Based: passes — The paper gives a reason why it holds.
It may state two separate claims as one.
In the paper
“The Amazon is home to more than 40 million people, including 2.2 million Indigenous peoples of more than 300 ethnicities, as well as afrodescendent and local traditional communities1.”
§ Critical transitions in the Amazon forest system > Main
What the sources say
- Not checked yetcites [1] Science Panel for the Amazon. Amazon Assessment Report 2021 (2021); www.theamazonwewant.org/amazon-assessment-report-2021/.
plain- Asserted: passes — The authors put it forward as true.
- Checkable: passes — It can be checked against evidence.
- Load-bearing: fails — The paper’s conclusions may not depend on it.
- Based: passes — The paper gives a reason why it holds.
Probably not a substantial claim. The paper’s conclusions may not depend on it. It may state two separate claims as one.
None of the sources cited for this claim have been checked yet.
In the paper
“The Amazon forest holds more than 10% of Earth’s terrestrial biodiversity, stores an amount of carbon equivalent to 15–20 years of global CO2 emissions (150–200 Pg C), and has a net cooling effect (from evapotranspiration) that helps to stabilize the Earth’s climate1–3.”
§ Critical transitions in the Amazon forest system > Main
What the sources say
- Not checked yetcites [1] Science Panel for the Amazon. Amazon Assessment Report 2021 (2021); www.theamazonwewant.org/amazon-assessment-report-2021/.
- Not checked yetcites [2] IPCC. Climate Change 2021: The Physical Science Basis (eds Masson-Delmotte, V. et al.) https://www.ipcc.ch/report/ar6/wg1/#FullReport (Cambridge Univ. Press, 2021).
- Not checked — no full text of the sourcecites [3] Armstrong McKay, D. et al. Exceeding 1.5 °C global warming could trigger multiple climate tipping points. Science 377, abn7950 (2022). source
plain- Asserted: passes — The authors put it forward as true.
- Checkable: passes — It can be checked against evidence.
- Load-bearing: unclear — It is unclear whether the paper’s conclusions depend on it.
- Based: passes — The paper gives a reason why it holds.
It may state two separate claims as one.
None of the sources cited for this claim have been checked yet.
In the paper
“Recent climate models of the 6th phase of the Coupled Model Intercomparison Project (CMIP6) agree that in the coming decades, rainfall conditions will become more seasonal in the eastern and southern Amazonian regions, and temperatures will become higher across the entire Amazon1,2.”
§ Critical transitions in the Amazon forest system > Global change impacts on forest resilience > Regional climatic conditions
What the sources say
- Not checked yetcites [1] Science Panel for the Amazon. Amazon Assessment Report 2021 (2021); www.theamazonwewant.org/amazon-assessment-report-2021/.
- Not checked yetcites [2] IPCC. Climate Change 2021: The Physical Science Basis (eds Masson-Delmotte, V. et al.) https://www.ipcc.ch/report/ar6/wg1/#FullReport (Cambridge Univ. Press, 2021).
plaindirect- Asserted: passes — The authors put it forward as true.
- Checkable: passes — It can be checked against evidence.
- Load-bearing: passes — The paper’s conclusions depend on it.
- Based: passes — The paper gives a reason why it holds.
It may state two separate claims as one.
In the paper
“When stressing conditions intensify, some ecosystems may change their equilibrium state gradually, whereas others may shift abruptly between alternative stable states10.”
§ Critical transitions in the Amazon forest system > Theory and concepts
What the sources say
- Not checked — no full text of the sourcecites [10] Scheffer, M., Carpenter, S., Foley, J. A., Folke, C. & Walker, B. Catastrophic shifts in ecosystems. Nature 413, 591–596 (2001). source
hedgedconditional- Asserted: passes — The authors put it forward as true.
- Checkable: passes — It can be checked against evidence.
- Load-bearing: passes — The paper’s conclusions depend on it.
- Based: passes — The paper gives a reason why it holds.
It may state two separate claims as one.
A conclusion the paper draws from its own results — it cites no other source for it, so there is none to check. The quote shows it is in the paper.
In the paper
“If these trends continue, ecosystem stability (as in Extended Data Fig. 1) will probably change in parts of the Amazon by 2050, reshaping forest resilience to disturbances (Fig. 1b and Extended Data Fig. 3b).”
§ Critical transitions in the Amazon forest system > Global change impacts on forest resilience > Regional climatic conditions
hedgedconditional- Asserted: passes — The authors put it forward as true.
- Checkable: passes — It can be checked against evidence.
- Load-bearing: passes — The paper’s conclusions depend on it.
- Based: passes — The paper gives a reason why it holds.
It may state two separate claims as one.
In the paper
“By 2050, models project that a significant increase in the number of consecutive dry days by 10−30 days and in annual maximum temperatures by 2–4 °C, depending on the greenhouse gas emission scenario2.”
§ Critical transitions in the Amazon forest system > Global change impacts on forest resilience > Regional climatic conditions
What the sources say
- Not checked yetcites [2] IPCC. Climate Change 2021: The Physical Science Basis (eds Masson-Delmotte, V. et al.) https://www.ipcc.ch/report/ar6/wg1/#FullReport (Cambridge Univ. Press, 2021).
plainconditional- Asserted: passes — The authors put it forward as true.
- Checkable: passes — It can be checked against evidence.
- Load-bearing: passes — The paper’s conclusions depend on it.
- Based: passes — The paper gives a reason why it holds.
It may state two separate claims as one.
None of the sources cited for this claim have been checked yet.
In the paper
“The Amazon forest holds more than 10% of Earth’s terrestrial biodiversity, stores an amount of carbon equivalent to 15–20 years of global CO2 emissions (150–200 Pg C), and has a net cooling effect (from evapotranspiration) that helps to stabilize the Earth’s climate1–3.”
§ Critical transitions in the Amazon forest system > Main
What the sources say
- Not checked yetcites [1] Science Panel for the Amazon. Amazon Assessment Report 2021 (2021); www.theamazonwewant.org/amazon-assessment-report-2021/.
- Not checked yetcites [2] IPCC. Climate Change 2021: The Physical Science Basis (eds Masson-Delmotte, V. et al.) https://www.ipcc.ch/report/ar6/wg1/#FullReport (Cambridge Univ. Press, 2021).
- Not checked — no full text of the sourcecites [3] Armstrong McKay, D. et al. Exceeding 1.5 °C global warming could trigger multiple climate tipping points. Science 377, abn7950 (2022). source
plain- Asserted: passes — The authors put it forward as true.
- Checkable: passes — It can be checked against evidence.
- Load-bearing: fails — The paper’s conclusions may not depend on it.
- Based: passes — The paper gives a reason why it holds.
Probably not a substantial claim. The paper’s conclusions may not depend on it.
The paper states this without a source or data behind it here, so there is nothing to check it against. The quote shows it is in the paper.
In the paper
“Tropical terrestrial ecosystems are a well-known case in which critical transitions between alternative stable states may occur (Extended Data Fig. 1).”
§ Critical transitions in the Amazon forest system > Theory and concepts
boostedconditional- Asserted: passes — The authors put it forward as true.
- Checkable: passes — It can be checked against evidence.
- Load-bearing: passes — The paper’s conclusions depend on it.
- Based: fails — The paper may give no reason why it holds.
Probably not a substantial claim. The paper may give no reason why it holds.
None of the sources cited for this claim have been checked yet.
In the paper
“Human greenhouse gas emissions continue to intensify global warming, but the warming rate also depends on feedbacks in the climate system that remain uncertain2,3.”
§ Critical transitions in the Amazon forest system > Global change impacts on forest resilience > Regional climatic conditions
What the sources say
- Not checked yetcites [2] IPCC. Climate Change 2021: The Physical Science Basis (eds Masson-Delmotte, V. et al.) https://www.ipcc.ch/report/ar6/wg1/#FullReport (Cambridge Univ. Press, 2021).
- Not checked — no full text of the sourcecites [3] Armstrong McKay, D. et al. Exceeding 1.5 °C global warming could trigger multiple climate tipping points. Science 377, abn7950 (2022). source
plaindirect- Asserted: passes — The authors put it forward as true.
- Checkable: passes — It can be checked against evidence.
- Load-bearing: fails — The paper’s conclusions may not depend on it.
- Based: passes — The paper gives a reason why it holds.
Probably not a substantial claim. The paper’s conclusions may not depend on it. It may state two separate claims as one.
In the paper
“We also included protected areas and Indigenous territories as areas with high forest governance, where deforestation and fire regimes are among the lowest within the Amazon49 (Fig. 1e).”
§ Critical transitions in the Amazon forest system > Global change impacts on forest resilience > Disturbance regimes
What the sources say
- Not checked — no full text of the sourcecites [49] Nepstad, D. et al. Inhibition of Amazon deforestation and fire by parks and Indigenous lands: inhibition of Amazon deforestation and fire. Conserv. Biol. 20, 65–73 (2006). source
plaincorrelational- Asserted: passes — The authors put it forward as true.
- Checkable: passes — It can be checked against evidence.
- Load-bearing: unclear — It is unclear whether the paper’s conclusions depend on it.
- Based: passes — The paper gives a reason why it holds.
It may state two separate claims as one.
In the paper
“Future changes in rainfall regimes will probably affect hydrological regimes66, exposing plateau (hilltop) forests to unprecedented water stress, and floodplain forests to extended floods, droughts and wildfires.”
§ Critical transitions in the Amazon forest system > Local versus systemic transition > Environmental heterogeneity
What the sources say
- Not checked — no full text of the sourcecites [66] Marengo, J. A. & Espinoza, J. C. Extreme seasonal droughts and floods in Amazonia: causes, trends and impacts. Int. J. Climatol. 36, 1033–1050 (2016). source
hedgedconditional- Asserted: passes — The authors put it forward as true.
- Checkable: passes — It can be checked against evidence.
- Load-bearing: unclear — It is unclear whether the paper’s conclusions depend on it.
- Based: passes — The paper gives a reason why it holds.
It may state two separate claims as one.
In the paper
“Rising atmospheric CO2 concentrations are expected to increase the photosynthetic rates of trees, accelerating forest growth and biomass accumulation on a global scale52.”
§ Critical transitions in the Amazon forest system > Global change impacts on forest resilience > CO2 fertilization
What the sources say
- Not checked — no full text of the sourcecites [52] Ainsworth, E. A. & Long, S. P. What have we learned from 15 years of free‐air CO2 enrichment (FACE)? A meta‐analytic review of the responses of photosynthesis, canopy properties and plant production to rising CO2. New Phytol. 165, 351–372 (2005). source
hedgedconditional- Asserted: passes — The authors put it forward as true.
- Checkable: passes — It can be checked against evidence.
- Load-bearing: fails — The paper’s conclusions may not depend on it.
- Based: passes — The paper gives a reason why it holds.
Probably not a substantial claim. The paper’s conclusions may not depend on it.
A conclusion the paper draws from its own results — it cites no other source for it, so there is none to check. The quote shows it is in the paper.
In the paper
“The impacts of these pervasive disturbances on biodiversity and on IPLCs will probably affect ecosystem adaptability (Box 1), and consequently forest resilience to global changes.”
§ Critical transitions in the Amazon forest system > Global change impacts on forest resilience > Disturbance regimes
hedgedconditional- Asserted: passes — The authors put it forward as true.
- Checkable: passes — It can be checked against evidence.
- Load-bearing: passes — The paper’s conclusions depend on it.
- Based: passes — The paper gives a reason why it holds.
It may state two separate claims as one.
What the paper did — it cites no source for this, so there is none to check. The quote shows it is in the paper.
In the paper
“This simple additive approach does not consider synergies between compounding disturbances that could trigger unexpected ecosystem transitions.”
§ Critical transitions in the Amazon forest system > Global change impacts on forest resilience > Disturbance regimes
hedged- Asserted: passes — The authors put it forward as true.
- Checkable: passes — It can be checked against evidence.
- Load-bearing: fails — The paper’s conclusions may not depend on it.
- Based: passes — The paper gives a reason why it holds.
Probably not a substantial claim. The paper’s conclusions may not depend on it.
A conclusion the paper draws from its own results — it cites no other source for it, so there is none to check. The quote shows it is in the paper.
In the paper
“Northwestern forests rarely experience water stress, which makes them relatively more resilient than southeastern forests that may experience water stress in the dry season, and therefore are more likely to shift into a low tree cover state.”
§ Critical transitions in the Amazon forest system > Local versus systemic transition > Environmental heterogeneity
hedgeddirect- Asserted: passes — The authors put it forward as true.
- Checkable: passes — It can be checked against evidence.
- Load-bearing: passes — The paper’s conclusions depend on it.
- Based: passes — The paper gives a reason why it holds.
It may state two separate claims as one.
- Rests on an assumption: Northwestern Amazon forests rarely experience water stress.
A conclusion the paper draws from its own results — it cites no other source for it, so there is none to check. The quote shows it is in the paper.
In the paper
“Forest responses depend on scale, with resilience possibly increasing at the local scale on relatively more fertile soils, but decreasing at the regional scale due to reduced atmospheric moisture flow.”
§ Critical transitions in the Amazon forest system > Global change impacts on forest resilience > CO2 fertilization
hedgedconditional- Asserted: passes — The authors put it forward as true.
- Checkable: passes — It can be checked against evidence.
- Load-bearing: passes — The paper’s conclusions depend on it.
- Based: passes — The paper gives a reason why it holds.
It may state two separate claims as one.
In the paper
“Considering that half of Amazonian tree species are estimated to become threatened (IUCN Red list) by 2050 owing to climate change, deforestation and degradation8, biodiversity losses could contribute to further reducing forest resilience.”
§ Critical transitions in the Amazon forest system > Global change impacts on forest resilience > Disturbance regimes
What the sources say
- Not checked — no full text of the sourcecites [8] Gomes, V. H. F., Vieira, I. C. G., Salomão, R. P. & ter Steege, H. Amazonian tree species threatened by deforestation and climate change. Nat. Clim. Change 9, 547–553 (2019). source
hedgedconditional- Asserted: passes — The authors put it forward as true.
- Checkable: passes — It can be checked against evidence.
- Load-bearing: unclear — It is unclear whether the paper’s conclusions depend on it.
- Based: passes — The paper gives a reason why it holds.
It may state two separate claims as one.
A conclusion the paper draws from its own results — it cites no other source for it, so there is none to check. The quote shows it is in the paper.
In the paper
“In the past, many internal mechanisms have probably contributed to ecosystem adaptability, allowing Amazonian forests to persist during times of climate change.”
§ Critical transitions in the Amazon forest system > Global change impacts on forest resilience > Disturbance regimes
hedgedconditional- Asserted: passes — The authors put it forward as true.
- Checkable: fails — It may be too vague to check against evidence.
- Load-bearing: fails — The paper’s conclusions may not depend on it.
- Based: fails — The paper may give no reason why it holds.
Probably not a substantial claim. It may be too vague to check against evidence. The paper’s conclusions may not depend on it. The paper may give no reason why it holds.
A conclusion the paper draws from its own results — it cites no other source for it, so there is none to check. The quote shows it is in the paper.
In the paper
“In sum, owing to multiple interacting factors, potential responses of Amazonian forests to CO2 fertilization are still poorly understood.”
§ Critical transitions in the Amazon forest system > Global change impacts on forest resilience > CO2 fertilization
plain- Asserted: passes — The authors put it forward as true.
- Checkable: passes — It can be checked against evidence.
- Load-bearing: fails — The paper’s conclusions may not depend on it.
- Based: fails — The paper may give no reason why it holds.
Probably not a substantial claim. The paper’s conclusions may not depend on it. The paper may give no reason why it holds.
A conclusion the paper draws from its own results — it cites no other source for it, so there is none to check. The quote shows it is in the paper.
In the paper
“In this section we synthesize two of these internal mechanisms, which are now being undermined by global change.”
§ Critical transitions in the Amazon forest system > Global change impacts on forest resilience > Disturbance regimes
plaindirect- Asserted: passes — The authors put it forward as true.
- Checkable: passes — It can be checked against evidence.
- Load-bearing: passes — The paper’s conclusions depend on it.
- Based: fails — The paper may give no reason why it holds.
Probably not a substantial claim. The paper may give no reason why it holds.
In the paper
“Environmental heterogeneity can reduce the risk of systemic transition (large-scale forest collapse) because when stressing conditions intensify (for example, rainfall declines), heterogeneous forests may transition gradually (first the less resilient forest patches, followed by the more resilient ones), compared to homogeneous forests that may transition more abruptly17 (all forests transition in”
§ Critical transitions in the Amazon forest system > Local versus systemic transition > Environmental heterogeneity
What the sources say
- Not checked — no full text of the sourcecites [17] Scheffer, M. et al. Anticipating critical transitions. Science 338, 344–348 (2012). source
hedgedconditional- Asserted: passes — The authors put it forward as true.
- Checkable: passes — It can be checked against evidence.
- Load-bearing: passes — The paper’s conclusions depend on it.
- Based: passes — The paper gives a reason why it holds.
It may state two separate claims as one.
A conclusion the paper draws from its own results — it cites no other source for it, so there is none to check. The quote shows it is in the paper.
In the paper
“At global scales, driver 1 (global warming) intensifies with greenhouse gas emissions, including emissions from deforestation.”
§ Critical transitions in the Amazon forest system > Five critical drivers of water stress > Global warming
plaindirect- Asserted: passes — The authors put it forward as true.
- Checkable: passes — It can be checked against evidence.
- Load-bearing: fails — The paper’s conclusions may not depend on it.
- Based: fails — The paper may give no reason why it holds.
Probably not a substantial claim. The paper’s conclusions may not depend on it. The paper may give no reason why it holds.
In the paper
“White-sand savannas are ancient ecosystems that occur in patches within the Amazon forest biome, particularly in seasonally waterlogged or flooded areas94.”
§ Critical transitions in the Amazon forest system > Three alternative ecosystem trajectories > White-sand savanna
What the sources say
- Not checked — no full text of the sourcecites [94] Adeney, J. M., Christensen, N. L., Vicentini, A. & Cohn‐Haft, M. White‐sand ecosystems in Amazonia. Biotropica 48, 7–23 (2016). source
plain- Asserted: passes — The authors put it forward as true.
- Checkable: passes — It can be checked against evidence.
- Load-bearing: unclear — It is unclear whether the paper’s conclusions depend on it.
- Based: passes — The paper gives a reason why it holds.
It may state two separate claims as one.
A conclusion the paper draws from its own results — it cites no other source for it, so there is none to check. The quote shows it is in the paper.
In the paper
“Degraded forests are usually dominated by native opportunistic species, and their increasing expansion over disturbed forests could affect Amazonian functioning and resilience in the future.”
§ Critical transitions in the Amazon forest system > Three alternative ecosystem trajectories > Degraded forest
hedgedconditional- Asserted: passes — The authors put it forward as true.
- Checkable: passes — It can be checked against evidence.
- Load-bearing: unclear — It is unclear whether the paper’s conclusions depend on it.
- Based: passes — The paper gives a reason why it holds.
It may state two separate claims as one.
A conclusion the paper draws from its own results — it cites no other source for it, so there is none to check. The quote shows it is in the paper.
In the paper
“In reality, tree community adaptation to a heterogenous and dynamic environment feeds into the whole-system dynamics, and not covering such aspects makes a true Amazon tipping assessment more challenging.”
§ Critical transitions in the Amazon forest system > Prospects for modelling Amazon forest dynamics
plaindirect- Asserted: passes — The authors put it forward as true.
- Checkable: unclear — It is unclear whether it could be checked against evidence.
- Load-bearing: passes — The paper’s conclusions depend on it.
- Based: passes — The paper gives a reason why it holds.
It may state two separate claims as one.
In the paper
“For now, most ESMs do not simulate a dynamic vegetation cover (Supplementary Table 1) and biomes are represented based on few plant functional types, basically simulating monocultures on the biome level.”
§ Critical transitions in the Amazon forest system > Prospects for modelling Amazon forest dynamics
What the sources say
- Not matchedcites Supplementary Table 1
Couldn’t be matched to a paper in Crossref, so it can’t be checked.
plain- Asserted: passes — The authors put it forward as true.
- Checkable: passes — It can be checked against evidence.
- Load-bearing: passes — The paper’s conclusions depend on it.
- Based: passes — The paper gives a reason why it holds.
It may state two separate claims as one.
- Not matched
In the paper
“Similar to lianas, bamboos self-perpetuate by causing physical damage to trees and have been expanding over burnt forests in the region92.”
§ Critical transitions in the Amazon forest system > Three alternative ecosystem trajectories > Degraded forest
What the sources say
- Not checked — no full text of the sourcecites [92] da Silva, S. S. et al. Increasing bamboo dominance in southwestern Amazon forests following intensification of drought-mediated fires. For. Ecol. Manag. 490, 119139 (2021). source
plaindirect- Asserted: passes — The authors put it forward as true.
- Checkable: passes — It can be checked against evidence.
- Load-bearing: unclear — It is unclear whether the paper’s conclusions depend on it.
- Based: passes — The paper gives a reason why it holds.
It may state two separate claims as one.
In the paper
“However, most updated CMIP6 models agree that droughts in the Amazon region will increase in length and intensity, and that exceptionally hot droughts will become more common2, creating conditions that will probably boost other types of disturbances, such as large and destructive forest fires76,77.”
§ Critical transitions in the Amazon forest system > Five critical drivers of water stress > Global warming
What the sources say
- Not checked yetcites [2] IPCC. Climate Change 2021: The Physical Science Basis (eds Masson-Delmotte, V. et al.) https://www.ipcc.ch/report/ar6/wg1/#FullReport (Cambridge Univ. Press, 2021).
plaindirect- Asserted: passes — The authors put it forward as true.
- Checkable: passes — It can be checked against evidence.
- Load-bearing: passes — The paper’s conclusions depend on it.
- Based: passes — The paper gives a reason why it holds.
It may state two separate claims as one.
What the paper did — it cites no source for this, so there is none to check. The quote shows it is in the paper.
In the paper
“We followed the precautionary principle and considered the most conservative thresholds within the ranges, when confidence was low.”
§ Critical transitions in the Amazon forest system > Five critical drivers of water stress > Global warming
plain- Asserted: passes — The authors put it forward as true.
- Checkable: passes — It can be checked against evidence.
- Load-bearing: fails — The paper’s conclusions may not depend on it.
- Based: passes — The paper gives a reason why it holds.
Probably not a substantial claim. The paper’s conclusions may not depend on it.
What the paper did — it cites no source for this, so there is none to check. The quote shows it is in the paper.
In the paper
“Based on sensitivity tests (see below), we chose the intermediate values of the sensitivity parameter for each analysis, which resulted in the critical thresholds most similar to the ones previously published in the literature.”
§ Critical transitions in the Amazon forest system > Methods > Potential analysis
plaindirect- Asserted: passes — The authors put it forward as true.
- Checkable: passes — It can be checked against evidence.
- Load-bearing: fails — The paper’s conclusions may not depend on it.
- Based: passes — The paper gives a reason why it holds.
Probably not a substantial claim. The paper’s conclusions may not depend on it.
In the paper
“The model tracks the atmospheric trajectories of parcels of moisture, updates their coordinates at each time step of 0.1 h and allocates moisture to a target location in case of precipitation.”
§ Critical transitions in the Amazon forest system > Methods > Atmospheric moisture tracking
What the sources say
- Not matchedcites UTrack132
Couldn’t be matched to a paper in Crossref, so it can’t be checked.
plain- Asserted: passes — The authors put it forward as true.
- Checkable: passes — It can be checked against evidence.
- Load-bearing: fails — The paper’s conclusions may not depend on it.
- Based: passes — The paper gives a reason why it holds.
Probably not a substantial claim. The paper’s conclusions may not depend on it. It may state two separate claims as one.
- Not matched
The paper relies on this without support.
The additive sum of warming/drying slopes, ecosystem stability classes, drought impacts, road proximity, and governance can serve as a proxy for ecosystem transition potential.
“Transition potential represents the sum of: (1) slopes of dry season mean temperature (as in a, multiplied by 10); (2) ecosystem stability classes estimated for year 2050 (as in b), with 0 for stable forest, 1 for bistable and 2 for stable savanna; (3) accumulated impacts from extreme drought events, with 0.2 for each event; (4) road proximity as proxy for degrading activities, with 1 for pixels”
The paper relies on this without support.
Northwestern Amazon forests rarely experience water stress.
“Northwestern forests rarely experience water stress, which makes them relatively more resilient than southeastern forests that may experience water stress in the dry season, and therefore are more likely to shift into a low tree cover state.”
The paper relies on this without support.
Protected areas and Indigenous territories have lower exposure to human land-use disturbances such as deforestation and forest fires.
“protected areas and Indigenous territories as areas with lower exposure to human (land use) disturbances, such as deforestation and forest fires, with −1 for pixels inside these areas.”
Claims other papers make about this one
Each is checked against this paper’s own text: does it say what the citing paper says it does?
The source backs part of the claim, not all of it — or backs it for a different population, condition or comparison.
In the citing paper
“From an ecological standpoint, they represent two frontsand frontierswhere the Amazon is being shrunk and risks crossing a tipping point (Flores et al., 2024).”
From Beyond the “supply chain” framing: Cattle ranching as a vanishing mediator of deforestation and dispossession in the Brazilian and Colombian Amazon (2026) · cites this paper as Flores et al., 2024
Experimental — accuracy not yet measured
Citations
Cites
Hersbach, H., Bell, B., Berrisford, P., Hirahara, S., Horányi, A., Muñoz‐Sabater, J., Nicolas, J., Peubey, C., Radu, R., Schepers, D., et al. (2020) · Quarterly Journal of the Royal Meteorological Society · doi:10.1002/qj.3803 · Cited by 31,882
A safe operating space for humanity
Rockström, J., Steffen, W., Noone, K., Persson, Å., Chapin, F. S., Lambin, E. F., Lenton, T. M., Scheffer, M., Folke, C., Schellnhuber, H. J., et al. (2009) · Nature · doi:10.1038/461472a · Cited by 13,333
Catastrophic shifts in ecosystems
Scheffer, M., Carpenter, S., Foley, J. A., Folke, C., & Walker, B. (2001) · Nature · doi:10.1038/35098000 · Cited by 7,510
Funk, C. C., Peterson, P. J., Landsfeld, M. F., Pedreros, D. H., Verdin, J. P., Shukla, S., Husak, G. J., Rowland, J., Harrison, L., Hoell, A., et al. (2015) · Scientific Data · doi:10.1038/sdata.2015.66 · Cited by 6,719
Trophic Downgrading of Planet Earth
Estes, J. A., Terborgh, J., Brashares, J. S., Power, M. E., Berger, J., Bond, W. J., Carpenter, S. R., Essington, T. E., Holt, R. D., Jackson, J. B. C., et al. (2011) · Science · doi:10.1126/science.1205106 · Cited by 4,087
Tipping elements in the Earth’s climate system
Lenton, T. M., Held, H., Kriegler, E., Hall, J. W., Lucht, W., Rahmstorf, S., & Schellnhuber, H. J. (2008) · Proceedings of the National Academy of Sciences · doi:10.1073/pnas.0705414105 · Cited by 3,982
Mitchell, T. D., & Jones, P. D. (2005) · International Journal of Climatology · doi:10.1002/joc.1181 · Cited by 3,820
Ainsworth, E. A., & Long, S. P. (2005) · New Phytologist · doi:10.1111/j.1469-8137.2004.01224.x · Cited by 3,624
Amazonia Through Time: Andean Uplift, Climate Change, Landscape Evolution, and Biodiversity
Hoorn, C., Wesselingh, F. P., ter Steege, H., Bermudez, M. A., Mora, A., Sevink, J., Sanmartín, I., Sanchez-Meseguer, A., Anderson, C. L., Figueiredo, J. P., et al. (2010) · Science · doi:10.1126/science.1194585 · Cited by 2,404
Anticipating Critical Transitions
Scheffer, M., Carpenter, S. R., Lenton, T. M., Bascompte, J., Brock, W., Dakos, V., van de Koppel, J., van de Leemput, I. A., Levin, S. A., van Nes, E. H., et al. (2012) · Science · doi:10.1126/science.1225244 · Cited by 2,208
Research works printed but not linked: 3
- IPCC. Climate Change 2021: The Physical Science Basis (eds Masson-Delmotte, V. et al.) https://www.ipcc.ch/report/ar6/wg1/#FullReport (Cambridge Univ. Press, 2021).
- Holling, C. S. Engineering Resilience versus Ecological Resilience (National Academy Press, 1996).
- Silverman, B. W. Density Estimation for Statistics and Data Analysis (Chapman & Hall/CRC Taylor & Francis Group, 1998).
Cited by
Sorted by citations
The 2024 state of the climate report: Perilous times on planet Earth
Ripple, W. J., Wolf, C., Gregg, J. W., Rockström, J., MANN, M. E., Орескес, Н., Lenton, T. M., Rahmstorf, S., Newsome, T. M., Xu, C., et al. (2024) · BioScience · doi:10.1093/biosci/biae087 · Cited by 375
Hydroclimate volatility on a warming Earth
Swain, D. L., Prein, A. F., Abatzoglou, J. T., Albano, C. M., Brunner, M. I., Diffenbaugh, N. S., Singh, D., Skinner, C. B., & Touma, D. (2025) · Nature Reviews Earth & Environment · doi:10.1038/s43017-024-00624-z · Cited by 289
Planetary Boundaries guide humanity’s future on Earth
Rockström, J., Donges, J. F., Fetzer, I., Martin, M. A., Wang‐Erlandsson, L., & Richardson, K. (2024) · Nature Reviews Earth & Environment · doi:10.1038/s43017-024-00597-z · Cited by 276
Human outbreaks of a novel reassortant Oropouche virus in the Brazilian Amazon region
Naveca, F. G., de Almeida, T. A. P., de Souza, V. C., do Nascimento, V. A., Silva, D., Nascimento, F., Mejía, M., de Oliveira, Y. S., Rocha, L., Xavier, N., et al. (2024) · Nature Medicine · doi:10.1038/s41591-024-03300-3 · Cited by 186
Self-citationHuman degradation of tropical moist forests is greater than previously estimated
Bourgoin, C., Ceccherini, G., Girardello, M., Vancutsem, C., Avitabile, V., Beck, P. S. A., Beuchle, R., Blanc, L., Duveiller, G., Migliavacca, M., et al. (2024) · Nature · doi:10.1038/s41586-024-07629-0 · Cited by 192
Metadata
- Authors
- Flores, B. M., Montoya, E., Sakschewski, B., Nascimento, N., Staal, A., Betts, R. A., Levis, C., Lapola, D. M., Esquível-Muelbert, A., Jakovac, C., Nobre, C. A., Oliveira, R. S., Borma, L. S., Nian, D., Boers, N., Hecht, S. B., ter Steege, H., Arieira, J., Lucas, I. L., Berenguer, E., Marengo, J. A., Gatti, L. V., Mattos, C. R. C., & Hirota, M.
- Affiliations
- Universidade Federal de Santa Catarina (BR)
- Leibniz Association (DE)
- Universidade de São Paulo (BR)
- Utrecht University (NL)
- Met Office (GB)
- Universidade Estadual de Campinas (UNICAMP) (BR)
- Instituto Nacional de Pesquisas Espaciais (BR)
- University of California, Los Angeles (US)
- Korea University (KR)
- Princeton University (US)
- Corresponding author
- Flores, Bernardo M.
- Hirota, Marina
- ORCID
- Flores, Bernardo M.
- Montoya, Encarni
- Sakschewski, Boris
- Nascimento, Nathália
- Staal, Arie
- Betts, Richard A.
- Levis, Carolina
- Lapola, David M.
- Esquível-Muelbert, Adriane
- Jakovac, Catarina
- Nobre, Carlos A.
- Oliveira, Rafael S.
- Borma, Laura S.
- Nian, Da
- Boers, Niklas
- Hecht, Susanna B.
- ter Steege, Hans
- Arieira, Julia
- Lucas, Isabella L.
- Berenguer, Erika
- Marengo, José A.
- Gatti, Luciana V.
- Mattos, Caio R. C.
- Hirota, Marina
- Venue
- Nature
- Published
- 2024-02-14
- Volume
- 626
- Issue
- 7999
- Pages
- 555-564
- ISSN
- 0028-0836 (ISSN-L)
- 1476-4687
- PMC
- PMC10866695
- OpenAlex
- W4391809192
- Semantic Scholar
- 0fefce5f790d82e18162dd18ca037b902a92efc7
- Cited by
- 607
- References
- 136
- Citations by year
- 2026: 252 · 2025: 254 · 2024: 101
- FWCI
- 106.58
- Type
- journal article
- Language
- en
- Open access
- hybrid
- doi.org
- Locations
- Nature (publishedVersion, cc-by)
- PubMed Central (publishedVersion, cc-by)
- PubMed (publishedVersion)
- LA Referencia (Red Federada de Repositorios Institucionales de Publicaciones Científicas) (publishedVersion, other-oa)
- RePEc: Research Papers in Economics (submittedVersion)
- DIGITAL.CSIC (Spanish National Research Council (CSIC)) (submittedVersion, cc-by)
- Utrecht University Repository (Utrecht University) (submittedVersion, other-oa)
- eScholarship (California Digital Library) (submittedVersion, cc-by)
- Publication Database PIK (Potsdam Institute for Climate Impact Research (PIK)) (submittedVersion, cc-by)
- University of Birmingham Research Portal (University of Birmingham) (submittedVersion, cc-by)
- Graduate Institute Geneva Institutional Repository (Graduate Institute of International and Development Studies) (submittedVersion)
- The Digital Academic Repository of Naturalis Biodiversity Center (Naturalis Biodiversity Center) (submittedVersion, cc-by)
- Biblioteca Digital da Memória Científica do INPE (National Institute for Space Research) (submittedVersion)
- Funders
- Princeton University
- UK Research and Innovation (NE/V021346/1, 2018-1)
- European Commission (956170, HORIZON2020, 758873, 820970)
- Met Office
- Volkswagen Foundation (956170)
- Fundação de Amparo à Pesquisa do Estado de São Paulo (2014/50848-, 2019/, 2014/, 20/08940-6, 2019/07773‐ 1, 88887, 14/50848-9)
- Coordenação de Aperfeiçoamento de Pessoal de Nível Superior (88887)
- Bundesministerium für Bildung und Forschung (01LS2001A)
- Nederlandse Organisatie voor Wetenschappelijk Onderzoek (VI.Veni.202.170)
- Ministério da Ciência, Tecnologia e Inovação
- Conselho Nacional de Desenvolvimento Científico e Tecnológico (465501/2014-, #465501/2014‐1, 2014-1, 309074/2021‐5, 159440/2018-1)
- Instituto Serrapilheira (Serra‐1709–18983, 1709-18983)
- Foreign, Commonwealth and Development Office
- Natural Environment Research Council (NE/Y003942/1, NE/V021346/1)
- Topics
- Physical Sciences › Environmental Science › Global and Planetary Change › Ecosystem dynamics and resilience
- Physical Sciences › Environmental Science › Global and Planetary Change › Plant Water Relations and Carbon Dynamics
- Physical Sciences › Environmental Science › Global and Planetary Change › Conservation, Biodiversity, and Resource Management
- Keywords
- Amazon rainforest, tipping points, ecosystem resilience, water stress, drought, deforestation, forest fires, climate change, feedback, restoration, greenhouse gas emissions, Anthropocene
- MeSH terms
- Wildfires, Feedback, Trees, Uncertainty, Environmental Restoration and Remediation, Droughts, Global Warming, Forests
About these checks
Registry, retraction, Cites and statistics results are computed, not judged, with one exception: a printed reference that no index lists is read once by a model before it counts as a citation error. Claims are extracted by a model and kept only when their quote appears verbatim in the text; each cited source is then checked, with a model’s help, for whether it says what the claim relies on. Those verdicts can be wrong — read the claim’s quote and the cited source before relying on one.
A language model drew the claims from the paper on 2026-11-03, under version 3 of the claim definition (model deepseek-v4.1-flash, prompt extract-v3).
A second model labelled each claim on 2026-11-03 (model jev-1.13-20260917, definition revision gold-guideline-v0.2).
Cited sources are checked with a language model’s help (gpt-6-sol).
Statistics and arithmetic are recomputed, not judged.
Confidence bands are shown only for fields calibrated on our annotated test set. None is calibrated yet, so no band is shown.
What counts as a claim ›How we measure confidence ›How we check this ›
Are you an author, or do you see a problem with this page? Request a review
