

The DOI matches its Crossref record; 447 of the 450 references it cites were found in a registry or an index; 381 of the 692 sources its claims cite were checked for support.
Synaptic memory and CaMKII
Open accessAbstract
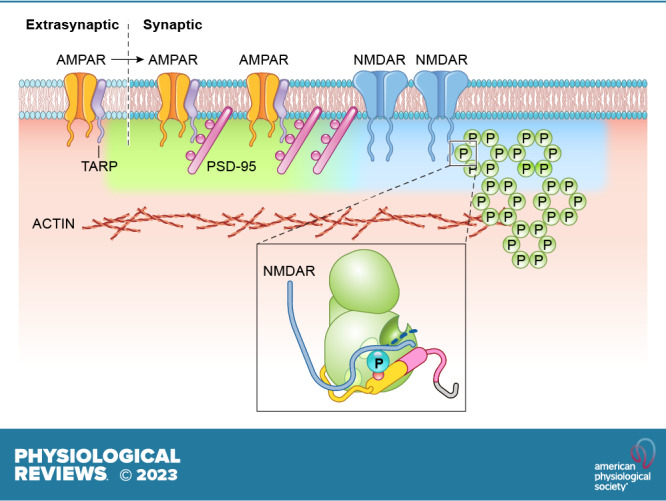
Ca 2+ /calmodulin-dependent protein kinase II (CaMKII) and long-term potentiation (LTP) were discovered within a decade of each other and have been inextricably intertwined ever since. However, like many marriages, it has had its up and downs. Based on the unique biochemical properties of CaMKII, it was proposed as a memory molecule before any physiological linkage was made to LTP. However, as reviewed here, the convincing linkage of CaMKII to synaptic physiology and behavior took many decades. New technologies were critical in this journey, including in vitro brain slices, mouse genetics, single-cell molecular genetics, pharmacological reagents, protein structure, and two-photon microscopy, as were new investigators attracted by the exciting challenge. This review tracks this journey and assesses the state of this marriage 40 years on. The collective literature impels us to propose a relatively simple model for synaptic memory involving the following steps that drive the process: 1) Ca 2+ entry through N-methyl-d-aspartate (NMDA) receptors activates CaMKII. 2) CaMKII undergoes autophosphorylation resulting in constitutive, Ca 2+ -independent activity and exposure of a binding site for the NMDA receptor subunit GluN2B. 3) Active CaMKII translocates to the postsynaptic density (PSD) and binds to the cytoplasmic C-tail of GluN2B. 4) The CaMKII-GluN2B complex initiates a structural rearrangement of the PSD that may involve liquid-liquid phase separation. 5) This rearrangement involves the PSD-95 scaffolding protein, α-amino-3-hydroxy-5-methyl-4-isoxazolepropionic acid receptors (AMPARs), and their transmembrane AMPAR-regulatory protein (TARP) auxiliary subunits, resulting in an accumulation of AMPARs in the PSD that underlies synaptic potentiation. 6) The stability of the modified PSD is maintained by the stability of the CaMKII-GluN2B complex. 7) By a process of subunit exchange or interholoenzyme phosphorylation CaMKII maintains synaptic potentiation in the face of CaMKII protein turnover. There are many other important proteins that participate in enlargement of the synaptic spine or modulation of the steps that drive and maintain the potentiation. In this review we critically discuss the data underlying each of the steps. As will become clear, some of these steps are more firmly grounded than others, and we provide suggestions as to how the evidence supporting these steps can be strengthened or, based on the new data, be replaced. Although the journey has been a long one, the prospect of having a detailed cellular and molecular understanding of learning and memory is at hand.
Overview
AI snapshot
Written from the paper’s full text.
TL;DR
This review argues that CaMKII is both necessary and sufficient for NMDAR-dependent LTP induction and also maintains synaptic strength/memory, with CaMKII-GluN2B binding and T286 autophosphorylation as central mechanisms. It synthesizes biochemical, electrophysiological, imaging, and genetic evidence and highlights unresolved questions about downstream targets and maintenance.
Key findings
- CaMKII inhibition blocks LTP induction; constitutively active CaMKII enhances AMPAR EPSCs roughly two- to threefold, selectively over NMDAR EPSCs, and occludes LTP.
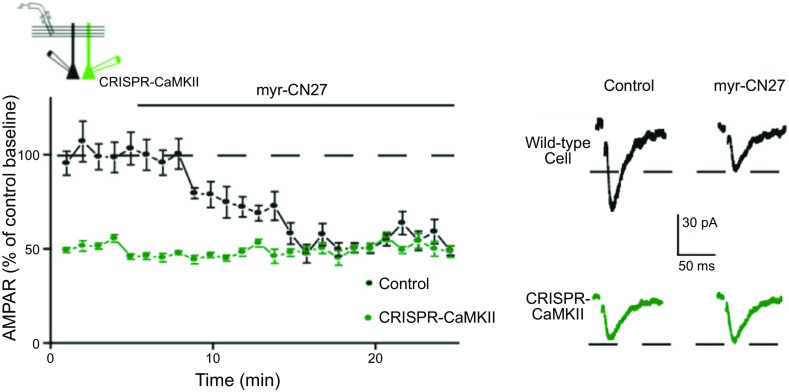
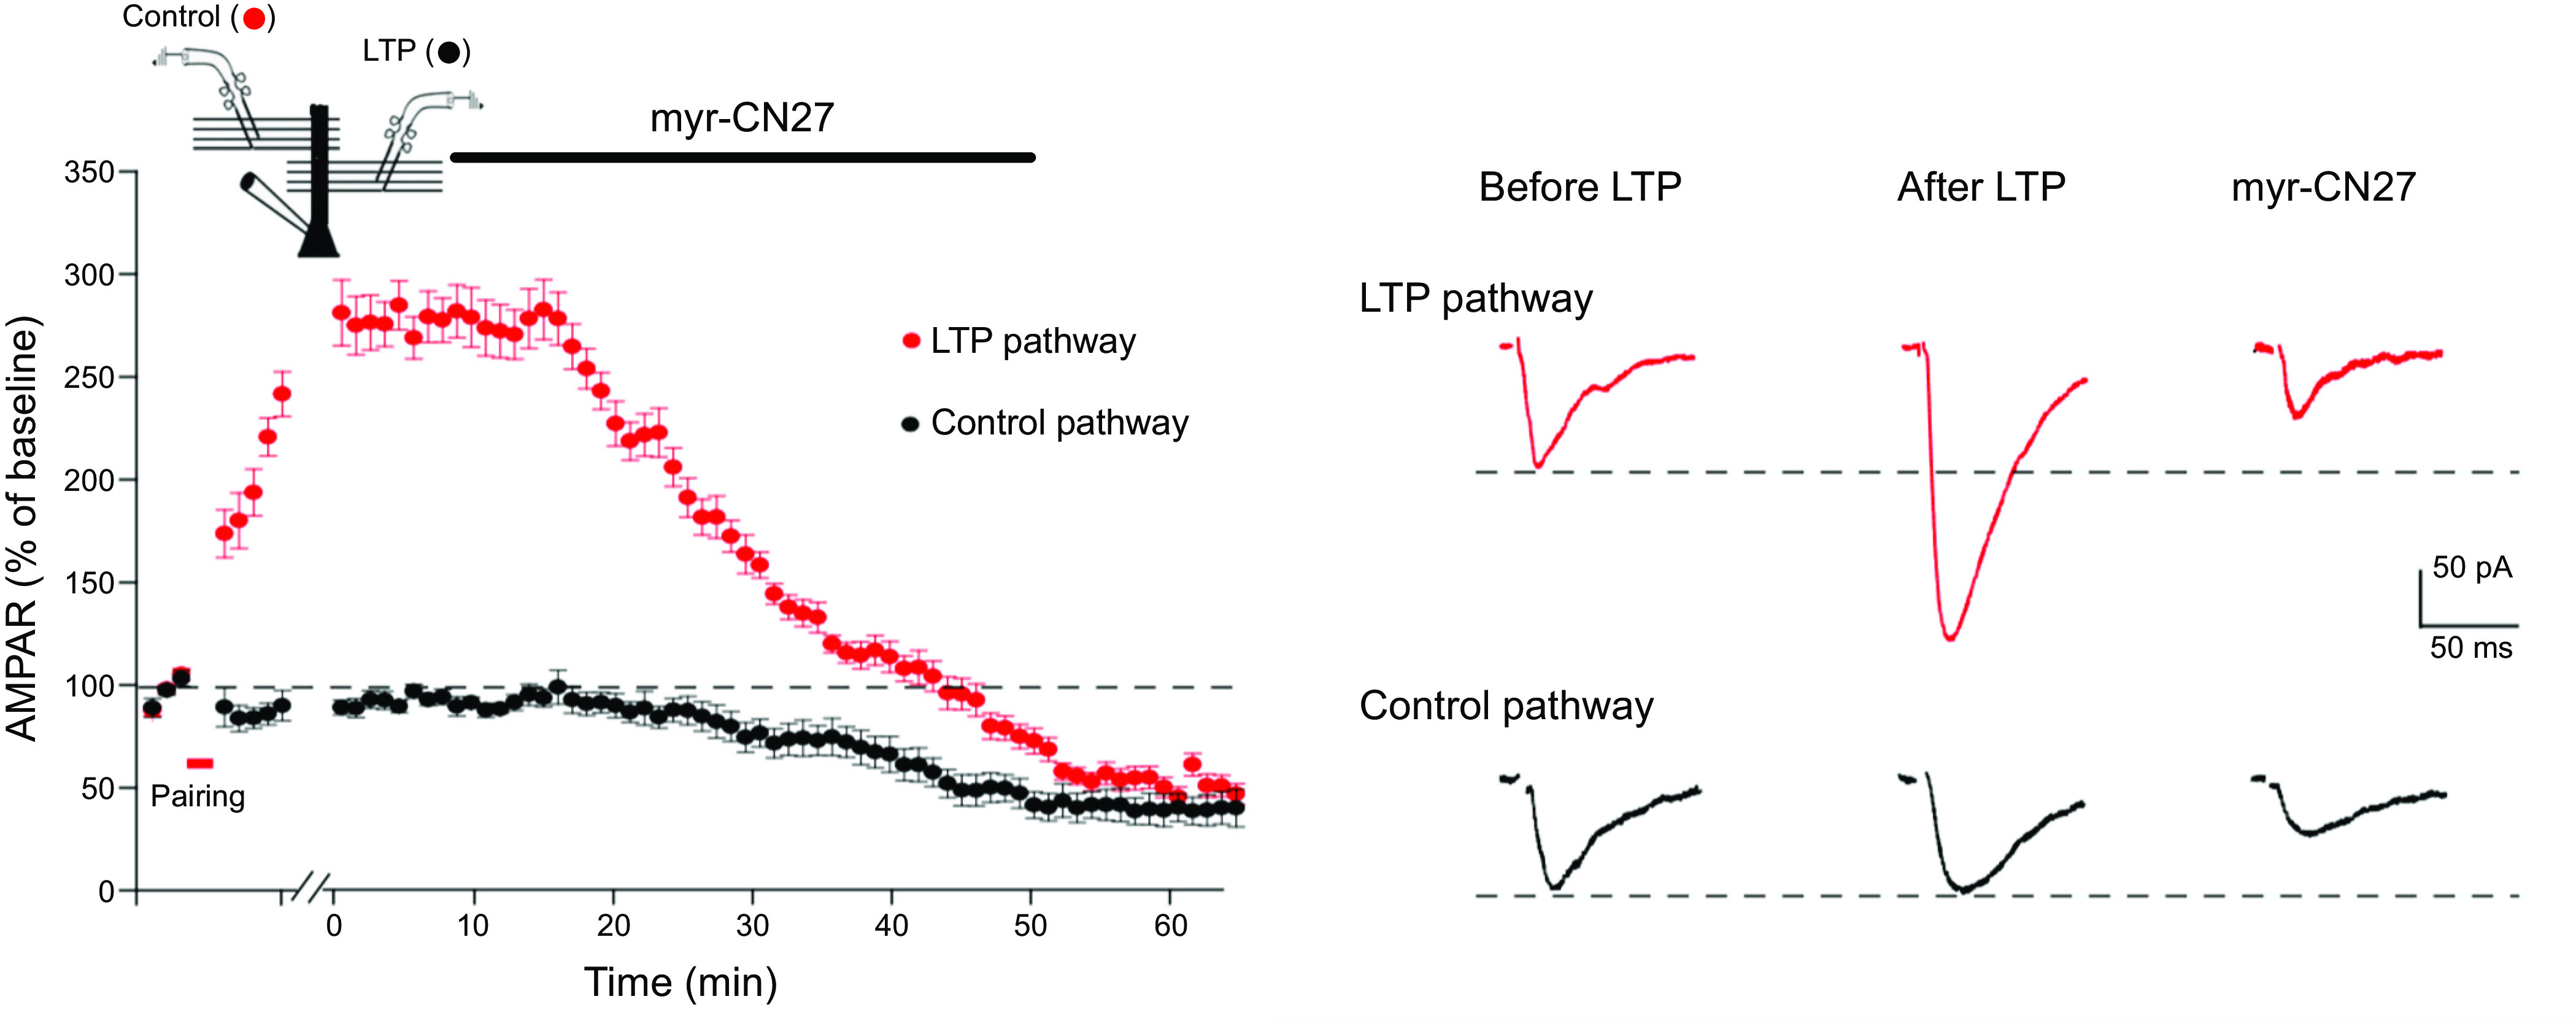
- Blocking CaMKII after LTP with myr-CN27 reduces control AMPAR EPSCs by ~50% and fully reverses established LTP; CRISPR deletion of CaMKII reduces synaptic transmission to ~50% of control.
- CaMKII binding to GluN2B is required: CaMKII I205K prevents binding and blocks LTP; CA CaMKII with I205K fails to enhance; replacing GluN2B with L1298A/R1300Q reduces AMPAR responses ~50%.
- T286 autophosphorylation is central: T286A replacement blocks LTP, and autophosphorylation increases Ca2+/CaM affinity >1,000-fold (15 nM to 20 pM); CaMKII has low Ca2+ sensitivity (apparent Kd = 1.6 µM; Hill coefficient ~6) versus resting Ca2+ (20–50 nM).
Methods
- Narrative review of published literature on NMDAR-dependent LTP and CaMKII; no new experimental data or systematic search/meta-analysis are reported.
- Focuses primarily on CA3-to-CA1 hippocampal synapses and the first hour of LTP, integrating biochemical, electrophysiological, imaging, genetic, and computational studies.
- Figures are modified from prior studies; the review discusses three models of LTP expression (receptor-centric, PSD-centric, vesicle-centric).
Limitations
- Stated: the review is limited to NMDAR-dependent LTP, primarily the first hour, and does not cover all LTP forms.
- Stated: critical downstream targets of CaMKII remain elusive; LLPS role is speculative; T286 phosphorylation requirement for maintenance is debated; role of CaMKIIβ and S1303 phosphorylation unresolved.
- Evident: as a narrative review, it does not systematically assess study quality, publication bias, or effect sizes across the literature.
Model-written summary. Check it against the paper before relying on it.
Integrity signals
Registry
Cites
Statistics
Figures
Verification
Claims the paper makes
136 Own interpretation · 98 Partly supported · 92 No full text of the sources · 88 Supported · 39 No basis given · 34 Supported so far · 10 Not checked yet · 6 Sources not found · 5 Mixed support · 5 Own result · 4 Not supported · 3 Own method · 2 Couldn’t confirm · accuracy not yet measured
Some cited sources support this claim and some don’t — read each source’s verdict below.
In the paper
“the potentiation typically is transient, lasting no longer than 20 min (Refs. 189–193, but see Refs. 194, 195).”
§ Synaptic memory and CaMKII > 4. Ca2+ AND LTP > 4.2. Postsynaptic Ca2+ and Sufficiency
What the sources say
- Not checked — no full text of the sourcecites [189] source
- Not checked — no full text of the sourcecites [190] source
- Not checked — no full text of the sourcecites [191] source
- Not checked — no full text of the sourcecites [192] source
- Partly supportedcites [193] sourceExperimental — accuracy not yet measured
The Results (Fig. 4A,B; page not given in our copy) report that potentiation induced by depolarizing pulses often decayed back to control, supporting its transient nature. The reported decay time is 10–30 minutes, so the source does not support the claim that it lasts no longer than 20 minutes. (LLM, conf=0.88)
- Disputedcites [194] sourceExperimental — accuracy not yet measured
In 'Induction of non-Hebbian LTP by postsynaptic depolarization' (page unavailable), the paper contrasts an earlier transient result with its own stable potentiation, observed for nearly an hour without a tendency to decay. The cited paper therefore provides an exception to the stated 20-minute limit, consistent with the citing sentence’s 'but see' qualification, rather than evidence for that limit. (LLM, conf=0.88)
Checked by a reasoning model — may be wrong.
- Could not verifycites [195] sourceExperimental — accuracy not yet measured
The Methods section describes how voltage-pulse LTP was induced, and “Postsynaptic Syt1,7 loss blocks LTP” discusses its mechanism. Neither passage states that the potentiation is typically transient or lasts no longer than 20 minutes; searches for voltage-pulse LTP duration and decay found no such statement in our copy. (LLM, conf=0.73)
plain- Asserted: passes — The authors put it forward as true.
- Checkable: passes — It can be checked against evidence.
- Load-bearing: passes — The paper’s conclusions depend on it.
- Based: passes — The paper gives a reason why it holds.
At least one cited source doesn’t support this claim or points to a different paper, and none confirmed it — see the verdicts below.
In the paper
“The anatomical substrate for silent synapses is fingerlike dendritic protrusions referred to as filipodia (245), which account for roughly 30% of synapses in the mature brain (240).”
§ Synaptic memory and CaMKII > 7. CaMKII AND THE EXPRESSION OF LTP (CaMKII TARGETS) > 7.1. Dynamic Properties of the PSD
What the sources say
- Disputedcites [245] sourceExperimental — accuracy not yet measured
The Results (page unavailable) report that filopodial synapses were 21% of identified contacts in developing CA1 during the first postnatal week and fell to 7.2% by postnatal day 12—not roughly 30% in the mature brain. The paper also states that dendritic filopodia disappear as the cortex matures; it does not report a 30% estimate for mature-brain synapses. (LLM, conf=0.82)
Checked by a reasoning model — may be wrong.
- Not checked — no full text of the sourcecites [240] source
plain- Asserted: passes — The authors put it forward as true.
- Checkable: passes — It can be checked against evidence.
- Load-bearing: unclear — It is unclear whether the paper’s conclusions depend on it.
- Based: passes — The paper gives a reason why it holds.
- Disputed
Some cited sources support this claim and some don’t — read each source’s verdict below.
In the paper
“The existence of LTD avoids the problem of saturation, which could be essential for a mnemonic device (366–371).”
§ Synaptic memory and CaMKII > 9. CaMKII AND THE MAINTENANCE OF LTP > 9.2. CaMKII Binding to GluN2B vs. T286 Phosphorylation
What the sources say
- Not checked — no full text of the sourcecites [366] source
- Supportedcites [367] source
In “II. Modification of Cortical Synapses” (page unavailable), the paper says that if synapses only increase, they eventually saturate and no information is stored; it therefore calls for conditions under which synapses decrease. Its proposed modification rule includes such decreases, supporting the claim’s point about avoiding saturation in a mnemonic device. (LLM, conf=0.91)
- Disputedcites [368] sourceExperimental — accuracy not yet measured
In “The Stability Problem” (page unavailable), the paper groups LTP and LTD as learning-related plasticity mechanisms, then says such mechanisms can create destabilizing feedback that drives neuronal activity to saturation. It says nervous systems need other plasticity mechanisms to counteract those forces; it does not say that the existence of LTD avoids saturation. (LLM, conf=0.86)
Checked by a reasoning model — may be wrong.
- Partly supportedcites [369] sourceExperimental — accuracy not yet measured
The paper’s discussion of memory lifetimes says that balancing synaptic potentiation and depression can improve memory performance. But its discussion of saturation describes effects distinct from the mechanism it proposes; our copy does not establish that LTD itself avoids saturation or that this is essential for a mnemonic device. (LLM, conf=0.75)
- Could not verifycites [370] sourceExperimental — accuracy not yet measured
The Results section on single-synapse models describes LTD and says that both LTP and LTD should saturate, but does not say that the existence of LTD prevents synaptic saturation. The Discussion’s “Functional significance” section links maintained dynamic range to learning and memory, attributing it to the interaction of Hebbian and homeostatic plasticity rather than to LTD alone. I searched for the proposed LTD–saturation–memory link; no passage in our copy establishes it. (LLM, conf=0.72)
- Could not verifycites [371] sourceExperimental — accuracy not yet measured
Section 4.4.3 discusses saturation of LTP/LTD after repeated spike pairings, and Section 4.4.1 discusses the need for synaptic stability to retain memories. Neither passage says that LTD prevents saturation in a memory device. Searches for LTD preventing saturation and for depression preventing synaptic-weight saturation found no passage making that connection. (LLM, conf=0.70)
hedgeddirect- Asserted: passes — The authors put it forward as true.
- Checkable: passes — It can be checked against evidence.
- Load-bearing: passes — The paper’s conclusions depend on it.
- Based: passes — The paper gives a reason why it holds.
At least one cited source doesn’t support this claim or points to a different paper, and none confirmed it — see the verdicts below.
In the paper
“These plateau potentials on their own do not change synaptic strength.”
§ Synaptic memory and CaMKII > 11. CaMKII AND HIPPOCAMPAL PLACE FIELDS
What the sources say
- Disputedcites [424] sourceExperimental — accuracy not yet measured
The Results section, “Plateau increase the amplitude of incoming input” (page unavailable), says plateau-induced place fields are consistent with increased EPSP amplitude—evidence of strengthened synaptic input. The Discussion (page unavailable) also describes plasticity produced by plateau potentials. The paper therefore makes the contrary point, although it does not isolate a plateau from all concurrent synaptic input. (LLM, conf=0.88)
Checked by a reasoning model — may be wrong.
- Disputedcites [426] sourceExperimental — accuracy not yet measured
The Role of BTSP section (page not provided) says Ca2+ plateau potentials drive BTSP and can induce plasticity in a single trial, contrary to the claim that they do not change synaptic strength. The paper does not separately test a plateau in the absence of synaptic input, so its statement does not establish that plateaus are sufficient without input. (LLM, conf=0.79)
Checked by a reasoning model — may be wrong.
plain- Asserted: passes — The authors put it forward as true.
- Checkable: passes — It can be checked against evidence.
- Load-bearing: passes — The paper’s conclusions depend on it.
- Based: passes — The paper gives a reason why it holds.
- Disputed
Some cited sources support this claim and some don’t — read each source’s verdict below.
In the paper
“It is also agreed that the synaptic capture of AMPARs requires the PDZ domain interaction between TARPs and PSD-95 (275, 279, 294, 440).”
§ Synaptic memory and CaMKII > 13. CONCLUSIONS > 13.2. Reorganization of PSD during LTP
What the sources say
- Disputedcites [275] sourceExperimental — accuracy not yet measured
The Introduction describes TARP–PSD-95 PDZ binding as a major mechanism of AMPAR localization, but the Discussion explicitly rejects it as a universal requirement. It reports that the GluA2 N-terminal domain can support synaptic anchoring even without γ8 PDZ ligands. (LLM, conf=0.89)
Checked by a reasoning model — may be wrong.
- Supportedcites [279] source
In “The role of TARPs in AMPAR surface trafficking and synaptic targeting” (page not provided), the review says TARP PDZ-binding motifs bind PSD-95 and that TARPs are essential intermediaries in anchoring AMPARs at synapses. It also reports that disrupting stargazin–PSD-95 interactions prevents AMPAR complexes from clustering at postsynaptic densities. (LLM, conf=0.93)
- Partly supportedcites [294] sourceExperimental — accuracy not yet measured
The Discussion reports that a functional TARP PBM–PSD-95 PDZ interaction is necessary for TARP-assisted AMPAR accumulation at synapses. Its Limitations section narrows that conclusion to the TARP γ-8-based trafficking studied and notes that some synaptic transmission may be TARP independent. The unqualified claim that synaptic capture of AMPARs requires this interaction therefore goes beyond the paper's findings. (LLM, conf=0.85)
- Partly supportedcites [440] sourceExperimental — accuracy not yet measured
The section on TARP/MAGUK interactions says TARP–PSD-95 interactions stabilize AMPARs at the postsynaptic density and involve PSD-95 PDZ domains. It calls these interactions the most plausible AMPAR capture sites, but does not establish that this specific interaction is universally required; the reported requirement for the TARP binding motif comes from particular experimental conditions. (LLM, conf=0.84)
boosteddirect- Asserted: passes — The authors put it forward as true.
- Checkable: passes — It can be checked against evidence.
- Load-bearing: passes — The paper’s conclusions depend on it.
- Based: passes — The paper gives a reason why it holds.
- Disputed
The cited sources that could be checked couldn’t confirm or dispute this claim.
In the paper
“The more enduring storage of information, however, remains intact after brain silencing.”
- Also stated in: § 1. INTRODUCTION · plain
“Thus, in cases where neuronal activity has been transiently silenced, as in barbiturate overdose (5) or brain cooling (6), memories remain intact.”
§ Synaptic memory and CaMKII > 1. INTRODUCTION
What the sources say
- Not checked — no full text of the sourcecites [5] source
- Could not verifycites [6] sourceExperimental — accuracy not yet measured
The Results describe loss and restoration of EEG activity during circulatory arrest, but do not assess whether stored information survives that inactivity. The Comment raises a possible risk of neurocognitive deficits and calls for further study; it does not establish what happens to enduring memory storage. Searches for long-term memory storage and cognitive function after cooling found no passage resolving the claim. (LLM, conf=0.74)
plain- Asserted: passes — The authors put it forward as true.
- Checkable: passes — It can be checked against evidence.
- Load-bearing: passes — The paper’s conclusions depend on it.
- Based: passes — The paper gives a reason why it holds.
- Also stated in: § 1. INTRODUCTION · plain
The cited sources support only part of this claim — read each source’s verdict below.
In the paper
“Additionally, NMDAR-dependent LTP has been most tightly associated with intact animal behavioral memory (19, 43–46).”
§ Synaptic memory and CaMKII > 2. LONG-TERM POTENTIATION: THE BASICS > 2.3. LTP: Maintenance
What the sources say
- Not checked — no full text of the sourcecites [19] source
- Not checked — no full text of the sourcecites [43] source
- Partly supportedcites [44] sourceExperimental — accuracy not yet measured
The section on behavioral tests of memory reports that mice with impaired CaMKII/NMDAR complex formation had both reduced LTP and reduced spatial memory, supporting a link in intact animals. The paper does not compare NMDAR-dependent LTP with other forms of plasticity or establish that its association with behavioral memory is the tightest; the Conclusions say further behavioral work is needed. (LLM, conf=0.82)
- Not checked — no full text of the sourcecites [45] source
- Partly supportedcites [46] sourceExperimental — accuracy not yet measured
The Introduction (page unavailable) describes NMDA-initiated LTP in hippocampal CA1 as a candidate memory mechanism. The Discussion (page unavailable) says that interference with CaMKII can erase both LTP and memory, supporting a link between them. But the paper does not establish the comparative claim that NMDAR-dependent LTP is *most tightly* associated with behavioral memory in intact animals; it cautions that LTP is difficult to observe during learning. (LLM, conf=0.86)
boostedcorrelational- Asserted: passes — The authors put it forward as true.
- Checkable: passes — It can be checked against evidence.
- Load-bearing: passes — The paper’s conclusions depend on it.
- Based: passes — The paper gives a reason why it holds.
The sources with a verdict support this claim; the rest weren’t checked yet, have no full text we could read, or their verdicts aren’t rated yet.
In the paper
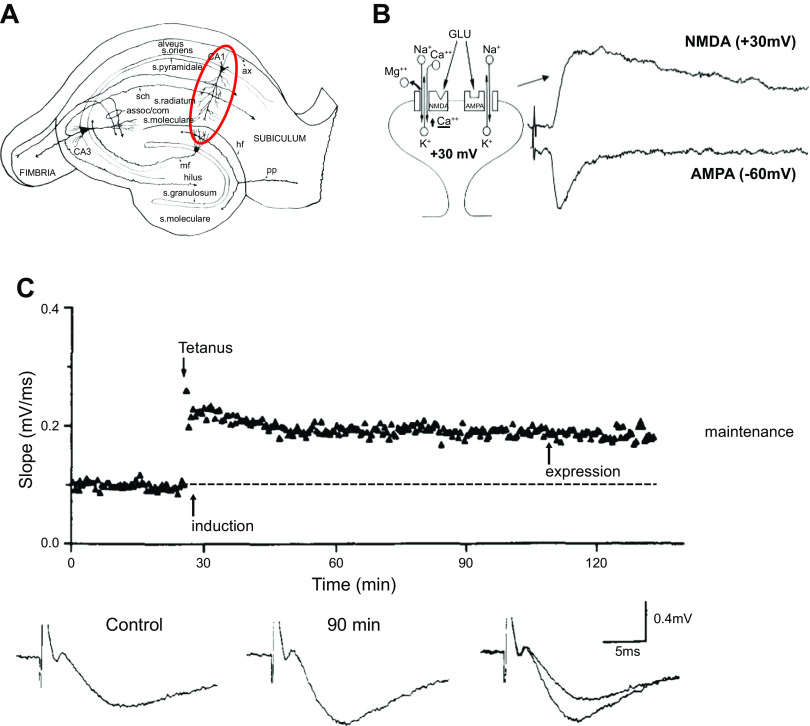
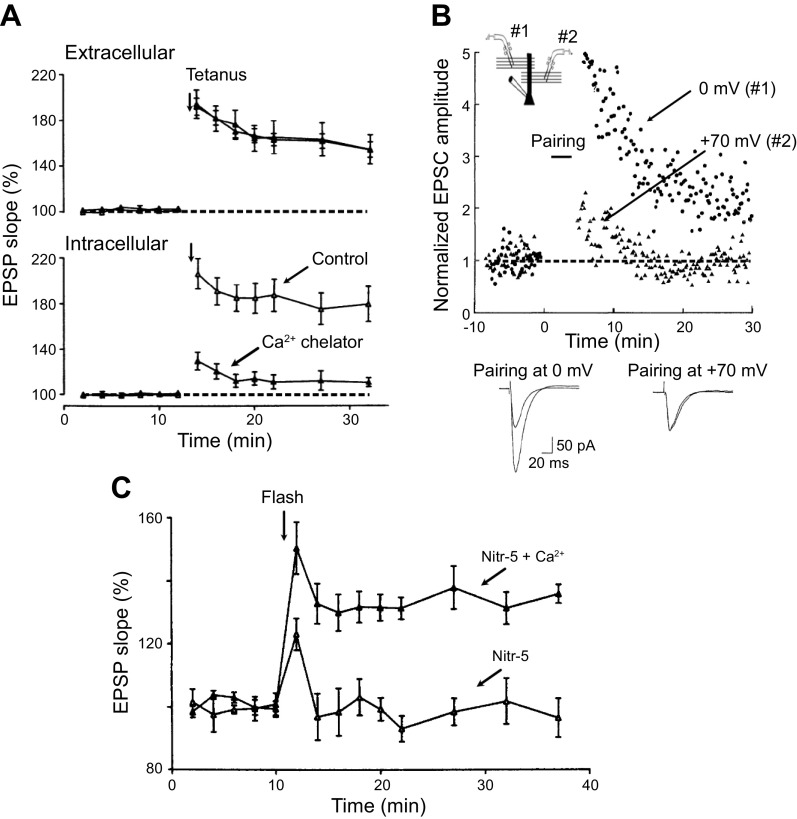
“However, it is now known that LTP can be induced by just depolarizing the postsynaptic cell with current through the recording electrode combined with low-frequency synaptic stimulation (40, 41).”
§ Synaptic memory and CaMKII > 2. LONG-TERM POTENTIATION: THE BASICS > 2.1. LTP: Induction
What the sources say
- Supportedcites [40] source
The paper’s opening summary describes low-frequency single-volley stimulation paired with depolarizing current pulses injected through the recording microelectrode. The Results report that pairing at 0.1 Hz increased the EPSP, and the Discussion identifies this lasting increase as LTP induced without high-frequency presynaptic activity. (LLM, conf=0.94)
- Not checked — no full text of the sourcecites [41] source
plaindirect- Asserted: passes — The authors put it forward as true.
- Checkable: passes — It can be checked against evidence.
- Load-bearing: unclear — It is unclear whether the paper’s conclusions depend on it.
- Based: passes — The paper gives a reason why it holds.
- Supported
The cited sources support only part of this claim — read each source’s verdict below.
In the paper
“There is compelling evidence that for short forms of memory, often referred to as working memory, information is stored by ongoing activity in neuronal networks (1–4).”
§ Synaptic memory and CaMKII > 1. INTRODUCTION
What the sources say
- Not checked — no full text of the sourcecites [1] source
- Partly supportedcites [2] sourceExperimental — accuracy not yet measured
In “Working memory at the systems level,” the paper describes persistent neural activity during working-memory delays as evidence for maintaining representations. But the same section says persistent activity may not be necessary and discusses storage through short-term changes in synaptic weights. The claim overstates the paper’s position by presenting ongoing activity as the storage mechanism without that qualification. (LLM, conf=0.87)
- Supportedcites [3] source
The Introduction (p. 3) describes persistent neuronal activity during short-term memory tasks as a neural correlate of memory maintenance. It also discusses network mechanisms that sustain this activity, supporting the citing sentence’s broad claim. (LLM, conf=0.90)
- Not checked — no full text of the sourcecites [4] source
boosteddirect- Asserted: passes — The authors put it forward as true.
- Checkable: passes — It can be checked against evidence.
- Load-bearing: passes — The paper’s conclusions depend on it.
- Based: passes — The paper gives a reason why it holds.
The sources with a verdict support this claim; the rest weren’t checked yet, have no full text we could read, or their verdicts aren’t rated yet.
In the paper
“Importantly, this same depolarization in the absence of synaptic stimulation fails to induce LTP.”
§ Synaptic memory and CaMKII > 2. LONG-TERM POTENTIATION: THE BASICS > 2.1. LTP: Induction
What the sources say
- Supportedcites [40] source
The section on the duration of the pairing-induced EPSP increase reports that a second, unpaired input was unaffected by the current pulse. It also reports no observable EPSP increase when the pulse was delayed 400 ms after synaptic activation, supporting the claim that depolarization without coincident synaptic stimulation did not induce LTP in these experiments. (LLM, conf=0.91)
- Not checked — no full text of the sourcecites [41] source
plain- Asserted: passes — The authors put it forward as true.
- Checkable: passes — It can be checked against evidence.
- Load-bearing: passes — The paper’s conclusions depend on it.
- Based: passes — The paper gives a reason why it holds.
- Supported
- It may state two separate claims as one. 145
- Probably not a substantial claim. 42
- The quote only partly states this claim. 1
Some cited sources support this claim and some don’t — read each source’s verdict below.
In the paper
“Although it is difficult to entirely exclude the possibility of a minor presynaptic component of NMDAR-dependent LTP, the evidence is overwhelming that its expression is primarily postsynaptic.”
§ Synaptic memory and CaMKII > 2. LONG-TERM POTENTIATION: THE BASICS > 2.2. LTP: Expression
What the sources say
- Supportedcites [17] source
In “Long-Term Potentiation: The Last 25 Years” (page unavailable), the review describes glutamate-uncaging experiments as strong evidence for postsynaptic LTP expression. It says those findings do not exclude an additional presynaptic mechanism, while noting that there is no need to invoke one during the first hour—the period most studied. (LLM, conf=0.91)
- Not checked — no full text of the sourcecites [18] source
- Not checked — no full text of the sourcecites [19] source
- Partly supportedcites [22] sourceExperimental — accuracy not yet measured
In the Introduction’s “The AMPAR code and LTP” section (page unavailable), the paper describes NMDAR-dependent LTP as resulting from increased postsynaptic AMPAR density and/or conductance, supporting primarily postsynaptic expression. Our copy does not address whether a minor presynaptic component is difficult to exclude; a search for “presynaptic” found no discussion of that qualification. (LLM, conf=0.84)
- Disputedcites [31] sourceExperimental — accuracy not yet measured
The Introduction says presynaptic mechanisms can play an important, even dominant, role in some experimental situations. The Discussion concludes that early LTP can be entirely presynaptic, entirely postsynaptic, or a combination of both. The paper therefore does not treat presynaptic expression as merely a minor possibility or postsynaptic expression as generally predominant. (LLM, conf=0.93)
Checked by a reasoning model — may be wrong.
boosteddirect- Asserted: passes — The authors put it forward as true.
- Checkable: passes — It can be checked against evidence.
- Load-bearing: passes — The paper’s conclusions depend on it.
- Based: passes — The paper gives a reason why it holds.
It may state two separate claims as one.
- Supported
At least one cited source doesn’t support this claim or points to a different paper, and none confirmed it — see the verdicts below.
In the paper
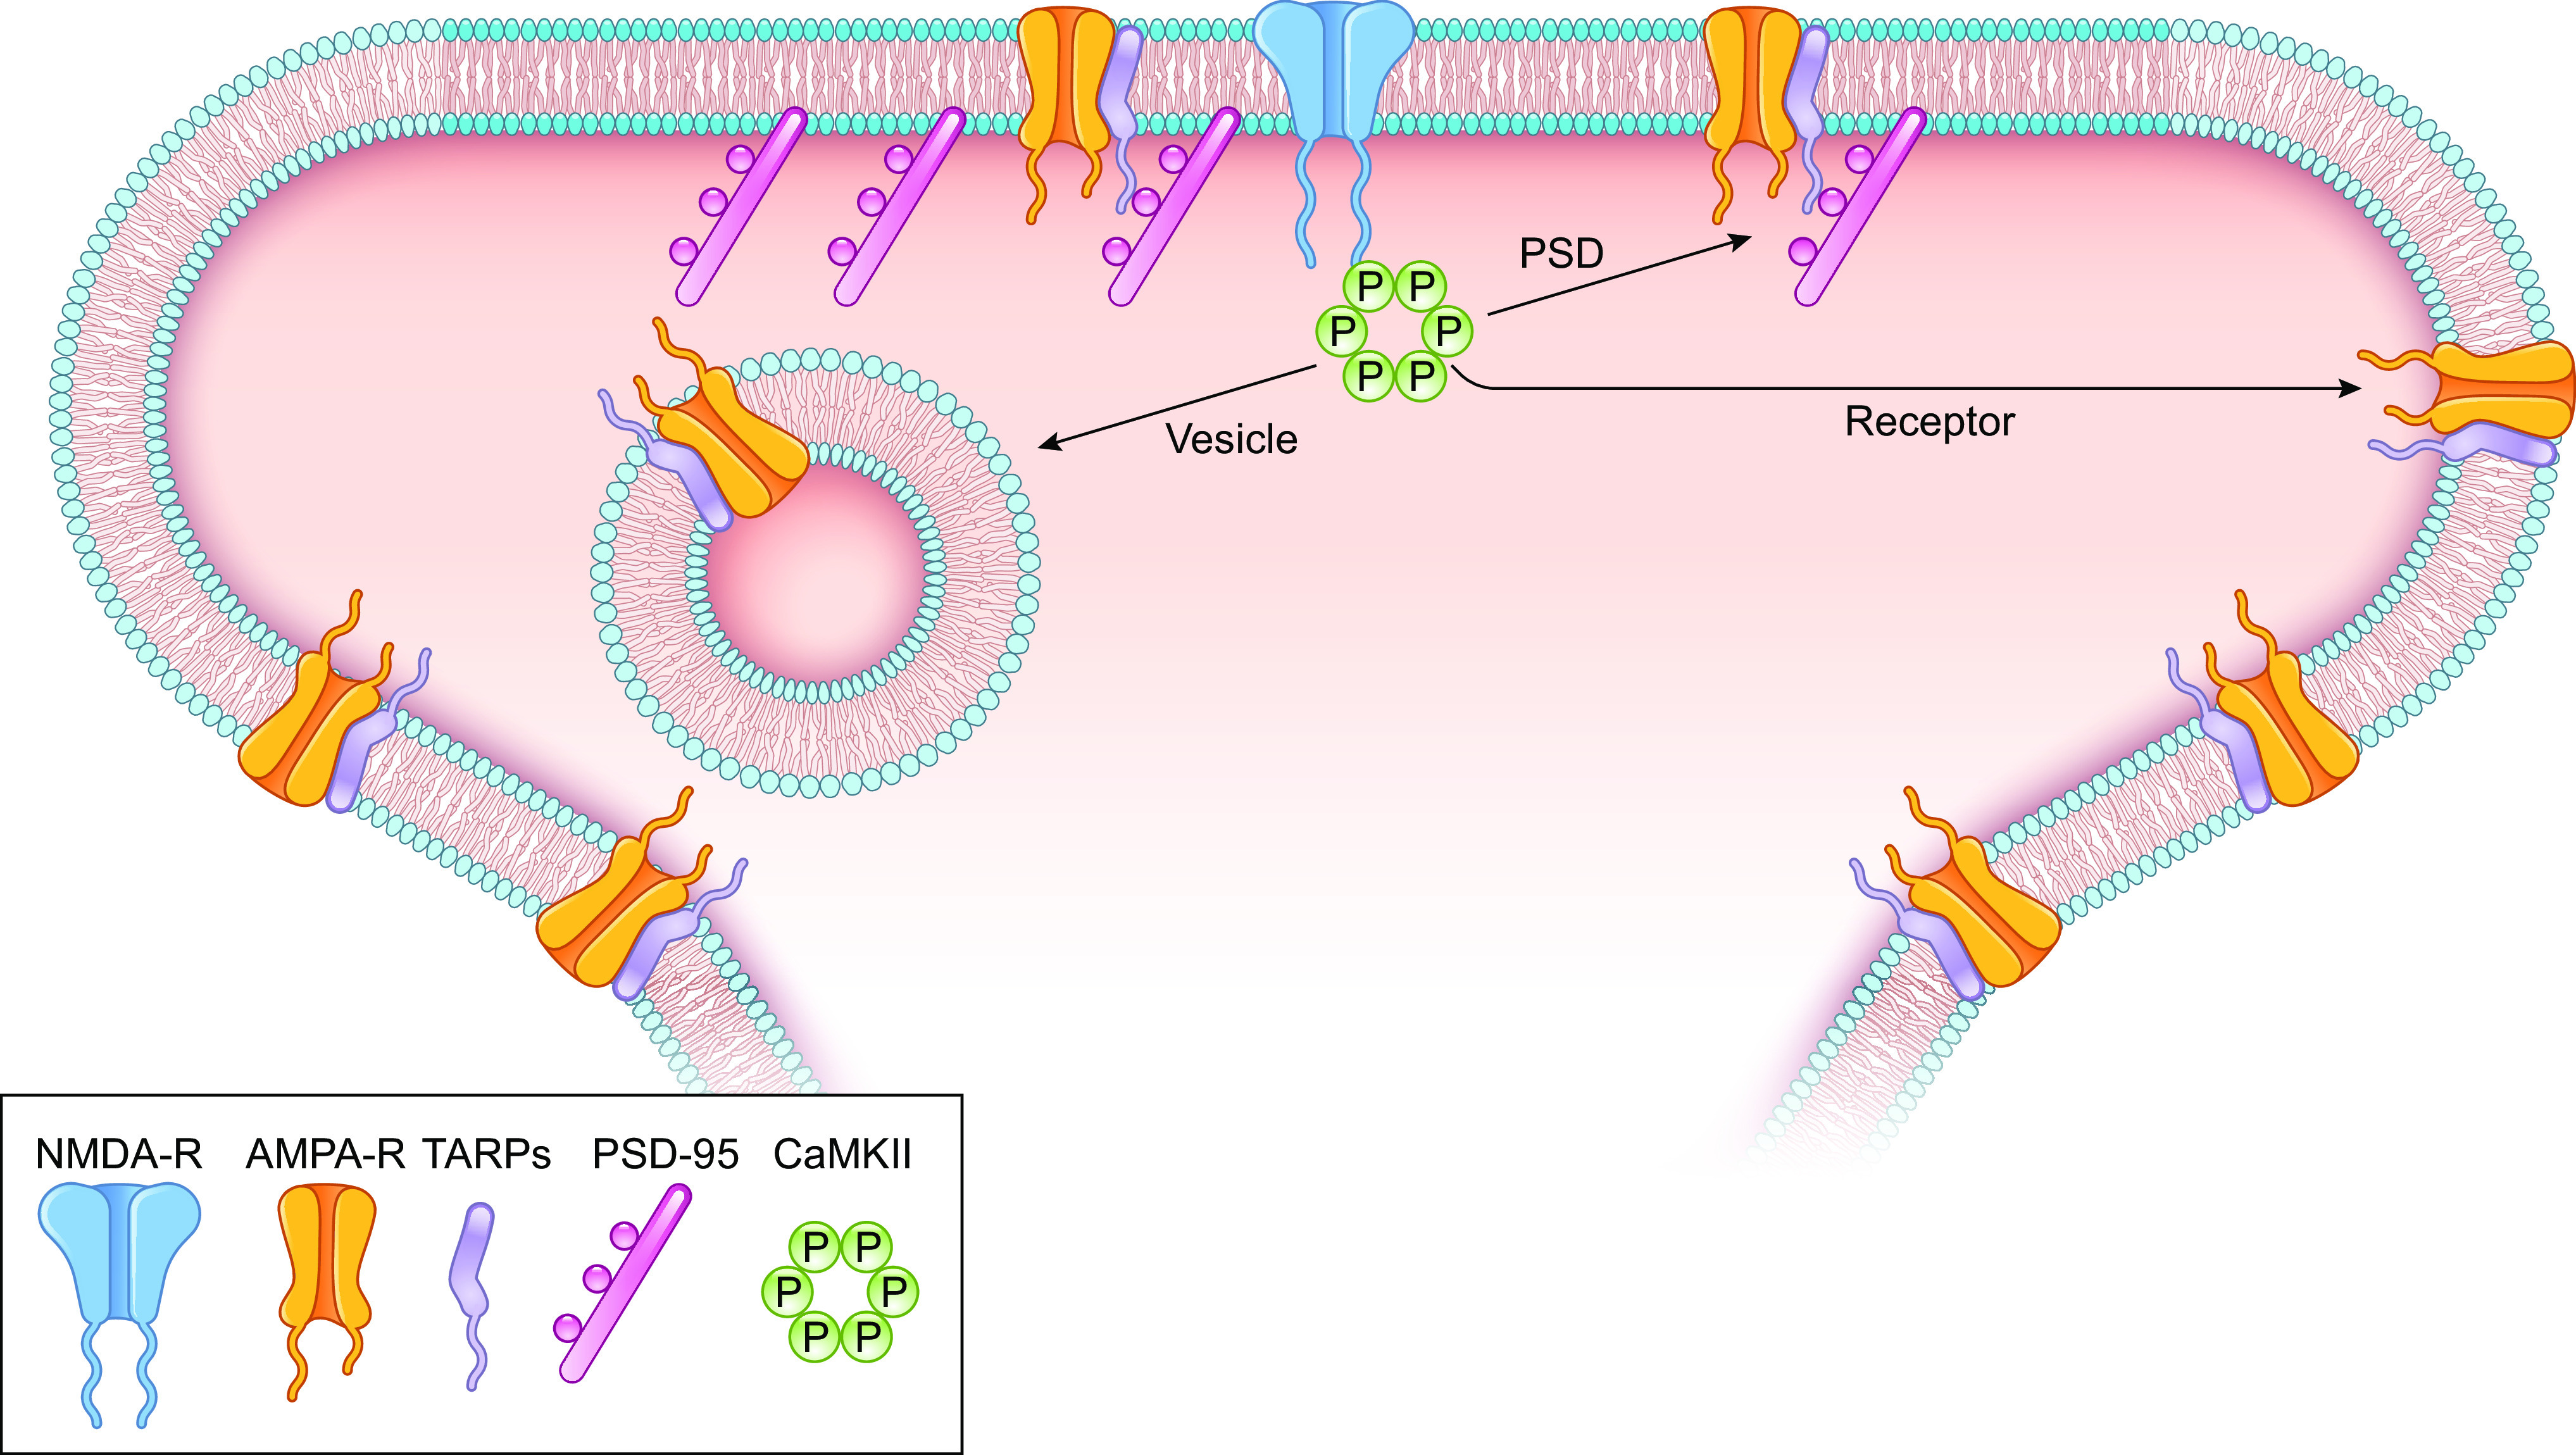
“The prevailing model posits that LTP-mediated covalent modification of the intracellular CTD of GluA1 results in the capture of these modified GluA1-containing receptors by preexisting “slots” in the postsynaptic density (PSD) (17, 18, 212).”
§ Synaptic memory and CaMKII > 7. CaMKII AND THE EXPRESSION OF LTP (CaMKII TARGETS) > 7.3. Receptor-centric Model
What the sources say
- Disputedcites [17] sourceExperimental — accuracy not yet measured
In “Proposed Working Models for LTP” (page unavailable), the paper describes capture by preexisting PSD slots as one of three possible models, not the prevailing model. It explicitly says that C-terminal domains would be modulatory but not essential to that capture; modification of other receptor domains or auxiliary subunits would play the essential role. (LLM, conf=0.85)
Checked by a reasoning model — may be wrong.
- Not checked — no full text of the sourcecites [18] source
- Not checked — no full text of the sourcecites [212] source
plaindirect- Asserted: passes — The authors put it forward as true.
- Checkable: passes — It can be checked against evidence.
- Load-bearing: fails — The paper’s conclusions may not depend on it.
- Based: passes — The paper gives a reason why it holds.
Probably not a substantial claim. The paper’s conclusions may not depend on it.
- Disputed
At least one cited source doesn’t support this claim or points to a different paper, and none confirmed it — see the verdicts below.
In the paper
“CaMKII phosphorylates Kalirin at T75 (Ref. 315, but see Ref. 317), and this phosphorylation is sufficient to enhance synaptic transmission.”
§ Synaptic memory and CaMKII > 7. CaMKII AND THE EXPRESSION OF LTP (CaMKII TARGETS) > 7.4. PSD-centric Model
What the sources say
- Disputedcites [315] sourceExperimental — accuracy not yet measured
The Results identify T95, not T75, as the CaMKII phosphorylation site on kalirin-7; the Discussion likewise names Thr 95. The Results show that normal kalirin expression is required for activity-dependent enhancement of synaptic transmission, but do not show that phosphorylation alone is sufficient to enhance it. Page numbers are not available in our copy. (LLM, conf=0.90)
Checked by a reasoning model — may be wrong.
- Disputedcites [317] sourceExperimental — accuracy not yet measured
In Results and Discussion (‘Kalirin phosphorylation is brain region specific’; page unavailable), the paper says its in vitro studies found CaMKII phosphorylation at T79, not the T75 site named in the claim. The cited passage also does not show that phosphorylation at T75 is sufficient to enhance synaptic transmission. (LLM, conf=0.83)
Checked by a reasoning model — may be wrong.
plaindirect- Asserted: passes — The authors put it forward as true.
- Checkable: passes — It can be checked against evidence.
- Load-bearing: passes — The paper’s conclusions depend on it.
- Based: passes — The paper gives a reason why it holds.
It may state two separate claims as one.
- Disputed
Some cited sources support this claim and some don’t — read each source’s verdict below.
In the paper
“In support of these results, both sLTP (379) and LTP (121, 379) are greatly diminished in a CaMKII-dead mutant (K42K or K42M), despite its translocation.”
§ Synaptic memory and CaMKII > 9. CaMKII AND THE MAINTENANCE OF LTP > 9.2. CaMKII Binding to GluN2B vs. T286 Phosphorylation
What the sources say
- Partly supportedcites [379] sourceExperimental — accuracy not yet measured
The sections on tetanus-induced spine structural plasticity and LTP report severely impaired spine enlargement and LTP, while the postsynaptic-dynamics section reports preserved translocation. The mutant studied is K42R, however, not the K42K or K42M mutant named in the claim. Page numbers are unavailable in our copy. (LLM, conf=0.88)
- Disputedcites [121] sourceExperimental — accuracy not yet measured
The Discussion (page unavailable) says that substantial LTP remained with the CaMKIIα K42R mutation, contrary to the claim that LTP was greatly diminished in the kinase-dead mutant. The Results report loss of long-term sLTP with a different mutant, T286A; they do not establish the claimed sLTP result for K42K or K42M, or its translocation. (LLM, conf=0.85)
Checked by a reasoning model — may be wrong.
plaindirect- Asserted: passes — The authors put it forward as true.
- Checkable: passes — It can be checked against evidence.
- Load-bearing: passes — The paper’s conclusions depend on it.
- Based: passes — The paper gives a reason why it holds.
It may state two separate claims as one.
- Partly supported
The sources with a verdict support this claim; the rest weren’t checked yet, have no full text we could read, or their verdicts aren’t rated yet.
In the paper
“There is even evidence that at CA1 excitatory synapses both NMDAR-dependent and NMDAR-independent forms of LTP can coexist under certain conditions (49–51).”
§ Synaptic memory and CaMKII > 2. LONG-TERM POTENTIATION: THE BASICS > 2.3. LTP: Maintenance
What the sources say
- Not checked — no full text of the sourcecites [49] source
- Not checked — no full text of the sourcecites [50] source
- Supportedcites [51] source
The paper reports that TEA application in the CA1 region produces two distinct potentiations: one induced through NMDA receptor channels and another distinct from NMDA receptor-dependent LTP. The Discussion likewise describes separate potentiations with different expression mechanisms under these conditions. The supplied passages do not give page numbers. (LLM, conf=0.91)
hedgedcorrelational- Asserted: passes — The authors put it forward as true.
- Checkable: passes — It can be checked against evidence.
- Load-bearing: fails — The paper’s conclusions may not depend on it.
- Based: passes — The paper gives a reason why it holds.
Probably not a substantial claim. The paper’s conclusions may not depend on it.
The cited sources support only part of this claim — read each source’s verdict below.
In the paper
“long-term potentiation (LTP), in which brief repetitive synaptic stimulation results in long-lasting increases in synaptic strength, was gaining popularity as a cellular model for learning and memory (16–22).”
§ Synaptic memory and CaMKII > 1. INTRODUCTION
What the sources say
- Not checked — no full text of the sourcecites [16] source
- Supportedcites [17] source
The review’s “Long-Term Potentiation: The Last 25 Years” section (page unavailable) describes repetitive activation of receptors on a spine producing a long-lasting increase in its AMPAR response. It also compares that enhancement with the effect of synaptic stimulation paired with postsynaptic depolarization, supporting the citing sentence’s general description of LTP. (LLM, conf=0.87)
- Not checked — no full text of the sourcecites [18] source
- Not checked — no full text of the sourcecites [19] source
- Supportedcites [20] source
In “The search for the cellular and molecular basis of synaptic plasticity” (page not provided), the paper describes repetitive activation producing a long-lasting increase in synaptic responses during LTP. Its Introduction (page not provided) also links interest in LTP to the study of memory. This supports the citing sentence’s description of LTP as a model for learning and memory. (LLM, conf=0.90)
- Not checked — no full text of the sourcecites [21] source
- Partly supportedcites [22] sourceExperimental — accuracy not yet measured
The Introduction describes LTP as a change in synaptic strength associated with learning and memory, and the ‘AMPAR code and LTP’ section describes enhanced synaptic AMPARs during LTP. The passages do not establish the claim’s specific induction condition: brief repetitive synaptic stimulation. (LLM, conf=0.84)
plaindirect- Asserted: passes — The authors put it forward as true.
- Checkable: passes — It can be checked against evidence.
- Load-bearing: passes — The paper’s conclusions depend on it.
- Based: passes — The paper gives a reason why it holds.
Probably not a substantial claim.
The sources with a verdict support this claim; the rest weren’t checked yet, have no full text we could read, or their verdicts aren’t rated yet.
In the paper
“For instance, weak repetitive synaptic stimulation can elicit an NMDA-dependent decaying potentiation referred to as short-term potentiation (STP) (99–101).”
§ Synaptic memory and CaMKII > 3. CaMKII: STRUCTURE AND REGULATION > 3.1. CaMKII and Integration of Ca2+ Stimuli
What the sources say
- Supportedcites [99] source
The Results report that a weak repetitive tetanus elicited STP that decayed back to baseline. The Characterization section describes STP in hippocampal CA1 as short-lasting, decremental potentiation dependent on postsynaptic NMDA receptor activation. (LLM, conf=0.93)
- Supportedcites [100] source
The Results report that a brief two-stimulus burst in a test pathway, paired with conditioning-pathway stimulation, elicited STP that decayed over approximately 20 minutes. A separate Results passage reports that an NMDA-receptor antagonist fully blocked the potentiation. The paired stimulation is an important condition of the finding. (LLM, conf=0.88)
- Not checked — no full text of the sourcecites [101] source
plaindirect- Asserted: passes — The authors put it forward as true.
- Checkable: passes — It can be checked against evidence.
- Load-bearing: fails — The paper’s conclusions may not depend on it.
- Based: passes — The paper gives a reason why it holds.
Probably not a substantial claim. The paper’s conclusions may not depend on it.
- Supported
The cited sources support only part of this claim — read each source’s verdict below.
In the paper
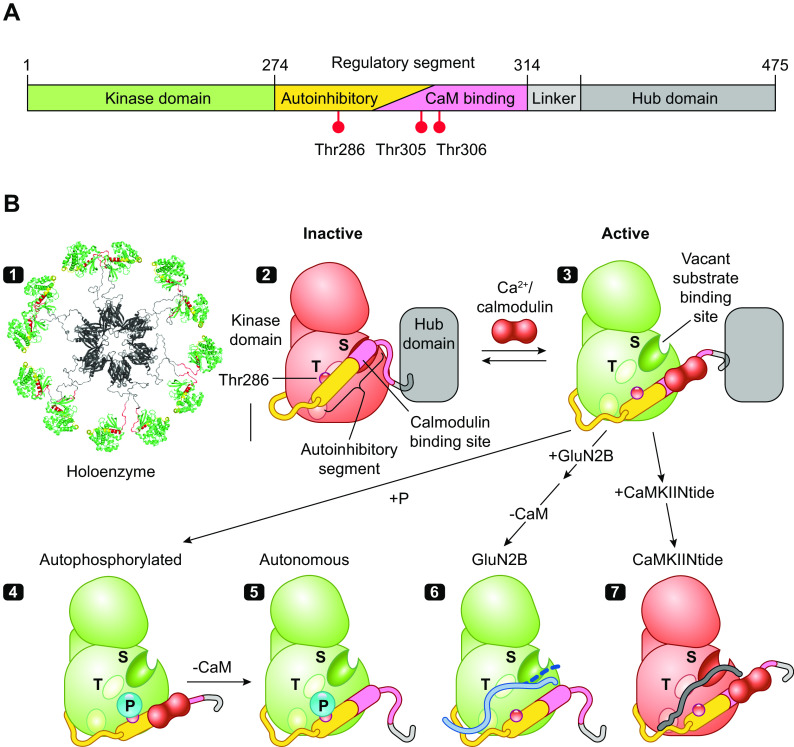
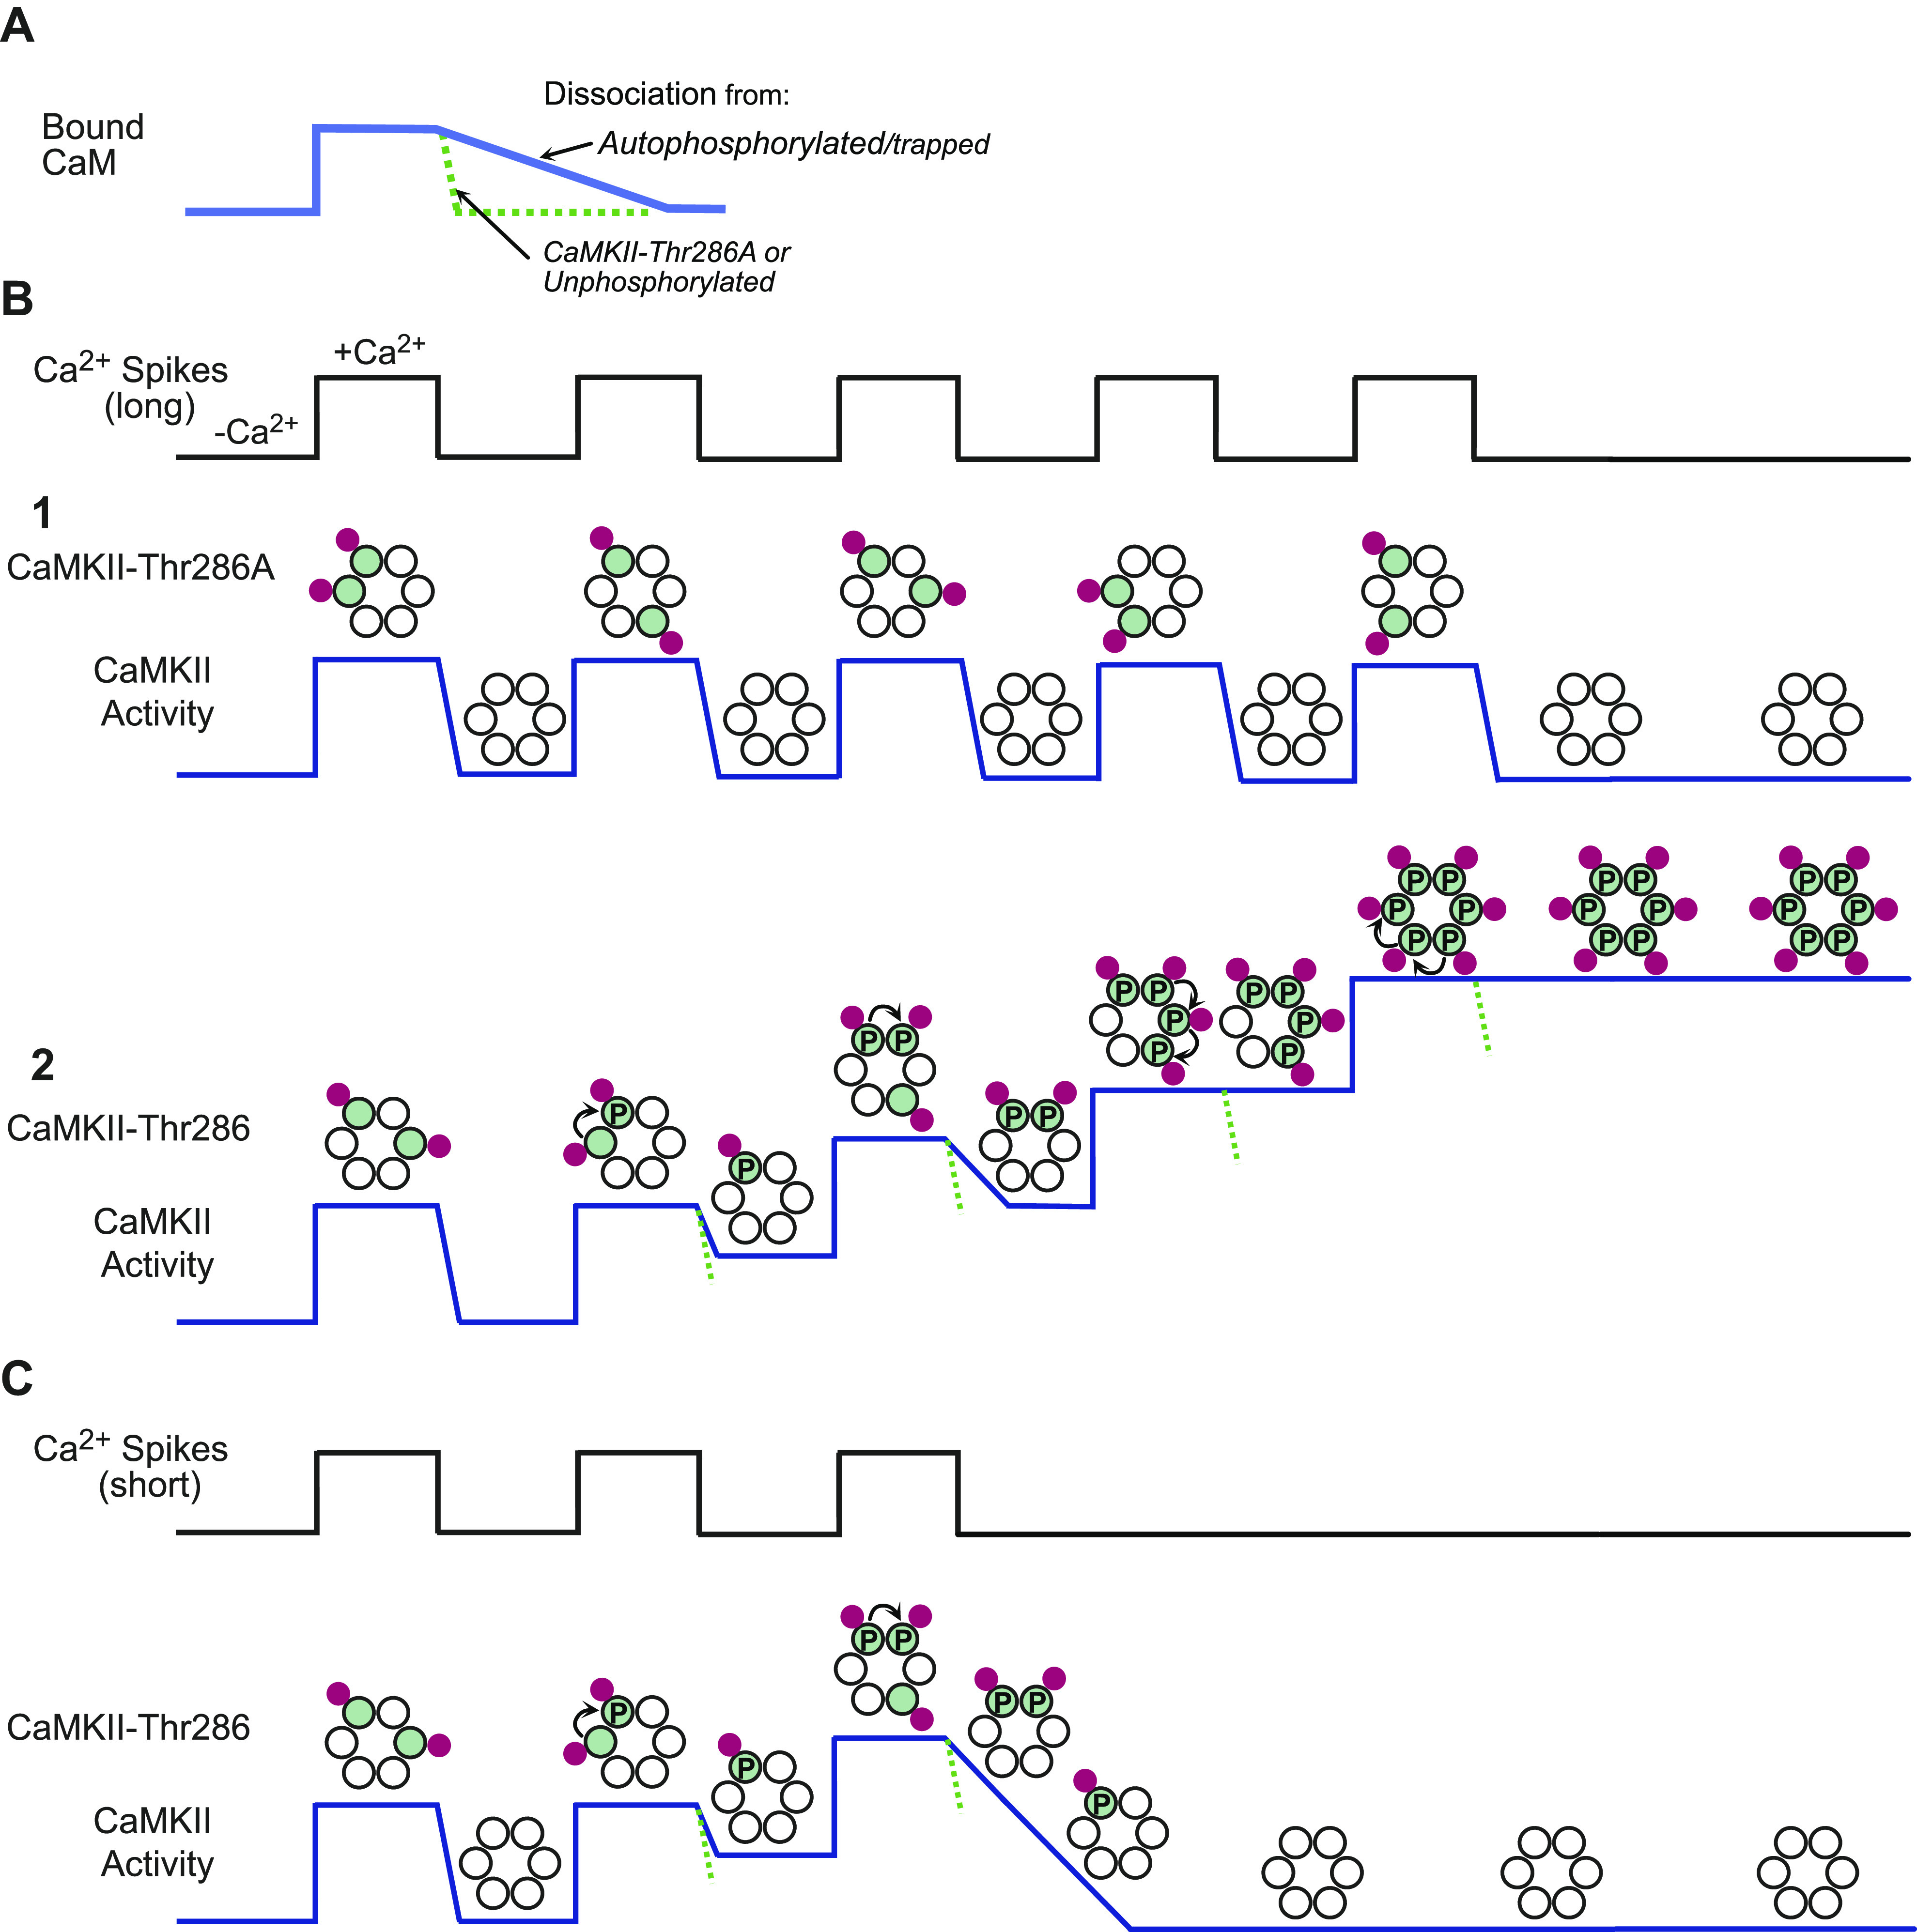
“However, once Ca2+/CaM dissociates from a kinase phosphorylated at T286, its autonomous activity quickly phosphorylates T305 and T306, blocking rebinding of Ca2+/CaM and exerting a brake on further Ca2+/CaM stimulation, in what is at times referred to as inhibitory autophosphorylation (80, 84–86).”
§ Synaptic memory and CaMKII > 3. CaMKII: STRUCTURE AND REGULATION
What the sources say
- Partly supportedcites [80] sourceExperimental — accuracy not yet measured
The Results report that phosphorylation at T286 produces autonomous activity and that removal of Ca2+ triggers a rapid inhibitory burst of autonomous autophosphorylation. Figure 8 depicts phosphorylation of a serine and a threonine after Ca2+/calmodulin dissociates, reducing further Ca2+/calmodulin-dependent activity. Our copy does not identify those inhibitory residues as T305 and T306 or establish that inhibition occurs by blocking Ca2+/calmodulin rebinding. (LLM, conf=0.88)
- Not checked — no full text of the sourcecites [84] source
- Not checked — no full text of the sourcecites [85] source
- Not checked — no full text of the sourcecites [86] source
plaindirect- Asserted: passes — The authors put it forward as true.
- Checkable: passes — It can be checked against evidence.
- Load-bearing: unclear — It is unclear whether the paper’s conclusions depend on it.
- Based: passes — The paper gives a reason why it holds.
It may state two separate claims as one.
- Partly supported
The cited sources support only part of this claim — read each source’s verdict below.
In the paper
“This autophosphorylation is primarily intersubunit autophosphorylation within a holoenzyme, although at very high kinase concentration it can also occur by an interholoenzyme mechanism (FIGURE 2B4) (71, 79–81).”
§ Synaptic memory and CaMKII > 3. CaMKII: STRUCTURE AND REGULATION
What the sources say
- Not checked — no full text of the sourcecites [71] source
- Not checked — no full text of the sourcecites [79] source
- Partly supportedcites [80] sourceExperimental — accuracy not yet measured
The discussion (page unavailable in our copy) identifies threonine 286 as the autophosphorylation site responsible for autonomous kinase activity. It does not establish that phosphorylation is primarily between subunits of one holoenzyme or that phosphorylation between holoenzymes occurs at very high kinase concentrations; searches for those mechanisms found no supporting passage. (LLM, conf=0.82)
- Not matchedcites [81]
Couldn’t be matched to a paper in Crossref, so it can’t be checked.
plaindirect- Asserted: passes — The authors put it forward as true.
- Checkable: passes — It can be checked against evidence.
- Load-bearing: unclear — It is unclear whether the paper’s conclusions depend on it.
- Based: passes — The paper gives a reason why it holds.
It may state two separate claims as one.
Every source the paper cites for this claim was checked and supports it.
In the paper
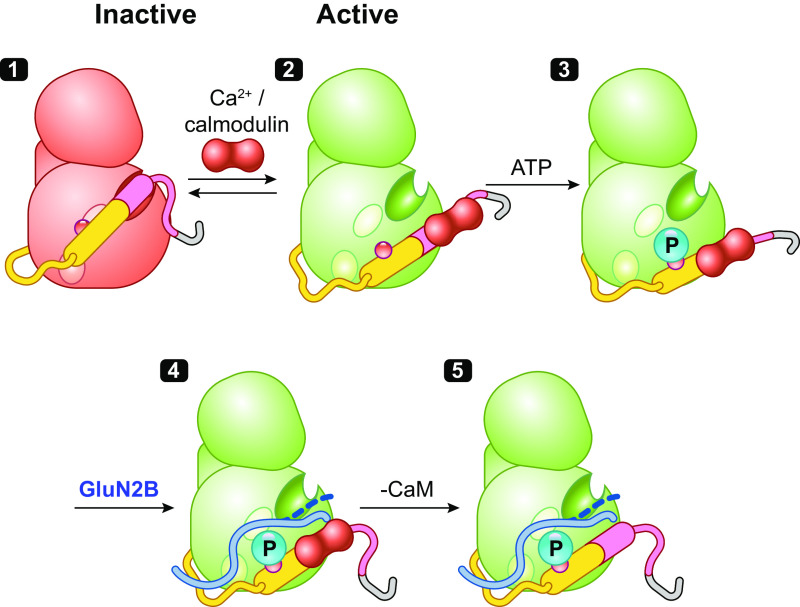
“The binding of Ca2+/CaM peels off the regulatory segment from the surface of the kinase, thus unlocking constraints on catalytic competency and providing access to substrates and CaMKII interacting and anchoring proteins (e.g., GluN2B, Tiam1, and CaMKIIN) (61).”
§ Synaptic memory and CaMKII > 3. CaMKII: STRUCTURE AND REGULATION
What the sources say
- Supportedcites [61] source
The Results section, “A proposed model for persistent CaMKII activity” (page unavailable), states that Ca2+/CaM binding releases autoinhibition and puts the kinase in an “on” state. The Results section on αD-helix rotation explains that removal of the regulatory segment accommodates binding partners including GluN2B, Tiam1, and CaMKIIN, supporting the cited sentence’s description of access to substrates and interacting proteins. (LLM, conf=0.91)
plaindirect- Asserted: passes — The authors put it forward as true.
- Checkable: passes — It can be checked against evidence.
- Load-bearing: passes — The paper’s conclusions depend on it.
- Based: passes — The paper gives a reason why it holds.
It may state two separate claims as one.
- Supported
The cited sources support only part of this claim — read each source’s verdict below.
In the paper
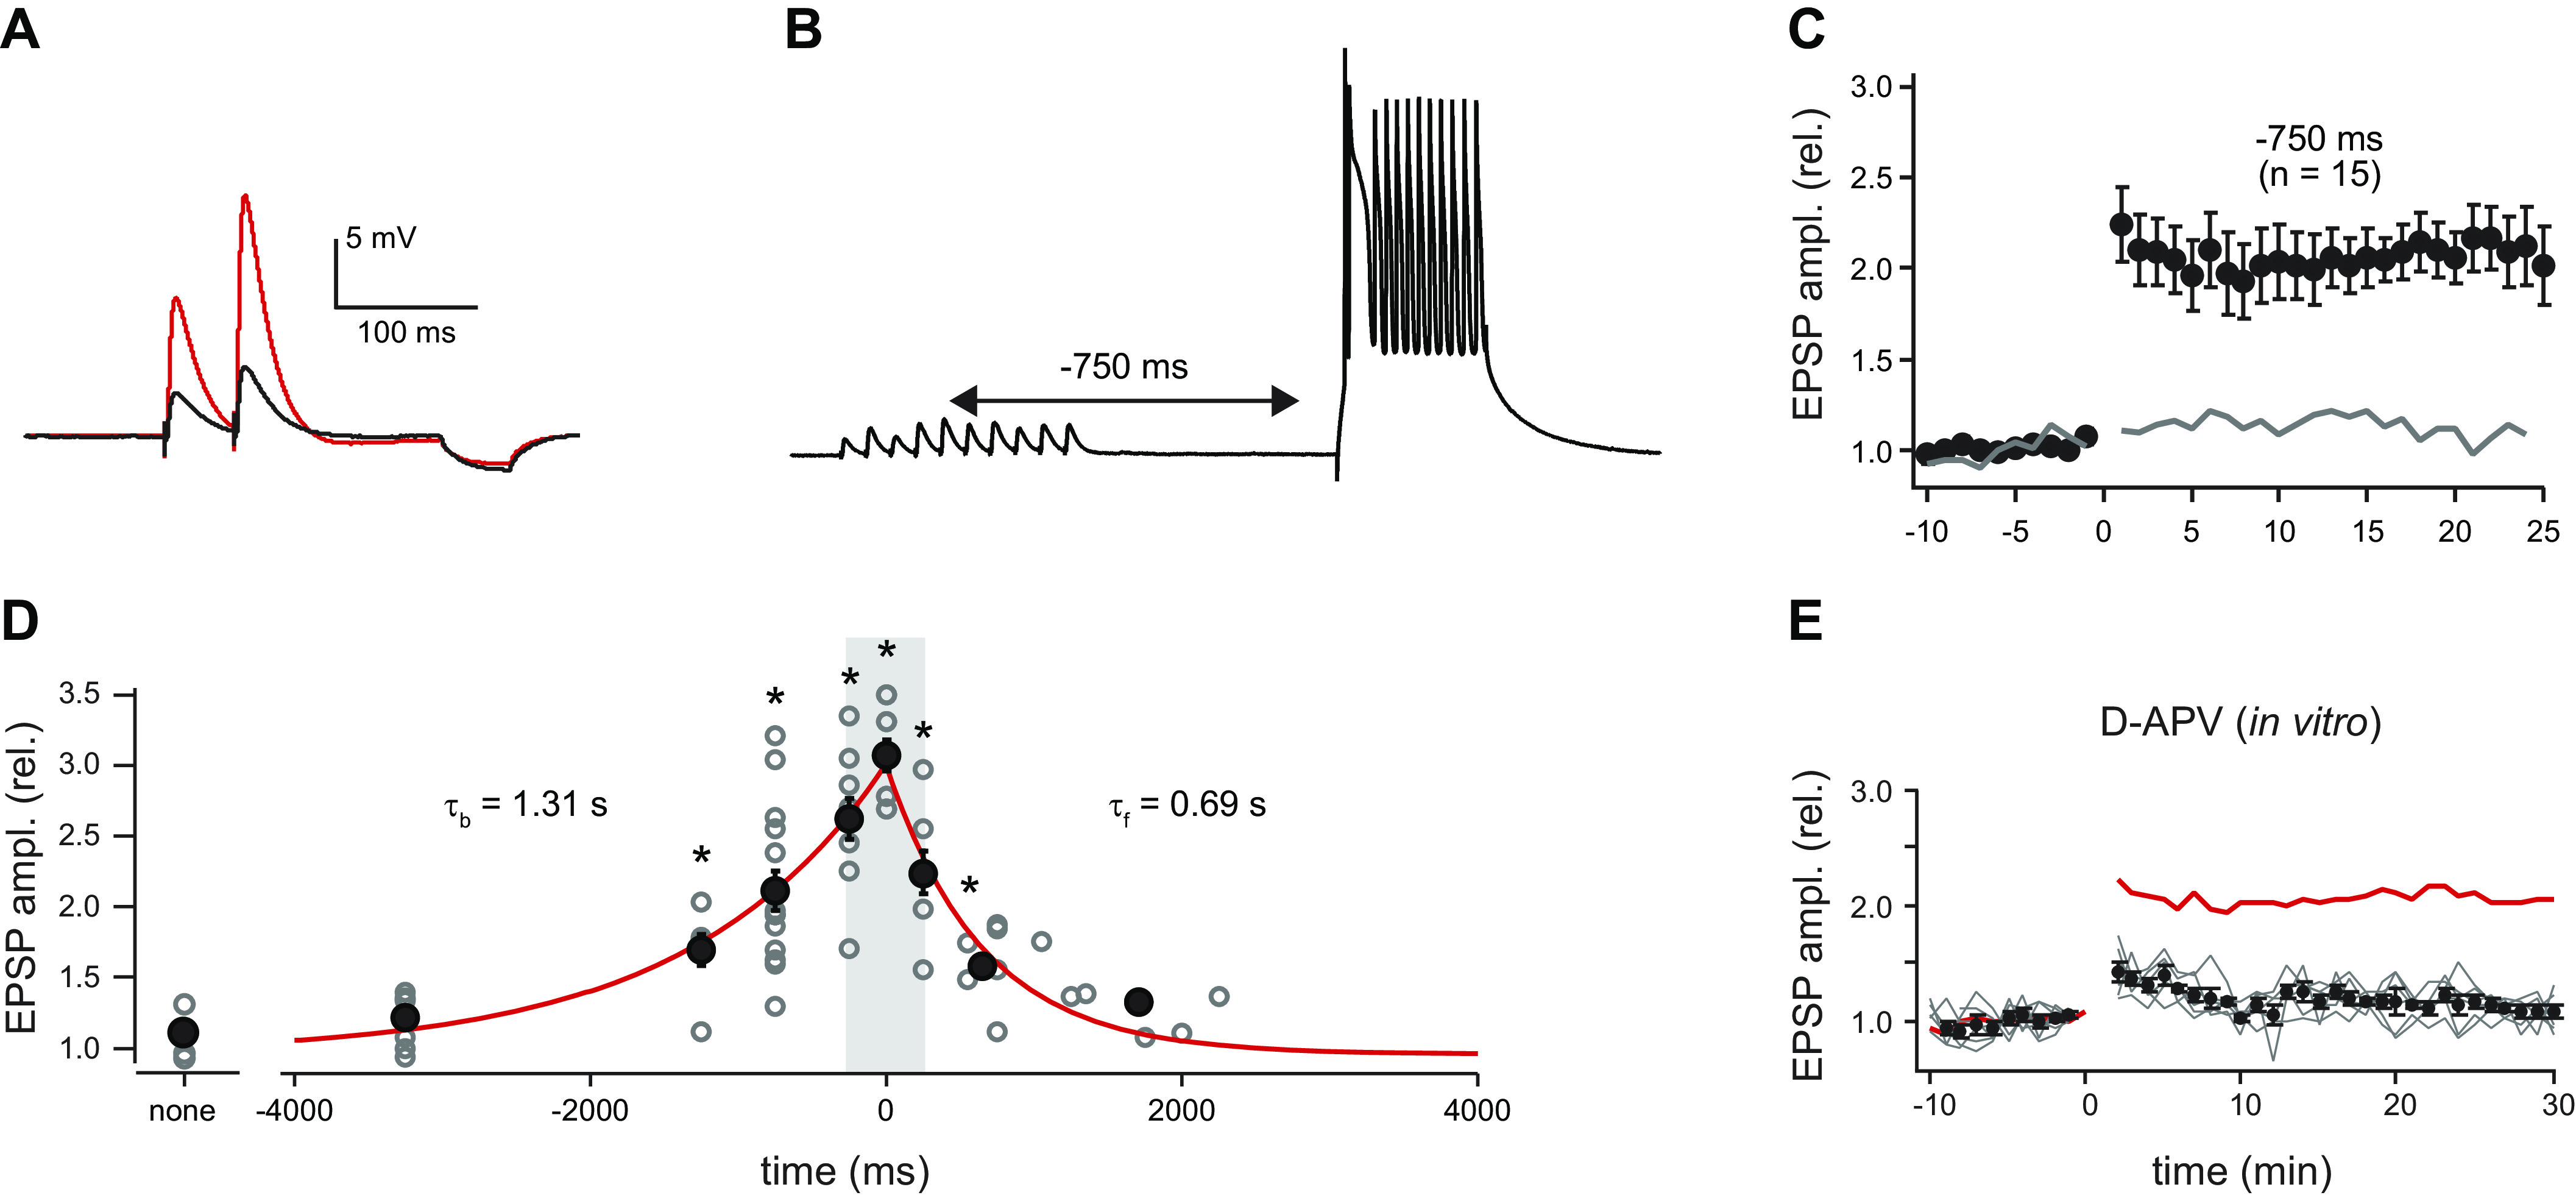
“It is NMDAR dependent, but unlike classical LTP the coincidence time window is seconds, not milliseconds.”
§ Synaptic memory and CaMKII > 3. CaMKII: STRUCTURE AND REGULATION > 3.1. CaMKII and Integration of Ca2+ Stimuli
What the sources say
- Partly supportedcites [103] sourceExperimental — accuracy not yet measured
The Introduction describes BTSP as acting within a seconds-long window, and the Results section on initial membrane voltage says BTSP induction requires NMDA-type glutamate receptors, citing prior work and reporting an experiment consistent with that requirement. The Discussion contrasts BTSP with the short-timescale synchrony of traditional Hebbian plasticity, but our copy does not specify a millisecond coincidence window for classical LTP. (LLM, conf=0.83)
- Supportedcites [104] source
The indexed copy (section labelled Abstract; page unavailable) reports that NMDAR blockade reduced BTSP potentiation by 84%, supporting NMDAR dependence without implying complete blockade. It also reports a seconds-long pairing window and describes the plasticity kernel as two orders of magnitude longer than that expected for standard plasticity. (LLM, conf=0.91)
- Partly supportedcites [105] sourceExperimental — accuracy not yet measured
The Introduction (page unavailable) says BTSP affects inputs active several seconds before a burst and calls it a departure from conventional plasticity schemes, supporting the seconds-scale distinction. The available passages do not state that BTSP is NMDAR dependent or explicitly quantify classical LTP’s window in milliseconds. (LLM, conf=0.84)
- Not checked — no full text of the sourcecites [106] source
plaindirect- Asserted: passes — The authors put it forward as true.
- Checkable: passes — It can be checked against evidence.
- Load-bearing: unclear — It is unclear whether the paper’s conclusions depend on it.
- Based: passes — The paper gives a reason why it holds.
It may state two separate claims as one.
- Partly supported
Every source the paper cites for this claim was checked and supports it.
In the paper
“Self-association occurring in transfected cells was used to show that the I205K mutant that blocks docking of GluN2B to the kinase also blocks clustering, suggesting that the regulatory segment and GluN2B have an overlapping docking site (134).”
§ Synaptic memory and CaMKII > 3. CaMKII: STRUCTURE AND REGULATION > 3.4. Self-Association of CaMKII
What the sources say
- Supportedcites [134] source
The ‘Determinants within the catalytic domain’ section reports that Ile205Lys, previously shown to prevent CaMKII binding to NR2B (GluN2B), also prevented self-association in transfected HEK293 cells. The Discussion identifies Ile205 as part of a targeting site that interacts with NR2B and is proposed to interact with the Thr286 region of the autoregulatory segment, supporting the claim’s suggested overlap. (LLM, conf=0.92)
hedgeddirect- Asserted: passes — The authors put it forward as true.
- Checkable: passes — It can be checked against evidence.
- Load-bearing: passes — The paper’s conclusions depend on it.
- Based: passes — The paper gives a reason why it holds.
It may state two separate claims as one.
- Supported
The cited sources support only part of this claim — read each source’s verdict below.
In the paper
“Two aspects of kinase structure reduce clustering, one is the CaMKIIβ subunit and another is T286 phosphorylation, but these are countered by the high CaMKII concentration at the PSD (134, 135).”
§ Synaptic memory and CaMKII > 3. CaMKII: STRUCTURE AND REGULATION > 3.4. Self-Association of CaMKII
What the sources say
- Partly supportedcites [134] sourceExperimental — accuracy not yet measured
The section “Role of Thr286 autophosphorylation in CaMKII self-association” (page unavailable) reports that a phosphorylation-mimicking Thr286 mutation strongly reduced self-association, supporting the T286 part of the claim. The passages examined do not show that the CaMKIIβ subunit reduces clustering or that a high CaMKII concentration at the PSD counteracts either effect; the Discussion describes a concentrating effect of self-association, not that counteraction. (LLM, conf=0.84)
- Not checked — no full text of the sourcecites [135] source
plaindirect- Asserted: passes — The authors put it forward as true.
- Checkable: passes — It can be checked against evidence.
- Load-bearing: unclear — It is unclear whether the paper’s conclusions depend on it.
- Based: passes — The paper gives a reason why it holds.
It may state two separate claims as one.
- Partly supported
The cited sources support only part of this claim — read each source’s verdict below.
In the paper
“In the forebrain the ratio is roughly 3 α to 1 β, and holoenyzmes are composed of both subunits (155–157).”
§ Synaptic memory and CaMKII > 3. CaMKII: STRUCTURE AND REGULATION > 3.6. Comparison of CaMKIIα and CaMKIIβ
What the sources say
- Not checked — no full text of the sourcecites [155] source
- Partly supportedcites [156] sourceExperimental — accuracy not yet measured
The subunit-composition results report a 3:1 α:β ratio in material precipitated with the α-specific antibody and show that forebrain holoenzymes containing both subunits exist. The Discussion also says the preparation contains α-only homomers, so the claim is too broad if it means all holoenzymes contain both subunits; the paper reports a 2:1 ratio for the heteromers. (LLM, conf=0.86)
- Not checked — no full text of the sourcecites [157] source
plain- Asserted: passes — The authors put it forward as true.
- Checkable: passes — It can be checked against evidence.
- Load-bearing: fails — The paper’s conclusions may not depend on it.
- Based: passes — The paper gives a reason why it holds.
Probably not a substantial claim. The paper’s conclusions may not depend on it. It may state two separate claims as one.
Every source the paper cites for this claim was checked and supports it.
In the paper
“Inactive CaMKIIα, but not β, binds to Shank3, and when it is activated it dissociates (161).”
§ Synaptic memory and CaMKII > 3. CaMKII: STRUCTURE AND REGULATION > 3.6. Comparison of CaMKIIα and CaMKIIβ
What the sources say
- Supportedcites [161] source
The Results report that Shank3 binds CaMKIIα but not CaMKIIβ. They also show that its NTD-ANK region binds autoinhibited CaMKIIα and that T286 autophosphorylation disrupts the interaction. (LLM, conf=0.91)
plaindirect- Asserted: passes — The authors put it forward as true.
- Checkable: passes — It can be checked against evidence.
- Load-bearing: unclear — It is unclear whether the paper’s conclusions depend on it.
- Based: passes — The paper gives a reason why it holds.
It may state two separate claims as one.
- Supported
The cited sources support only part of this claim — read each source’s verdict below.
In the paper
“They inhibit kinase activity with high affinity by binding across the entire substrate binding site (FIGURE 2B7) (61, 147, 153), and therefore also block GluN2B binding (152, 154).”
§ Synaptic memory and CaMKII > 3. CaMKII: STRUCTURE AND REGULATION > 3.5. CaMKII Peptide Inhibitors
What the sources say
- Supportedcites [61] source
In Results (‘The CaMKII kinase domain has a single binding site’), CaMKIIN binds with high affinity (Kd = 39 ± 24 nM), and the structures place it on the same binding surface as GluN2B. Results (‘Testing the S and T site binding model’) reports that high levels of CaMKIIN completely inhibit substrate phosphorylation. The shared single site supports the stated inference that CaMKIIN blocks GluN2B binding; no page numbers are available in our copy. (LLM, conf=0.88)
- Partly supportedcites [147] sourceExperimental — accuracy not yet measured
The Results and discussion report that AIP potently inhibits CaMKII and binds a substrate-binding site. The paper studies AIP, not CaMKIINtides, and does not establish binding across the entire substrate-binding site. The citing sentence attaches different references to the GluN2B claim, so that part is not attributed to this source. (LLM, conf=0.84)
- Not checked — no full text of the sourcecites [153] source
plaindirect- Asserted: passes — The authors put it forward as true.
- Checkable: passes — It can be checked against evidence.
- Load-bearing: unclear — It is unclear whether the paper’s conclusions depend on it.
- Based: passes — The paper gives a reason why it holds.
It may state two separate claims as one.
- Supported
The sources with a verdict support this claim; the rest weren’t checked yet, have no full text we could read, or their verdicts aren’t rated yet.
In the paper
“The linker length affects CaM affinity and Ca2+ spike frequency sensitivity (69, 158) as well as rates of autophosphorylation (159).”
§ Synaptic memory and CaMKII > 3. CaMKII: STRUCTURE AND REGULATION > 3.6. Comparison of CaMKIIα and CaMKIIβ
What the sources say
- Not checked — no full text of the sourcecites [69] source
- Not checked — no full text of the sourcecites [158] source
- Supportedcites [159] source
Citation 159 is attached to the claim about autophosphorylation rates, not the preceding claims about CaM affinity or Ca2+ spike frequency sensitivity. The Concluding remarks state that longer linkers are expected to reduce the rate of activating trans-autophosphorylation, shifting the balance toward inhibitory phosphorylation; the Results and discussion also describe this rate relationship in a kinetic model. (LLM, conf=0.91)
plaindirect- Asserted: passes — The authors put it forward as true.
- Checkable: passes — It can be checked against evidence.
- Load-bearing: unclear — It is unclear whether the paper’s conclusions depend on it.
- Based: passes — The paper gives a reason why it holds.
It may state two separate claims as one.
The cited sources support only part of this claim — read each source’s verdict below.
In the paper
“Upon activation CaMKIIβ dissociates from F-actin because of competition with Ca2+/CaM for the F-actin binding region, and dissociation is made more persistent by specific autophosphorylation of CaMKIIβ in the F-actin binding region (171–174).”
§ Synaptic memory and CaMKII > 3. CaMKII: STRUCTURE AND REGULATION > 3.6. Comparison of CaMKIIα and CaMKIIβ
What the sources say
- Not checked — no full text of the sourcecites [171] source
- Partly supportedcites [172] sourceExperimental — accuracy not yet measured
The Results sections on phosphorylation of the F-actin-binding region report that Ca2+/CaM reduces CaMKIIβ binding to F-actin and that autophosphorylation in that region prevents binding from recovering after Ca2+ chelation (page not provided). But the paper describes competition as a possible steric-hindrance mechanism involving adjacent binding domains, not an established competition for the same F-actin-binding region. (LLM, conf=0.88)
- Not checked — no full text of the sourcecites [173] source
- Partly supportedcites [174] sourceExperimental — accuracy not yet measured
The Results section, “Activation of CaMKII Leads to a Loss of Bundling Activity” (page not provided), reports that Ca2+/calmodulin activation reverses CaMKIIβ-mediated F-actin bundling and that autophosphorylation contributes to a longer-lasting reversal. It does not establish that Ca2+/calmodulin competes specifically for the F-actin-binding region, or identify specific phosphorylation sites there as the cause of persistent dissociation. (LLM, conf=0.84)
plaindirect- Asserted: passes — The authors put it forward as true.
- Checkable: passes — It can be checked against evidence.
- Load-bearing: passes — The paper’s conclusions depend on it.
- Based: passes — The paper gives a reason why it holds.
It may state two separate claims as one.
Every source the paper cites for this claim was checked and supports it.
In the paper
“It is proposed that this CaMKIIα-Shank3 complex may serve as a nearby tethered reservoir pool of CaMKII (161).”
§ Synaptic memory and CaMKII > 3. CaMKII: STRUCTURE AND REGULATION > 3.6. Comparison of CaMKIIα and CaMKIIβ
What the sources say
- Supportedcites [161] source
The Introduction says inactive CaMKIIα is enriched in the Shank3 subcompartment of the postsynaptic density. The section “Recruitment of CaMKIIα to Shank3 condensates through direct interaction” proposes that CaMKIIα ‘stored’ by Shank3 can rapidly shift to NMDAR upon synapse activation, supporting the proposed nearby reservoir role (page unavailable). (LLM, conf=0.91)
hedgedconditional- Asserted: passes — The authors put it forward as true.
- Checkable: passes — It can be checked against evidence.
- Load-bearing: fails — The paper’s conclusions may not depend on it.
- Based: passes — The paper gives a reason why it holds.
Probably not a substantial claim. The paper’s conclusions may not depend on it.
- Supported
Every source the paper cites for this claim was checked and supports it.
In the paper
“Brief large-amplitude signals favor potentiation, whereas more modest long-duration signals favor depression (181).”
§ Synaptic memory and CaMKII > 4. Ca2+ AND LTP > 4.2. Postsynaptic Ca2+ and Sufficiency
What the sources say
- Supportedcites [181] source
The Discussion states that substantially increasing the amplitude of a brief postsynaptic calcium signal selectively activates LTP, while substantially increasing its duration selectively activates LTD. This supports the claim's contrast between brief large-amplitude and more modest long-duration signals. (LLM, conf=0.94)
plaindirect- Asserted: passes — The authors put it forward as true.
- Checkable: passes — It can be checked against evidence.
- Load-bearing: passes — The paper’s conclusions depend on it.
- Based: passes — The paper gives a reason why it holds.
It may state two separate claims as one.
- Supported
Every source the paper cites for this claim was checked and supports it.
In the paper
“Interestingly, deletion of CaMKIIβ impairs LTP (121, 172, 175), as does the deletion of CaMKIIα.”
§ Synaptic memory and CaMKII > 3. CaMKII: STRUCTURE AND REGULATION > 3.6. Comparison of CaMKIIα and CaMKIIβ
What the sources say
- Supportedcites [121] source
The Results section (‘The role of CaMKII in basal synaptic transmission and LTP’) reports that deleting CaMKIIα made LTP absent and that deleting CaMKIIβ blocked LTP similarly. This directly supports the attributed claim. (LLM, conf=0.95)
- Supportedcites [172] source
The Results section (‘Dissociation of CaMKIIβ from F-actin is necessary for functional and structural LTP’) reports that CaMKIIβ shRNA decreased LTP and says this was consistent with a study in CaMKIIβ knockout animals. The citation is attached to the CaMKIIβ claim, not the subsequent CaMKIIα clause. (LLM, conf=0.90)
- Supportedcites [175] source
In “Camk2b−/− mice show impaired LTP” (Fig. 3b), the paper reports a significant LTP deficit after CaMKIIβ deletion and says it is as severe as the deficit after loss of CaMKIIα. The same section reports impaired LTP in CaMKIIα-knockout mice under a stronger protocol (Fig. 3d). It also notes that the stronger protocol overcomes the CaMKIIβ-knockout deficit, so the claim does not hold for every induction protocol. (LLM, conf=0.93)
plaindirect- Asserted: passes — The authors put it forward as true.
- Checkable: passes — It can be checked against evidence.
- Load-bearing: unclear — It is unclear whether the paper’s conclusions depend on it.
- Based: passes — The paper gives a reason why it holds.
It may state two separate claims as one.
- Supported
The sources with a verdict support this claim; the rest weren’t checked yet, have no full text we could read, or their verdicts aren’t rated yet.
In the paper
“Activating VDCCs, which are present in spines, evokes cytosolic spine Ca2+ transients (185–187) and the activation of cytosolic spine CaMKII (188).”
§ Synaptic memory and CaMKII > 4. Ca2+ AND LTP > 4.2. Postsynaptic Ca2+ and Sufficiency
What the sources say
- Supportedcites [185] source
The cited paper supports the Ca2+ portion of the sentence: its main-text passage labeled Abstract reports spine-head Ca2+ signals mediated exclusively by voltage-gated Ca2+ channels. The sentence attaches a separate citation (188) to CaMKII activation, so that portion is not attributed to this source. (LLM, conf=0.93)
- Not checked — no full text of the sourcecites [186] source
- Not checked — no full text of the sourcecites [187] source
- Supportedcites [188] source
Citation 188 is attached to the CaMKII-activation part of the sentence, not the spine Ca2+ transient claim. The paper’s “Channel specific activation of CaMKII” section reports that blocking L-type voltage-sensitive calcium channels abolished CaMKII activation in dendritic spines during depolarization. It specifies that this effect depends on L-type channels rather than voltage-dependent calcium channels generally; page numbers are unavailable in our copy. (LLM, conf=0.91)
plaindirect- Asserted: passes — The authors put it forward as true.
- Checkable: passes — It can be checked against evidence.
- Load-bearing: passes — The paper’s conclusions depend on it.
- Based: passes — The paper gives a reason why it holds.
It may state two separate claims as one.
- Supported
The cited sources support only part of this claim — read each source’s verdict below.
In the paper
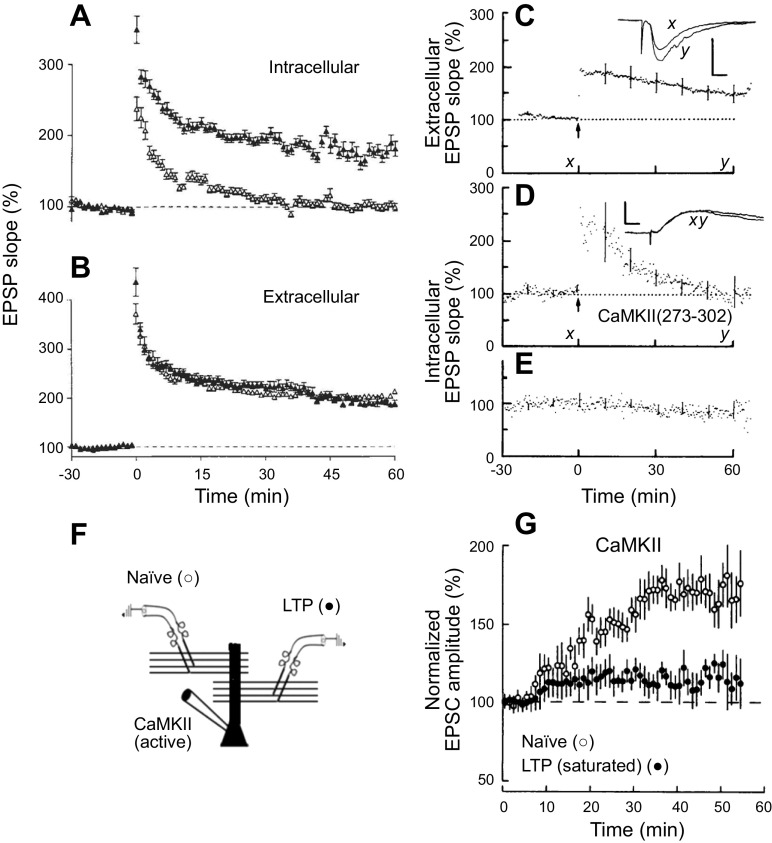
“Expression of active CaMKII (121, 130–132, 209, 210, 212) or direct delivery into the cell via the recording electrode (199) has repeatedly revealed a roughly two- to threefold enhancement in the AMPAR EPSC but little change in the NMDAR EPSC (130–132).”
§ Synaptic memory and CaMKII > 5. CaMKII AND THE INDUCTION OF LTP > 5.2. CaMKII and Sufficiency
What the sources say
- Partly supportedcites [121] sourceExperimental — accuracy not yet measured
In Results, ‘CaMKII constitutive activity and the maintenance of LTP’ (Fig. 10; page unavailable), expression of constitutively active CaMKIIα increased AMPAR EPSCs to about 250% of control. The cited passages do not report NMDAR EPSCs for that active-kinase experiment, so they do not establish the claimed little change in NMDAR EPSCs. Direct delivery through a recording electrode is attributed to a different citation in the citing sentence. (LLM, conf=0.83)
- Not checked — no full text of the sourcecites [130] source
- Partly supportedcites [131] sourceExperimental — accuracy not yet measured
The Results (Fig. 2; page not specified in our copy) report that expression of active αCaMKII increased AMPAR EPSCs to 3.73 ± 0.9 times control, with no significant change in NMDAR EPSCs. This supports the selective enhancement, but the reported mean is above the claimed roughly two- to threefold range. The recording-electrode delivery method is cited separately in the citing sentence, not attributed to this paper. (LLM, conf=0.87)
- Not checked — no full text of the sourcecites [132] source
- Not checked — no full text of the sourcecites [209] source
plaindirect- Asserted: passes — The authors put it forward as true.
- Checkable: passes — It can be checked against evidence.
- Load-bearing: passes — The paper’s conclusions depend on it.
- Based: passes — The paper gives a reason why it holds.
It may state two separate claims as one.
- Partly supported
The cited sources support only part of this claim — read each source’s verdict below.
In the paper
“Just using a T286D mutation would be problematic because it generates a constitutively active kinase that then results in the phosphorylation of T305/T306, which can counteract T286D and alter resident time at the synapse (88, 210, 211).”
§ Synaptic memory and CaMKII > 5. CaMKII AND THE INDUCTION OF LTP > 5.2. CaMKII and Sufficiency
What the sources say
- Not checked — no full text of the sourcecites [88] source
- Partly supportedcites [210] sourceExperimental — accuracy not yet measured
The Results describe T286D as an active form of CaMKII and hypothesize that it might autophosphorylate T305/T306; they do not establish that this phosphorylation necessarily occurs. The Results and Discussion show that T305/T306 phosphorylation can counteract T286D-associated potentiation, and the Discussion says it reduces binding to the postsynaptic density. The paper does not report a change in residence time at the synapse (page numbers unavailable in our copy). (LLM, conf=0.86)
- Partly supportedcites [211] sourceExperimental — accuracy not yet measured
The Results and Discussion (pages unavailable) describe T286D as constitutively autonomous and report that T305/306 phosphorylation is expected to follow its activity and can inhibit further Ca²⁺/calmodulin stimulation and reduce GluN2B binding. They also report a possible further reduction in synaptic localization, significant by t test but not ANOVA. The paper does not measure synaptic residence time, so that specific effect is not established. (LLM, conf=0.84)
plaindirect- Asserted: passes — The authors put it forward as true.
- Checkable: passes — It can be checked against evidence.
- Load-bearing: passes — The paper’s conclusions depend on it.
- Based: passes — The paper gives a reason why it holds.
It may state two separate claims as one.
The cited sources support only part of this claim — read each source’s verdict below.
In the paper
“Most AMPARs in CA1 hippocampal pyramidal cells are tetraheteromeric assemblies of either GluA1/GluA2 subunits or GluA2/GluA3 subunits with a preponderance of GluA1/GluA2 subunits (264–266).”
§ Synaptic memory and CaMKII > 7. CaMKII AND THE EXPRESSION OF LTP (CaMKII TARGETS) > 7.3. Receptor-centric Model
What the sources say
- Supportedcites [264] source
The Results section (“Synaptic transmission is mediated primarily by GluA1A2 heteromeric receptors”; page unavailable) estimates that about 80% of receptors at excitatory synapses of CA1 pyramidal neurons are GluA1A2 heteromers and about 16% are GluA2A3 heteromers. The Introduction describes AMPARs as heterotetrameric receptors, supporting the assembly description. (LLM, conf=0.91)
- Not checked — no full text of the sourcecites [265] source
- Partly supportedcites [266] sourceExperimental — accuracy not yet measured
The immunoprecipitation results report that most complexes in the CA1/CA2 pyramidal-neuron preparation contain GluR1/GluR2 or GluR2/GluR3. Our copy does not establish a four-subunit assembly for those complexes or a clear preponderance of GluR1/GluR2 over GluR2/GluR3, and the preparation includes CA2 as well as CA1 (pages unavailable in the indexed copy). (LLM, conf=0.84)
plain- Asserted: passes — The authors put it forward as true.
- Checkable: passes — It can be checked against evidence.
- Load-bearing: unclear — It is unclear whether the paper’s conclusions depend on it.
- Based: passes — The paper gives a reason why it holds.
It may state two separate claims as one.
- Supported
The sources with a verdict support this claim; the rest weren’t checked yet, have no full text we could read, or their verdicts aren’t rated yet.
In the paper
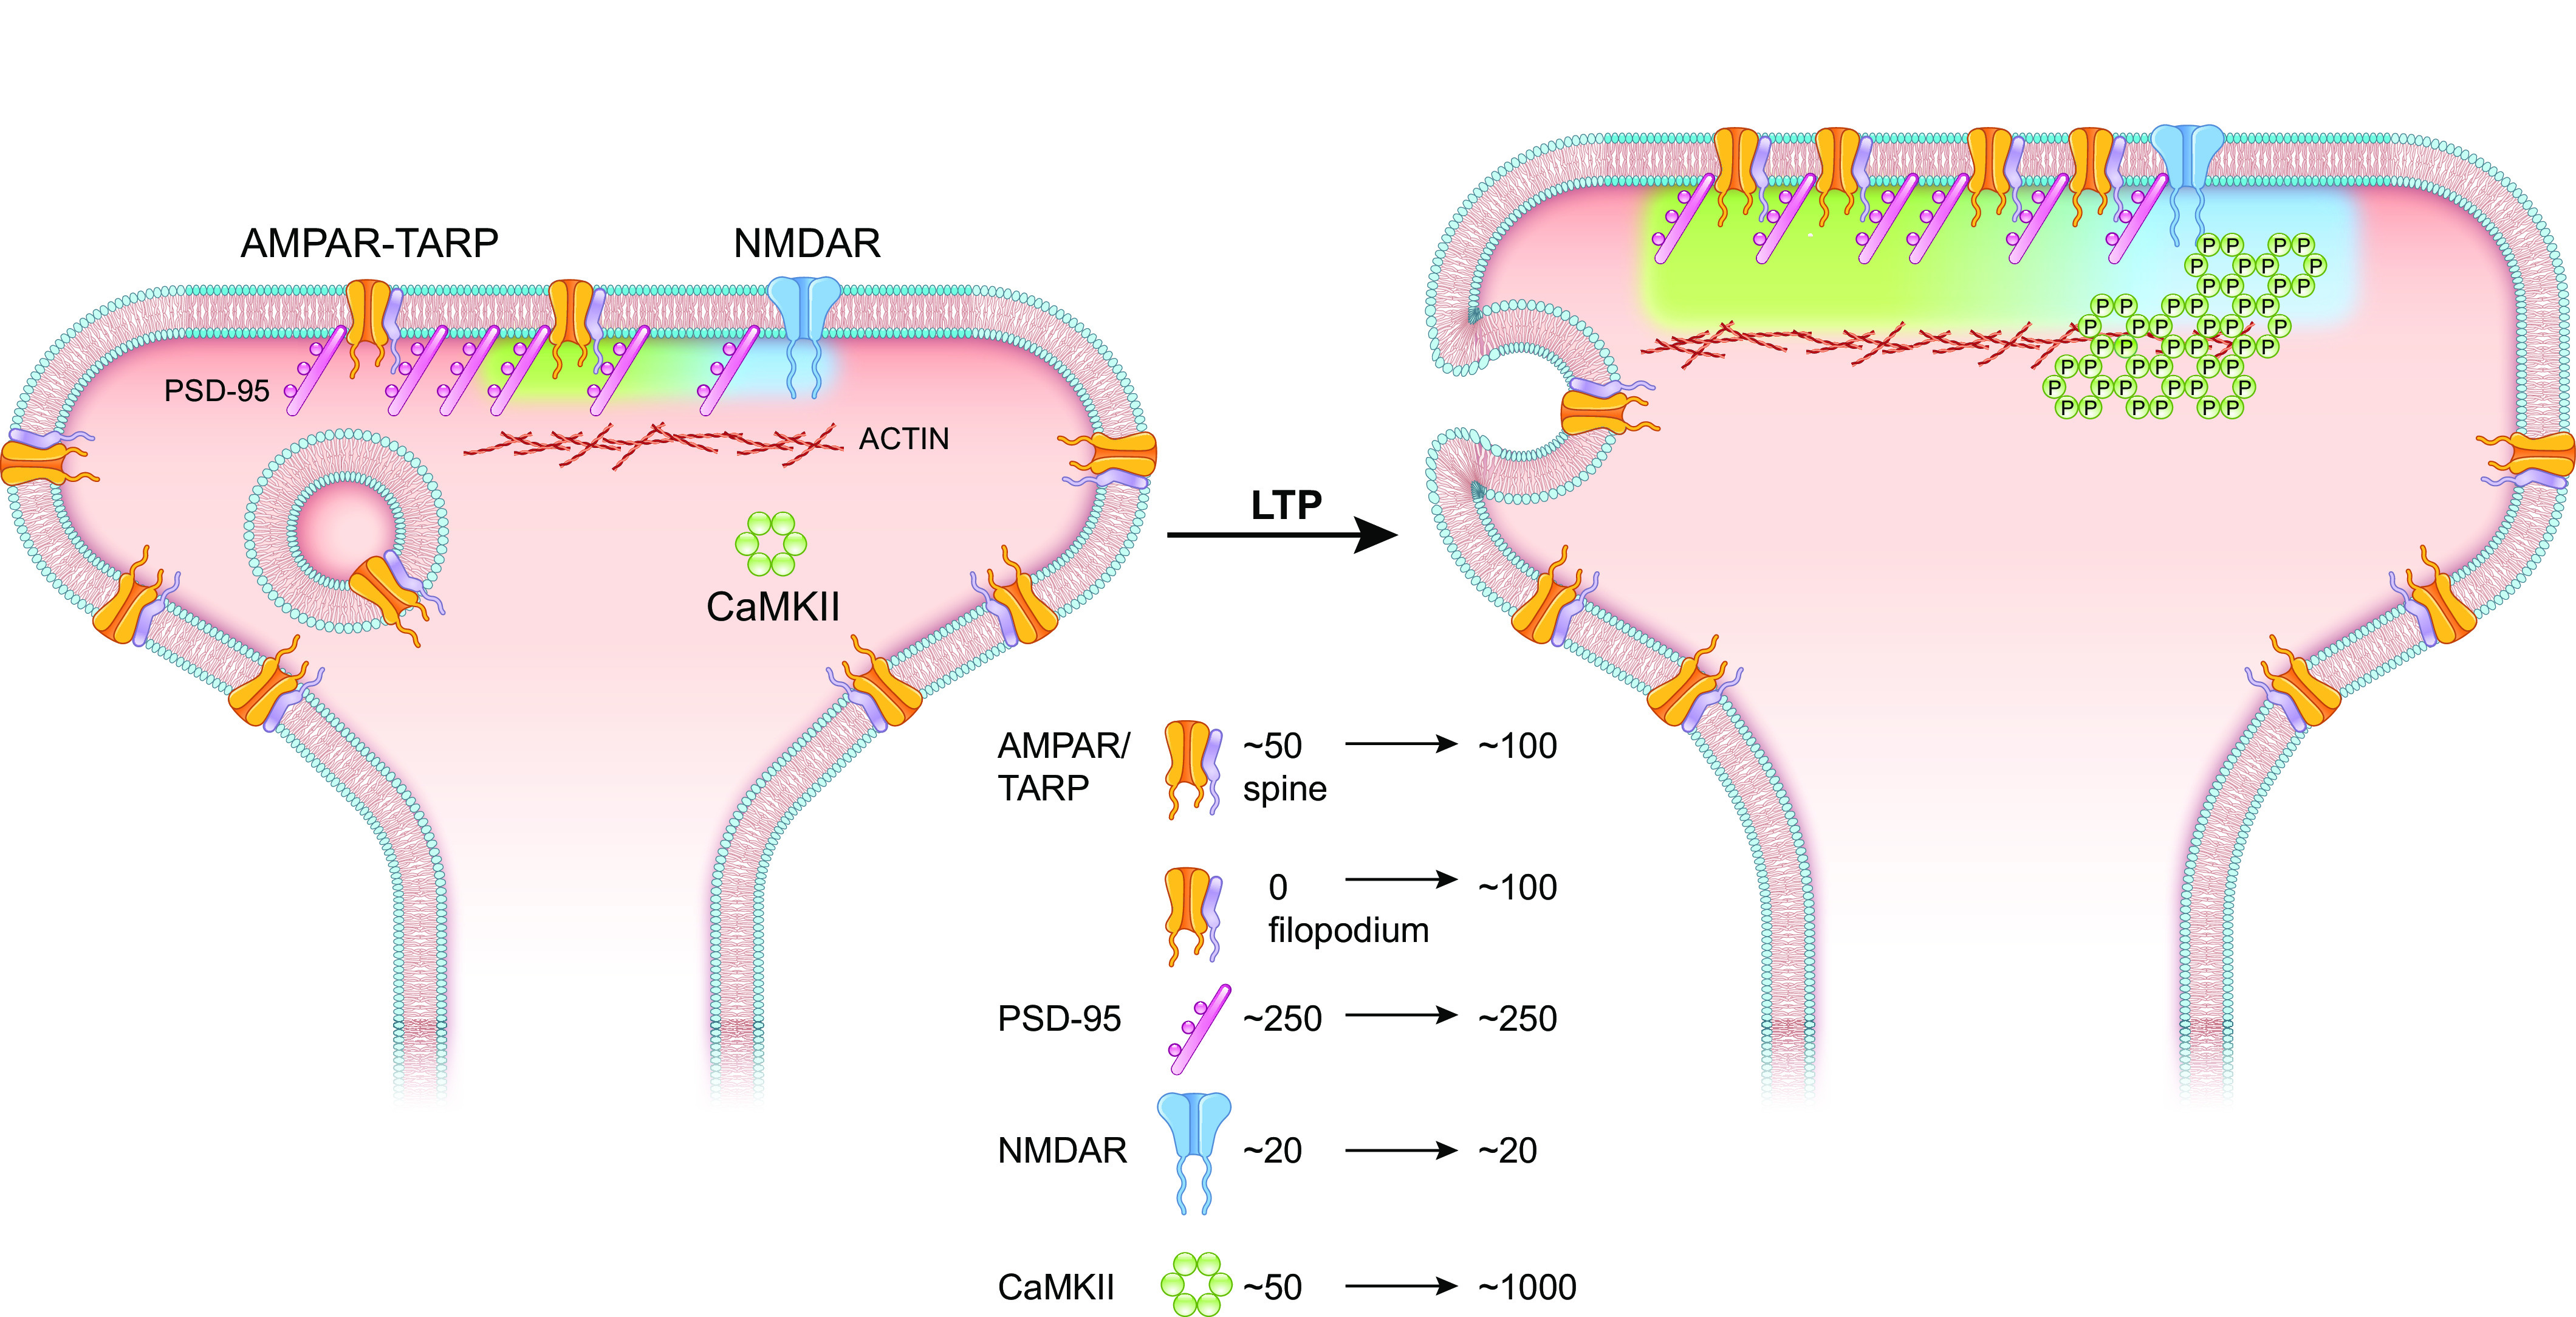
“It is suggested that activity-dependent synaptic recruitment of AMPARs may involve two steps (259, 261). First, AMPARs are delivered to the PSD, but this is not enough to increase synaptic strength. Second, the newly recruited AMPARs are added to AMPAR clusters in the nanocolumn.”
§ Synaptic memory and CaMKII > 7. CaMKII AND THE EXPRESSION OF LTP (CaMKII TARGETS) > 7.1. Dynamic Properties of the PSD
What the sources say
- Not checked — no full text of the sourcecites [259] source
- Supportedcites [261] source
The Discussion sections “Paradoxical functional effects of AMPA receptor recruitment” and “AMPA receptor recruitment and plasticity” propose that receptors recruited to the PSD may need to be concentrated in functional nanodomains to potentiate established synapses. This supports the citing sentence’s hedged two-step account. The paper calls these sites nanodomains rather than nanocolumns and notes that PSD recruitment alone can activate weak or silent synapses. (LLM, conf=0.88)
hedgedconditional- Asserted: passes — The authors put it forward as true.
- Checkable: passes — It can be checked against evidence.
- Load-bearing: unclear — It is unclear whether the paper’s conclusions depend on it.
- Based: passes — The paper gives a reason why it holds.
It may state two separate claims as one.
The cited sources support only part of this claim — read each source’s verdict below.
In the paper
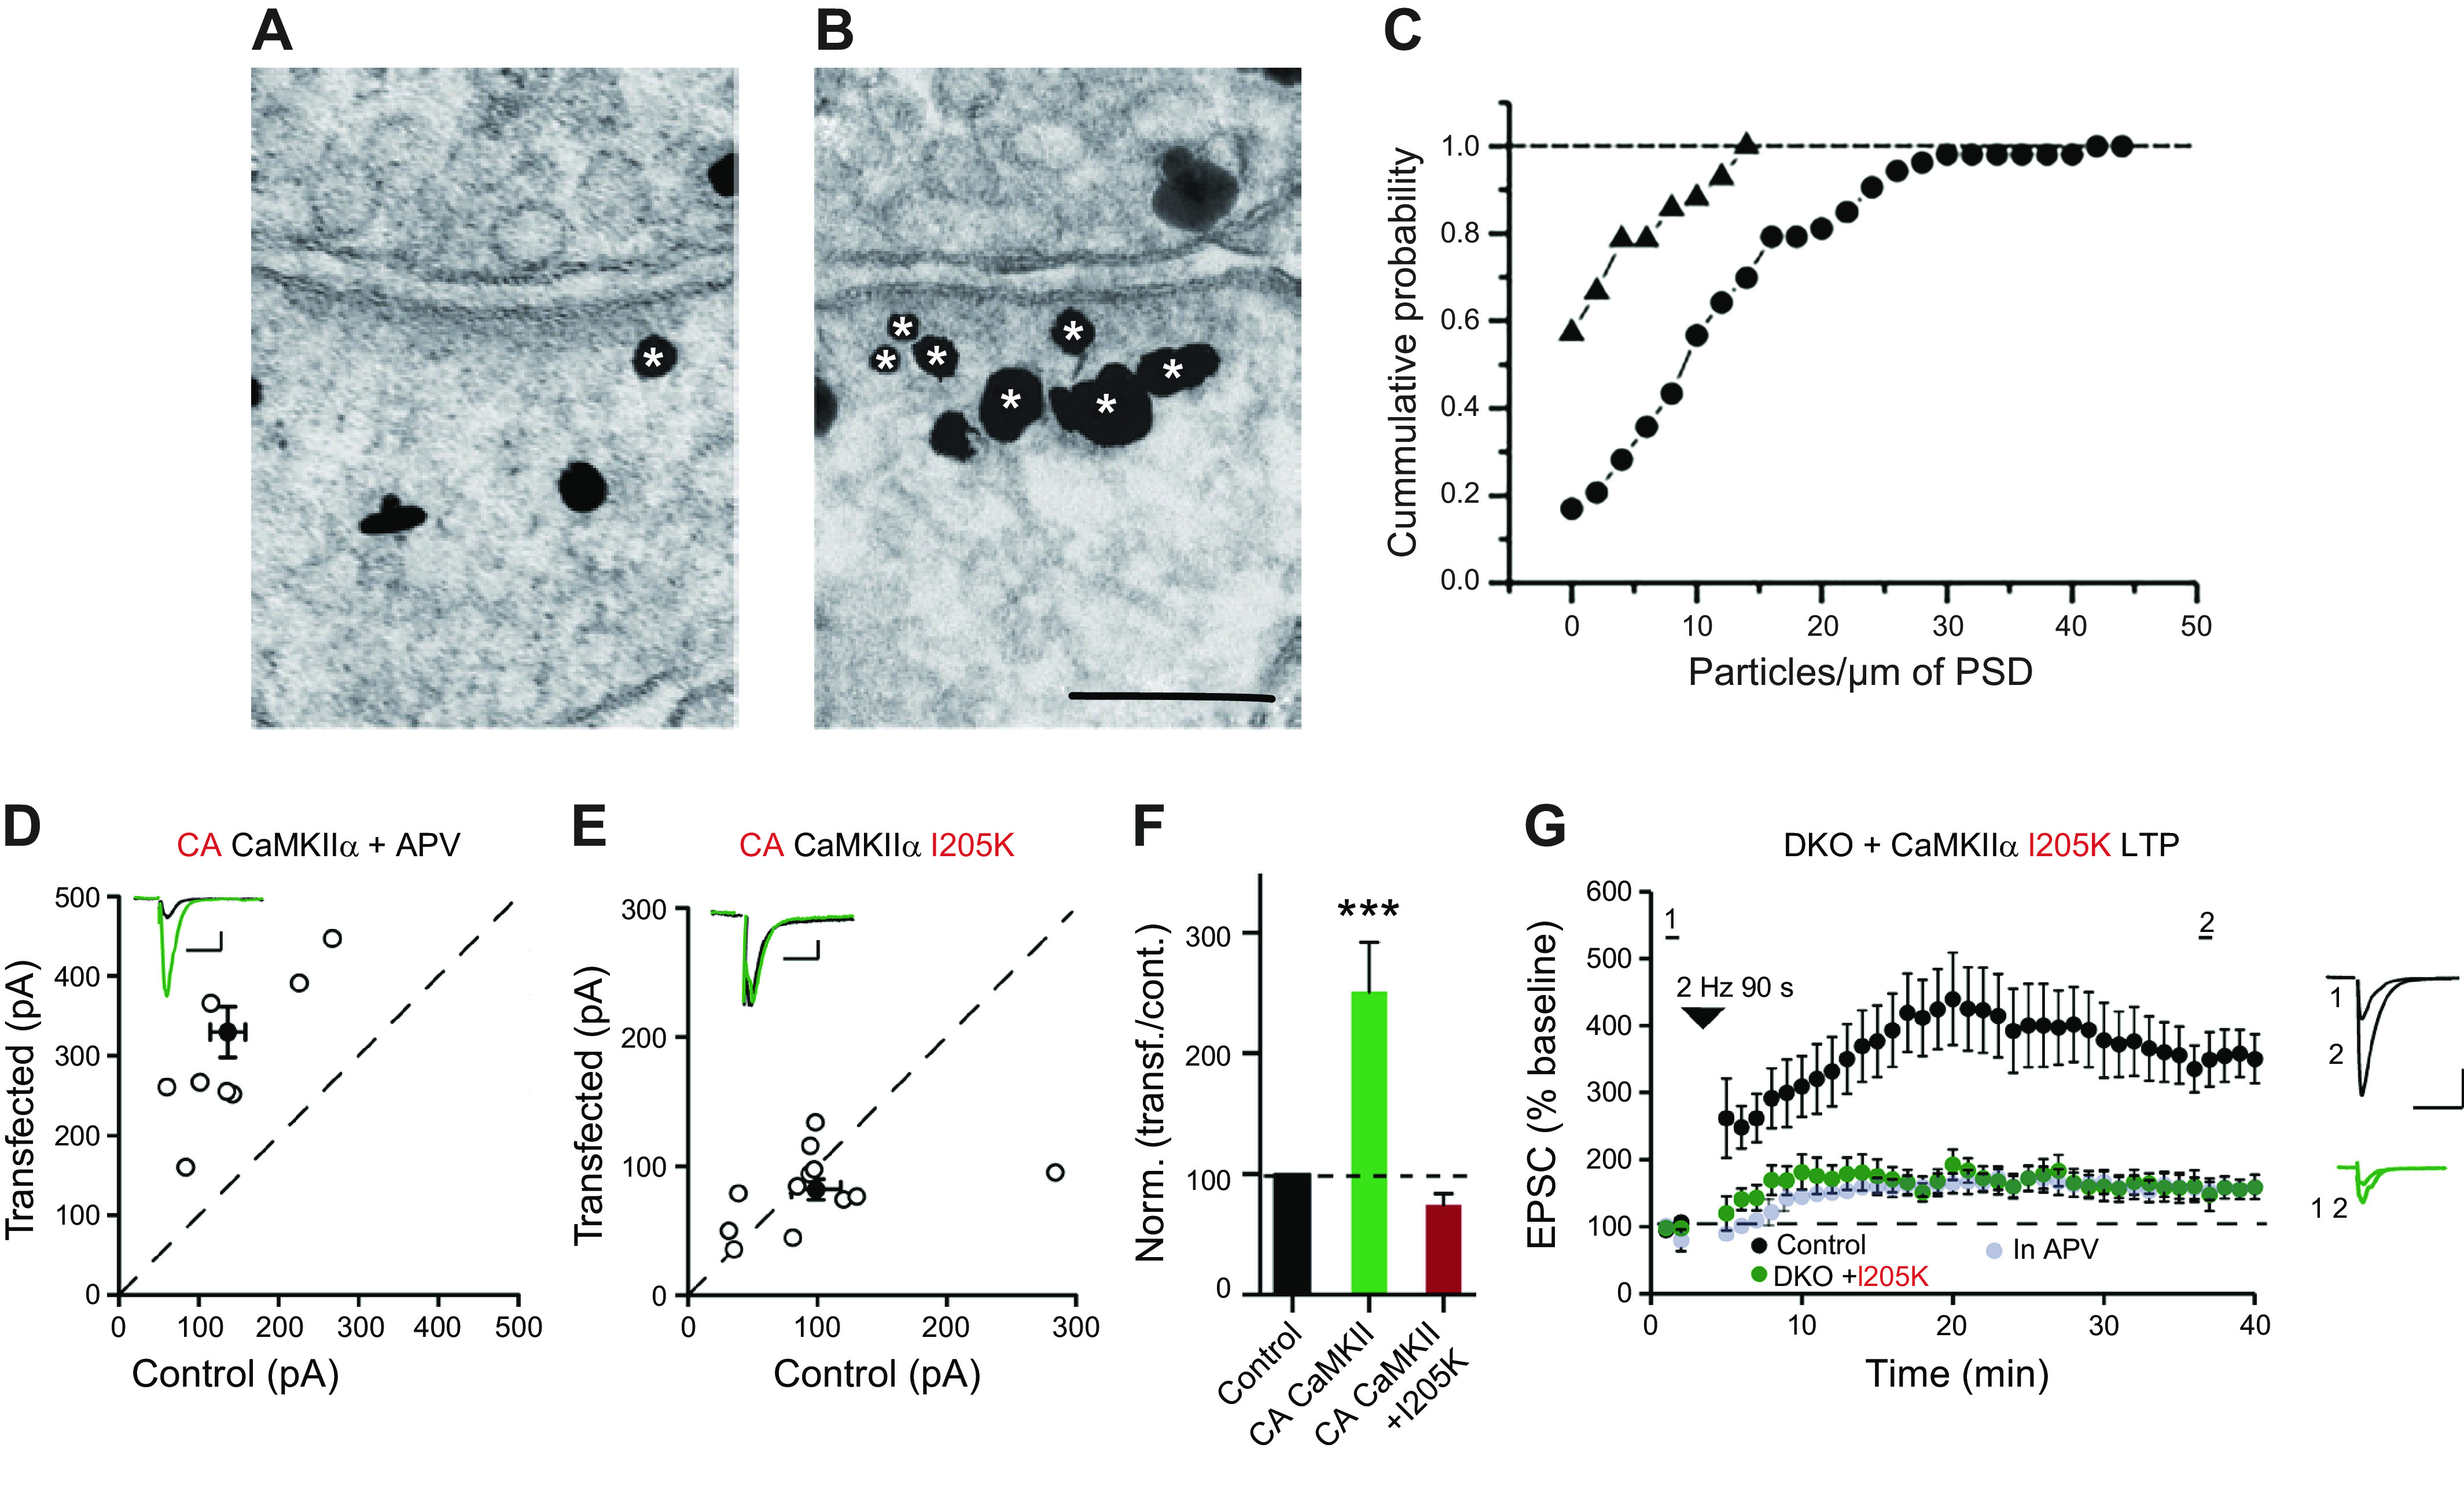
“Intriguingly, AMPAR responses were reduced ∼50%, similar to the reduction seen by deleting CaMKII”
§ Synaptic memory and CaMKII > 6. CaMKII BINDING TO NMDARs
What the sources say
- Partly supportedcites [121] sourceExperimental — accuracy not yet measured
The Results (Fig. 9 caption; page not provided) report that replacement with GluN2Bmut left AMPAR responses at 48.5% of control. The Results and Discussion also report an approximately 50% reduction after CaMKIIα deletion. Our copy does not identify GluN2Bmut as L1298A-R1300Q, so that specific mutation designation remains unverified. (LLM, conf=0.82)
plaindirect- Asserted: passes — The authors put it forward as true.
- Checkable: passes — It can be checked against evidence.
- Load-bearing: passes — The paper’s conclusions depend on it.
- Based: passes — The paper gives a reason why it holds.
It may state two separate claims as one.
- Partly supported
Every source the paper cites for this claim was checked and supports it.
In the paper
“Replacement with the mutant GluN2B had no effect on NMDAR synaptic currents, indicating that it is functional.”
§ Synaptic memory and CaMKII > 6. CaMKII BINDING TO NMDARs
What the sources say
- Supportedcites [121] source
In Results, under “The synaptic actions of CaMKII require binding to NMDARs” (page not provided), the authors report that mutant GluN2B fully rescued NMDAR synaptic currents and conclude that the mutation did not affect NMDAR function. Figure 9 likewise shows no significant difference in NMDAR EPSCs for the mutant replacement. (LLM, conf=0.93)
- Supportedcites [120] source
The Introduction identifies the knock-in mutation as GluN2B L1298A/R1300Q. In the Results section on basal synaptic transmission, the authors report that NMDAR-mediated synaptic response measurements were indistinguishable between wild-type and knock-in mice and conclude that postsynaptic NMDAR function was unchanged under basal conditions. (LLM, conf=0.89)
hedged- Asserted: passes — The authors put it forward as true.
- Checkable: passes — It can be checked against evidence.
- Load-bearing: passes — The paper’s conclusions depend on it.
- Based: passes — The paper gives a reason why it holds.
It may state two separate claims as one.
- Supported
Every source the paper cites for this claim was checked and supports it.
In the paper
“Furthermore, AMPARs are highly mobile in the extrasynaptic membrane and can diffuse into and out of the synapse (20).”
§ Synaptic memory and CaMKII > 7. CaMKII AND THE EXPRESSION OF LTP (CaMKII TARGETS) > 7.4. PSD-centric Model
What the sources say
- Supportedcites [20] source
The section on AMPAR surface diffusion describes the high mobility of extrasynaptic AMPARs and their exchange with synaptic membranes by lateral diffusion. It also reports independent confirmation that synaptic AMPARs rapidly exchange with the extrasynaptic pool. (LLM, conf=0.94)
plain- Asserted: passes — The authors put it forward as true.
- Checkable: passes — It can be checked against evidence.
- Load-bearing: passes — The paper’s conclusions depend on it.
- Based: passes — The paper gives a reason why it holds.
It may state two separate claims as one.
- Supported
The sources with a verdict support this claim; the rest weren’t checked yet, have no full text we could read, or their verdicts aren’t rated yet.
In the paper
“CaMKII phosphorylates SynGAP and decreases its binding to PSD-95 (302, 304).”
§ Synaptic memory and CaMKII > 7. CaMKII AND THE EXPRESSION OF LTP (CaMKII TARGETS) > 7.4. PSD-centric Model
What the sources say
- Not checked — no full text of the sourcecites [302] source
- Supportedcites [304] source
In the Results section on phosphorylation at Ser1108 and Ser1138, active CaMKII disrupted the SynGAP–PSD-95 interaction, whereas it did not disrupt binding by the phospho-deficient SynGAP mutant. The authors conclude that CaMKII phosphorylation at those sites triggers SynGAP dissociation from PSD-95. (LLM, conf=0.95)
plaindirect- Asserted: passes — The authors put it forward as true.
- Checkable: passes — It can be checked against evidence.
- Load-bearing: passes — The paper’s conclusions depend on it.
- Based: passes — The paper gives a reason why it holds.
It may state two separate claims as one.
The cited sources support only part of this claim — read each source’s verdict below.
In the paper
“Phosphomimic mutations greatly diminished both the binding of the TARP CTD to PSD-95 and the rescue of AMPAR transmission in AMPAR-deleted cells.”
§ Synaptic memory and CaMKII > 7. CaMKII AND THE EXPRESSION OF LTP (CaMKII TARGETS) > 7.3. Receptor-centric Model
What the sources say
- Partly supportedcites [288] sourceExperimental — accuracy not yet measured
The Results and Significance passages report that deleting TARP γ-8’s PDZ-binding motif prevented rescue of synaptic currents in AMPAR-deleted cells; a separate passage says phosphor-null mutations did not fully rescue basal transmission. Neither passage reports the claimed effect of phosphomimic serine mutations, and the PSD-95 binding experiment described in our copy concerns GluK1/Neto1 rather than the TARP CTD. No page numbers are provided in our copy. (LLM, conf=0.82)
- Supportedcites [289] source
The Discussion (page unavailable) states that the phosphomimetic γ−8 S10D mutant has diminished PSD-95 binding and impaired capacity to support AMPAR synaptic transmission. The Results (page unavailable) report significantly reduced AMPAR currents with S10D in cells where endogenous AMPARs had been removed. The paper also notes that a different, two-serine phosphomimetic mutant did not have these effects, so the finding does not apply to every such mutation. (LLM, conf=0.92)
plaindirect- Asserted: passes — The authors put it forward as true.
- Checkable: passes — It can be checked against evidence.
- Load-bearing: passes — The paper’s conclusions depend on it.
- Based: passes — The paper gives a reason why it holds.
It may state two separate claims as one.
- Partly supported
The cited sources support only part of this claim — read each source’s verdict below.
In the paper
“CaMKII phosphorylation of the serines neutralizes the charge, releasing the CTD and providing access to the PDZ domains of PSD-95 (284, 285, 287).”
§ Synaptic memory and CaMKII > 7. CaMKII AND THE EXPRESSION OF LTP (CaMKII TARGETS) > 7.3. Receptor-centric Model
What the sources say
- Partly supportedcites [284] sourceExperimental — accuracy not yet measured
The Results section identifies TARPγ-8 serines phosphorylated by CaMKIIα. The Discussion describes phosphorylation-related electrostatic changes releasing the cytoplasmic domain from membrane lipids and enabling PSD-95 interaction, but specifically for TARPγ-2. It does not establish that CaMKII phosphorylation of TARPγ-8 neutralizes charge and exposes its PSD-95-binding site. (LLM, conf=0.86)
- Partly supportedcites [285] sourceExperimental — accuracy not yet measured
The Discussion (‘Roles of multiple phosphorylation sites in TARPs’; page unavailable) says acidic phosphorylated serines inhibit the electrostatic interaction of stargazin’s basic residues with negatively charged lipid bilayers. The Results (‘Lipid bilayers inhibit binding of stargazin to PSD-95’; page unavailable) say phosphorylation permits dissociation from lipids and binding to PSD-95. Our copy does not identify CaMKII as the kinase responsible for this mechanism, so that attribution is unsupported. (LLM, conf=0.86)
- Not checked — no full text of the sourcecites [287] source
plaindirect- Asserted: passes — The authors put it forward as true.
- Checkable: passes — It can be checked against evidence.
- Load-bearing: passes — The paper’s conclusions depend on it.
- Based: passes — The paper gives a reason why it holds.
It may state two separate claims as one.
- Partly supported
The cited sources support only part of this claim — read each source’s verdict below.
In the paper
“Since the binding of AMPAR/TARPs to the PSD protein PSD-95 is known to be important for synaptic targeting and LTP (278, 279)”
§ Synaptic memory and CaMKII > 7. CaMKII AND THE EXPRESSION OF LTP (CaMKII TARGETS) > 7.4. PSD-centric Model
What the sources say
- Not checked — no full text of the sourcecites [278] source
- Partly supportedcites [279] sourceExperimental — accuracy not yet measured
In “The role of TARPs in AMPAR surface trafficking and synaptic targeting” (page not provided), the review says stargazin binds PSD-95 and that this interaction is important for AMPAR synaptic targeting. The same section reports that a phospho-null stargazin construct prevents LTP, but it does not establish that binding to PSD-95 itself is important for LTP. (LLM, conf=0.84)
boosteddirect- Asserted: passes — The authors put it forward as true.
- Checkable: passes — It can be checked against evidence.
- Load-bearing: passes — The paper’s conclusions depend on it.
- Based: passes — The paper gives a reason why it holds.
It may state two separate claims as one.
The cited sources support only part of this claim — read each source’s verdict below.
In the paper
“since overexpression of PSD-95 on its own potentiates AMPAR EPSCs and occludes LTP (131, 297, 298) and the S73D mutant causes a similar potentiation.”
§ Synaptic memory and CaMKII > 7. CaMKII AND THE EXPRESSION OF LTP (CaMKII TARGETS) > 7.4. PSD-centric Model
What the sources say
- Could not verifycites [131] sourceExperimental — accuracy not yet measured
The Results (Figure 2) attribute increased AMPAR EPSCs to expression of activated αCaMKII, not PSD-95. Searches for PSD-95 overexpression, LTP occlusion, and the S73D mutant found no passage addressing those claims in our copy. (LLM, conf=0.76)
- Supportedcites [297] source
The citation is attached to the claim about PSD-95 overexpression, not the subsequent S73D clause. The Results report larger AMPA EPSCs in PSD-95-expressing hippocampal cells, and the Discussion states that PSD-95 expression occluded LTP. No page numbers are available in our copy. (LLM, conf=0.93)
- Partly supportedcites [298] sourceExperimental — accuracy not yet measured
The section on PSD-95-induced synaptic potentiation reports that PSD-95 expression potentiates AMPAR responses and prevents further LTP; the Discussion describes this as occlusion. The mutant-results section discusses C3,5S, AAAA, Double, and PDZ1-2 constructs, but the passages returned for searches on S73D and Ser73 do not support the claim that S73D causes similar potentiation. Page numbers were not available in our copy. (LLM, conf=0.89)
plaindirect- Asserted: passes — The authors put it forward as true.
- Checkable: passes — It can be checked against evidence.
- Load-bearing: passes — The paper’s conclusions depend on it.
- Based: passes — The paper gives a reason why it holds.
It may state two separate claims as one.
- Could not verify
The cited sources support only part of this claim — read each source’s verdict below.
In the paper
“Interfering with actin polymerization blocks both sLTP (247) as well as LTP (310).”
§ Synaptic memory and CaMKII > 7. CaMKII AND THE EXPRESSION OF LTP (CaMKII TARGETS) > 7.4. PSD-centric Model
What the sources say
- Not checked yetcites [247] source
Checked before — its earlier verdict is held back until a new check runs.
- Partly supportedcites [310] sourceExperimental — accuracy not yet measured
Citation 310 supports the LTP portion of the sentence, not the separately cited sLTP portion. In “LTP induction is inhibited by actin polymerization inhibitors” (page unavailable), the paper reports that latrunculin B reduced potentiation rather than completely blocking LTP, so “blocks” overstates its finding. (LLM, conf=0.88)
plaindirect- Asserted: passes — The authors put it forward as true.
- Checkable: passes — It can be checked against evidence.
- Load-bearing: unclear — It is unclear whether the paper’s conclusions depend on it.
- Based: passes — The paper gives a reason why it holds.
It may state two separate claims as one.
- Not checked yet
Every source the paper cites for this claim was checked and supports it.
In the paper
“Furthermore, knockdown of SynGAP results in the accumulation of synaptic AMPARs, which occludes chemLTP (304).”
§ Synaptic memory and CaMKII > 7. CaMKII AND THE EXPRESSION OF LTP (CaMKII TARGETS) > 7.4. PSD-centric Model
What the sources say
- Supportedcites [304] source
In the Results section on AMPAR trafficking and spine enlargement (Figure 6), SynGAP knockdown produced elevated basal AMPAR levels in spines and prevented further receptor increases after LTP induction. The passage describes this as occlusion, matching the claim about chemLTP. (LLM, conf=0.94)
plaindirect- Asserted: passes — The authors put it forward as true.
- Checkable: passes — It can be checked against evidence.
- Load-bearing: passes — The paper’s conclusions depend on it.
- Based: passes — The paper gives a reason why it holds.
It may state two separate claims as one.
- Supported
The cited sources support only part of this claim — read each source’s verdict below.
In the paper
“On average there are ∼250 PSD-95 molecules in the PSD (65) and, on average, ∼50 AMPARs, although this number is highly variable (143, 290, 291).”
§ Synaptic memory and CaMKII > 7. CaMKII AND THE EXPRESSION OF LTP (CaMKII TARGETS) > 7.4. PSD-centric Model
What the sources say
- Not checked — no full text of the sourcecites [65] source
- Partly supportedcites [143] sourceExperimental — accuracy not yet measured
The Analysis of AMPAR- and NMDAR-Type Structures by EM Tomography section reports variability in AMPAR counts, including a relationship with PSD size, but estimates 105 ± 52 AMPARs in an average-sized PSD—not approximately 50. The ∼250 PSD-95 figure has a separate citation in the citing sentence and is not attributed to this paper. (LLM, conf=0.86)
- Partly supportedcites [290] sourceExperimental — accuracy not yet measured
The paper reports substantial variability in AMPA-receptor content across rat hippocampal synapses (Figure 8), supporting the variability qualifier. It does not establish approximately 50 AMPARs as an overall average: its estimates differ by synapse type, and it calculates an average of 81 functional receptors for juvenile mossy-fiber synapses. The PSD-95 figure is attached to a different citation and is not assessed here. (LLM, conf=0.85)
- Not checked — no full text of the sourcecites [291] source
plain- Asserted: passes — The authors put it forward as true.
- Checkable: passes — It can be checked against evidence.
- Load-bearing: unclear — It is unclear whether the paper’s conclusions depend on it.
- Based: passes — The paper gives a reason why it holds.
It may state two separate claims as one.
The cited sources support only part of this claim — read each source’s verdict below.
In the paper
“Furthermore, alanine substitutions of the critical serines in the TARP CTD, although reducing AMPAR EPSCs, do not affect the magnitude of LTP (288).”
§ Synaptic memory and CaMKII > 7. CaMKII AND THE EXPRESSION OF LTP (CaMKII TARGETS) > 7.3. Receptor-centric Model
What the sources say
- Partly supportedcites [288] sourceExperimental — accuracy not yet measured
The passage supplied under Significance (page not given) reports that phosphor-null mutations in tethered TARP γ-8 did not fully rescue basal synaptic transmission, while LTP was normal. This supports the direction of both effects, but the paper's finding is limited to tethered γ-8 with homomeric GluA1 receptors; the passage does not identify the substitutions as alanine, and it cautions that phosphorylation might matter for heteromeric AMPARs. (LLM, conf=0.82)
plaindirect- Asserted: passes — The authors put it forward as true.
- Checkable: passes — It can be checked against evidence.
- Load-bearing: passes — The paper’s conclusions depend on it.
- Based: passes — The paper gives a reason why it holds.
It may state two separate claims as one.
- Partly supported
The cited sources support only part of this claim — read each source’s verdict below.
In the paper
“The authors find that Tiam1 has a CaMKII binding domain. This domain is homologous to the GluN2B CTD, and thus the Tiam1-CaMKII complex formation results in constitutive CaMKII activity.”
§ Synaptic memory and CaMKII > 7. CaMKII AND THE EXPRESSION OF LTP (CaMKII TARGETS) > 7.4. PSD-centric Model
What the sources say
- Partly supportedcites [314] sourceExperimental — accuracy not yet measured
The Results sections on Tiam1 binding and reciprocal activation (page unavailable) identify a CaMKII-binding region in Tiam1 and report that the formed complex maintains CaMKII activity without Ca2+/calmodulin. They describe that region as homologous to CaMKII’s autoinhibitory domain, not to the GluN2B C-terminal domain. The claimed GluN2B homology is therefore unsupported by our copy. (LLM, conf=0.88)
plaindirect- Asserted: passes — The authors put it forward as true.
- Checkable: passes — It can be checked against evidence.
- Load-bearing: passes — The paper’s conclusions depend on it.
- Based: passes — The paper gives a reason why it holds.
It may state two separate claims as one.
- Partly supported
The cited sources support only part of this claim — read each source’s verdict below.
In the paper
“A caveat to this proposal is that the expression levels of Tiam1 in the CA1 region of the hippocampus are very low and deleting Tiam1 has no effect on synaptic transmission (320).”
§ Synaptic memory and CaMKII > 7. CaMKII AND THE EXPRESSION OF LTP (CaMKII TARGETS) > 7.4. PSD-centric Model
What the sources say
- Partly supportedcites [320] sourceExperimental — accuracy not yet measured
The CA1 neurotransmission section reports low Tiam1 expression and no detectable change in AMPAR- or NMDAR-mediated currents after Tiam1 shRNA knockdown. The Discussion likewise limits the finding to baseline glutamatergic transmission at Schaffer collateral–CA1 synapses. The claim says Tiam1 was deleted and extends the result to synaptic transmission generally; the cited experiment tested knockdown, not deletion. (LLM, conf=0.88)
plain- Asserted: passes — The authors put it forward as true.
- Checkable: passes — It can be checked against evidence.
- Load-bearing: unclear — It is unclear whether the paper’s conclusions depend on it.
- Based: passes — The paper gives a reason why it holds.
It may state two separate claims as one.
- Partly supported
The cited sources support only part of this claim — read each source’s verdict below.
In the paper
“The RhoGEFs that have received the most attention are kalirin-7, Trio, and Tiam, which are all expressed in spines and phosphorylated by CaMKII (314–317).”
§ Synaptic memory and CaMKII > 7. CaMKII AND THE EXPRESSION OF LTP (CaMKII TARGETS) > 7.4. PSD-centric Model
What the sources say
- Partly supportedcites [314] sourceExperimental — accuracy not yet measured
The Introduction describes Tiam1 and Kalirin-7/Trio as CaMKII substrates involved in spine formation and development. The Results place Tiam1 in a stimulated spine, but the cited passages do not establish that all three are expressed in spines; the paper also does not say they have received the most attention. (LLM, conf=0.78)
- Partly supportedcites [315] sourceExperimental — accuracy not yet measured
The Results and Discussion establish that kalirin-7 is present in dendritic spines and phosphorylated by CaMKII at T95. The cited passages do not establish that Trio or Tiam are phosphorylated by CaMKII or that Trio is expressed in spines, so this paper supports only the kalirin-7 portion of the sentence. (LLM, conf=0.87)
- Partly supportedcites [316] sourceExperimental — accuracy not yet measured
In “Discovery and expression” (page unavailable), the review places Kal7 in dendritic spines; “Protein structure and signaling” says CaMKII is among the kinases that target Kalirin. The Tiam1 “Electrophysiology and synaptic function” section places Tiam1 in spines and reports calcium-dependent phosphorylation, but does not identify CaMKII as the kinase. The cited passages do not establish that Trio is expressed in spines or phosphorylated by CaMKII, so the claim that all three share both properties is not supported. (LLM, conf=0.87)
- Partly supportedcites [317] sourceExperimental — accuracy not yet measured
The Results and Discussion section (page unavailable) states that Kal7 is concentrated at the postsynaptic density and that in vitro studies show CaMKII phosphorylates Kal7 at T79. The paper does not establish that Trio or Tiam are expressed in spines or phosphorylated by CaMKII, so it supports the claim only for kalirin-7. (LLM, conf=0.90)
plaindirect- Asserted: passes — The authors put it forward as true.
- Checkable: passes — It can be checked against evidence.
- Load-bearing: passes — The paper’s conclusions depend on it.
- Based: passes — The paper gives a reason why it holds.
It may state two separate claims as one.
- Partly supported
Every source the paper cites for this claim was checked and supports it.
In the paper
“However, such a mechanism may well be involved in the dentate gyrus, where Tiam1 expression is high and does contribute to synaptic transmission (320).”
§ Synaptic memory and CaMKII > 7. CaMKII AND THE EXPRESSION OF LTP (CaMKII TARGETS) > 7.4. PSD-centric Model
What the sources say
- Supportedcites [320] source
The Significance Statement says Tiam1 expression is enriched in dentate gyrus granule neurons. The Discussion reports that inhibiting Tiam1 in those neurons significantly reduces glutamatergic synapse function, supporting the claim that Tiam1 contributes to synaptic transmission there. Page numbers are not provided in our copy. (LLM, conf=0.90)
hedgedconditional- Asserted: passes — The authors put it forward as true.
- Checkable: passes — It can be checked against evidence.
- Load-bearing: unclear — It is unclear whether the paper’s conclusions depend on it.
- Based: passes — The paper gives a reason why it holds.
It may state two separate claims as one.
- Supported
Every source the paper cites for this claim was checked and supports it.
In the paper
“Importantly, although the maintenance of this segregation in the LLPS study required T286 autophosphorylation, it did not require the phosphorylation of any other component of the reconstituted system.”
§ Synaptic memory and CaMKII > 7. CaMKII AND THE EXPRESSION OF LTP (CaMKII TARGETS) > 7.4. PSD-centric Model
What the sources say
- Supportedcites [323] source
The section “Segregation of AMPAR and NMDAR by LLPS-mediated mechanism of CaMKII” states that segregation does not require phosphorylation of the reconstituted components, while persistent segregation after calcium recedes requires CaMKII T286 phosphorylation. This supports the claim's distinction between T286 autophosphorylation and phosphorylation of other components. No page number is provided in our copy. (LLM, conf=0.93)
plaindirect- Asserted: passes — The authors put it forward as true.
- Checkable: passes — It can be checked against evidence.
- Load-bearing: passes — The paper’s conclusions depend on it.
- Based: passes — The paper gives a reason why it holds.
It may state two separate claims as one.
- Supported
The cited sources support only part of this claim — read each source’s verdict below.
In the paper
“Remarkably, when the CTD of neuroligin 1 is included, it partitions with the AMPAR/TARPs but not with the NMDARs, reminiscent of nanocolumns in the PSD (251–253)”
§ Synaptic memory and CaMKII > 7. CaMKII AND THE EXPRESSION OF LTP (CaMKII TARGETS) > 7.4. PSD-centric Model
What the sources say
- Supportedcites [323] source
In the “NLGN co-segregates together with AMPAR” section (Fig. 5B–C), the neuroligin-1 carboxyl tail moves into the STGc/PSD-95 phase while the NMDAR component GluN2Bc segregates into a distinct phase. The same section connects this arrangement to positioning AMPAR beneath the presynaptic active zone, supporting the nanocolumn comparison. (LLM, conf=0.94)
- Supportedcites [251] source
The citation supports the sentence’s comparison to nanocolumns in the postsynaptic density. The paper describes postsynaptic receptor and scaffold concentrations aligned with presynaptic nanoclusters, forming a transsynaptic nanocolumn (Abstract; page unavailable). (LLM, conf=0.88)
- Partly supportedcites [252] sourceExperimental — accuracy not yet measured
In “Lateral patterning of cytosolic PSD components” (page unavailable), the paper reports that AMPARs and NMDARs occupy separate synaptic zones in EM tomography and that TARPs associate with AMPAR scaffolds. But it does not report that the CTD of neuroligin-1 partitions with AMPAR/TARPs rather than NMDARs; its “Candidate mechanisms of trans-synaptic alignment” section instead describes neuroligin-1 as broadly distributed over the PSD. (LLM, conf=0.82)
- Partly supportedcites [253] sourceExperimental — accuracy not yet measured
The Discussion (page not specified) reports that AMPAR and NMDAR clusters barely colocalize at the nanoscale, supporting the comparison to distinct PSD domains. It does not report that the CTD of neuroligin 1 partitions with AMPAR/TARPs rather than NMDARs. (LLM, conf=0.83)
plaincorrelational- Asserted: passes — The authors put it forward as true.
- Checkable: passes — It can be checked against evidence.
- Load-bearing: passes — The paper’s conclusions depend on it.
- Based: passes — The paper gives a reason why it holds.
It may state two separate claims as one.
- Supported
Every source the paper cites for this claim was checked and supports it.
In the paper
“Sixth, whereas the recovery from bleaching spine SEP-GluA1 following glutamate uncaging shows a modest dependence on CaMKII, single SEP-GluA1 exocytotic events during glutamate uncaging appear to be independent of CaMKII (250).”
§ Synaptic memory and CaMKII > 7. CaMKII AND THE EXPRESSION OF LTP (CaMKII TARGETS) > 7.5. Vesicle-centric Model
What the sources say
- Supportedcites [250] source
In the Results (Fig. 2D; page not provided), the CaMKII inhibitor KN62 partially blocked SEP-GluA1 fluorescence recovery after bleaching and stimulation. The Results also report that KN62 did not alter the stimulation-induced increase in individual exocytosis events in spines or dendrites (Fig. 4A–B). (LLM, conf=0.94)
hedgedconditional- Asserted: passes — The authors put it forward as true.
- Checkable: passes — It can be checked against evidence.
- Load-bearing: unclear — It is unclear whether the paper’s conclusions depend on it.
- Based: passes — The paper gives a reason why it holds.
It may state two separate claims as one.
- Supported
Every source the paper cites for this claim was checked and supports it.
In the paper
“Additional support for the vesicle-centric model is the finding that AMPAR-containing vesicles (obtained by immunoisolation) are associated with such proteins as synaptotagmin-1 (341), which is involved in LTP (195).”
§ Synaptic memory and CaMKII > 7. CaMKII AND THE EXPRESSION OF LTP (CaMKII TARGETS) > 7.5. Vesicle-centric Model
What the sources say
- Supportedcites [341] source
The Abstract states that the authors immunoisolated AMPAR-containing vesicles and identified synaptotagmin-1 on them. This supports the association attributed to this paper; the citing sentence assigns synaptotagmin-1’s involvement in LTP to a separate citation. (LLM, conf=0.94)
- Supportedcites [195] source
Citation 195 is attached to the statement that synaptotagmin-1 is involved in LTP, not to the immunoisolation finding cited to 341. The Abstract reports that blocking postsynaptic synaptotagmin-1 together with synaptotagmin-7 abolished LTP and describes them as redundant sensors for AMPA-receptor exocytosis during LTP. (LLM, conf=0.94)
plaincorrelational- Asserted: passes — The authors put it forward as true.
- Checkable: passes — It can be checked against evidence.
- Load-bearing: passes — The paper’s conclusions depend on it.
- Based: passes — The paper gives a reason why it holds.
It may state two separate claims as one.
- Supported
The sources with a verdict support this claim; the rest weren’t checked yet, have no full text we could read, or their verdicts aren’t rated yet.
In the paper
“while on the other hand Stx-4 is reported to be required for LTP (336, 338).”
§ Synaptic memory and CaMKII > 7. CaMKII AND THE EXPRESSION OF LTP (CaMKII TARGETS) > 7.5. Vesicle-centric Model
What the sources say
- Not checked — no full text of the sourcecites [336] source
- Supportedcites [338] source
The Results section, “Stx4 is Required for Long-Term Potentiation in CA1 Hippocampus,” reports that blocking postsynaptic Stx4 function almost completely abolished LTP in CA1 pyramidal neurons. The paper explicitly concludes that acute postsynaptic block of Stx4 function is sufficient to prevent LTP. (LLM, conf=0.94)
hedgeddirect- Asserted: passes — The authors put it forward as true.
- Checkable: passes — It can be checked against evidence.
- Load-bearing: fails — The paper’s conclusions may not depend on it.
- Based: passes — The paper gives a reason why it holds.
Probably not a substantial claim. The paper’s conclusions may not depend on it.
Every source the paper cites for this claim was checked and supports it.
In the paper
“On the one hand Stx-3 is reported to be required for LTP (Ref. 334, but see Ref. 339)”
§ Synaptic memory and CaMKII > 7. CaMKII AND THE EXPRESSION OF LTP (CaMKII TARGETS) > 7.5. Vesicle-centric Model
What the sources say
- Supportedcites [334] source
The Results section, “Postsynaptic Syntaxin-3 is Required for AMPAR Delivery During LTP,” concludes that Stx-3 is critical for AMPAR delivery during LTP. The Discussion also reports that Stx-3 knockdown impaired LTP and that wild-type Stx-3 rescued the effect. (LLM, conf=0.94)
- Supportedcites [339] source
This paper is cited in the “but see” qualification, not as the report that Stx-3 is required for LTP. Its Results section (“CA1 long-term potentiation is preserved in syntaxin-3 cKO mice”) reports normal theta-burst-induced LTP after syntaxin-3 deletion, while its Discussion acknowledges a previous knockdown study that found impaired LTP using a different induction protocol. (LLM, conf=0.91)
hedgeddirect- Asserted: passes — The authors put it forward as true.
- Checkable: passes — It can be checked against evidence.
- Load-bearing: fails — The paper’s conclusions may not depend on it.
- Based: passes — The paper gives a reason why it holds.
Probably not a substantial claim. The paper’s conclusions may not depend on it.
- Supported
The cited sources support only part of this claim — read each source’s verdict below.
In the paper
“If this were the case, it has been argued that the system would be unstable and quickly saturate (366–371).”
§ Synaptic memory and CaMKII > 8. SYNAPTIC TRANSMISSION IS MAINTAINED BY THE CONSTITUTIVE ACTION OF CaMKII > 8.3. Experimental Manipulations of Constitutive CaMKII and LTP Mirror One Another
What the sources say
- Not checked — no full text of the sourcecites [366] source
- Partly supportedcites [367] sourceExperimental — accuracy not yet measured
In §II, the paper says that if synapses are allowed only to increase, all will eventually saturate. It also says that its activity-dependent modification threshold is necessary for a bounded state. This supports the general concern about unchecked synaptic gain, but the paper does not address CaMKII or establish that saturation would occur quickly. (LLM, conf=0.84)
- Partly supportedcites [368] sourceExperimental — accuracy not yet measured
In “The Stability Problem” (page not provided), the paper argues that unconstrained strengthening of excitatory synapses creates positive feedback that can drive neuronal activity to saturation. It does not make that argument specifically about a net additive contribution from CaMKII; its discussion of CaMKII in “Signaling Pathways Underlying Synaptic Scaling” concerns different homeostatic effects. (LLM, conf=0.84)
- Partly supportedcites [369] sourceExperimental — accuracy not yet measured
In the section on power-law forgetting (page unavailable), the paper says that imbalances between synaptic strengthening and weakening spoil its memory-performance result, and that a repeatedly potentiated synapse can reach a point where it becomes no stronger. It does not connect this to CaMKII adding to a cell’s preexisting excitatory drive, or say that such a gain would make the system unstable and quickly saturate. (LLM, conf=0.76)
- Partly supportedcites [370] sourceExperimental — accuracy not yet measured
The Introduction says that Hebbian plasticity is a positive-feedback process whose synaptic weights are typically unstable until they reach saturation. The Results discuss CaMKII as a possible mechanism of Hebbian LTP, but do not establish that CaMKII adds a net gain to preexisting excitatory drive or that this specific arrangement would quickly saturate. (LLM, conf=0.83)
- Partly supportedcites [371] sourceExperimental — accuracy not yet measured
Section 4.1, Pair-based STDP rules (page unavailable), says that an additive plasticity model has an unstable fixed point and that individual synaptic weights move to their upper or lower bounds. It does not make this argument about CaMKII or say saturation is quick. It also says the neuron's mean firing rate is stabilized, so instability of individual weights should not be described as instability of the whole system. (LLM, conf=0.85)
hedgedconditional- Asserted: fails — The authors may not put it forward as true.
- Checkable: passes — It can be checked against evidence.
- Load-bearing: passes — The paper’s conclusions depend on it.
- Based: passes — The paper gives a reason why it holds.
Probably not a substantial claim. The authors may not put it forward as true.
Every source the paper cites for this claim was checked and supports it.
In the paper
“The third mechanism, homeostasis, occurs on a slower timescale of many hours or days (368). In this case the cell senses the excess level of activity and through a cellwide mechanism scales down all synapses in a multiplicative manner to restore excitatory drive to a set point.”
§ Synaptic memory and CaMKII > 8. SYNAPTIC TRANSMISSION IS MAINTAINED BY THE CONSTITUTIVE ACTION OF CaMKII > 8.3. Experimental Manipulations of Constitutive CaMKII and LTP Mirror One Another
What the sources say
- Supportedcites [368] source
The citation is attached to the timescale statement. In “Synaptic Scaling: the Phenomenon” (page unavailable), the paper says compensatory changes occur over many hours and firing rates return to control values over that period; “Signaling Pathways Underlying Synaptic Scaling” reports scaling after 4–24 hours of activity blockade, with effects continuing as deprivation is prolonged. (LLM, conf=0.91)
plaindirect- Asserted: passes — The authors put it forward as true.
- Checkable: passes — It can be checked against evidence.
- Load-bearing: unclear — It is unclear whether the paper’s conclusions depend on it.
- Based: passes — The paper gives a reason why it holds.
It may state two separate claims as one.
- Supported
The cited sources support only part of this claim — read each source’s verdict below.
In the paper
“The first step involves Ca2+/CaM peeling away the autoinhibitory segment from the kinase domain. This results in the phosphorylation of T286 and also the binding of CaMKII to GluN2B even without prior autophosphorylation, both of which maintain CaMKII in an active state (64, 78, 119–121, 221).”
§ Synaptic memory and CaMKII > 9. CaMKII AND THE MAINTENANCE OF LTP > 9.2. CaMKII Binding to GluN2B vs. T286 Phosphorylation
What the sources say
- Not checked — no full text of the sourcecites [64] source
- Not checked — no full text of the sourcecites [78] source
- Partly supportedcites [119] sourceExperimental — accuracy not yet measured
The Introduction (page not provided) says Ca2+/CaM exposes CaMKII’s catalytic site and that binding to NR2B then keeps CaMKII active independently of its phosphorylation state. It mentions Thr286 autophosphorylation as a requirement for a proposed second NR2B binding site, but does not say that Ca2+/CaM exposure results in Thr286 phosphorylation or that this phosphorylation maintains activity. (LLM, conf=0.83)
- Supportedcites [120] source
The Discussion section on postsynaptic CaMKII targeting describes Ca2+/calmodulin binding, T286 phosphorylation, and GluN2B binding as ways to remove the inhibitory pseudosubstrate from CaMKII’s catalytic site. It also explains that GluN2B binding keeps CaMKII subunits active and can sustain autophosphorylation, including when T286 was previously unphosphorylated. Page numbers are not available in our copy. (LLM, conf=0.87)
- Partly supportedcites [121] sourceExperimental — accuracy not yet measured
The Introduction (page not available) says Ca2+/CaM relieves CaMKII autoinhibition and that T286 autophosphorylation produces kinase activity that persists after Ca2+/CaM is removed. The Discussion identifies GluN2B as a CaMKII binding partner, but the paper does not establish that binding occurs without prior autophosphorylation or that the binding itself maintains CaMKII in an active state. (LLM, conf=0.86)
plaindirect- Asserted: passes — The authors put it forward as true.
- Checkable: passes — It can be checked against evidence.
- Load-bearing: passes — The paper’s conclusions depend on it.
- Based: passes — The paper gives a reason why it holds.
It may state two separate claims as one.
The cited sources support only part of this claim — read each source’s verdict below.
In the paper
“Second, NMDAR-dependent long-term depression (LTD) depresses synaptic transmission and can reverse established LTP (374, 375) (see sect. 9.2.3).”
§ Synaptic memory and CaMKII > 8. SYNAPTIC TRANSMISSION IS MAINTAINED BY THE CONSTITUTIVE ACTION OF CaMKII > 8.3. Experimental Manipulations of Constitutive CaMKII and LTP Mirror One Another
What the sources say
- Not checked — no full text of the sourcecites [374] source
- Partly supportedcites [375] sourceExperimental — accuracy not yet measured
In the section headed “NMDA Receptor-Dependent LTD” (page unavailable), the review describes LTD of basal synaptic responses and says that blocking NMDARs blocks LTD. It also says synaptic activity can reverse LTP, but calls that phenomenon “depotentiation”; it does not establish that NMDAR-dependent LTD is what reverses established LTP. (LLM, conf=0.86)
plaindirect- Asserted: passes — The authors put it forward as true.
- Checkable: passes — It can be checked against evidence.
- Load-bearing: passes — The paper’s conclusions depend on it.
- Based: passes — The paper gives a reason why it holds.
It may state two separate claims as one.
The cited sources support only part of this claim — read each source’s verdict below.
In the paper
“As long as Ca2+/CaM is present, binding and phase separation are maintained even with a phosphonull mutant of T286 (T286A) (78, 169, 323, 377) or with a kinase-dead mutant of CaMKII (169, 323, 378, 379), although the binding of CaMKII to GluN2B is modestly enhanced by T286 phosphorylation (378).”
§ Synaptic memory and CaMKII > 9. CaMKII AND THE MAINTENANCE OF LTP > 9.2. CaMKII Binding to GluN2B vs. T286 Phosphorylation
What the sources say
- Not checked — no full text of the sourcecites [78] source
- Not checked — no full text of the sourcecites [169] source
- Partly supportedcites [323] sourceExperimental — accuracy not yet measured
Split into 2 atoms — 1 confirmed, 1 partially supported, 0 disputed, 0 misattributed, 0 unverifiable. Expand the claim to see per-atom verdicts.
plaindirect- Asserted: passes — The authors put it forward as true.
- Checkable: passes — It can be checked against evidence.
- Load-bearing: passes — The paper’s conclusions depend on it.
- Based: passes — The paper gives a reason why it holds.
It may state two separate claims as one.
The cited sources support only part of this claim — read each source’s verdict below.
In the paper
“Second, spine CaMKII activity as monitored with fluorescence resonance energy transfer (FRET) imaging (188) during LTP only remained elevated for ∼1 min after the induction of LTP, suggesting that conformational changes associated with CaMKII activation due to either Ca2+/CaM or autophosphorylation are transient.”
§ Synaptic memory and CaMKII > 9. CaMKII AND THE MAINTENANCE OF LTP > 9.2. CaMKII Binding to GluN2B vs. T286 Phosphorylation
What the sources say
- Partly supportedcites [188] sourceExperimental — accuracy not yet measured
Split into 2 atoms — 1 confirmed, 0 partially supported, 0 disputed, 0 misattributed, 0 unverifiable, 1 not checked. Expand the claim to see per-atom verdicts.
hedgedcorrelational- Asserted: passes — The authors put it forward as true.
- Checkable: passes — It can be checked against evidence.
- Load-bearing: passes — The paper’s conclusions depend on it.
- Based: passes — The paper gives a reason why it holds.
It may state two separate claims as one.
- Partly supported
Every source the paper cites for this claim was checked and supports it.
In the paper
“Further support for the role of T286 phosphorylation in maintaining the condensates and the binding of CaMKII to GluN2B in the absence of Ca2+/CaM is the finding that phosphatase PP2A rapidly dephosphorylates CaMKII, which results in the dissolution of the CaMKII-GluN2B complex (161).”
§ Synaptic memory and CaMKII > 9. CaMKII AND THE MAINTENANCE OF LTP > 9.2. CaMKII Binding to GluN2B vs. T286 Phosphorylation
What the sources say
- Supportedcites [161] source
The Results section says PP2A rapidly dephosphorylates CaMKIIα when Ca²⁺ becomes low and that purified PP2A blocks its interaction with GluN2B. The Ca²⁺ oscillation section reports that this binding is quickly reversed by PP2A when Ca²⁺ is removed, supporting the described dissolution of the complex. Page numbers are not available in the supplied copy. (LLM, conf=0.92)
plaindirect- Asserted: passes — The authors put it forward as true.
- Checkable: passes — It can be checked against evidence.
- Load-bearing: passes — The paper’s conclusions depend on it.
- Based: passes — The paper gives a reason why it holds.
It may state two separate claims as one.
- Supported
Every source the paper cites for this claim was checked and supports it.
In the paper
“The higher concentrations of inhibitor that do reverse LTP (154, 361) could result from the displacement of GluN2B bound to CaMKII.”
§ Synaptic memory and CaMKII > 9. CaMKII AND THE MAINTENANCE OF LTP > 9.2. CaMKII Binding to GluN2B vs. T286 Phosphorylation
What the sources say
- Supportedcites [154] source
The Discussion reports that 20 µM tatCN21 disrupts the CaMKII/NMDAR complex and reverses saturated LTP, whereas 5 µM inhibits CaMKII activity without reducing the complex or synaptic strength. The Results further report reduced binding involving the receptor’s NR2B (GluN2B) subunit at 20 µM. This supports the proposed explanation, though the paper does not establish displacement as the sole mechanism. (LLM, conf=0.91)
- Supportedcites [361] source
The Discussion (page unavailable) says the inhibitors interfere with CaMKII binding to GluN2B and that the study cannot distinguish disruption of that binding from blockade of kinase activity. It also identifies concentration and time as factors in reversing LTP. Together, these passages support displacement as a possible explanation, though the paper does not establish it as the mechanism. (LLM, conf=0.84)
hedgedconditional- Asserted: passes — The authors put it forward as true.
- Checkable: passes — It can be checked against evidence.
- Load-bearing: fails — The paper’s conclusions may not depend on it.
- Based: passes — The paper gives a reason why it holds.
Probably not a substantial claim. The paper’s conclusions may not depend on it.
- Supported
Every source the paper cites for this claim was checked and supports it.
In the paper
“Finally, another proposal also focuses on CaMKII and the phosphorylation of T305/T306, which selectively promotes LTD (402).”
§ Synaptic memory and CaMKII > 9. CaMKII AND THE MAINTENANCE OF LTP > 9.2. CaMKII Binding to GluN2B vs. T286 Phosphorylation
What the sources say
- Supportedcites [402] source
The Results section ('CaMKII T305/306AV mutation impairs LFS-induced LTD but not HFS-induced LTP'; page not provided) reports that preventing T305/306 phosphorylation significantly impaired LTD while leaving LTP normal. It concludes that pT305/306 is selectively required for normal LTD expression at the excitatory synapse tested. (LLM, conf=0.94)
plaindirect- Asserted: passes — The authors put it forward as true.
- Checkable: passes — It can be checked against evidence.
- Load-bearing: fails — The paper’s conclusions may not depend on it.
- Based: passes — The paper gives a reason why it holds.
Probably not a substantial claim. The paper’s conclusions may not depend on it.
- Supported
The cited sources support only part of this claim — read each source’s verdict below.
In the paper
“LTP is associated with a long-lasting increase in spine size (247, 248), including a late increase in the size of the PSD (56, 213, 414, 415) and additionally a slow increase in the size of the presynaptic bouton (213, 414).”
§ Synaptic memory and CaMKII > 10. CaMKII AND PROTEIN TURNOVER
What the sources say
- Supportedcites [247] source
The cited paper supports the long-lasting increase in spine size: its Abstract reports persistent enlargement of stimulated small spines, and the passage describing Figure 4 links long-lasting enlargement to LTP. In the citing sentence, separate citations attach to the PSD and presynaptic-bouton claims; those claims are not attributed to this source. (LLM, conf=0.92)
- Supportedcites [248] source
The citation is offered for the first clause, the long-lasting increase in spine size, rather than the separately cited PSD and presynaptic-bouton changes. In “LTP leads to plasticity in spine head and neck geometry” (p. 11), the paper reports that spine head volume increased after LTP induction and then reached a stable plateau above baseline. (LLM, conf=0.89)
- Partly supportedcites [56] sourceExperimental — accuracy not yet measured
The Results section reports delayed PSD enlargement after structural LTP, and the Discussion describes PSD remodeling beginning about 60 minutes after induction. Our copy also reports persistent spine enlargement, but the passages located for presynaptic bouton growth do not report a slow increase in bouton size. That part of the claim is unsupported by this source. (LLM, conf=0.87)
- Not checked — no full text of the sourcecites [213] source
- Partly supportedcites [414] sourceExperimental — accuracy not yet measured
The Introduction says spine enlargement after LTP can persist for hours to days, and the Results report PSD enlargement at 2 hours. The Results also show enlargement of presynaptic active zones, but do not establish a slow increase in the size of the presynaptic bouton itself. Page numbers are not available in our copy. (LLM, conf=0.87)
- Partly supportedcites [415] sourceExperimental — accuracy not yet measured
The Introduction and PSD-reorganization section describe spine enlargement after LTP and PSD growth that lags spine-volume growth by hours. The Discussion mentions presynaptic bouton volume change, but does not establish the claimed slow increase in bouton size. The paper also reports that late-phase spine volume was not significantly different from controls. (LLM, conf=0.86)
plaincorrelational- Asserted: passes — The authors put it forward as true.
- Checkable: passes — It can be checked against evidence.
- Load-bearing: passes — The paper’s conclusions depend on it.
- Based: passes — The paper gives a reason why it holds.
It may state two separate claims as one.
- Supported
Every source the paper cites for this claim was checked and supports it.
In the paper
“BTSP has been reproduced in slices (104) (FIGURE 12, A–C). In this case the plateau potential is induced by strong postsynaptic depolarization.”
§ Synaptic memory and CaMKII > 11. CaMKII AND HIPPOCAMPAL PLACE FIELDS
What the sources say
- Supportedcites [104] source
The passage describing hippocampal slice preparations from adult mice reports that the authors tested whether the plasticity could be reproduced there. It says the postsynaptic plateau potential was generated by somatic current injection alone (300 ms, 300–600 pA), supporting the description of strong postsynaptic depolarization. (LLM, conf=0.94)
plaindirect- Asserted: passes — The authors put it forward as true.
- Checkable: passes — It can be checked against evidence.
- Load-bearing: unclear — It is unclear whether the paper’s conclusions depend on it.
- Based: passes — The paper gives a reason why it holds.
It may state two separate claims as one.
- Supported
Every source the paper cites for this claim was checked and supports it.
In the paper
“However, more recent studies have found evidence that high kinase concentration enables subunit exchange and transphosphorylation between subunits within a holoenzyme can occur in the absence of Ca2+/CaM but on a much slower time course (406).”
§ Synaptic memory and CaMKII > 10. CaMKII AND PROTEIN TURNOVER
What the sources say
- Supportedcites [406] source
In Results and discussion (no page given), reducing CaMKII concentration from 8 to 1 µM reduced the rate of subunit exchange under activating conditions. The paper also reports that constitutively active CaMKII exchanged subunits without Ca2+/CaM and phosphorylated subunits in unactivated holoenzymes; its pThr286 signal rose much more slowly than the exchange signal. (LLM, conf=0.90)
plaindirect- Asserted: passes — The authors put it forward as true.
- Checkable: passes — It can be checked against evidence.
- Load-bearing: passes — The paper’s conclusions depend on it.
- Based: passes — The paper gives a reason why it holds.
It may state two separate claims as one.
- Supported
The cited sources support only part of this claim — read each source’s verdict below.
In the paper
“It is interesting to note that CaMKIIα, but not CaMKIIβ, can self-associate, at least at reduced pH or high concentration and this requires displacement of the autoinhibitory domain (133–135).”
§ Synaptic memory and CaMKII > 10. CaMKII AND PROTEIN TURNOVER
What the sources say
- Not checked — no full text of the sourcecites [133] source
- Partly supportedcites [134] sourceExperimental — accuracy not yet measured
The section on pH-dependent clustering reports that αCaMKII forms clusters at reduced pH in the presence of elevated Ca²⁺, and the Discussion proposes release of the autoregulatory domain as a step in self-association. Our copy does not establish that CaMKIIβ cannot self-associate or that high concentration alone permits CaMKIIα self-association; it presents the domain-displacement mechanism as a model rather than a demonstrated requirement. Page numbers are unavailable in our copy. (LLM, conf=0.85)
- Not checked — no full text of the sourcecites [135] source
hedgeddirect- Asserted: passes — The authors put it forward as true.
- Checkable: passes — It can be checked against evidence.
- Load-bearing: passes — The paper’s conclusions depend on it.
- Based: passes — The paper gives a reason why it holds.
It may state two separate claims as one.
The sources with a verdict support this claim; the rest weren’t checked yet, have no full text we could read, or their verdicts aren’t rated yet.
In the paper
“Although autophosphorylation does occur by transphosphorylation between subunits within a holoenzyme, the substrate subunit needs to be bound to Ca2+/CaM because that is what exposes T286 (82, 83), thus challenging the model of perpetuating CaMKII activity.”
§ Synaptic memory and CaMKII > 10. CaMKII AND PROTEIN TURNOVER
What the sources say
- Not checked — no full text of the sourcecites [82] source
- Supportedcites [83] source
The Discussion states that autophosphorylation occurs between subunits within a holoenzyme and that Thr 286 is not phosphorylated when the substrate subunit cannot bind calmodulin. The Results support the proposed explanation that Thr 286 is shielded without bound Ca2+/calmodulin; they also describe a C289P mutant that bypasses this normal requirement. (LLM, conf=0.93)
plaindirect- Asserted: passes — The authors put it forward as true.
- Checkable: passes — It can be checked against evidence.
- Load-bearing: passes — The paper’s conclusions depend on it.
- Based: passes — The paper gives a reason why it holds.
It may state two separate claims as one.
Every source the paper cites for this claim was checked and supports it.
In the paper
“Protein synthesis is also proposed to be required for “late” LTP (55–57) (see sect. 3.3).”
§ Synaptic memory and CaMKII > 10. CaMKII AND PROTEIN TURNOVER
What the sources say
- Supportedcites [55] source
The paper states that consolidation of LTP requires protein synthesis (Abstract; page unavailable). It also reports that protein-synthesis inhibitors abolished the gradual long-term phase of LTP-associated spine enlargement while largely sparing the immediate phase. This supports the citing sentence’s qualified proposal about late LTP. (LLM, conf=0.91)
- Supportedcites [56] source
The Introduction states that consolidating early LTP into late LTP requires the synthesis and transport of new proteins. The Results further report that protein-synthesis inhibitors reduced late-phase spine enlargement, consistent with the citing sentence. (LLM, conf=0.94)
- Supportedcites [57] source
The Introduction explicitly distinguishes longer-lasting, protein synthesis-dependent L-LTP from shorter-lasting, protein synthesis-independent E-LTP. The Results section further reports that protein-synthesis inhibitors abolished the response induced by the authors’ L-LTP protocol. (LLM, conf=0.94)
hedgedconditional- Asserted: passes — The authors put it forward as true.
- Checkable: passes — It can be checked against evidence.
- Load-bearing: fails — The paper’s conclusions may not depend on it.
- Based: passes — The paper gives a reason why it holds.
Probably not a substantial claim. The paper’s conclusions may not depend on it.
- Supported
Every source the paper cites for this claim was checked and supports it.
In the paper
“Although it can be argued as to whether this occurs through interholoenzyme phosphorylation or through subunit exchange, this finding shows that phosphorylation of inactive holoenzymes occurs (not bound Ca2+/CaM), thus establishing a phosphorylation event for maintaining CaMKII activity in the face of protein turnover.”
§ Synaptic memory and CaMKII > 10. CaMKII AND PROTEIN TURNOVER
What the sources say
- Supportedcites [406] source
The Results and discussion section reports Thr 286 phosphorylation in subunits of previously unactivated holoenzymes mixed with constitutively active CaMKII. It also describes experiments without Ca2+/CaM; the Introduction says the resulting spread of activation provides a mechanism for maintaining active CaMKII despite protein turnover. The paper presents that maintenance as a proposed mechanism, not a direct test of protein turnover. (LLM, conf=0.90)
boosteddirect- Asserted: passes — The authors put it forward as true.
- Checkable: passes — It can be checked against evidence.
- Load-bearing: passes — The paper’s conclusions depend on it.
- Based: passes — The paper gives a reason why it holds.
It may state two separate claims as one.
- Supported
The cited sources support only part of this claim — read each source’s verdict below.
In the paper
“This subunit exchange process requires CaMKII activation and is initiated after phosphorylation of T305/T306 in the CaM footprint, which blocks rebinding of CaM and frees the CaM-binding element to interact with the hub of the holoenzyme (407).”
§ Synaptic memory and CaMKII > 10. CaMKII AND PROTEIN TURNOVER
What the sources say
- Partly supportedcites [407] sourceExperimental — accuracy not yet measured
The Introduction says phosphorylation of Thr 305/306 prevents Ca2+/CaM rebinding, and the Results and discussion describe activation-triggered exchange and a model in which the freed CaM-binding element interacts with the hub (pages not provided). But the paper says Thr 305/306 phosphorylation potentiates exchange; it does not establish that exchange must be initiated after that phosphorylation. (LLM, conf=0.84)
plaindirect- Asserted: passes — The authors put it forward as true.
- Checkable: passes — It can be checked against evidence.
- Load-bearing: passes — The paper’s conclusions depend on it.
- Based: passes — The paper gives a reason why it holds.
It may state two separate claims as one.
- Partly supported
The cited sources support only part of this claim — read each source’s verdict below.
In the paper
“Remaining to be demonstrated, if this mechanism is to propagate CaMKII activity, is that an inactive holoenzyme can be phosphorylated on T286 in the absence of Ca2+/CaM. This is what was demonstrated in the studies claiming to exhibit subunit exchange (406).”
§ Synaptic memory and CaMKII > 10. CaMKII AND PROTEIN TURNOVER
What the sources say
- Partly supportedcites [406] sourceExperimental — accuracy not yet measured
The Results and discussion section (Figure 5B; page unavailable) reports T286 phosphorylation in previously unactivated wild-type CaMKII mixed with active CaMKIIT286D. But the Figure 5 caption says the mixing experiments used wild-type CaMKII in the presence of Ca2+/CaM and ATP, so they do not demonstrate phosphorylation in its absence. (LLM, conf=0.89)
boosteddirect- Asserted: fails — The authors may not put it forward as true.
- Checkable: passes — It can be checked against evidence.
- Load-bearing: passes — The paper’s conclusions depend on it.
- Based: passes — The paper gives a reason why it holds.
Probably not a substantial claim. The authors may not put it forward as true.
- Partly supported
The cited sources support only part of this claim — read each source’s verdict below.
In the paper
“These in turn increase autophosphorylation of T286 (or T287 in some isoforms) that further increases constitutive activity (429, 430).”
§ Synaptic memory and CaMKII > 12. HUMAN GENETIC MUTATIONS IN CaMKII
What the sources say
- Partly supportedcites [429] sourceExperimental — accuracy not yet measured
The “Mutations in CAMK2” section reports increased Thr286 autophosphorylation for two CAMK2A variants, and the Discussion says Thr286 autophosphorylation makes CAMK2A autonomously active (page numbers unavailable). But the paper describes heterogeneous effects: other variants reduce phosphorylation, and the constitutively active Thr286Pro variant cannot be phosphorylated at Thr286. The claim therefore overgeneralizes the mechanism to these mutations as a group. (LLM, conf=0.88)
- Partly supportedcites [430] sourceExperimental — accuracy not yet measured
The Results section reports increased Thr286/Thr287 phosphorylation in three mutants, although two increases were not statistically significant and no phosphorylation signal was observed for a fourth. The Discussion proposes that the variants may increase autophosphorylation and thereby increase Ca²⁺-independent activity; the citing sentence presents that proposed chain as established for the mutations. (LLM, conf=0.86)
plaindirect- Asserted: passes — The authors put it forward as true.
- Checkable: passes — It can be checked against evidence.
- Load-bearing: unclear — It is unclear whether the paper’s conclusions depend on it.
- Based: passes — The paper gives a reason why it holds.
It may state two separate claims as one.
- Partly supported
The cited sources support only part of this claim — read each source’s verdict below.
In the paper
“Several dozen human mutations in CaMKII have been identified, and their molecular characteristics support many of the biochemical behaviors of CaMKII described above.”
§ Synaptic memory and CaMKII > 12. HUMAN GENETIC MUTATIONS IN CaMKII
What the sources say
- Partly supportedcites [428] sourceExperimental — accuracy not yet measured
The Introduction and Discussion describe biochemical effects of the human CAMK2A E183V mutation, including reduced kinase activity and altered protein interactions. The paper does not establish that several dozen human CaMKII mutations have been identified or characterize their molecular effects as a group; the Discussion instead focuses on one mutation. No page numbers are available in our copy. (LLM, conf=0.88)
- Partly supportedcites [429] sourceExperimental — accuracy not yet measured
The Distribution of the Variants section reports 19 distinct CAMK2A or CAMK2B variants in 24 people, not several dozen distinct mutations. The Mutations in CAMK2 section reports that variants alter autophosphorylation, supporting the point that their molecular characteristics bear on CaMKII biochemical behavior. The cited paper therefore supports the substance of the biochemical point but not the stated count. (LLM, conf=0.88)
- Partly supportedcites [430] sourceExperimental — accuracy not yet measured
The Discussion reports five de novo CAMK2A/CAMK2B variants identified in this study, not several dozen. The Results link some of those variants to reduced autoinhibition and increased Thr286/Thr287 autophosphorylation, supporting the claim that human variants illuminate CaMKII biochemistry, but not its stated number or breadth. Page numbers are unavailable in our copy. (LLM, conf=0.88)
plaincorrelational- Asserted: passes — The authors put it forward as true.
- Checkable: passes — It can be checked against evidence.
- Load-bearing: unclear — It is unclear whether the paper’s conclusions depend on it.
- Based: passes — The paper gives a reason why it holds.
It may state two separate claims as one.
- Partly supported
Every source the paper cites for this claim was checked and supports it.
In the paper
“Consistent with a surface groove accommodating both substrates and anchoring proteins, it also exhibits reduced interactions with GluN2B and other interacting proteins.”
§ Synaptic memory and CaMKII > 12. HUMAN GENETIC MUTATIONS IN CaMKII
What the sources say
- Supportedcites [428] source
The Results section (page unavailable) reports that CaMKIIα-E183V significantly reduced binding to GluN2B and several other CaMKII-associated proteins compared with wild type. The surface-groove language frames the citing authors’ interpretation; the attributed finding about reduced interactions is supported. (LLM, conf=0.91)
plaindirect- Asserted: passes — The authors put it forward as true.
- Checkable: passes — It can be checked against evidence.
- Load-bearing: unclear — It is unclear whether the paper’s conclusions depend on it.
- Based: passes — The paper gives a reason why it holds.
It may state two separate claims as one.
- Supported
The cited sources support only part of this claim — read each source’s verdict below.
In the paper
“Most of these molecules are in the pallium, just beneath the core of the PSD and not close enough to be bound to GluN2B (139).”
§ Synaptic memory and CaMKII > 13. CONCLUSIONS > 13.2. Reorganization of PSD during LTP
What the sources say
- Partly supportedcites [139] sourceExperimental — accuracy not yet measured
The Results describe CaMKII labeling as concentrated particularly in the PSD pallium under stimulation. The Discussion says CaMKII molecules in the distal pallium are too far from NR2B (GluN2B) in the PSD core to bind it directly. It does not establish that most CaMKII molecules are too far away; it also reports labeling in the core. (LLM, conf=0.86)
plain- Asserted: passes — The authors put it forward as true.
- Checkable: passes — It can be checked against evidence.
- Load-bearing: passes — The paper’s conclusions depend on it.
- Based: passes — The paper gives a reason why it holds.
It may state two separate claims as one.
- Partly supported
The cited sources support only part of this claim — read each source’s verdict below.
In the paper
“The number of NMDARs at spine synapses and perhaps filopodia synapses is much less variable, averaging roughly 20, and this number is largely independent of PSD size (143, 438, 439).”
§ Synaptic memory and CaMKII > 13. CONCLUSIONS > 13.2. Reorganization of PSD during LTP
What the sources say
- Partly supportedcites [143] sourceExperimental — accuracy not yet measured
The Analysis of AMPAR- and NMDAR-Type Structures by EM Tomography reports 23 ± 5 NMDAR-type structures in controls, nearly constant across PSD sizes; the Discussion estimates 20–30 per PSD. The study examined spine synapses, but our copy does not establish that the same pattern holds at filopodia synapses, even tentatively. (LLM, conf=0.86)
- Not checked — no full text of the sourcecites [438] source
- Not checked — no full text of the sourcecites [439] source
hedged- Asserted: passes — The authors put it forward as true.
- Checkable: passes — It can be checked against evidence.
- Load-bearing: passes — The paper’s conclusions depend on it.
- Based: passes — The paper gives a reason why it holds.
It may state two separate claims as one.
- Partly supported
Every source the paper cites for this claim was checked and supports it.
In the paper
“Expression of the mutant in neurons decreases spine density and synaptic transmission.”
§ Synaptic memory and CaMKII > 12. HUMAN GENETIC MUTATIONS IN CaMKII
What the sources say
- Supportedcites [428] source
The spine-density results report significantly fewer dendritic spines in cultured hippocampal neurons expressing CaMKIIα-E183V. The synaptic-transmission results report reduced AMPAR-mediated mEPSC frequency and conclude that the mutation disrupts synaptic transmission. (LLM, conf=0.94)
plaindirect- Asserted: passes — The authors put it forward as true.
- Checkable: passes — It can be checked against evidence.
- Load-bearing: unclear — It is unclear whether the paper’s conclusions depend on it.
- Based: passes — The paper gives a reason why it holds.
It may state two separate claims as one.
- Supported
Every source the paper cites for this claim was checked and supports it.
In the paper
“The mutation is in the autoregulatory segment, and it is likely that the disruption of its conformation by the presence of a proline reduces autoinhibition and produces increased autonomy that has a gain-of-function effect in the cytosol (432).”
§ Synaptic memory and CaMKII > 12. HUMAN GENETIC MUTATIONS IN CaMKII
What the sources say
- Supportedcites [432] source
The Results locate p.Arg292Pro in the α-helical autoregulatory domain and report increased kinase activity. The Discussion proposes that the proline substitution disrupts autoinhibition, producing constitutive activity; the Results also describe gain-of-function effects in an exclusively cytosolic CAMK2GArg292Pro isoform. The claim preserves the paper’s uncertainty about the proposed mechanism. (LLM, conf=0.90)
hedgedconditional- Asserted: passes — The authors put it forward as true.
- Checkable: passes — It can be checked against evidence.
- Load-bearing: passes — The paper’s conclusions depend on it.
- Based: passes — The paper gives a reason why it holds.
It may state two separate claims as one.
- Supported
The cited sources support only part of this claim — read each source’s verdict below.
In the paper
“The number of AMPARs at dendritic spine synapses is highly variable but averages roughly 50 (143, 438, 439), and this number strongly correlates with the size of the PSD.”
§ Synaptic memory and CaMKII > 13. CONCLUSIONS > 13.2. Reorganization of PSD during LTP
What the sources say
- Partly supportedcites [143] sourceExperimental — accuracy not yet measured
The Analysis of AMPAR- and NMDAR-Type Structures by EM Tomography reports a strong positive correlation between AMPAR-type structure count and PSD diameter (r = 0.87; Fig. 6A). It estimates 105 ± 52 AMPARs in an average-size PSD, not an average of roughly 50. Page numbers were not supplied for these passages. (LLM, conf=0.90)
- Not checked — no full text of the sourcecites [438] source
- Not checked — no full text of the sourcecites [439] source
boostedcorrelational- Asserted: passes — The authors put it forward as true.
- Checkable: passes — It can be checked against evidence.
- Load-bearing: unclear — It is unclear whether the paper’s conclusions depend on it.
- Based: passes — The paper gives a reason why it holds.
It may state two separate claims as one.
- Partly supported
Every source the paper cites for this claim was checked and supports it.
In the paper
“The finding that strong hyperpolarization before the plateau potential blunts the potentiation (103) favors the former but does not rule out the latter.”
§ Synaptic memory and CaMKII > 11. CaMKII AND HIPPOCAMPAL PLACE FIELDS
What the sources say
- Supportedcites [103] source
The citation is attached to the finding about hyperpolarization, not to the citing authors’ subsequent comparison of mechanisms. In Results, under “Dependence on initial Vm vs. initial synaptic weights,” the paper reports that strong hyperpolarization just before plateau initiation decreased synaptic potentiation (Figure 4—figure supplement 2). (LLM, conf=0.92)
hedgedconditional- Asserted: passes — The authors put it forward as true.
- Checkable: passes — It can be checked against evidence.
- Load-bearing: passes — The paper’s conclusions depend on it.
- Based: passes — The paper gives a reason why it holds.
It may state two separate claims as one.
- Supported
Every source the paper cites for this claim was checked and supports it.
In the paper
“Although there is no change in the number of PSD-95 molecules (56), saturating LTP results in a two- to threefold enhancement of the AMPAR EPSC, as does the expression of constitutively active CaMKII.”
§ Synaptic memory and CaMKII > 13. CONCLUSIONS > 13.2. Reorganization of PSD during LTP
What the sources say
- Supportedcites [56] source
The Results section reports that the amount of PSD-95 did not persistently change for up to 30 minutes after LTP induction. Citation (56) is attached to the PSD-95 statement, not to the subsequent claim about the magnitude of AMPAR EPSC enhancement or constitutively active CaMKII. (LLM, conf=0.92)
plaindirect- Asserted: passes — The authors put it forward as true.
- Checkable: passes — It can be checked against evidence.
- Load-bearing: passes — The paper’s conclusions depend on it.
- Based: passes — The paper gives a reason why it holds.
It may state two separate claims as one.
- Supported
The cited sources support only part of this claim — read each source’s verdict below.
In the paper
“However, blocking actin remodeling blocks both sLTP (247) and LTP (310).”
§ Synaptic memory and CaMKII > 13. CONCLUSIONS > 13.2. Reorganization of PSD during LTP
What the sources say
- Supportedcites [247] source
The citation to Matsuzaki et al. is attached to the sLTP part of the sentence; the LTP part has a separate citation. The passage on pharmacological effects (labeled Abstract in our copy) reports that latrunculin A, an inhibitor of actin polymerization, blocked long-lasting spine enlargement. (LLM, conf=0.93)
- Partly supportedcites [310] sourceExperimental — accuracy not yet measured
Citation 310 is attached to the LTP portion of the sentence; the separate sLTP citation is not assessed here. In “LTP induction is inhibited by actin polymerization inhibitors” (page unavailable), latrunculin B reduced LTP, but potentiation remained at 113% versus 160% in controls. The source supports inhibition of LTP, not its complete blockade. (LLM, conf=0.88)
plaindirect- Asserted: passes — The authors put it forward as true.
- Checkable: passes — It can be checked against evidence.
- Load-bearing: passes — The paper’s conclusions depend on it.
- Based: passes — The paper gives a reason why it holds.
It may state two separate claims as one.
- Supported
The sources with a verdict support this claim; the rest weren’t checked yet, have no full text we could read, or their verdicts aren’t rated yet.
In the paper
“Actin is largely excluded from the core of the PSD (66, 322), and evidence suggests that, at least for the first hour, the changes in spine size are not accompanied by changes in the size of the PSD (56).”
§ Synaptic memory and CaMKII > 13. CONCLUSIONS > 13.2. Reorganization of PSD during LTP
What the sources say
- Not checked — no full text of the sourcecites [66] source
- Could not verifycites [322] sourceExperimental — accuracy not yet measured
The Introduction describes the PSD as containing cytoskeletal components, but does not say whether actin is excluded from its core. The Results measure spine head width, not PSD size or changes during the first hour. Searches for both points found no passage in our copy that addresses them. (LLM, conf=0.72)
- Supportedcites [56] source
The Results section on PSD area reports that the PSD remained structurally uncoupled from spine enlargement during the first 30 minutes after sLTP. The late-phase Results report no change in PSD scaffolding proteins for the first 45 minutes, with an increase beginning around 60 minutes. This supports the cited, hedged statement about the first hour; the citation is attached to the PSD-size clause, not the separate actin claim. Page numbers are unavailable in our copy. (LLM, conf=0.90)
hedged- Asserted: passes — The authors put it forward as true.
- Checkable: passes — It can be checked against evidence.
- Load-bearing: passes — The paper’s conclusions depend on it.
- Based: passes — The paper gives a reason why it holds.
It may state two separate claims as one.
The cited sources support only part of this claim — read each source’s verdict below.
In the paper
“The number of NMDARs does not change, since constitutively active CaMKII does not affect the NMDAR EPSC (130–132) and LTP is expressed primarily on the AMPAR (19).”
§ Synaptic memory and CaMKII > 13. CONCLUSIONS > 13.2. Reorganization of PSD during LTP
What the sources say
- Not checked — no full text of the sourcecites [130] source
- Partly supportedcites [131] sourceExperimental — accuracy not yet measured
The Results (Figure 2) report that constitutively active αCaMKII increased AMPAR EPSCs without a significant change in NMDAR EPSCs. The paper does not establish from that measurement that the number of NMDARs remains unchanged during LTP. The separate statement about LTP being expressed primarily on AMPARs is cited to another source in the printed sentence. (LLM, conf=0.85)
- Not checked — no full text of the sourcecites [132] source
- Not checked — no full text of the sourcecites [19] source
plain- Asserted: passes — The authors put it forward as true.
- Checkable: passes — It can be checked against evidence.
- Load-bearing: passes — The paper’s conclusions depend on it.
- Based: passes — The paper gives a reason why it holds.
It may state two separate claims as one.
The cited sources support only part of this claim — read each source’s verdict below.
In the paper
“The recent work from Kuriyan and collaborators (406) nicely fulfills this second requirement, although there may be an alternative mechanism of interholoenzyme phosphorylation (81).”
§ Synaptic memory and CaMKII > 13. CONCLUSIONS > 13.3. CaMKII and Information Storage
What the sources say
- Supportedcites [406] source
The Results and discussion section, under “Activated CaMKII can exchange subunits with holoenzyme assemblies that have not been activated, leading to a spread of activation,” reports exchange between activated and unactivated CaMKII and phosphorylation of previously unactivated subunits. This supports the claim attributed to Kuriyan and collaborators. The possible alternative mechanism is attached to a different citation, so it is not part of this verdict. (LLM, conf=0.91)
- Not matchedcites [81]
Couldn’t be matched to a paper in Crossref, so it can’t be checked.
hedged- Asserted: passes — The authors put it forward as true.
- Checkable: passes — It can be checked against evidence.
- Load-bearing: passes — The paper’s conclusions depend on it.
- Based: passes — The paper gives a reason why it holds.
It may state two separate claims as one.
- Supported
The sources with a verdict support this claim; the rest weren’t checked yet, have no full text we could read, or their verdicts aren’t rated yet.
In the paper
“Parallel to the electrophysiological changes during LTP is an enlargement of the spine and a widening of the spine neck (247, 248).”
§ Synaptic memory and CaMKII > 13. CONCLUSIONS > 13.2. Reorganization of PSD during LTP
What the sources say
- Not checked yetcites [247] source
Checked before — its earlier verdict is held back until a new check runs.
- Supportedcites [248] source
The LTP section (pp. 10–11) reports increased uncaging-evoked postsynaptic currents after LTP induction, alongside spine-head enlargement and sustained spine-neck widening. Figure 6 (p. 22) clarifies that electrophysiological and morphological changes were measured in separate sets of neurons. (LLM, conf=0.93)
plaincorrelational- Asserted: passes — The authors put it forward as true.
- Checkable: passes — It can be checked against evidence.
- Load-bearing: passes — The paper’s conclusions depend on it.
- Based: passes — The paper gives a reason why it holds.
It may state two separate claims as one.
- Not checked yet
Every source the paper cites for this claim was checked and supports it.
In the paper
“Most intriguingly, this orchestrates a phase-in-phase condensation of AMPAR/TARPs, PSD-95, and neuroligin1, largely independent of phosphorylation, although T286 phosphorylation is required for the maintenance of the condensates.”
§ Synaptic memory and CaMKII > 13. CONCLUSIONS > 13.2. Reorganization of PSD during LTP
What the sources say
- Supportedcites [323] source
The ‘Segregation of AMPAR and NMDAR’ section reports a CaMKII-dependent phase-in-phase assembly involving Stargazin (an AMPAR proxy) and PSD-95; the ‘NLGN co-segregates together with AMPAR’ section places neuroligin-1 in the inner phase with them. The former section says assembly does not require kinase activity or T286 phosphorylation, but persistence after Ca²⁺ decreases requires T286 autophosphorylation. Page numbers are not provided in our copy. (LLM, conf=0.94)
plaindirect- Asserted: passes — The authors put it forward as true.
- Checkable: passes — It can be checked against evidence.
- Load-bearing: passes — The paper’s conclusions depend on it.
- Based: passes — The paper gives a reason why it holds.
It may state two separate claims as one.
- Supported
The paper states this without a source or data behind it here, so there is nothing to check it against. The quote shows it is in the paper.
In the paper
“myr-CN27 and myr-AIP lack this nonspecific effect, since the depression of AMPAR EPSCs is not accompanied by any change in the NMDAR EPSC, thus ruling out any nonspecific presynaptic action.”
§ Synaptic memory and CaMKII > 8. SYNAPTIC TRANSMISSION IS MAINTAINED BY THE CONSTITUTIVE ACTION OF CaMKII > 8.1. Application of CaMKII Inhibitors Reduces Synaptic Transmission
plain- Asserted: passes — The authors put it forward as true.
- Checkable: passes — It can be checked against evidence.
- Load-bearing: passes — The paper’s conclusions depend on it.
- Based: passes — The paper gives a reason why it holds.
It may state two separate claims as one.
A result the paper reports from its own data — it cites no other source for it, so there is none to check. The quote shows it is in the paper.
In the paper
“The synaptic transmission in cells lacking CaMKII was ∼50% of that of the control cells, consistent with a maintenance role of CaMKII.”
§ Synaptic memory and CaMKII > 8. SYNAPTIC TRANSMISSION IS MAINTAINED BY THE CONSTITUTIVE ACTION OF CaMKII > 8.1. Application of CaMKII Inhibitors Reduces Synaptic Transmission
plaindirect- Asserted: passes — The authors put it forward as true.
- Checkable: passes — It can be checked against evidence.
- Load-bearing: passes — The paper’s conclusions depend on it.
- Based: passes — The paper gives a reason why it holds.
It may state two separate claims as one.
A result the paper reports from its own data — it cites no other source for it, so there is none to check. The quote shows it is in the paper.
In the paper
“After LTP stabilized, myr-CN27 was applied. LTP was fully reversed and the responses converged with the responses in the control pathway, which, as expected, were reduced by ∼50%.”
§ Synaptic memory and CaMKII > 9. CaMKII AND THE MAINTENANCE OF LTP > 9.1. CaMKII Inhibitors Erase LTP
plaindirect- Asserted: passes — The authors put it forward as true.
- Checkable: passes — It can be checked against evidence.
- Load-bearing: passes — The paper’s conclusions depend on it.
- Based: passes — The paper gives a reason why it holds.
It may state two separate claims as one.
A claim is checked only against the cited paper’s full text, never its abstract, and none is available for its sources.
In the paper
“First, it has been reported that LTP is often accompanied by a depression in neighboring nontetanized synapses (372, 373), which would tend to renormalize excitatory drive onto the neuron.”
§ Synaptic memory and CaMKII > 8. SYNAPTIC TRANSMISSION IS MAINTAINED BY THE CONSTITUTIVE ACTION OF CaMKII > 8.3. Experimental Manipulations of Constitutive CaMKII and LTP Mirror One Another
What the sources say
hedgedcorrelational- Asserted: passes — The authors put it forward as true.
- Checkable: passes — It can be checked against evidence.
- Load-bearing: passes — The paper’s conclusions depend on it.
- Based: passes — The paper gives a reason why it holds.
It may state two separate claims as one.
The paper states this without a source or data behind it here, so there is nothing to check it against. The quote shows it is in the paper.
In the paper
“First, does isolated CaMKII (unphosphorylated) in the absence of Ca2+/CaM have any intrinsic activity? As discussed in sect. 2.1 this is most unlikely.”
§ Synaptic memory and CaMKII > 8. SYNAPTIC TRANSMISSION IS MAINTAINED BY THE CONSTITUTIVE ACTION OF CaMKII > 8.2. Origin of Constitutive CaMKII Activity
hedged- Asserted: passes — The authors put it forward as true.
- Checkable: passes — It can be checked against evidence.
- Load-bearing: passes — The paper’s conclusions depend on it.
- Based: fails — The paper may give no reason why it holds.
Probably not a substantial claim. The paper may give no reason why it holds.
A claim is checked only against the cited paper’s full text, never its abstract, and none is available for its sources.
In the paper
“A further complication for either of these possibilities is that it appears that the subunit being phosphorylated apparently would need to have Ca2+/CaM bound, i.e., it does not significantly occur on inactive subunits (13, 15, 82, 83, 406).”
§ Synaptic memory and CaMKII > 10. CaMKII AND PROTEIN TURNOVER
What the sources say
hedgedconditional- Asserted: passes — The authors put it forward as true.
- Checkable: passes — It can be checked against evidence.
- Load-bearing: passes — The paper’s conclusions depend on it.
- Based: passes — The paper gives a reason why it holds.
It may state two separate claims as one.
The paper states this without a source or data behind it here, so there is nothing to check it against. The quote shows it is in the paper.
In the paper
“As discussed in sect. 3, NMDARs are highly permeable to Ca2+ and it is the rise in intracellular Ca2+ that provides the trigger for LTP.”
§ Synaptic memory and CaMKII > 2. LONG-TERM POTENTIATION: THE BASICS > 2.1. LTP: Induction
plaindirect- Asserted: passes — The authors put it forward as true.
- Checkable: passes — It can be checked against evidence.
- Load-bearing: passes — The paper’s conclusions depend on it.
- Based: passes — The paper gives a reason why it holds.
It may state two separate claims as one.
The paper states this without a source or data behind it here, so there is nothing to check it against. The quote shows it is in the paper.
In the paper
“The reason for this is that the NMDAR ion channel is blocked by the binding of Mg2+ to the external side of the receptor at normal cellular resting potentials.”
- Also stated in: § 2.1. LTP: Induction · plain
“During the depolarization caused by a tetanus (or direct depolarization of the membrane by current injection through the recording electrode) the Mg2+ ion is electrostatically driven from its binding site, relieving the channel block.”
§ Synaptic memory and CaMKII > 2. LONG-TERM POTENTIATION: THE BASICS > 2.1. LTP: Induction
plaindirect- Asserted: passes — The authors put it forward as true.
- Checkable: passes — It can be checked against evidence.
- Load-bearing: passes — The paper’s conclusions depend on it.
- Based: passes — The paper gives a reason why it holds.
It may state two separate claims as one.
- Also stated in: § 2.1. LTP: Induction · plain
The paper states this without a source or data behind it here, so there is nothing to check it against. The quote shows it is in the paper.
In the paper
“It is well accepted that CaMKII is required for the induction of NMDAR-dependent LTP”
§ Synaptic memory and CaMKII > 2. LONG-TERM POTENTIATION: THE BASICS > 2.3. LTP: Maintenance
boosteddirect- Asserted: passes — The authors put it forward as true.
- Checkable: passes — It can be checked against evidence.
- Load-bearing: fails — The paper’s conclusions may not depend on it.
- Based: fails — The paper may give no reason why it holds.
Probably not a substantial claim. The paper’s conclusions may not depend on it. The paper may give no reason why it holds.
In the paper
“It is well established that NMDAR-dependent and NMDAR-independent forms of LTP exist at different types of synapses [e.g., NMDAR-independent LTP at hippocampal mossy fiber synapses (48)].”
§ Synaptic memory and CaMKII > 2. LONG-TERM POTENTIATION: THE BASICS > 2.3. LTP: Maintenance
What the sources say
- Not checked — no full text of the sourcecites [48] source
boostedcorrelational- Asserted: passes — The authors put it forward as true.
- Checkable: passes — It can be checked against evidence.
- Load-bearing: fails — The paper’s conclusions may not depend on it.
- Based: passes — The paper gives a reason why it holds.
Probably not a substantial claim. The paper’s conclusions may not depend on it.
The paper states this without a source or data behind it here, so there is nothing to check it against. The quote shows it is in the paper.
In the paper
“The action of displacing the autoinhibitory domain also exposes and helps to present T286 to a different active subunit that autophosphorylates it.”
§ Synaptic memory and CaMKII > 3. CaMKII: STRUCTURE AND REGULATION
plaindirect- Asserted: passes — The authors put it forward as true.
- Checkable: passes — It can be checked against evidence.
- Load-bearing: passes — The paper’s conclusions depend on it.
- Based: passes — The paper gives a reason why it holds.
It may state two separate claims as one.
None of the sources cited for this claim have been checked yet.
In the paper
“The autoinhibitory segment serves to strongly inhibit the kinase by locking it in a conformation that is not optimal for its phosphotransferase activity, reducing affinity for ATP, occluding substrates from the active site, and constraining binding of CaM to an incomplete binding site in the regulatory segment (FIGURE 2B2).”
§ Synaptic memory and CaMKII > 3. CaMKII: STRUCTURE AND REGULATION
boosteddirect- Asserted: passes — The authors put it forward as true.
- Checkable: passes — It can be checked against evidence.
- Load-bearing: passes — The paper’s conclusions depend on it.
- Based: passes — The paper gives a reason why it holds.
It may state two separate claims as one.
In the paper
“Activation is also curtailed by insufficient cellular free CaM for all its binding proteins, since a significant fraction of CaM is membrane bound and not available in the cytosol, and the relatively low affinity of unphosphorylated CaMKII for the free Ca2+/CaM (95).”
§ Synaptic memory and CaMKII > 3. CaMKII: STRUCTURE AND REGULATION > 3.1. CaMKII and Integration of Ca2+ Stimuli
What the sources say
- Not checked — no full text of the sourcecites [95] source
plaindirect- Asserted: passes — The authors put it forward as true.
- Checkable: passes — It can be checked against evidence.
- Load-bearing: passes — The paper’s conclusions depend on it.
- Based: passes — The paper gives a reason why it holds.
It may state two separate claims as one.
In the paper
“However, T305A/T306A mutations increase CaMKII levels in PSDs and lower the threshold for LTP (87).”
§ Synaptic memory and CaMKII > 3. CaMKII: STRUCTURE AND REGULATION
What the sources say
- Not checked — no full text of the sourcecites [87] source
plaindirect- Asserted: passes — The authors put it forward as true.
- Checkable: passes — It can be checked against evidence.
- Load-bearing: unclear — It is unclear whether the paper’s conclusions depend on it.
- Based: passes — The paper gives a reason why it holds.
It may state two separate claims as one.
A conclusion the paper draws from its own results — it cites no other source for it, so there is none to check. The quote shows it is in the paper.
In the paper
“The comparisons with T286A make it clear that autophosphorylation of T286 enables both a fuller activation of CaMKII during a stimulus train and a persistence of that activity even after the Ca2+ level returns to baseline.”
§ Synaptic memory and CaMKII > 3. CaMKII: STRUCTURE AND REGULATION > 3.1. CaMKII and Integration of Ca2+ Stimuli
boosteddirect- Asserted: passes — The authors put it forward as true.
- Checkable: passes — It can be checked against evidence.
- Load-bearing: passes — The paper’s conclusions depend on it.
- Based: passes — The paper gives a reason why it holds.
It may state two separate claims as one.
- The authors state this as an assumption: During a brief Ca2+ spike there is only time for a fraction of a dodecamer to be occupied and activated by Ca2+/CaM.
A conclusion the paper draws from its own results — it cites no other source for it, so there is none to check. The quote shows it is in the paper.
In the paper
“the finding that the binding of CaMKII to GluN2B is essential for its synaptic action (see sect. 6) and constitutive activity of CaMKII-GluN2B toward substrates suggests that either S1303 is not phosphorylated in the GluN2B-CaMKII complex or phospho-S1303 does not significantly prevent binding or inhibit activity.”
§ Synaptic memory and CaMKII > 3. CaMKII: STRUCTURE AND REGULATION > 3.3. Impact of NMDAR Binding to CaMKII
hedgedconditional- Asserted: passes — The authors put it forward as true.
- Checkable: passes — It can be checked against evidence.
- Load-bearing: passes — The paper’s conclusions depend on it.
- Based: passes — The paper gives a reason why it holds.
It may state two separate claims as one.
A conclusion the paper draws from its own results — it cites no other source for it, so there is none to check. The quote shows it is in the paper.
In the paper
“Given the high concentration of CaMKII at the synapse, one can anticipate that one effect of autophosphorylation, with the consequent increase in CaM affinity, is that CaMKII may suppress activation of other CaM-dependent enzyme by competing for Ca2+/CaM.”
§ Synaptic memory and CaMKII > 3. CaMKII: STRUCTURE AND REGULATION > 3.2. Ca2+ Sensitivity of CaMKII
hedgedconditional- Asserted: passes — The authors put it forward as true.
- Checkable: passes — It can be checked against evidence.
- Load-bearing: fails — The paper’s conclusions may not depend on it.
- Based: passes — The paper gives a reason why it holds.
Probably not a substantial claim. The paper’s conclusions may not depend on it.
A conclusion the paper draws from its own results — it cites no other source for it, so there is none to check. The quote shows it is in the paper.
In the paper
“This further highlights the central role of the NMDAR in plasticity: not only as a trigger of the plasticity via its Ca2+ permeability but as a scaffold that is required to sustain the plasticity.”
§ Synaptic memory and CaMKII > 3. CaMKII: STRUCTURE AND REGULATION > 3.3. Impact of NMDAR Binding to CaMKII
plaindirect- Asserted: passes — The authors put it forward as true.
- Checkable: passes — It can be checked against evidence.
- Load-bearing: passes — The paper’s conclusions depend on it.
- Based: passes — The paper gives a reason why it holds.
It may state two separate claims as one.
The paper states this without a source or data behind it here, so there is nothing to check it against. The quote shows it is in the paper.
In the paper
“CaMKII is not competitive for the limiting Ca2+/CaM in its basal state but markedly increases its affinity as it becomes autophosphorylated.”
§ Synaptic memory and CaMKII > 3. CaMKII: STRUCTURE AND REGULATION > 3.2. Ca2+ Sensitivity of CaMKII
plaindirect- Asserted: passes — The authors put it forward as true.
- Checkable: passes — It can be checked against evidence.
- Load-bearing: passes — The paper’s conclusions depend on it.
- Based: unclear — It is unclear why the paper says it holds.
It may state two separate claims as one.
A conclusion the paper draws from its own results — it cites no other source for it, so there is none to check. The quote shows it is in the paper.
In the paper
“The interaction is therefore critical both for maintaining the active state as well as for localizing CaMKII to the PSD, and therefore for LTP.”
§ Synaptic memory and CaMKII > 3. CaMKII: STRUCTURE AND REGULATION > 3.3. Impact of NMDAR Binding to CaMKII
plaindirect- Asserted: passes — The authors put it forward as true.
- Checkable: passes — It can be checked against evidence.
- Load-bearing: passes — The paper’s conclusions depend on it.
- Based: passes — The paper gives a reason why it holds.
It may state two separate claims as one.
A conclusion the paper draws from its own results — it cites no other source for it, so there is none to check. The quote shows it is in the paper.
In the paper
“considerable evidence suggests that this phenomenon is not simply aggregation and may be important physiologically.”
§ Synaptic memory and CaMKII > 3. CaMKII: STRUCTURE AND REGULATION > 3.4. Self-Association of CaMKII
hedgedconditional- Asserted: passes — The authors put it forward as true.
- Checkable: passes — It can be checked against evidence.
- Load-bearing: passes — The paper’s conclusions depend on it.
- Based: passes — The paper gives a reason why it holds.
It may state two separate claims as one.
A conclusion the paper draws from its own results — it cites no other source for it, so there is none to check. The quote shows it is in the paper.
In the paper
“The major conclusion is that CaMKII has low intrinsic activity in the basal state and only achieves significant activity following induction of LTP and the NMDA-mediated Ca2+ influx.”
§ Synaptic memory and CaMKII > 3. CaMKII: STRUCTURE AND REGULATION > 3.2. Ca2+ Sensitivity of CaMKII
plaindirect- Asserted: passes — The authors put it forward as true.
- Checkable: passes — It can be checked against evidence.
- Load-bearing: passes — The paper’s conclusions depend on it.
- Based: passes — The paper gives a reason why it holds.
It may state two separate claims as one.
The paper states this without a source or data behind it here, so there is nothing to check it against. The quote shows it is in the paper.
In the paper
“CaM is less abundant than the sum total of its interacting proteins, so there is, in essence, a competition for CaM.”
§ Synaptic memory and CaMKII > 3. CaMKII: STRUCTURE AND REGULATION > 3.2. Ca2+ Sensitivity of CaMKII
plaindirect- Asserted: passes — The authors put it forward as true.
- Checkable: passes — It can be checked against evidence.
- Load-bearing: unclear — It is unclear whether the paper’s conclusions depend on it.
- Based: passes — The paper gives a reason why it holds.
It may state two separate claims as one.
A conclusion the paper draws from its own results — it cites no other source for it, so there is none to check. The quote shows it is in the paper.
In the paper
“For the CTD peptide to directly produce a constitutive kinase, one needs to propose that one end of the GluN2B CTD may function as a wedge at the T site to block reassociation of the autoinhibitory segment while its other end is not tightly bound to the active S site so that substrates can bind.”
§ Synaptic memory and CaMKII > 3. CaMKII: STRUCTURE AND REGULATION > 3.3. Impact of NMDAR Binding to CaMKII
hedgedconditional- Asserted: fails — The authors may not put it forward as true.
- Checkable: passes — It can be checked against evidence.
- Load-bearing: fails — The paper’s conclusions may not depend on it.
- Based: fails — The paper may give no reason why it holds.
Probably not a substantial claim. The authors may not put it forward as true. The paper’s conclusions may not depend on it. The paper may give no reason why it holds. It may state two separate claims as one.
A claim is checked only against the cited paper’s full text, never its abstract, and none is available for its sources.
In the paper
“Finally, CaMKIIα but not CaMKIIβ supports a structural function of CaMKII in translocation of proteasomes to synaptic sites (160) and clustering of CaMKII holoenzymes in response to low pH (133).”
§ Synaptic memory and CaMKII > 3. CaMKII: STRUCTURE AND REGULATION > 3.6. Comparison of CaMKIIα and CaMKIIβ
What the sources say
plaindirect- Asserted: passes — The authors put it forward as true.
- Checkable: passes — It can be checked against evidence.
- Load-bearing: unclear — It is unclear whether the paper’s conclusions depend on it.
- Based: passes — The paper gives a reason why it holds.
It may state two separate claims as one.
In the paper
“This clustering is reversible, but in the presence of phosphatase inhibitors it is longer lasting (141).”
§ Synaptic memory and CaMKII > 3. CaMKII: STRUCTURE AND REGULATION > 3.4. Self-Association of CaMKII
What the sources say
- Not checked — no full text of the sourcecites [141] source
plaindirect- Asserted: passes — The authors put it forward as true.
- Checkable: passes — It can be checked against evidence.
- Load-bearing: unclear — It is unclear whether the paper’s conclusions depend on it.
- Based: passes — The paper gives a reason why it holds.
It may state two separate claims as one.
In the paper
“It occurs with CaMKIIα but not with CaMKIIβ (133).”
§ Synaptic memory and CaMKII > 3. CaMKII: STRUCTURE AND REGULATION > 3.4. Self-Association of CaMKII
What the sources say
- Not checked — no full text of the sourcecites [133] source
plain- Asserted: passes — The authors put it forward as true.
- Checkable: passes — It can be checked against evidence.
- Load-bearing: unclear — It is unclear whether the paper’s conclusions depend on it.
- Based: passes — The paper gives a reason why it holds.
It may state two separate claims as one.
A conclusion the paper draws from its own results — it cites no other source for it, so there is none to check. The quote shows it is in the paper.
In the paper
“might suggest that much of the constitutive activity at the PSD following translocation is due to the NMDAR and not T286P.”
§ Synaptic memory and CaMKII > 3. CaMKII: STRUCTURE AND REGULATION > 3.4. Self-Association of CaMKII
hedgedconditional- Asserted: passes — The authors put it forward as true.
- Checkable: passes — It can be checked against evidence.
- Load-bearing: fails — The paper’s conclusions may not depend on it.
- Based: passes — The paper gives a reason why it holds.
Probably not a substantial claim. The paper’s conclusions may not depend on it.
In the paper
“clustering is inhibited by regulatory segment-derived peptides, e.g., AC-3 and AIP that bind at the T site, but is not inhibited by even high levels of syntide-2, which only binds at the catalytic or S site (133).”
§ Synaptic memory and CaMKII > 3. CaMKII: STRUCTURE AND REGULATION > 3.4. Self-Association of CaMKII
What the sources say
- Not checked — no full text of the sourcecites [133] source
plaindirect- Asserted: passes — The authors put it forward as true.
- Checkable: passes — It can be checked against evidence.
- Load-bearing: passes — The paper’s conclusions depend on it.
- Based: passes — The paper gives a reason why it holds.
It may state two separate claims as one.
The paper states this without a source or data behind it here, so there is nothing to check it against. The quote shows it is in the paper.
In the paper
“There are four CaMKII isoforms, but the α- and β-isoforms are the most abundant isoforms in brain.”
§ Synaptic memory and CaMKII > 3. CaMKII: STRUCTURE AND REGULATION > 3.6. Comparison of CaMKIIα and CaMKIIβ
plain- Asserted: passes — The authors put it forward as true.
- Checkable: passes — It can be checked against evidence.
- Load-bearing: fails — The paper’s conclusions may not depend on it.
- Based: passes — The paper gives a reason why it holds.
Probably not a substantial claim. The paper’s conclusions may not depend on it. It may state two separate claims as one.
A conclusion the paper draws from its own results — it cites no other source for it, so there is none to check. The quote shows it is in the paper.
In the paper
“might suggest that translocation is accounted for by such direct holoenzyme-NMDAR interactions.”
§ Synaptic memory and CaMKII > 3. CaMKII: STRUCTURE AND REGULATION > 3.4. Self-Association of CaMKII
hedgedconditional- Asserted: passes — The authors put it forward as true.
- Checkable: passes — It can be checked against evidence.
- Load-bearing: fails — The paper’s conclusions may not depend on it.
- Based: passes — The paper gives a reason why it holds.
Probably not a substantial claim. The paper’s conclusions may not depend on it.
A conclusion the paper draws from its own results — it cites no other source for it, so there is none to check. The quote shows it is in the paper.
In the paper
“This also suggests a correlation between structural features necessary for phase separation and for LTP, consistent with a role of phase separation in LTP.”
§ Synaptic memory and CaMKII > 3. CaMKII: STRUCTURE AND REGULATION > 3.6. Comparison of CaMKIIα and CaMKIIβ
hedgedcorrelational- Asserted: passes — The authors put it forward as true.
- Checkable: passes — It can be checked against evidence.
- Load-bearing: passes — The paper’s conclusions depend on it.
- Based: passes — The paper gives a reason why it holds.
It may state two separate claims as one.
The paper states this without a source or data behind it here, so there is nothing to check it against. The quote shows it is in the paper.
In the paper
“Several Ca2+-dependent protein kinases are expressed in hippocampal neurons [e.g., PKA (via adenylyl cyclase subtypes 1 and 8), PKC, CaMKII].”
§ Synaptic memory and CaMKII > 5. CaMKII AND THE INDUCTION OF LTP > 5.1. CaMKII and Necessity
plain- Asserted: passes — The authors put it forward as true.
- Checkable: passes — It can be checked against evidence.
- Load-bearing: fails — The paper’s conclusions may not depend on it.
- Based: passes — The paper gives a reason why it holds.
Probably not a substantial claim. The paper’s conclusions may not depend on it.
In the paper
“The added requirement may be that holoenzymes bound to GluN2B also need to bind each other and form clusters, as this is a property of CaMKIIα but not of CaMKIIβ (133).”
§ Synaptic memory and CaMKII > 3. CaMKII: STRUCTURE AND REGULATION > 3.6. Comparison of CaMKIIα and CaMKIIβ
What the sources say
- Not checked — no full text of the sourcecites [133] source
hedgedconditional- Asserted: passes — The authors put it forward as true.
- Checkable: passes — It can be checked against evidence.
- Load-bearing: passes — The paper’s conclusions depend on it.
- Based: passes — The paper gives a reason why it holds.
Probably not a substantial claim. It may state two separate claims as one.
In the paper
“The failure of CaMKIIβ to phase separate could be rescued by swapping its long hub linker with the shorter linker from CaMKIIα, and this chimera fully rescued LTP.”
§ Synaptic memory and CaMKII > 3. CaMKII: STRUCTURE AND REGULATION > 3.6. Comparison of CaMKIIα and CaMKIIβ
What the sources say
- Not checked — no full text of the sourcecites [122] source
hedgeddirect- Asserted: passes — The authors put it forward as true.
- Checkable: passes — It can be checked against evidence.
- Load-bearing: passes — The paper’s conclusions depend on it.
- Based: passes — The paper gives a reason why it holds.
It may state two separate claims as one.
In the paper
“robust LTP was recorded in pathway 1 (0 mV), but no LTP was recorded in pathway 2 (+70 mV).”
§ Synaptic memory and CaMKII > 4. Ca2+ AND LTP > 4.1. Postsynaptic Ca2+ and Necessity
What the sources say
- Not checked — no full text of the sourcecites [178] source
plainSingle case- Asserted: passes — The authors put it forward as true.
- Checkable: passes — It can be checked against evidence.
- Load-bearing: passes — The paper’s conclusions depend on it.
- Based: passes — The paper gives a reason why it holds.
It may state two separate claims as one.
A conclusion the paper draws from its own results — it cites no other source for it, so there is none to check. The quote shows it is in the paper.
In the paper
“Pure α is fully functional because it is not sequestered by F-actin.”
§ Synaptic memory and CaMKII > 3. CaMKII: STRUCTURE AND REGULATION > 3.6. Comparison of CaMKIIα and CaMKIIβ
plaindirect- Asserted: passes — The authors put it forward as true.
- Checkable: passes — It can be checked against evidence.
- Load-bearing: passes — The paper’s conclusions depend on it.
- Based: passes — The paper gives a reason why it holds.
It may state two separate claims as one.
A conclusion the paper draws from its own results — it cites no other source for it, so there is none to check. The quote shows it is in the paper.
In the paper
“These experiments demonstrate that Ca2+ entry through the NMDAR is indeed not only necessary but instructive for LTP.”
§ Synaptic memory and CaMKII > 4. Ca2+ AND LTP > 4.1. Postsynaptic Ca2+ and Necessity
boosteddirectSingle case- Asserted: passes — The authors put it forward as true.
- Checkable: passes — It can be checked against evidence.
- Load-bearing: passes — The paper’s conclusions depend on it.
- Based: passes — The paper gives a reason why it holds.
It may state two separate claims as one.
A claim is checked only against the cited paper’s full text, never its abstract, and none is available for its sources.
In the paper
“VPP does not occlude with LTP (189, 192), strongly implying a mechanism distinct from LTP.”
§ Synaptic memory and CaMKII > 4. Ca2+ AND LTP > 4.2. Postsynaptic Ca2+ and Sufficiency
What the sources say
boosted- Asserted: passes — The authors put it forward as true.
- Checkable: passes — It can be checked against evidence.
- Load-bearing: passes — The paper’s conclusions depend on it.
- Based: passes — The paper gives a reason why it holds.
It may state two separate claims as one.
In the paper
“loading postsynaptic cells with the Ca2+ chelator EGTA blocked LTP (176), suggesting that Ca2+ is necessary for LTP.”
§ Synaptic memory and CaMKII > 4. Ca2+ AND LTP > 4.1. Postsynaptic Ca2+ and Necessity
What the sources say
- Not checked — no full text of the sourcecites [176] source
hedgeddirect- Asserted: passes — The authors put it forward as true.
- Checkable: passes — It can be checked against evidence.
- Load-bearing: passes — The paper’s conclusions depend on it.
- Based: passes — The paper gives a reason why it holds.
It may state two separate claims as one.
In the paper
“when the intracellular electrode contained a Ca2+ chelator no LTP occurred in the individual cell, while normal LTP was recorded from the field electrode”
§ Synaptic memory and CaMKII > 4. Ca2+ AND LTP > 4.1. Postsynaptic Ca2+ and Necessity
What the sources say
- Not checked — no full text of the sourcecites [177] source
plaindirect- Asserted: passes — The authors put it forward as true.
- Checkable: passes — It can be checked against evidence.
- Load-bearing: passes — The paper’s conclusions depend on it.
- Based: passes — The paper gives a reason why it holds.
It may state two separate claims as one.
The paper states this without a source or data behind it here, so there is nothing to check it against. The quote shows it is in the paper.
In the paper
“Third, these recordings were made 48 h after transfection.”
§ Synaptic memory and CaMKII > 5. CaMKII AND THE INDUCTION OF LTP > 5.2. CaMKII and Sufficiency
plain- Asserted: passes — The authors put it forward as true.
- Checkable: passes — It can be checked against evidence.
- Load-bearing: passes — The paper’s conclusions depend on it.
- Based: passes — The paper gives a reason why it holds.
Probably not a substantial claim.
A conclusion the paper draws from its own results — it cites no other source for it, so there is none to check. The quote shows it is in the paper.
In the paper
“The NMDA-induced translocation of CaMKII to the spine/PSD is dramatic, in large excess to the number of NMDARs in the PSD (∼20–30 NMDARs) (see sects. 3.3 and 13.2); thus only a small fraction of the CaMKII holoenzymes recruited to the PSD can be directly bound to GluN2B.”
§ Synaptic memory and CaMKII > 6. CaMKII BINDING TO NMDARs
plaindirect- Asserted: passes — The authors put it forward as true.
- Checkable: passes — It can be checked against evidence.
- Load-bearing: passes — The paper’s conclusions depend on it.
- Based: passes — The paper gives a reason why it holds.
It may state two separate claims as one.
A conclusion the paper draws from its own results — it cites no other source for it, so there is none to check. The quote shows it is in the paper.
In the paper
“This finding indicates that even after tens of hours CaMKII has no effect on presynaptic transmitter release, since there is no change in the NMDAR response.”
§ Synaptic memory and CaMKII > 5. CaMKII AND THE INDUCTION OF LTP > 5.2. CaMKII and Sufficiency
hedged- Asserted: passes — The authors put it forward as true.
- Checkable: passes — It can be checked against evidence.
- Load-bearing: passes — The paper’s conclusions depend on it.
- Based: passes — The paper gives a reason why it holds.
It may state two separate claims as one.
In the paper
“A third approach takes advantage of a point mutation of CaMKII (I205K), which prevents binding to GluN2B but otherwise reported to function normally (78)”
§ Synaptic memory and CaMKII > 6. CaMKII BINDING TO NMDARs
What the sources say
- Not checked — no full text of the sourcecites [78] source
plaindirect- Asserted: passes — The authors put it forward as true.
- Checkable: passes — It can be checked against evidence.
- Load-bearing: passes — The paper’s conclusions depend on it.
- Based: passes — The paper gives a reason why it holds.
It may state two separate claims as one.
A conclusion the paper draws from its own results — it cites no other source for it, so there is none to check. The quote shows it is in the paper.
In the paper
“they suggest that CaMKII fully accounts for the effects of the rise in Ca2+ and that there is no need to postulate a CaMKII-independent parallel Ca2+ signaling pathway requirement for LTP.”
§ Synaptic memory and CaMKII > 5. CaMKII AND THE INDUCTION OF LTP > 5.2. CaMKII and Sufficiency
hedgeddirect- Asserted: passes — The authors put it forward as true.
- Checkable: passes — It can be checked against evidence.
- Load-bearing: passes — The paper’s conclusions depend on it.
- Based: passes — The paper gives a reason why it holds.
It may state two separate claims as one.
A conclusion the paper draws from its own results — it cites no other source for it, so there is none to check. The quote shows it is in the paper.
In the paper
“The above findings indicate that CaMKII both qualitatively and quantitatively precisely mimics LTP and that LTP and CaMKII occlude one another.”
§ Synaptic memory and CaMKII > 5. CaMKII AND THE INDUCTION OF LTP > 5.2. CaMKII and Sufficiency
hedgeddirect- Asserted: passes — The authors put it forward as true.
- Checkable: passes — It can be checked against evidence.
- Load-bearing: passes — The paper’s conclusions depend on it.
- Based: passes — The paper gives a reason why it holds.
It may state two separate claims as one.
A conclusion the paper draws from its own results — it cites no other source for it, so there is none to check. The quote shows it is in the paper.
In the paper
“the studies summarized in this section demonstrate the essential role of CaMKII in the induction of LTP. They say nothing about the maintenance of LTP.”
§ Synaptic memory and CaMKII > 5. CaMKII AND THE INDUCTION OF LTP > 5.2. CaMKII and Sufficiency
boosteddirect- Asserted: passes — The authors put it forward as true.
- Checkable: passes — It can be checked against evidence.
- Load-bearing: passes — The paper’s conclusions depend on it.
- Based: passes — The paper gives a reason why it holds.
Probably not a substantial claim. It may state two separate claims as one.
In the paper
“The naive control pathway showed a robust enhancement, whereas the response on the pathway expressing LTP was greatly diminished.”
§ Synaptic memory and CaMKII > 5. CaMKII AND THE INDUCTION OF LTP > 5.2. CaMKII and Sufficiency
What the sources say
- Not checked — no full text of the sourcecites [199] source
plaindirect- Asserted: passes — The authors put it forward as true.
- Checkable: passes — It can be checked against evidence.
- Load-bearing: passes — The paper’s conclusions depend on it.
- Based: passes — The paper gives a reason why it holds.
It may state two separate claims as one.
In the paper
“The phosphorylation-induced dissociation of SynGAP from the PSD-95 is proposed to free up PDZ domains, creating slots for AMPARs/TARPs (302).”
§ Synaptic memory and CaMKII > 7. CaMKII AND THE EXPRESSION OF LTP (CaMKII TARGETS) > 7.4. PSD-centric Model
What the sources say
- Not checked — no full text of the sourcecites [302] source
hedgeddirect- Asserted: passes — The authors put it forward as true.
- Checkable: passes — It can be checked against evidence.
- Load-bearing: passes — The paper’s conclusions depend on it.
- Based: passes — The paper gives a reason why it holds.
Probably not a substantial claim.
A conclusion the paper draws from its own results — it cites no other source for it, so there is none to check. The quote shows it is in the paper.
In the paper
“However, a critical component of this model is the proposed competition between SynGAP and TARP binding to PDZ1/PDZ2 that is unresolved.”
§ Synaptic memory and CaMKII > 7. CaMKII AND THE EXPRESSION OF LTP (CaMKII TARGETS) > 7.4. PSD-centric Model
plain- Asserted: passes — The authors put it forward as true.
- Checkable: passes — It can be checked against evidence.
- Load-bearing: passes — The paper’s conclusions depend on it.
- Based: passes — The paper gives a reason why it holds.
Probably not a substantial claim.
A conclusion the paper draws from its own results — it cites no other source for it, so there is none to check. The quote shows it is in the paper.
In the paper
“These results suggest that, although the direct phosphorylation of GluA1 by CaMKII may play a modulatory role in LTP, it is not essential.”
§ Synaptic memory and CaMKII > 7. CaMKII AND THE EXPRESSION OF LTP (CaMKII TARGETS) > 7.3. Receptor-centric Model
hedgedconditional- Asserted: passes — The authors put it forward as true.
- Checkable: passes — It can be checked against evidence.
- Load-bearing: passes — The paper’s conclusions depend on it.
- Based: passes — The paper gives a reason why it holds.
It may state two separate claims as one.
A conclusion the paper draws from its own results — it cites no other source for it, so there is none to check. The quote shows it is in the paper.
In the paper
“In summary, although still a matter of debate, the evidence suggests that neither the CTD of AMPARs nor TARPs are likely to be the essential direct downstream target of CaMKII in LTP.”
§ Synaptic memory and CaMKII > 7. CaMKII AND THE EXPRESSION OF LTP (CaMKII TARGETS) > 7.3. Receptor-centric Model
hedged- Asserted: passes — The authors put it forward as true.
- Checkable: passes — It can be checked against evidence.
- Load-bearing: passes — The paper’s conclusions depend on it.
- Based: passes — The paper gives a reason why it holds.
It may state two separate claims as one.
A conclusion the paper draws from its own results — it cites no other source for it, so there is none to check. The quote shows it is in the paper.
In the paper
“In this scenario the autophosphorylation functions to make the docking site for GluN2B persistently available and the CaMKII-GluN2B complex would serve as a hub for further protein complex assembly.”
§ Synaptic memory and CaMKII > 7. CaMKII AND THE EXPRESSION OF LTP (CaMKII TARGETS) > 7.4. PSD-centric Model
hedgeddirect- Asserted: passes — The authors put it forward as true.
- Checkable: passes — It can be checked against evidence.
- Load-bearing: passes — The paper’s conclusions depend on it.
- Based: passes — The paper gives a reason why it holds.
It may state two separate claims as one.
In the paper
“In the binding study, no autophosphorylation is necessary; the transient CaMKII-GluN2B complex transitions into a persistent form that remains constitutively active.”
§ Synaptic memory and CaMKII > 7. CaMKII AND THE EXPRESSION OF LTP (CaMKII TARGETS) > 7.4. PSD-centric Model
What the sources say
- Not checked — no full text of the sourcecites [78] source
plaindirect- Asserted: passes — The authors put it forward as true.
- Checkable: passes — It can be checked against evidence.
- Load-bearing: passes — The paper’s conclusions depend on it.
- Based: passes — The paper gives a reason why it holds.
It may state two separate claims as one.
In the paper
“As we explore mechanisms for recruiting AMPARs to the synapse it will be important to consider that LLPS may be a general mechanism for assembly of PSDs and that changes in protein expression or phosphorylation can effect a desired change in synaptic strength via modulation of phase separation in the PSD (301).”
§ Synaptic memory and CaMKII > 7. CaMKII AND THE EXPRESSION OF LTP (CaMKII TARGETS) > 7.4. PSD-centric Model
What the sources say
- Not checked — no full text of the sourcecites [301] source
hedgedconditional- Asserted: passes — The authors put it forward as true.
- Checkable: passes — It can be checked against evidence.
- Load-bearing: passes — The paper’s conclusions depend on it.
- Based: passes — The paper gives a reason why it holds.
It may state two separate claims as one.
The paper states this without a source or data behind it here, so there is nothing to check it against. The quote shows it is in the paper.
In the paper
“Since CaMKII is sufficient for LTP, it predicts that CaMKII activation initiates the exocytosis, but this has yet to be demonstrated.”
§ Synaptic memory and CaMKII > 7. CaMKII AND THE EXPRESSION OF LTP (CaMKII TARGETS) > 7.6. Summary
plaindirect- Asserted: passes — The authors put it forward as true.
- Checkable: passes — It can be checked against evidence.
- Load-bearing: passes — The paper’s conclusions depend on it.
- Based: fails — The paper may give no reason why it holds.
Probably not a substantial claim. The paper may give no reason why it holds.
A conclusion the paper draws from its own results — it cites no other source for it, so there is none to check. The quote shows it is in the paper.
In the paper
“The evidence is compelling that CaMKII initiates a dramatic rearrangement of the cytoskeleton that is required for sLTP and most likely for LTP.”
§ Synaptic memory and CaMKII > 7. CaMKII AND THE EXPRESSION OF LTP (CaMKII TARGETS) > 7.6. Summary
boosteddirect- Asserted: passes — The authors put it forward as true.
- Checkable: passes — It can be checked against evidence.
- Load-bearing: passes — The paper’s conclusions depend on it.
- Based: unclear — It is unclear why the paper says it holds.
It may state two separate claims as one.
In the paper
“For instance, application of glutamate to somatic nucleated patches, which are devoid of excitatory synapses, generates nanoamps of AMPAR-mediated current (342), consistent with a high density of surface AMPARs.”
§ Synaptic memory and CaMKII > 7. CaMKII AND THE EXPRESSION OF LTP (CaMKII TARGETS) > 7.5. Vesicle-centric Model
What the sources say
- Not checked — no full text of the sourcecites [342] source
plaincorrelational- Asserted: passes — The authors put it forward as true.
- Checkable: passes — It can be checked against evidence.
- Load-bearing: unclear — It is unclear whether the paper’s conclusions depend on it.
- Based: passes — The paper gives a reason why it holds.
It may state two separate claims as one.
None of the sources cited for this claim have been checked yet.
In the paper
“As discussed above, early on it was shown that CaMKII is both necessary and sufficient to initiate LTP, thus solidifying their association.”
§ Synaptic memory and CaMKII > 8. SYNAPTIC TRANSMISSION IS MAINTAINED BY THE CONSTITUTIVE ACTION OF CaMKII
boosteddirect- Asserted: passes — The authors put it forward as true.
- Checkable: passes — It can be checked against evidence.
- Load-bearing: fails — The paper’s conclusions may not depend on it.
- Based: fails — The paper may give no reason why it holds.
Probably not a substantial claim. The paper’s conclusions may not depend on it. The paper may give no reason why it holds. It may state two separate claims as one.
A conclusion the paper draws from its own results — it cites no other source for it, so there is none to check. The quote shows it is in the paper.
In the paper
“Surprisingly, in most of the studies in which blocking exocytosis blocks LTP there is no decrease in basal synaptic transmission, suggesting that there are at least two distinct exocytotic pathways, one for maintaining basal transmission and one dedicated to LTP.”
§ Synaptic memory and CaMKII > 7. CaMKII AND THE EXPRESSION OF LTP (CaMKII TARGETS) > 7.5. Vesicle-centric Model
hedged- Asserted: passes — The authors put it forward as true.
- Checkable: passes — It can be checked against evidence.
- Load-bearing: passes — The paper’s conclusions depend on it.
- Based: passes — The paper gives a reason why it holds.
It may state two separate claims as one.
The paper states this without a source or data behind it here, so there is nothing to check it against. The quote shows it is in the paper.
In the paper
“In the case of the vesicle-centric model of LTP, it seems clear the LTP requires an exocytotic event.”
§ Synaptic memory and CaMKII > 7. CaMKII AND THE EXPRESSION OF LTP (CaMKII TARGETS) > 7.6. Summary
boosteddirect- Asserted: fails — The authors may not put it forward as true.
- Checkable: passes — It can be checked against evidence.
- Load-bearing: fails — The paper’s conclusions may not depend on it.
- Based: fails — The paper may give no reason why it holds.
Probably not a substantial claim. The authors may not put it forward as true. The paper’s conclusions may not depend on it. The paper may give no reason why it holds. The quote only partly states this claim.
What the paper did — it cites no source for this, so there is none to check. The quote shows it is in the paper.
In the paper
“It should be mentioned that field potential input-output curves used in many of the knockout mouse studies are not as sensitive as paired recordings from control and transfected cells used in the more recent investigations.”
§ Synaptic memory and CaMKII > 8. SYNAPTIC TRANSMISSION IS MAINTAINED BY THE CONSTITUTIVE ACTION OF CaMKII
plaincorrelational- Asserted: passes — The authors put it forward as true.
- Checkable: passes — It can be checked against evidence.
- Load-bearing: fails — The paper’s conclusions may not depend on it.
- Based: fails — The paper may give no reason why it holds.
Probably not a substantial claim. The paper’s conclusions may not depend on it. The paper may give no reason why it holds.
A conclusion the paper draws from its own results — it cites no other source for it, so there is none to check. The quote shows it is in the paper.
In the paper
“We imply in sect. 8 that the reduction in synaptic transmission following inhibition of CaMKII reflects a reversal of prior LTP.”
§ Synaptic memory and CaMKII > 9. CaMKII AND THE MAINTENANCE OF LTP
hedgeddirect- Asserted: passes — The authors put it forward as true.
- Checkable: passes — It can be checked against evidence.
- Load-bearing: passes — The paper’s conclusions depend on it.
- Based: fails — The paper may give no reason why it holds.
Probably not a substantial claim. The paper may give no reason why it holds.
A conclusion the paper draws from its own results — it cites no other source for it, so there is none to check. The quote shows it is in the paper.
In the paper
“Perhaps this homeostatic mechanism is involved in maintaining the overall level of LTP on a pyramidal cell at roughly 50%.”
§ Synaptic memory and CaMKII > 8. SYNAPTIC TRANSMISSION IS MAINTAINED BY THE CONSTITUTIVE ACTION OF CaMKII > 8.3. Experimental Manipulations of Constitutive CaMKII and LTP Mirror One Another
hedgedconditional- Asserted: fails — The authors may not put it forward as true.
- Checkable: passes — It can be checked against evidence.
- Load-bearing: fails — The paper’s conclusions may not depend on it.
- Based: fails — The paper may give no reason why it holds.
Probably not a substantial claim. The authors may not put it forward as true. The paper’s conclusions may not depend on it. The paper may give no reason why it holds.
A conclusion the paper draws from its own results — it cites no other source for it, so there is none to check. The quote shows it is in the paper.
In the paper
“As discussed above, although the initial formation of CaMKII-GluN2B condensates by Ca2+/CaM can occur without phosphorylation, kinase activity, and in particular T286 phosphorylation, is required for the persistent maintenance of the condensates in the absence of Ca2+/CaM.”
§ Synaptic memory and CaMKII > 9. CaMKII AND THE MAINTENANCE OF LTP > 9.2. CaMKII Binding to GluN2B vs. T286 Phosphorylation
plaindirect- Asserted: passes — The authors put it forward as true.
- Checkable: passes — It can be checked against evidence.
- Load-bearing: passes — The paper’s conclusions depend on it.
- Based: passes — The paper gives a reason why it holds.
It may state two separate claims as one.
A conclusion the paper draws from its own results — it cites no other source for it, so there is none to check. The quote shows it is in the paper.
In the paper
“It should be emphasized that T286 phosphorylation in maintenance allows for bidirectional plasticity in the form of LTD, in which phosphorylated T286 is an obvious target of PP1.”
§ Synaptic memory and CaMKII > 9. CaMKII AND THE MAINTENANCE OF LTP > 9.2. CaMKII Binding to GluN2B vs. T286 Phosphorylation
plaindirect- Asserted: passes — The authors put it forward as true.
- Checkable: passes — It can be checked against evidence.
- Load-bearing: passes — The paper’s conclusions depend on it.
- Based: passes — The paper gives a reason why it holds.
It may state two separate claims as one.
None of the sources cited for this claim have been checked yet.
In the paper
“The first requirement is a multimeric protein capable of intermolecular phosphorylation. As reviewed, CaMKII fully satisfies this requirement.”
§ Synaptic memory and CaMKII > 10. CaMKII AND PROTEIN TURNOVER
plain- Asserted: passes — The authors put it forward as true.
- Checkable: passes — It can be checked against evidence.
- Load-bearing: passes — The paper’s conclusions depend on it.
- Based: passes — The paper gives a reason why it holds.
It may state two separate claims as one.
A conclusion the paper draws from its own results — it cites no other source for it, so there is none to check. The quote shows it is in the paper.
In the paper
“These proposals suggest that under baseline conditions the balance between phosphorylation and dephosphorylation favors phosphorylation.”
§ Synaptic memory and CaMKII > 9. CaMKII AND THE MAINTENANCE OF LTP > 9.2. CaMKII Binding to GluN2B vs. T286 Phosphorylation
hedgeddirect- Asserted: passes — The authors put it forward as true.
- Checkable: passes — It can be checked against evidence.
- Load-bearing: passes — The paper’s conclusions depend on it.
- Based: passes — The paper gives a reason why it holds.
Probably not a substantial claim.
A conclusion the paper draws from its own results — it cites no other source for it, so there is none to check. The quote shows it is in the paper.
In the paper
“It is proposed that although autophosphorylation is not required for the formation of the CaMKII-GluN2B complex, it is critical for its stability and maintaining the potentiated state.”
§ Synaptic memory and CaMKII > 9. CaMKII AND THE MAINTENANCE OF LTP > 9.2. CaMKII Binding to GluN2B vs. T286 Phosphorylation
hedgeddirect- Asserted: passes — The authors put it forward as true.
- Checkable: passes — It can be checked against evidence.
- Load-bearing: passes — The paper’s conclusions depend on it.
- Based: passes — The paper gives a reason why it holds.
It may state two separate claims as one.
A claim is checked only against the cited paper’s full text, never its abstract, and none is available for its sources.
In the paper
“PP1 is the likely phosphatase for such a role, as it is concentrated in the PSD, whereas PP2A is abundant in the cytoplasm (64, 385, 386) and CaMKII in the PSD is preferentially dephosphorylated by PP1 (385).”
§ Synaptic memory and CaMKII > 10. CaMKII AND PROTEIN TURNOVER
What the sources say
hedgedconditional- Asserted: passes — The authors put it forward as true.
- Checkable: passes — It can be checked against evidence.
- Load-bearing: passes — The paper’s conclusions depend on it.
- Based: passes — The paper gives a reason why it holds.
It may state two separate claims as one.
A conclusion the paper draws from its own results — it cites no other source for it, so there is none to check. The quote shows it is in the paper.
In the paper
“It is likely that individual CaMKII holoenzymes can move into and out of the condensates, but as long as a net threshold level of these complexes remains the condensate persists.”
§ Synaptic memory and CaMKII > 10. CaMKII AND PROTEIN TURNOVER
hedgedconditional- Asserted: passes — The authors put it forward as true.
- Checkable: passes — It can be checked against evidence.
- Load-bearing: passes — The paper’s conclusions depend on it.
- Based: passes — The paper gives a reason why it holds.
It may state two separate claims as one.
- Rests on an assumption: For CaMKII to exert its effect it must be bound to GluN2B.
A conclusion the paper draws from its own results — it cites no other source for it, so there is none to check. The quote shows it is in the paper.
In the paper
“It should also be considered that in vivo ambient Ca2+/CaM levels, although not sufficient to significantly activate the enzyme, might allow transient binding of Ca2+/CaM that is permissive for intersubunit phosphorylation within a holoenzyme at T286.”
§ Synaptic memory and CaMKII > 10. CaMKII AND PROTEIN TURNOVER
hedgedconditional- Asserted: passes — The authors put it forward as true.
- Checkable: passes — It can be checked against evidence.
- Load-bearing: passes — The paper’s conclusions depend on it.
- Based: passes — The paper gives a reason why it holds.
Probably not a substantial claim.
A conclusion the paper draws from its own results — it cites no other source for it, so there is none to check. The quote shows it is in the paper.
In the paper
“In such a scenario, there is no need for the condensate to be recycled; it is the contents of the condensate that would turn over.”
§ Synaptic memory and CaMKII > 10. CaMKII AND PROTEIN TURNOVER
hedged- Asserted: passes — The authors put it forward as true.
- Checkable: passes — It can be checked against evidence.
- Load-bearing: passes — The paper’s conclusions depend on it.
- Based: passes — The paper gives a reason why it holds.
It may state two separate claims as one.
A conclusion the paper draws from its own results — it cites no other source for it, so there is none to check. The quote shows it is in the paper.
In the paper
“Furthermore, it seems reasonable that the CaMKII cluster will be anchored in the PSD by more than one GluN2B, in which case the turnover of NMDARs can occur while preserving the anchoring of CaMKII to the PSD.”
§ Synaptic memory and CaMKII > 10. CaMKII AND PROTEIN TURNOVER
hedgedconditional- Asserted: passes — The authors put it forward as true.
- Checkable: passes — It can be checked against evidence.
- Load-bearing: passes — The paper’s conclusions depend on it.
- Based: fails — The paper may give no reason why it holds.
Probably not a substantial claim. The paper may give no reason why it holds. It may state two separate claims as one.
- Rests on an assumption: For CaMKII to exert its effect it must be bound to GluN2B.
A conclusion the paper draws from its own results — it cites no other source for it, so there is none to check. The quote shows it is in the paper.
In the paper
“The peeling away of the regulatory domain caused by the binding of Ca2+/CaM results in the phosphorylation of T286 (FIGURE 13, 2 to 3) and the translocation of CaMKII to the PSD, where it binds to the CTD of GluN2B (FIGURE 13, 3 to 4).”
§ Synaptic memory and CaMKII > 13. CONCLUSIONS > 13.1. CaMKII and Its Activation
plaindirect- Asserted: passes — The authors put it forward as true.
- Checkable: passes — It can be checked against evidence.
- Load-bearing: passes — The paper’s conclusions depend on it.
- Based: passes — The paper gives a reason why it holds.
It may state two separate claims as one.
In the paper
“It is generally accepted that AMPARs are abundant on the extrasynaptic membrane and freely diffuse into and out of the PSD (329).”
§ Synaptic memory and CaMKII > 13. CONCLUSIONS > 13.2. Reorganization of PSD during LTP
What the sources say
- Not checked — no full text of the sourcecites [329] source
boosted- Asserted: passes — The authors put it forward as true.
- Checkable: passes — It can be checked against evidence.
- Load-bearing: unclear — It is unclear whether the paper’s conclusions depend on it.
- Based: passes — The paper gives a reason why it holds.
It may state two separate claims as one.
A conclusion the paper draws from its own results — it cites no other source for it, so there is none to check. The quote shows it is in the paper.
In the paper
“Although T286 phosphorylation is not required for CaMKII’s binding to GluN2B, it is likely that autophosphorylation would precede this binding and that the kinase would remain phosphorylated, barring a depotentiating stimulus.”
§ Synaptic memory and CaMKII > 13. CONCLUSIONS > 13.1. CaMKII and Its Activation
hedgedconditional- Asserted: passes — The authors put it forward as true.
- Checkable: passes — It can be checked against evidence.
- Load-bearing: passes — The paper’s conclusions depend on it.
- Based: passes — The paper gives a reason why it holds.
It may state two separate claims as one.
In the paper
“The number of PSD-95 molecules is roughly 200–300 (65), and the number of CaMKII holoenzymes is estimated to be roughly 80 (65).”
§ Synaptic memory and CaMKII > 13. CONCLUSIONS > 13.2. Reorganization of PSD during LTP
What the sources say
- Not checked — no full text of the sourcecites [65] source
hedged- Asserted: passes — The authors put it forward as true.
- Checkable: passes — It can be checked against evidence.
- Load-bearing: unclear — It is unclear whether the paper’s conclusions depend on it.
- Based: passes — The paper gives a reason why it holds.
It may state two separate claims as one.
A conclusion the paper draws from its own results — it cites no other source for it, so there is none to check. The quote shows it is in the paper.
In the paper
“In summary, BTSP is a homosynaptic form of LTP that requires NMDAR activation.”
§ Synaptic memory and CaMKII > 11. CaMKII AND HIPPOCAMPAL PLACE FIELDS
plaindirect- Asserted: passes — The authors put it forward as true.
- Checkable: passes — It can be checked against evidence.
- Load-bearing: passes — The paper’s conclusions depend on it.
- Based: passes — The paper gives a reason why it holds.
It may state two separate claims as one.
A conclusion the paper draws from its own results — it cites no other source for it, so there is none to check. The quote shows it is in the paper.
In the paper
“Pharmacological blockade of NMDARs blocks BTSP (FIGURE 12E), suggesting that the eligibility trace requires NMDAR activation.”
§ Synaptic memory and CaMKII > 11. CaMKII AND HIPPOCAMPAL PLACE FIELDS
hedgeddirect- Asserted: passes — The authors put it forward as true.
- Checkable: passes — It can be checked against evidence.
- Load-bearing: passes — The paper’s conclusions depend on it.
- Based: passes — The paper gives a reason why it holds.
It may state two separate claims as one.
A claim is checked only against the cited paper’s full text, never its abstract, and none is available for its sources.
In the paper
“It should be pointed out that, although it is well established that CaMKII phosphorylates numerous synaptic proteins (66, 434–437), as reviewed here, despite intensive research an essential role for CaMKII phosphorylation of many of these targets largely remains elusive.”
§ Synaptic memory and CaMKII > 13. CONCLUSIONS > 13.1. CaMKII and Its Activation
What the sources say
plain- Asserted: passes — The authors put it forward as true.
- Checkable: passes — It can be checked against evidence.
- Load-bearing: passes — The paper’s conclusions depend on it.
- Based: passes — The paper gives a reason why it holds.
It may state two separate claims as one.
A conclusion the paper draws from its own results — it cites no other source for it, so there is none to check. The quote shows it is in the paper.
In the paper
“Such a depolarization is expected to unblock some NMDAR and result in a small influx of Ca2+, which by itself would not be sufficient to alter synaptic strength.”
§ Synaptic memory and CaMKII > 11. CaMKII AND HIPPOCAMPAL PLACE FIELDS
hedgeddirect- Asserted: passes — The authors put it forward as true.
- Checkable: passes — It can be checked against evidence.
- Load-bearing: passes — The paper’s conclusions depend on it.
- Based: passes — The paper gives a reason why it holds.
It may state two separate claims as one.
A conclusion the paper draws from its own results — it cites no other source for it, so there is none to check. The quote shows it is in the paper.
In the paper
“The plateau potential would provide a sufficient rise in Ca2+ to fully activate CaMKII.”
§ Synaptic memory and CaMKII > 11. CaMKII AND HIPPOCAMPAL PLACE FIELDS
hedgeddirect- Asserted: passes — The authors put it forward as true.
- Checkable: passes — It can be checked against evidence.
- Load-bearing: passes — The paper’s conclusions depend on it.
- Based: fails — The paper may give no reason why it holds.
Probably not a substantial claim. The paper may give no reason why it holds.
A conclusion the paper draws from its own results — it cites no other source for it, so there is none to check. The quote shows it is in the paper.
In the paper
“It provides a substrate for propagating autophosphorylated CaMKII, which turns over in ∼2 wk, either through subunit exchange of inactive subunits into active holoenyzmes or by interholoenyzme phosphorylation.”
§ Synaptic memory and CaMKII > 13. CONCLUSIONS > 13.2. Reorganization of PSD during LTP
plaindirect- Asserted: passes — The authors put it forward as true.
- Checkable: passes — It can be checked against evidence.
- Load-bearing: passes — The paper’s conclusions depend on it.
- Based: unclear — It is unclear why the paper says it holds.
It may state two separate claims as one.
A conclusion the paper draws from its own results — it cites no other source for it, so there is none to check. The quote shows it is in the paper.
In the paper
“It is positioned close to the postsynaptic membrane and PSD via the tether to NMDARs and provides an excess of spare docking sites for NMDARs on the CaMKII holoenzyme network.”
§ Synaptic memory and CaMKII > 13. CONCLUSIONS > 13.2. Reorganization of PSD during LTP
plaindirect- Asserted: passes — The authors put it forward as true.
- Checkable: passes — It can be checked against evidence.
- Load-bearing: passes — The paper’s conclusions depend on it.
- Based: passes — The paper gives a reason why it holds.
It may state two separate claims as one.
A conclusion the paper draws from its own results — it cites no other source for it, so there is none to check. The quote shows it is in the paper.
In the paper
“As summarized in this review, CaMKII fulfills this requirement beautifully, and recent evidence suggests that this autonomy is responsible for maintaining LTP.”
§ Synaptic memory and CaMKII > 13. CONCLUSIONS > 13.3. CaMKII and Information Storage
hedgedconditional- Asserted: passes — The authors put it forward as true.
- Checkable: passes — It can be checked against evidence.
- Load-bearing: passes — The paper’s conclusions depend on it.
- Based: passes — The paper gives a reason why it holds.
It may state two separate claims as one.
A conclusion the paper draws from its own results — it cites no other source for it, so there is none to check. The quote shows it is in the paper.
In the paper
“Thus, bound CaMKII far outnumbers the NMDARs, indicating that the large clusters are anchored to the PSD by the minority of subunits that directly bind to the NMDARs (FIGURE 14).”
§ Synaptic memory and CaMKII > 13. CONCLUSIONS > 13.2. Reorganization of PSD during LTP
hedgeddirect- Asserted: passes — The authors put it forward as true.
- Checkable: passes — It can be checked against evidence.
- Load-bearing: passes — The paper’s conclusions depend on it.
- Based: passes — The paper gives a reason why it holds.
It may state two separate claims as one.
A claim is checked only against the cited paper’s full text, never its abstract, and none is available for its sources.
In the paper
“However, although there is considerable evidence linking LTP to behavior memory (45, 441–443), more evidence is needed to solidify this link.”
§ Synaptic memory and CaMKII > 13. CONCLUSIONS > 13.3. CaMKII and Information Storage
What the sources say
plaincorrelational- Asserted: passes — The authors put it forward as true.
- Checkable: fails — It may be too vague to check against evidence.
- Load-bearing: passes — The paper’s conclusions depend on it.
- Based: passes — The paper gives a reason why it holds.
Probably not a substantial claim. It may be too vague to check against evidence. It may state two separate claims as one.
A conclusion the paper draws from its own results — it cites no other source for it, so there is none to check. The quote shows it is in the paper.
In the paper
“Yet there are far more PSD-95 molecules in the PSD compared to AMPARs. These findings suggest that a substantial number of PSD-95 molecules are not available for capturing AMPARs.”
§ Synaptic memory and CaMKII > 13. CONCLUSIONS > 13.2. Reorganization of PSD during LTP
hedgedconditional- Asserted: passes — The authors put it forward as true.
- Checkable: passes — It can be checked against evidence.
- Load-bearing: passes — The paper’s conclusions depend on it.
- Based: passes — The paper gives a reason why it holds.
It may state two separate claims as one.
A conclusion the paper draws from its own results — it cites no other source for it, so there is none to check. The quote shows it is in the paper.
In the paper
“Activated CaMKII binds to the COOH terminus of GluN2B and is postulated to undergo self-association and promote LLPS.”
§ Synaptic memory and CaMKII > 13. CONCLUSIONS > 13.2. Reorganization of PSD during LTP
hedgedconditional- Asserted: passes — The authors put it forward as true.
- Checkable: passes — It can be checked against evidence.
- Load-bearing: passes — The paper’s conclusions depend on it.
- Based: fails — The paper may give no reason why it holds.
Probably not a substantial claim. The paper may give no reason why it holds. It may state two separate claims as one.
A conclusion the paper draws from its own results — it cites no other source for it, so there is none to check. The quote shows it is in the paper.
In the paper
“These morphological changes involve actin-based cytoskeletal remodeling (see sect. 7.4.3) and will impact both biochemical and electrical compartmentalization.”
§ Synaptic memory and CaMKII > 13. CONCLUSIONS > 13.2. Reorganization of PSD during LTP
plaindirect- Asserted: passes — The authors put it forward as true.
- Checkable: passes — It can be checked against evidence.
- Load-bearing: passes — The paper’s conclusions depend on it.
- Based: passes — The paper gives a reason why it holds.
It may state two separate claims as one.
A conclusion the paper draws from its own results — it cites no other source for it, so there is none to check. The quote shows it is in the paper.
In the paper
“It could shield the active CaMKII from phosphatases.”
§ Synaptic memory and CaMKII > 13. CONCLUSIONS > 13.2. Reorganization of PSD during LTP
hedgedconditional- Asserted: passes — The authors put it forward as true.
- Checkable: passes — It can be checked against evidence.
- Load-bearing: passes — The paper’s conclusions depend on it.
- Based: fails — The paper may give no reason why it holds.
Probably not a substantial claim. The paper may give no reason why it holds.
A conclusion the paper draws from its own results — it cites no other source for it, so there is none to check. The quote shows it is in the paper.
In the paper
“These findings might suggest a dissociation of structural and physiological LTP.”
§ Synaptic memory and CaMKII > 13. CONCLUSIONS > 13.2. Reorganization of PSD during LTP
hedged- Asserted: passes — The authors put it forward as true.
- Checkable: passes — It can be checked against evidence.
- Load-bearing: passes — The paper’s conclusions depend on it.
- Based: passes — The paper gives a reason why it holds.
Probably not a substantial claim.
A conclusion the paper draws from its own results — it cites no other source for it, so there is none to check. The quote shows it is in the paper.
In the paper
“Presumably in this LLPS reorganization, PSD-95 molecules previously not available for AMPAR/TARPs become unmasked.”
§ Synaptic memory and CaMKII > 13. CONCLUSIONS > 13.2. Reorganization of PSD during LTP
hedgedconditional- Asserted: passes — The authors put it forward as true.
- Checkable: passes — It can be checked against evidence.
- Load-bearing: fails — The paper’s conclusions may not depend on it.
- Based: fails — The paper may give no reason why it holds.
Probably not a substantial claim. The paper’s conclusions may not depend on it. The paper may give no reason why it holds.
A conclusion the paper draws from its own results — it cites no other source for it, so there is none to check. The quote shows it is in the paper.
In the paper
“The events that occur during LTP can be roughly divided into three components: 1) the formation of the CaMKII-GluN2B complex, 2) the recruitment of AMPARs, and 3) structural changes.”
§ Synaptic memory and CaMKII > 13. CONCLUSIONS > 13.2. Reorganization of PSD during LTP
plain- Asserted: passes — The authors put it forward as true.
- Checkable: passes — It can be checked against evidence.
- Load-bearing: passes — The paper’s conclusions depend on it.
- Based: passes — The paper gives a reason why it holds.
It may state two separate claims as one.
The authors state this as an assumption.
During a brief Ca2+ spike there is only time for a fraction of a dodecamer to be occupied and activated by Ca2+/CaM.
“A reasonable assumption is that during a brief Ca2+ spike there is only time for a fraction of a dodecamer to be occupied and activated by Ca2+/CaM.”
The authors state this as an assumption.
With the near-saturating pairing protocol used to induce LTP, the majority of the subunits of a holoenzyme would be phosphorylated.
“It is assumed that with the near-saturating pairing protocol used to induce LTP the majority of the subunits of a holoenzyme would be phosphorylated (see last Ca2+ pulse in FIGURE 3B2).”
The authors state this as an assumption.
With the standard saturating induction protocol used for LTP, the kinase would be highly phosphorylated, perhaps only limited by the availability of CaM.
“It is assumed that with the standard saturating induction protocol used for LTP the kinase would be highly phosphorylated, perhaps only limited by the availability of CaM.”
The authors state this as an assumption.
Native CaMKII holoenzymes are composed of a mixture of α- and β-isoforms.
“Assuming that native CaMKII holoenzymes are composed of a mixture of α- and β-isoforms”
The paper relies on this without support.
Memories can last for the entire span of an animal’s life.
“Although memories can last for the entire span of an animal’s life, most synaptic proteins generally have half-lives of 2–5 days (403, 404).”
The authors state this as an assumption.
The assembly of CaMKII holoenzymes involves transient free dimer subunits.
“Assuming that the assembly of CaMKII holoenzymes involves transient free dimer subunits, perhaps these inactive dimers could be a source for subunit exchange.”
The paper relies on this without support.
For CaMKII to exert its effect it must be bound to GluN2B.
“We know that for CaMKII to exert its effect it must be bound to GluN2B.”
Claims other papers make about this one
Each is checked against this paper’s own text: does it say what the citing paper says it does?
The source backs part of the claim, not all of it — or backs it for a different population, condition or comparison.
In the citing paper
“This interaction initiates structural rearrangements within the PSD and promotes the accumulation of AMPARs, contributing to synaptic potentiation [53].”
From Molecular Physiology of the Neuronal Synapse (2026) · cites this paper as [53]
Experimental — accuracy not yet measuredThe source backs part of the claim, not all of it — or backs it for a different population, condition or comparison.
In the citing paper
“This complex may act as a ‘tag’ that captures N-cadherin dimers to increase synapse size and release sites, providing informational stability analogous to DNA base-pairing [53,63].”
From Molecular Physiology of the Neuronal Synapse (2026) · cites this paper as [53]
Experimental — accuracy not yet measuredThe cited source says what the claim attributes to it.
In the citing paper
“Upon NMDAR activation and calcium influx, CaMKII becomes activated and translocates to the PSD, where it binds to GluN2B.”
From Molecular Physiology of the Neuronal Synapse (2026) · cites this paper as [53]
The cited source says what the claim attributes to it.
In the citing paper
“This calcium influx is the critical trigger for LTP.”
From Molecular Physiology of the Neuronal Synapse (2026) · cites this paper as [53]
The cited source says what the claim attributes to it.
In the citing paper
“NMDARs function as “coincidence detectors,” requiring both presynaptic glutamate release and sufficient postsynaptic depolarization to relieve their magnesium block and allow for calcium influx into the dendritic spine.”
From Molecular Physiology of the Neuronal Synapse (2026) · cites this paper as [53]
The cited source says what the claim attributes to it.
In the citing paper
“The induction of LTP at many central synapses, particularly in the hippocampus, is primarily dependent on the activation of NMDARs [53].”
From Molecular Physiology of the Neuronal Synapse (2026) · cites this paper as [53]
The cited source says what the claim attributes to it.
In the citing paper
“The stability of the CaMKII-GluN2B complex is proposed as a molecular switch for memory maintenance.”
From Molecular Physiology of the Neuronal Synapse (2026) · cites this paper as [53]
Self-check
Percentages, sums and reported differences re-computed from the paper’s own numbers.
Each contradiction between two passages listed here was confirmed by an independent check.
Rated minor: it would not touch a result — a value no result rests on, a p-value that stays on the same side of the significance level, or a conflict that is clerical, resolved elsewhere in the paper, or outside its own findings.
In the paper
§ Synaptic memory and CaMKII > 5. CaMKII AND THE INDUCTION OF LTP > 5.1. CaMKII and Necessity
“microelectrodes containing 1.1 mM CBP”
§ Synaptic memory and CaMKII > 5. CaMKII AND THE INDUCTION OF LTP > 5.1. CaMKII and Necessity
“(190 µM: n = 11) (open triangles)”
Rated minor: it would not touch a result — a value no result rests on, a p-value that stays on the same side of the significance level, or a conflict that is clerical, resolved elsewhere in the paper, or outside its own findings.
In the paper
§ Synaptic memory and CaMKII > References
“200. Otmakhov N, Tao-Cheng JH, Carpenter S, Asrican B, Dosemeci A, Reese TS, Lisman J. Postsynaptic inhibitors of calcium/calmodulin-dependent protein kinase type II block induction but not maintenance of pairing-induced long-term potentiation. J Neurosci 24: 9324– 9331, 2004. doi: 10.1523/JNEUROSCI.17-14-05357.1997. 15496668”
§ Synaptic memory and CaMKII > References
“217. Otmakhov N, Tao-Cheng JH, Carpenter S, Asrican B, Dosemeci A, Reese TS, Lisman J. Persistent accumulation of calcium/calmodulin-dependent protein kinase II in dendritic spines after induction of NMDA receptor-dependent chemical long-term potentiation. J Neurosci 24: 9324– 9331, 2004. doi: 10.1523/JNEUROSCI.2350-04.2004. 15496668”
Citations
Cites
Glutamate neurotoxicity and diseases of the nervous system
Choi, D. W. (1988) · Neuron · doi:10.1016/0896-6273(88)90162-6 · Cited by 8,188
Bliss, T. V. P., & Gardner-Medwin, A. R. (1973) · The Journal of Physiology · doi:10.1113/jphysiol.1973.sp010274 · Cited by 7,424
da Luz, A. C. D. D. S., Dias, G. P., Bevilaqua, M. C. D. N., Cocks, G. D., Gardino, P. F., Thuret, S., & Nardi, A. E. (2013) · Neuropsychobiology · doi:10.1159/000353269 · Cited by 4,015
Malenka, R. C., & Bear, M. F. (2004) · Neuron · doi:10.1016/j.neuron.2004.09.012 · Cited by 3,968
Morris, R. G. M., Anderson, E., Lynch, G. S., & Baudry, M. (1986) · Nature · doi:10.1038/319774a0 · Cited by 3,640 · cited 1×
“However, although there is considerable evidence linking LTP to behavior memory (45, 441 – 443), more evidence is needed to solidify this link.”
BackgroundBienenstock, E., Cooper, L., & Munro, P. (1982) · The Journal of Neuroscience · doi:10.1523/jneurosci.02-01-00032.1982 · Cited by 2,896
Mnemonic coding of visual space in the monkey's dorsolateral prefrontal cortex
Funahashi, S., Bruce, C. J., & Goldman-Rakic, P. S. (1989) · Journal of Neurophysiology · doi:10.1152/jn.1989.61.2.331 · Cited by 2,685 · cited 1×
“” There is compelling evidence that for short forms of memory, often referred to as working memory, information is stored by ongoing activity in neuronal networks (1 – 4).”
BackgroundAMPA Receptor Trafficking and Synaptic Plasticity
Malinow, R., & Malenka, R. C. (2002) · Annual Review of Neuroscience · doi:10.1146/annurev.neuro.25.112701.142758 · Cited by 2,588
Structural basis of long-term potentiation in single dendritic spines
Matsuzaki, M., Honkura, N., Ellis-Davies, G. C. R., & Kasai, H. (2004) · Nature · doi:10.1038/nature02617 · Cited by 2,483 · cited 5×
“Parallel to the electrophysiological changes during LTP is an enlargement of the spine and a widening of the spine neck (247, 248).”
BackgroundInfluentialCollingridge, G. L., Kehl, S. J., & McLennan, H. (1983) · The Journal of Physiology · doi:10.1113/jphysiol.1983.sp014478 · Cited by 2,413 · cited 1×
“The mechanism underlying these features relies on the N -methyl- D -aspartate (NMDA) type of glutamate receptor (NMDAR), which is known to be required for LTP (42).”
Background
Research works printed but not linked: 3
- Lomo T, 1966, Acta Physiol Scand, 68
- Hebb DO. Organization of Behavior . New York: Wiley, 1949.
- Mangels LA, 1990, Mol Pharmacol, 37, 820
Cited by
Sorted by citations
Excitation–transcription coupling, neuronal gene expression and synaptic plasticity
Ma, H., Khaled, H. G., Wang, X., Mandelberg, N. J., Cohen, S. M., He, X., & Tsien, R. W. (2023) · Nature reviews. Neuroscience · doi:10.1038/s41583-023-00742-5 · Cited by 84
Neuroplasticity in the transition from acute to chronic pain
Song, Q., Sihan, E., Zhang, Z., & Liang, Y. (2024) · Neurotherapeutics · doi:10.1016/j.neurot.2024.e00464 · Cited by 69
Hagena, H., & Manahan‐Vaughan, D. (2024) · Philosophical Transactions of the Royal Society B Biological Sciences · doi:10.1098/rstb.2023.0229 · Cited by 54
Neural circuits regulating visceral pain
Chang, X., Zhang, H., & Chen, S. (2024) · Communications Biology · doi:10.1038/s42003-024-06148-y · Cited by 53
Neuroplasticity in Parkinson’s disease
Popescu, B. O., Batzu, L., Ruiz, P., Tulbă, D., Moro, E., & Santens, P. (2024) · Journal of Neural Transmission · doi:10.1007/s00702-024-02813-y · Cited by 57
Metadata
- Authors
- Nicoll, R. A., & Schulman, H.
- Affiliations
- University of California, San Francisco (US)
- Stanford Medicine (US)
- Corresponding author
- Nicoll, Roger A.
- Schulman, Howard
- Venue
- Physiological Reviews
- Publisher
- American Physiological Society
- Published
- 2023-10-01
- Volume
- 103
- Issue
- 4
- Pages
- 2897-2945
- ISSN
- 0031-9333 (ISSN-L)
- 1522-1210
- PMC
- PMC10642921
- OpenAlex
- W4379791499
- Semantic Scholar
- 30be6d9c7745f99a172f05da7cde7684da8c8aed
- Cited by
- 126
- References
- 450
- Citations by year
- 2026: 34 · 2025: 55 · 2024: 33 · 2023: 4
- FWCI
- 4.98
- Type
- journal article
- Language
- en
- Open access
- hybrid
- doi.org
- Licence
- cc-by
- Locations
- Physiological Reviews (publishedVersion, cc-by)
- PubMed (publishedVersion)
- PubMed Central (submittedVersion, cc-by)
- Funders
- HHS | NIH | National Institute of Mental Health (NIH (R01MH117139))
- Topics
- Life Sciences › Neuroscience › Cellular and Molecular Neuroscience › Neuroscience and Neuropharmacology Research
- Life Sciences › Neuroscience › Cognitive Neuroscience › Memory and Neural Mechanisms
- Life Sciences › Biochemistry, Genetics and Molecular Biology › Molecular Biology › Protein Kinase Regulation and GTPase Signaling
- Keywords
- CaMKII, synaptic memory, long-term potentiation, NMDA receptor, GluN2B, autophosphorylation, postsynaptic density, liquid-liquid phase separation, PSD-95, synaptic potentiation, synaptic spines, memory reconsolidation
- MeSH terms
- Animals, Hippocampus, Learning, Memory, Long-Term Potentiation, Mice, Calcium-Calmodulin-Dependent Protein Kinase Type 2
About these checks
Registry, retraction, Cites and statistics results are computed, not judged, with one exception: a printed reference that no index lists is read once by a model before it counts as a citation error. Claims are extracted by a model and kept only when their quote appears verbatim in the text; each cited source is then checked, with a model’s help, for whether it says what the claim relies on. Those verdicts can be wrong — read the claim’s quote and the cited source before relying on one.
A language model drew the claims from the paper on 2026-10-12, under version 3 of the claim definition (model deepseek-v4.1-flash, prompt extract-v3).
A second model labelled each claim on 2026-10-12 (model jev-1.13-20260917, definition revision gold-guideline-v0.2).
Cited sources are checked with a language model’s help (gpt-6-sol).
Statistics and arithmetic are recomputed, not judged.
Confidence bands are shown only for fields calibrated on our annotated test set. None is calibrated yet, so no band is shown.
What counts as a claim ›How we measure confidence ›How we check this ›
Are you an author, or do you see a problem with this page? Request a review
